presentation h1 2014
TRANSCRIPT

Dom Development S.A.
H1 2014 Results Presentation 21 August 2014
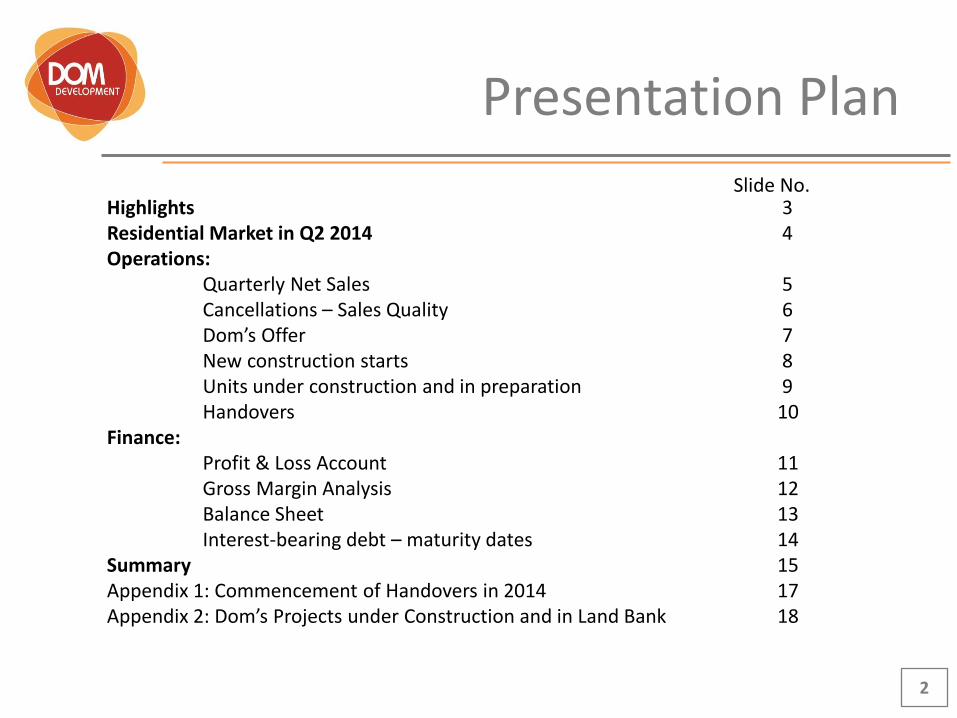
Presentation Plan
2
Highlights 3 Residential Market in Q2 2014 4 Operations: Quarterly Net Sales 5 Cancellations – Sales Quality 6 Dom’s Offer 7 New construction starts 8 Units under construction and in preparation 9 Handovers 10 Finance: Profit & Loss Account 11 Gross Margin Analysis 12 Balance Sheet 13 Interest-bearing debt – maturity dates 14 Summary 15 Appendix 1: Commencement of Handovers in 2014 17 Appendix 2: Dom’s Projects under Construction and in Land Bank 18
Slide No.

Highlights
3
Forging Onward
Sales at levels of 2006-2007 boom period
Growing margins
H1 project launches at record-high levels (over 1,300 flats)
High cash levels maintained, PLN 295m as of 30 June 2014, gearing of 15%

Residential Market in Q2 2014
4
Warsaw market sales in Q2 confirm strength of market
Low interest rates is main support for demand
High number of new launches in Q2 confirms developers confidence in the market
Warsaw Q2 closing stock offer shows supply and demand in balance
Homes for the Young – low impact on Warsaw market in Q2 due to low price limits

Quarterly Net Sales
5
361334 339
386414
466
400
463
0
50
100
150
200
250
300
350
400
450
500
Q3 2012 Q4 2012 Q1 2013 Q2 2013 Q3 2013 Q4 2013 Q1 2014 Q2 2014
No. of flats

6
8,8%9,7%
8,4%
6,1%
3,9%4,9% 5,4% 5,7%
0%
2%
4%
6%
8%
10%
12%
Q3 2012 Q4 2012 Q1 2013 Q2 2013 Q3 2013 Q4 2013 Q1 2014 Q2 2014
Developers Act in force from 29 April 2012 causing substantial increase in cancellations.
Cancellations share in gross sales
Cancellations – Sales Quality

Dom’s Offer
7
1 617 1 545 1 253
1 442 1 491 1 625
1 241
2 086
447 458
411
381 314 232
444
365
-
200
400
600
800
1 000
1 200
1 400
1 600
1 800
2 000
2 200
2 400
2 600
30/09/2012 2 064
31/12/2012 2 003
31/03/2013 1 664
30/06/2013 1 823
30/09/2013 1 805
31/12/2013 1 857
31/03/2014 1 685
30/06/2014 2 451
Units under construction Units on finished projects
No. of flats

8
163
273
393
518
218
701
297
1 020
0
200
400
600
800
1 000
1 200
Q3 2012 Q4 2012 Q1 2013 Q2 2013 Q3 2013 Q4 2013 Q1 2014 Q2 2014
New Construction Starts
2 projects 2 projects 1 project 2 projects 4 projects 3 projects 1 project 7 projects
No. of flats

Units under construction and in preparation
9
2 612 2 6762 946
2 524
3 138
6 3116 093 6 211 6 196
5 173
0
1 000
2 000
3 000
4 000
5 000
6 000
7 000
30/06/2013 30/09/2013 31/12/2013 31/03/2014 30/06/2014
Units under construction Units in preparation
No. of flats

Handovers
10
Liczba mieszkań 736
549 519
295252
496 516450
0
100
200
300
400
500
600
700
800
Q3 2012 Q4 2012 Q1 2013 Q2 2013 Q3 2013 Q4 2013 Q1 2014 Q2 2014
Flats sold but not delivered
30/06/2014
195 - units on finished projects 830 - units under construction
No. of flats

Profit & Loss Account IAS 18
Q2 2014 Q2 2013 Change H1 2014 H1 2013 Change
Sales Revenues 163.0 119.9 35.9% 361.6 340.2 6.3%
Revenue per 1 Flat Delivered (PLNk) 362.1 406.4 -10.9% 374.3 417.9 -10.4%
Gross Profit on Sales 21.1 22.7 -7.2% 53.7 78.7 -31.8%
Gross Profit Margin 12.9% 19.0% -6.0 pp 14.8% 23.1% -8.3 pp
EBITDA 3.7 2.7 39.3% 13.3 36.4 -63.5%
EBITDA Margin 2.3% 2.2% 0.1 pp 3.7% 10.7% -7.0 pp
Net Profit 1.7 1.0 64.0% 10.9 27.4 -60.0%
EPS (PLN) 0.07 0.04 63.8% 0.44 1.11 -60.0%
11 PLN m

Gross Margin Analysis
12
68,3 70,8 39,8 43,1 65,8 55,3 56,0 22,7 23,9 54,4 32,6 21,1 0%
5%
10%
15%
20%
25%
30%
35%
40%
0
10
20
30
40
50
60
70
80
Q3 2011 Q4 2011 Q1 2012 Q2 2012 Q3 2012 Q4 2012 Q1 2013 Q2 2013 Q3 2013 Q4 2013 Q1 2014 Q2 2014
Gross Profit on Sales (PLN m) Gross Profit Margin
PLN m

13
30.06.2014 30.06.2013 Change
Cash* 294.6 349.5 -15.7%
Work in Progress 1,043.8 1,011.7 3.2%
Net Interest-Bearing Debt 119.4 130.5 -8.5%
Shareholders’ Equity 813.3 829.1 -1.9%
Gearing 14.7% 15.7% -1.1 pp
Net Assets per Share (PLN) 32.83 33.51 -2.0%
Balance Sheet IAS 18
PLN m * Including cash in an escrow account

Comfortable Debt Maturity Structure
14
295
100 120
50 46
98
0
50
100
150
200
250
300
350
Cash as of30.06.2014
by 30.06.2015 by 30.06.2016 by 30.06.2017 by 30.06.2018
Unsecured Bonds Bank Loans
PLN m

Summary H1 2014 – Gathering Momentum
15
Sales and margins growing
3,138 units under construction and 2,451 available for sale at the end of Q2 2014
High cash levels and low net debt – high potential for land purchases and new starts
H1 2014 financial results in line with the consensus

Appendices

17
Project No. of Units in Project Commencement of Handovers
Q1
Derby 14 ph. 3 189 January 2014*
Młyny Królewskie 294 January 2014*
Klasyków ph. 2 236 February 2014*
Q2
Wilno I ph. 2B 124 May 2014*
Adria ph. 3 183 May 2014*
Willa na Harfowej 90 June 2014*
Q3 Saska ph. 3/3 170 August 2014*
Saska ph. 3/4 178 August 2014*
Q4
Żoliborz Artystyczny ph. 1 223 November 2014
Żoliborz Artystyczny ph. 2 152 November 2014
Derby 14/4 188 December 2014
* - Actual
Appendix 1:
Commencement of Handovers in 2014

Appendix 2:
Projects Under Construction and in Preparation as of 30/06/2014
18
TOTAL UNDER
CONSTRUCTION IN PREPARATION FINISHED
WARSAW 2 563 5 018 20 763
WROCLAW 575 155 246
DOM 3 138 5 173 21 009
PROJECT UNDER
CONSTRUCTION IN
PREPARATION
AL. PIASTÓW 171 ---
OAZA 218 ----
AURA 186 155
WROCLAW 575 155
PROJECT UNDER
CONSTRUCTION IN
PREPARATION
WILLA LINDEGO 121 ---
ŻOLIBORZ ARTYSTYCZNY 825 749
REZYDENCJA MOKOTÓW (NARUSZEWICZA)
133 ---
WŁODARZEWSKA -DRAWSKA
---- 104
GARAŻOWA ---- 326
BUKOWIŃSKA ---- 235
BUKOWIŃSKA NAD SKARPĄ
---- 207
TOTAL LEFT BANK
1 079 1 621
PROJECT UNDER
CONSTRUCTION IN PREPARATION
REGATY ---- 204
PALLADIUM (AKACJE) 245 824
KLASYKÓW --- 435
DERBY 188 ----
WILNO 317 1 316
SASKA 348 ----
APARTAMENTY SASKA NAD JEZIOREM
386 239
SASKA III --- 379
TOTAL RIGHT BANK
1 484 3 397

Dom Development S.A. endeavours to ensure that the information in the presentation in complete, up-to-date and accurate. However, we do not make any guarantees in this respect. Dom Development S.A. connot accept responsibilty for consequences of using such information, in particular any loss caused by reliance thereon for the purpose of investment decisions. The material contained in the presentation originate from reliable public sources and to the best knowledge of Dom Development S.A. may be considered reliable.
19
For further information, please contact: Magdalena Kempa Investor Relations Specialist
tel. +48 22 351 68 49 e-mail: [email protected] www.inwestor.domdevelopment.com.pl