presentation: eteam project: results of external
TRANSCRIPT

INSTITUTE OF OCCUPATIONAL MEDICINE www.iom-world.org
eteam Project:Results of external validation
exercise
Martie van Tongeren, Judith Lamb, Brian Miller,Laura MacCalman, John Cherrie

Aim of external evaluation
1. Determine whether Tier 1 tools arepredictive of measured exposures over arange of situations
2. Determine whether Tier 1 tools areconservative

Available measured data
• Range of providers
• from various countries
• covering various exposure types and agents
• inhalation exposure
• Three formats
• Individual data points (1 or more measurementfor each situation)
• Aggregate exposure data (GM, GSD) for a singlesituation (type 1)
• Aggregate exposure data (GM, GSD) across arange of situations (type 2)
• Separate comparison for each data format

Statistical analyses• Plots of tool predictions against measurements
• Individual data points against tool predictions
• AM of measurements against tool predictions
• AM of measurements against AM of tool predictions
• Ratio of the measurement data over the toolpredictions (on log-scale)
• By• Tool
• Data provider
• Exposure type
• PROC
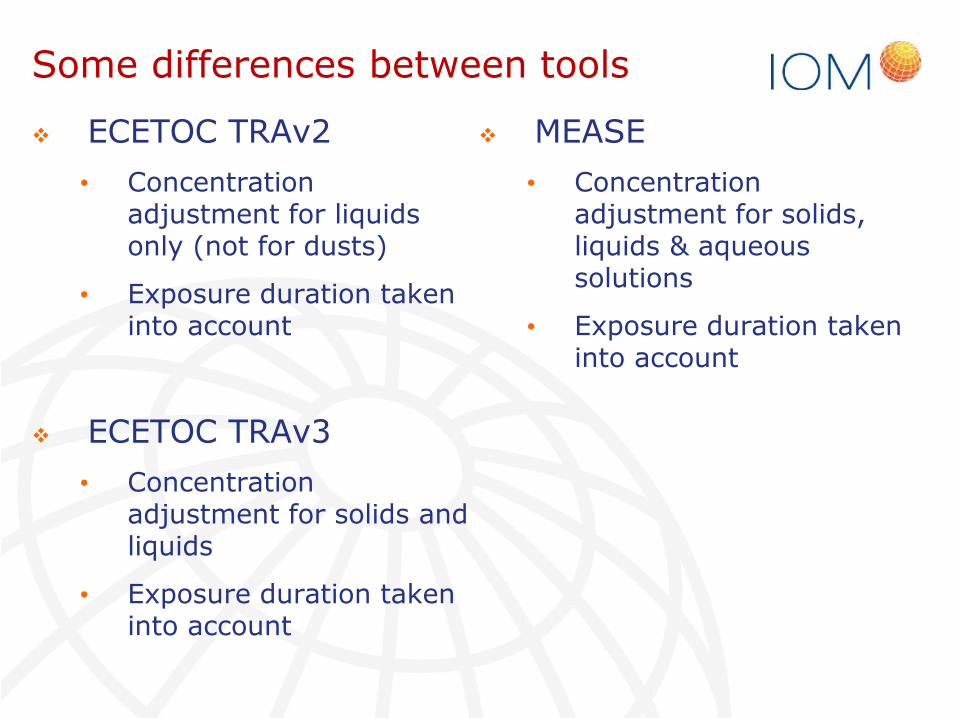
Some differences between tools
ECETOC TRAv2
• Concentrationadjustment for liquidsonly (not for dusts)
• Exposure duration takeninto account
ECETOC TRAv3
• Concentrationadjustment for solids andliquids
• Exposure duration takeninto account
MEASE
• Concentrationadjustment for solids,liquids & aqueoussolutions
• Exposure duration takeninto account

Some differences between tools
EMKG-EXPO-tool
• No concentrationadjustment
• No adjustment durationof exposure
• No option for absence ofRMMs. If none present,lowest control approachwas chosen (generalventilation)
Stoffenmanager v 4.5
• Concentration adjustmentfor liquids only (not fordust)
• No adjustment for durationof exposure
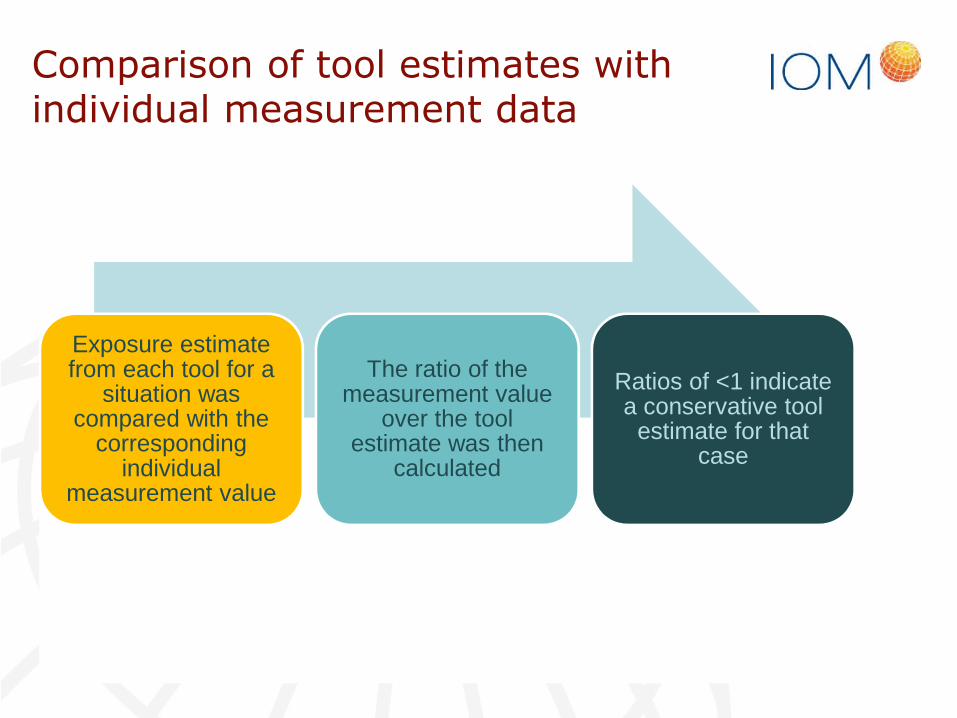
Comparison of tool estimates withindividual measurement data
Exposure estimatefrom each tool for a
situation wascompared with the
correspondingindividual
measurement value
The ratio of themeasurement value
over the toolestimate was then
calculated
Ratios of <1 indicatea conservative tool
estimate for thatcase
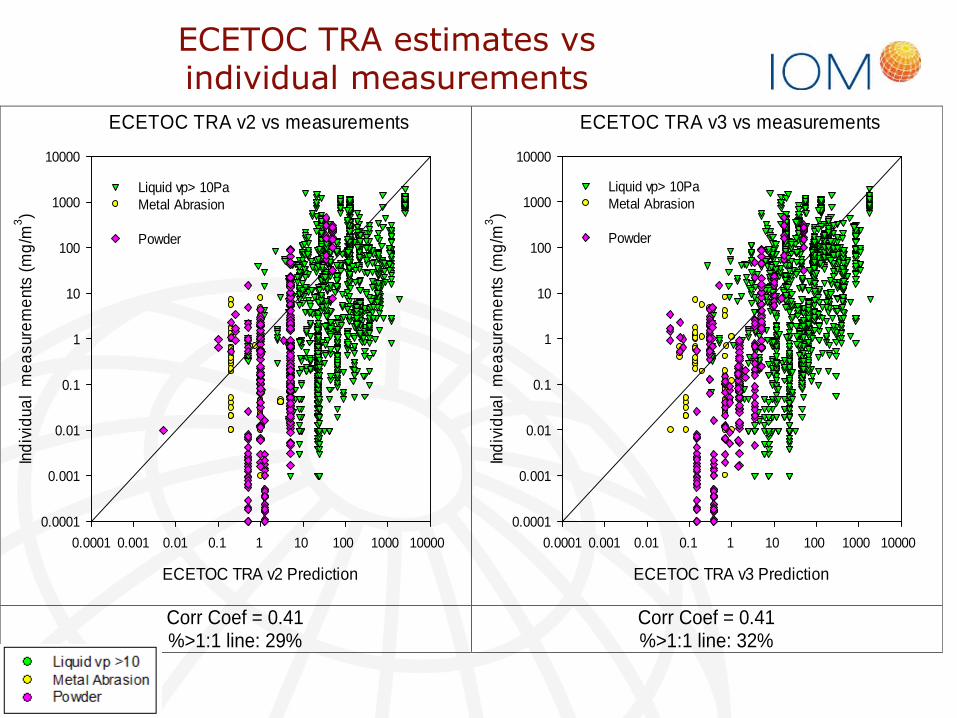
ECETOC TRA estimates vsindividual measurements
ECETOC TRA v2 vs measurements
ECETOC TRA v2 Prediction
0.0001 0.001 0.01 0.1 1 10 100 1000 10000
Ind
ivid
ua
lm
ea
sur
em
ents
(mg
/m3)
0.0001
0.001
0.01
0.1
1
10
100
1000
10000
Liquid vp> 10PaMetal Abrasion
Powder
ECETOC TRA v3 vs measurements
ECETOC TRA v3 Prediction
0.0001 0.001 0.01 0.1 1 10 100 1000 10000
Ind
ivid
ua
lm
ea
sure
me
nts
(mg
/m3)
0.0001
0.001
0.01
0.1
1
10
100
1000
10000
Liquid vp> 10PaMetal Abrasion
Powder
Corr Coef = 0.41%>1:1 line: 29%
Corr Coef = 0.41%>1:1 line: 32%
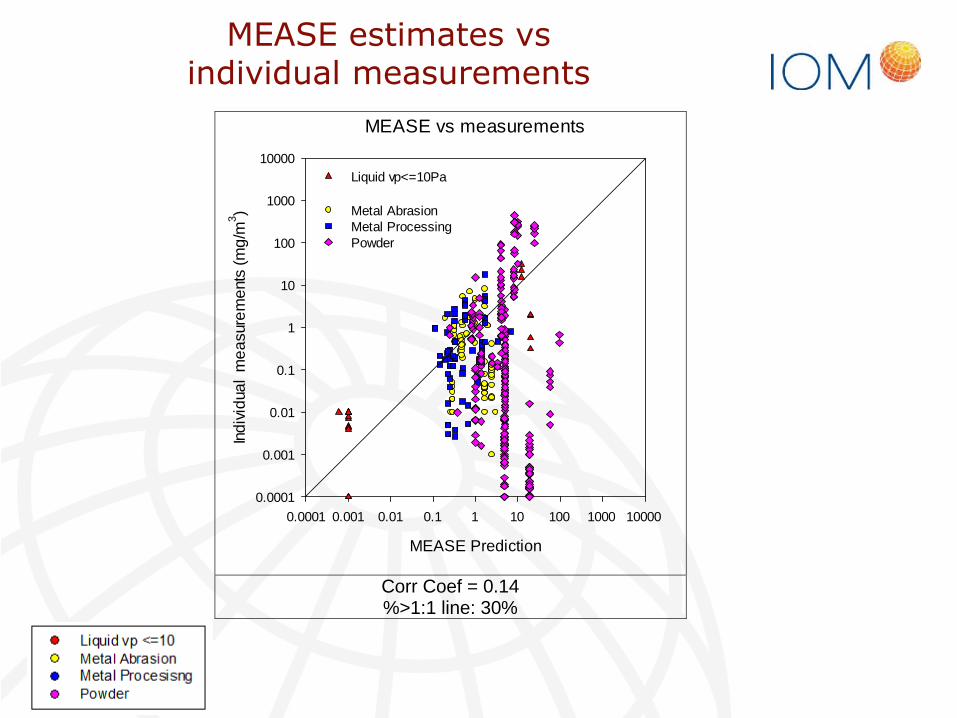
MEASE estimates vsindividual measurements
MEASE vs measurements
MEASE Prediction
0.0001 0.001 0.01 0.1 1 10 100 1000 10000
Ind
ivid
ual
me
asu
rem
ent
s(m
g/m
3)
0.0001
0.001
0.01
0.1
1
10
100
1000
10000
Liquid vp<=10Pa
Metal AbrasionMetal ProcessingPowder
Corr Coef = 0.14%>1:1 line: 30%
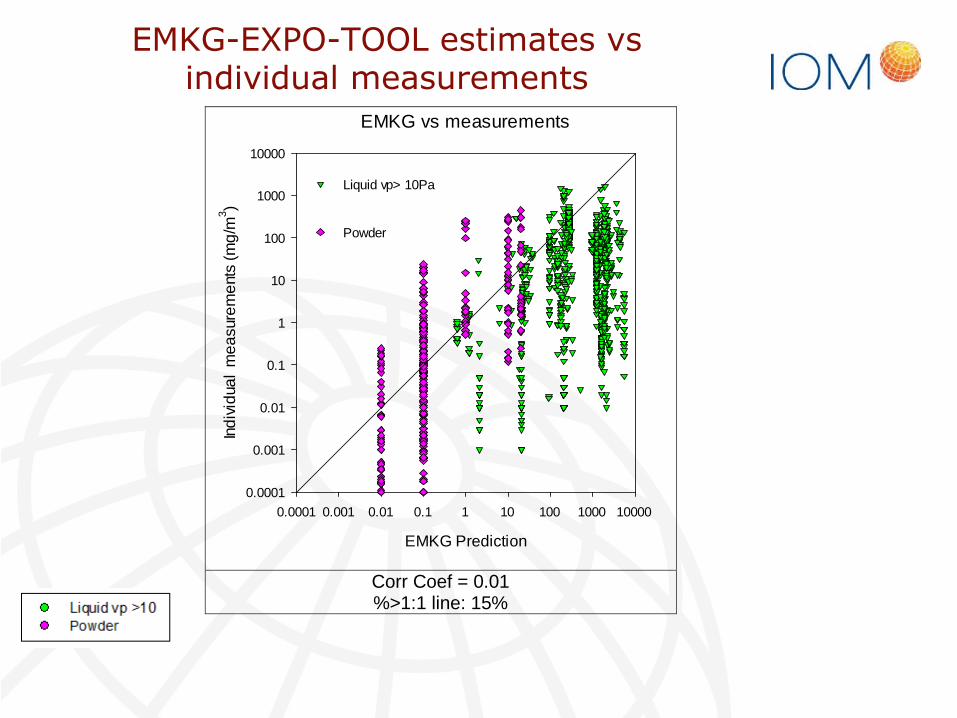
EMKG-EXPO-TOOL estimates vsindividual measurements
EMKG vs measurements
EMKG Prediction
0.0001 0.001 0.01 0.1 1 10 100 1000 10000
Ind
ivid
ual
me
asu
rem
ent
s(m
g/m
3)
0.0001
0.001
0.01
0.1
1
10
100
1000
10000
Liquid vp> 10Pa
Powder
Corr Coef = 0.01%>1:1 line: 15%
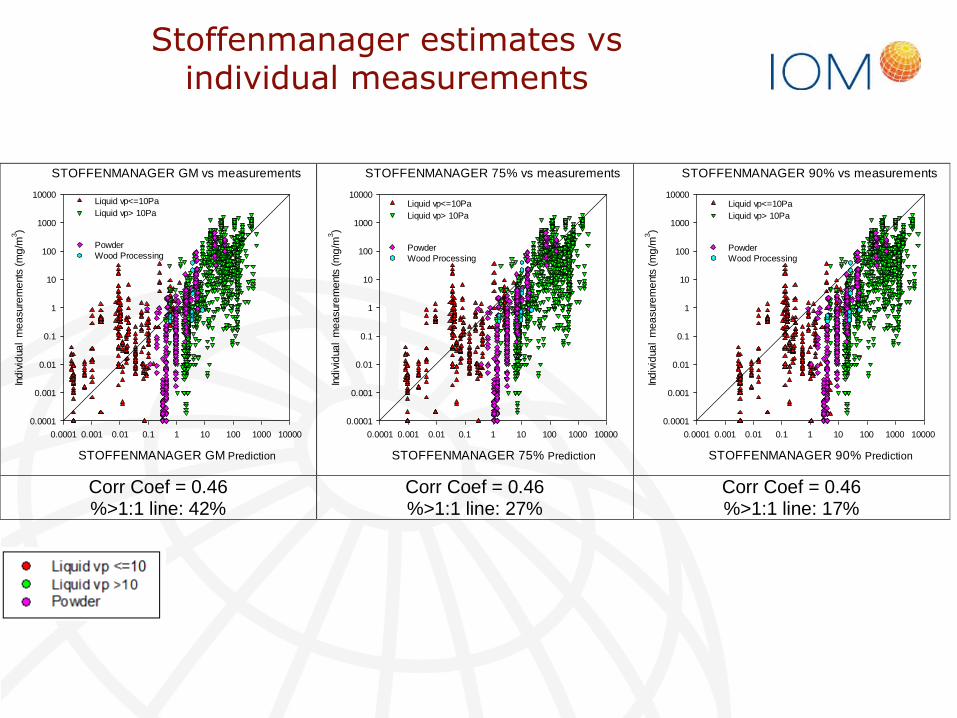
Stoffenmanager estimates vsindividual measurements
STOFFENMANAGER GM vs measurements
STOFFENMANAGER GM Prediction
0.0001 0.001 0.01 0.1 1 10 100 1000 10000
Ind
ivid
ual
mea
sure
me
nts
(mg
/m3)
0.0001
0.001
0.01
0.1
1
10
100
1000
10000Liquid vp<=10Pa
Liquid vp> 10Pa
PowderWood Processing
STOFFENMANAGER 75% vs measurements
STOFFENMANAGER 75% Prediction
0.0001 0.001 0.01 0.1 1 10 100 1000 10000
Indiv
idua
lm
ea
sure
ments
(mg
/m3)
0.0001
0.001
0.01
0.1
1
10
100
1000
10000Liquid vp<=10Pa
Liquid vp> 10Pa
PowderWood Processing
STOFFENMANAGER 90% vs measurements
STOFFENMANAGER 90% Prediction
0.0001 0.001 0.01 0.1 1 10 100 1000 10000
Ind
ivid
ual
mea
sure
me
nts
(mg
/m3)
0.0001
0.001
0.01
0.1
1
10
100
1000
10000Liquid vp<=10Pa
Liquid vp> 10Pa
PowderWood Processing
Corr Coef = 0.46%>1:1 line: 42%
Corr Coef = 0.46%>1:1 line: 27%
Corr Coef = 0.46%>1:1 line: 17%
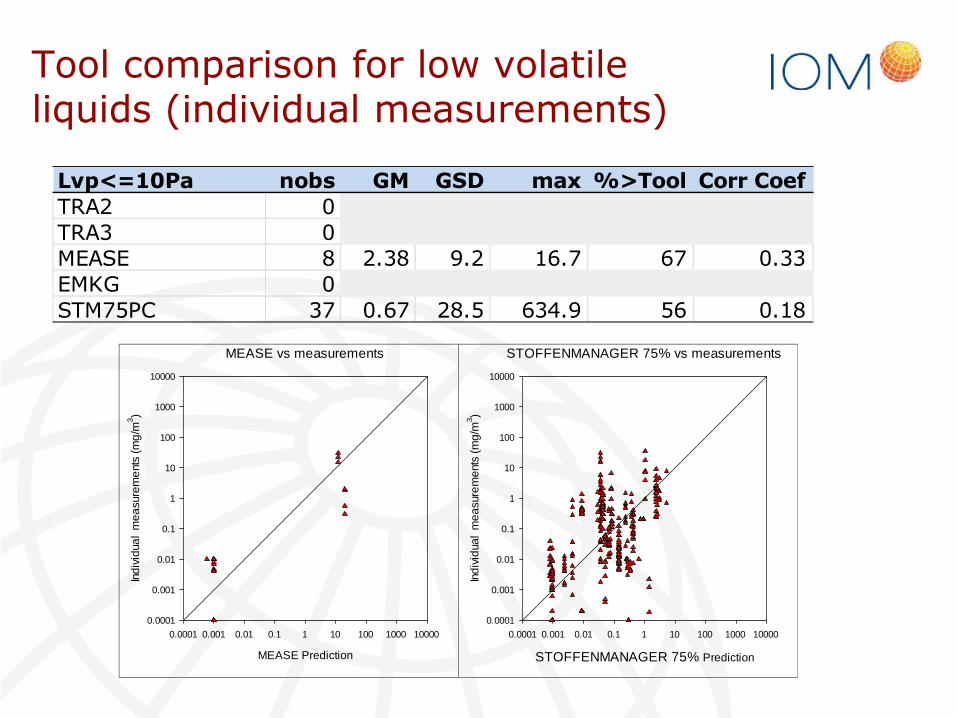
Tool comparison for low volatileliquids (individual measurements)
MEASE vs measurements
MEASE Prediction
0.0001 0.001 0.01 0.1 1 10 100 1000 10000
Indiv
idua
lm
ea
sure
me
nts
(mg
/m3)
0.0001
0.001
0.01
0.1
1
10
100
1000
10000
STOFFENMANAGER 75% vs measurements
STOFFENMANAGER 75% Prediction
0.0001 0.001 0.01 0.1 1 10 100 1000 10000
Ind
ivid
ual
me
asu
rem
ent
s(m
g/m
3)
0.0001
0.001
0.01
0.1
1
10
100
1000
10000
Lvp<=10Pa nobs GM GSD max %>Tool Corr CoefTRA2 0TRA3 0MEASE 8 2.38 9.2 16.7 67 0.33EMKG 0STM75PC 37 0.67 28.5 634.9 56 0.18
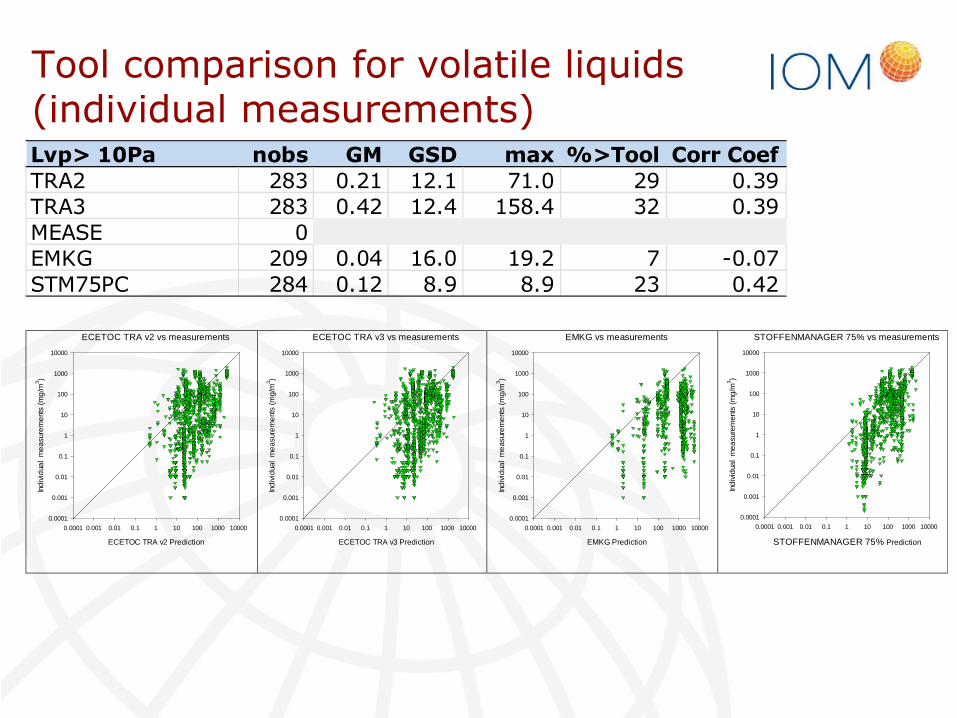
Tool comparison for volatile liquids(individual measurements)Lvp> 10Pa nobs GM GSD max %>Tool Corr CoefTRA2 283 0.21 12.1 71.0 29 0.39TRA3 283 0.42 12.4 158.4 32 0.39MEASE 0EMKG 209 0.04 16.0 19.2 7 -0.07STM75PC 284 0.12 8.9 8.9 23 0.42
ECETOC TRA v2 vs measurements
ECETOC TRA v2 Prediction
0.0001 0.001 0.01 0.1 1 10 100 1000 10000
Ind
ivid
ual
me
asu
rem
ent
s(m
g/m
3)
0.0001
0.001
0.01
0.1
1
10
100
1000
10000
ECETOC TRA v3 vs measurements
ECETOC TRA v3 Prediction
0.0001 0.001 0.01 0.1 1 10 100 1000 10000
Ind
ivid
ua
lm
ea
sur
em
ent
s(m
g/m
3)
0.0001
0.001
0.01
0.1
1
10
100
1000
10000
EMKG vs measurements
EMKG Prediction
0.0001 0.001 0.01 0.1 1 10 100 1000 10000
Ind
ivid
ual
me
asur
em
ent
s(m
g/m
3)
0.0001
0.001
0.01
0.1
1
10
100
1000
10000
STOFFENMANAGER 75% vs measurements
STOFFENMANAGER 75% Prediction
0.0001 0.001 0.01 0.1 1 10 100 1000 10000
Ind
ivid
ual
mea
sure
ment
s(m
g/m
3)
0.0001
0.001
0.01
0.1
1
10
100
1000
10000
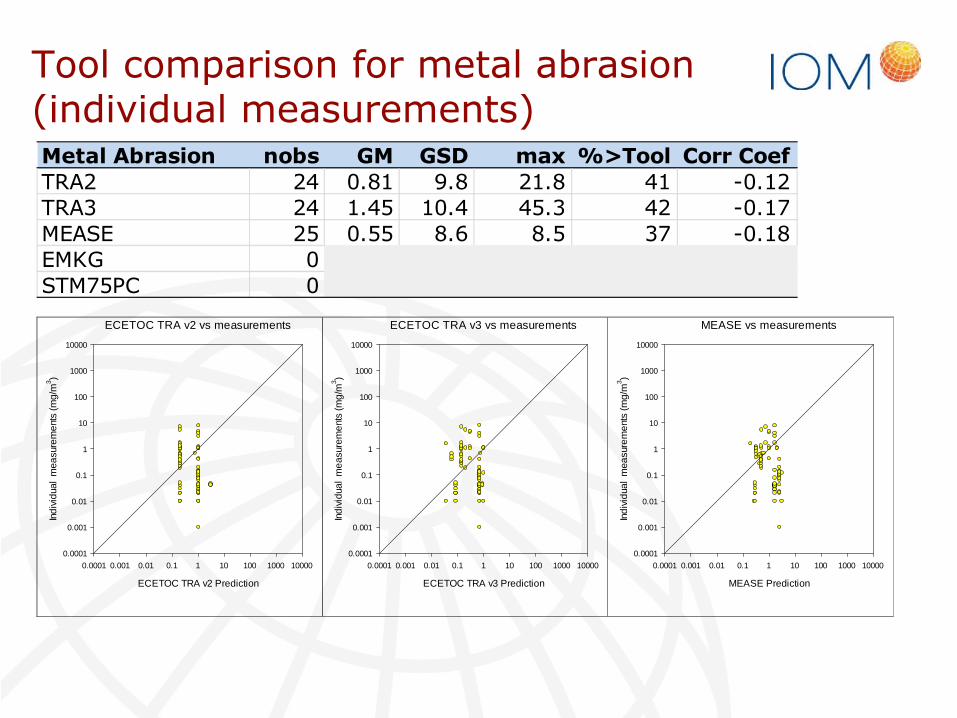
Tool comparison for metal abrasion(individual measurements)Metal Abrasion nobs GM GSD max %>Tool Corr CoefTRA2 24 0.81 9.8 21.8 41 -0.12TRA3 24 1.45 10.4 45.3 42 -0.17MEASE 25 0.55 8.6 8.5 37 -0.18EMKG 0STM75PC 0
ECETOC TRA v2 vs measurements
ECETOC TRA v2 Prediction
0.0001 0.001 0.01 0.1 1 10 100 1000 10000
Ind
ivid
ual
mea
sur
em
ent
s(m
g/m
3)
0.0001
0.001
0.01
0.1
1
10
100
1000
10000
ECETOC TRA v3 vs measurements
ECETOC TRA v3 Prediction
0.0001 0.001 0.01 0.1 1 10 100 1000 10000
Ind
ivid
ua
lm
easure
me
nts
(mg
/m3)
0.0001
0.001
0.01
0.1
1
10
100
1000
10000
MEASE vs measurements
MEASE Prediction
0.0001 0.001 0.01 0.1 1 10 100 1000 10000
Ind
ivid
ual
mea
sur
em
ent
s(m
g/m
3)
0.0001
0.001
0.01
0.1
1
10
100
1000
10000

Tool comparison for metal processing(individual measurements)
Metal processing nobs GM GSD max %>Tool Corr CoefTRA2 0TRA3 0MEASE 33 0.57 6.4 12.0 38 0.15EMKG 0STM75PC 0
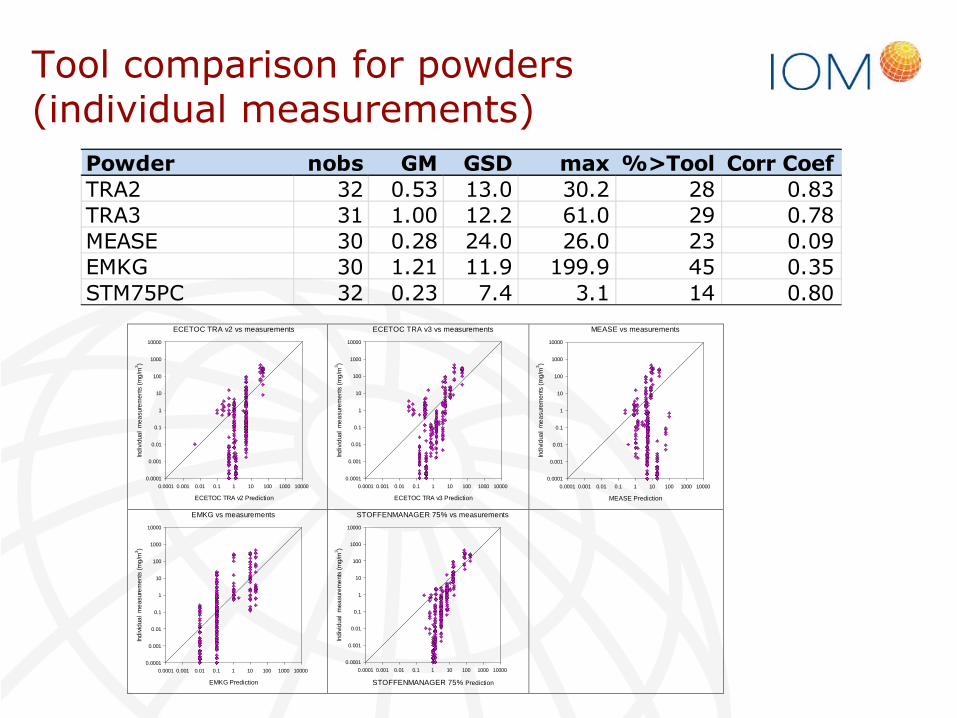
Tool comparison for powders(individual measurements)
Powder nobs GM GSD max %>Tool Corr CoefTRA2 32 0.53 13.0 30.2 28 0.83TRA3 31 1.00 12.2 61.0 29 0.78MEASE 30 0.28 24.0 26.0 23 0.09EMKG 30 1.21 11.9 199.9 45 0.35STM75PC 32 0.23 7.4 3.1 14 0.80
ECETOC TRA v2 vs measurements
ECETOC TRA v2 Prediction
0.0001 0.001 0.01 0.1 1 10 100 1000 10000
Ind
ivid
ual
me
asu
rem
ent
s(m
g/m
3)
0.0001
0.001
0.01
0.1
1
10
100
1000
10000
ECETOC TRA v3 vs measurements
ECETOC TRA v3 Prediction
0.0001 0.001 0.01 0.1 1 10 100 1000 10000
Ind
ivid
ual
me
asu
rem
ent
s(m
g/m
3)
0.0001
0.001
0.01
0.1
1
10
100
1000
10000
MEASE vs measurements
MEASE Prediction
0.0001 0.001 0.01 0.1 1 10 100 1000 10000
Ind
ivid
ual
me
asu
rem
ent
s(m
g/m
3)
0.0001
0.001
0.01
0.1
1
10
100
1000
10000
EMKG vs measurements
EMKG Prediction
0.0001 0.001 0.01 0.1 1 10 100 1000 10000
Ind
ivid
ual
me
asu
rem
ents
(mg
/m3)
0.0001
0.001
0.01
0.1
1
10
100
1000
10000
STOFFENMANAGER 75% vs measurements
STOFFENMANAGER 75% Prediction
0.0001 0.001 0.01 0.1 1 10 100 1000 10000
Indiv
idual
mea
sur
em
ents
(mg/m
3)
0.0001
0.001
0.01
0.1
1
10
100
1000
10000
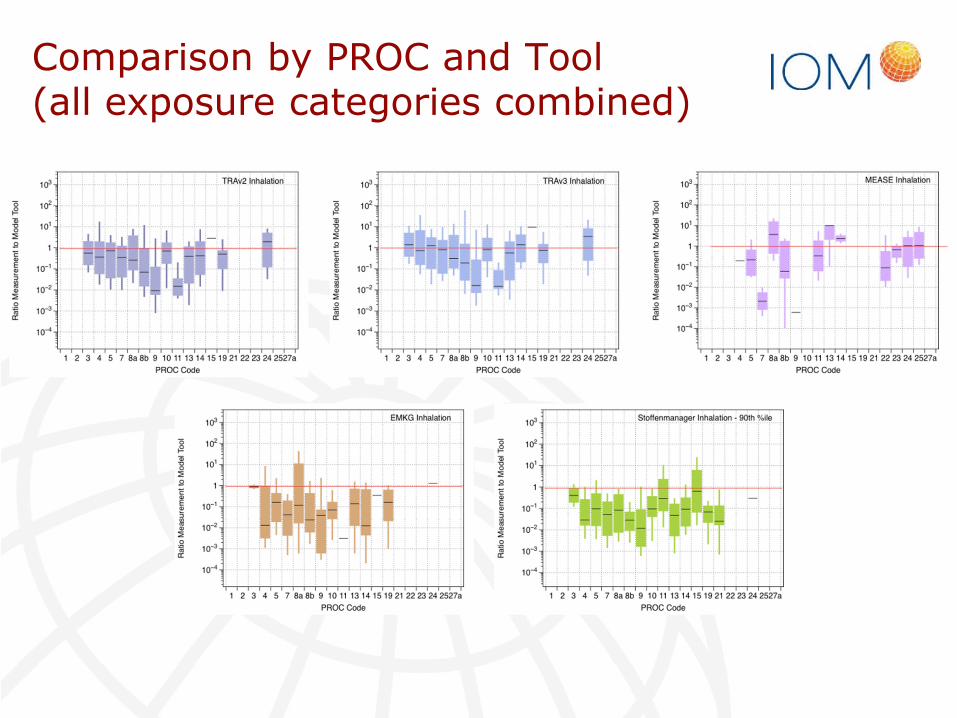
Comparison by PROC and Tool(all exposure categories combined)

Comparison of tool estimates with aggregatedmeasurement data (type 1 and type 2)
Type 1: Exposureestimate from the
tool was comparedwith the
correspondingarithmetic mean of
the aggregatedmeasurement data.
The ratio of themeasurement valueover the tool-basedestimate calculated
Ratio of <1 indicatesa conservative tool
estimate for thatcase
Type 2: Arithmeticmean of estimatesfrom the tool was
compared with thearithmetic mean ofthe corresponding
grouped data
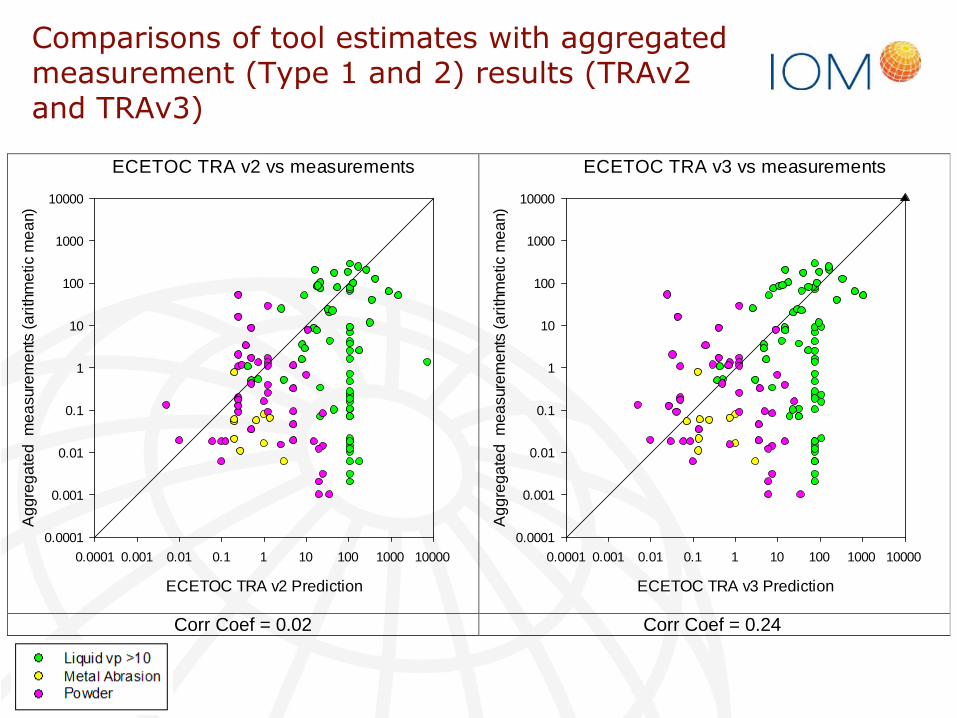
Comparisons of tool estimates with aggregatedmeasurement (Type 1 and 2) results (TRAv2and TRAv3)
ECETOC TRA v2 vs measurements
ECETOC TRA v2 Prediction
0.0001 0.001 0.01 0.1 1 10 100 1000 10000
Ag
gre
ga
ted
me
asu
rem
ent
s(a
rith
me
tic
me
an)
0.0001
0.001
0.01
0.1
1
10
100
1000
10000
ECETOC TRA v3 vs measurements
ECETOC TRA v3 Prediction
0.0001 0.001 0.01 0.1 1 10 100 1000 10000
Ag
gre
ga
ted
me
asu
rem
ent
s(a
rith
me
ticm
ea
n)
0.0001
0.001
0.01
0.1
1
10
100
1000
10000
Corr Coef = 0.02 Corr Coef = 0.24

Comparisons of tool estimates with aggregatedmeasurement results (MEASE)
MEASE vs measurements
MEASE Prediction
0.0001 0.001 0.01 0.1 1 10 100 1000 10000
Ag
gre
ga
ted
me
asu
rem
ent
s(a
rith
me
tic
me
an)
0.0001
0.001
0.01
0.1
1
10
100
1000
10000
Corr Coef = -0.03
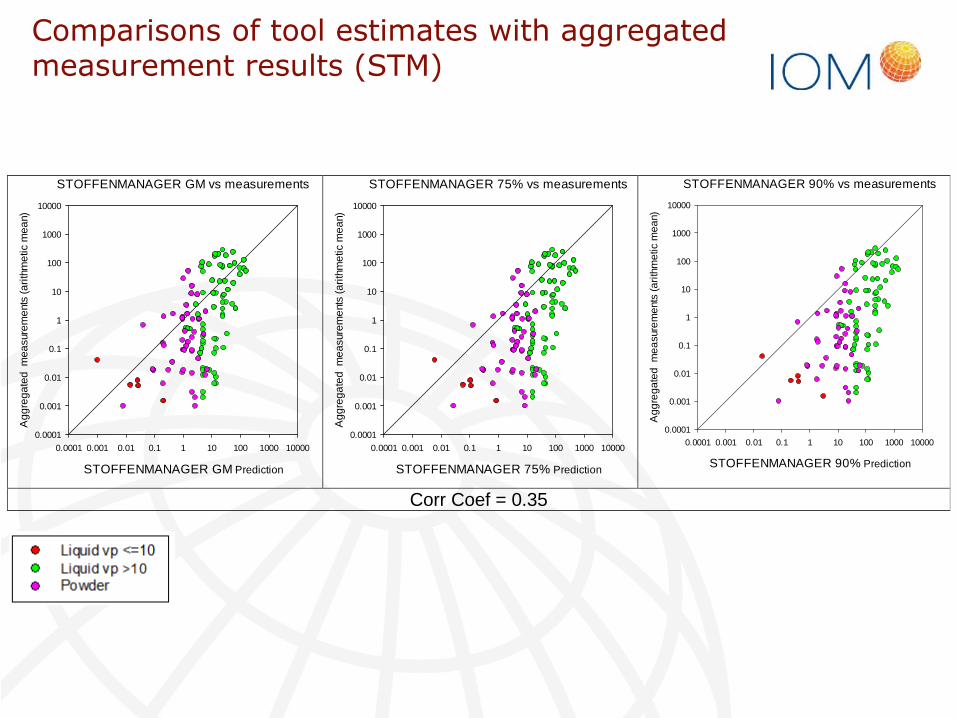
Comparisons of tool estimates with aggregatedmeasurement results (STM)
STOFFENMANAGER GM vs measurements
STOFFENMANAGER GM Prediction
0.0001 0.001 0.01 0.1 1 10 100 1000 10000
Ag
gre
ga
ted
me
asur
em
ents
(ari
thm
etic
me
an)
0.0001
0.001
0.01
0.1
1
10
100
1000
10000
STOFFENMANAGER 75% vs measurements
STOFFENMANAGER 75% Prediction
0.0001 0.001 0.01 0.1 1 10 100 1000 10000
Ag
gre
ga
ted
me
asure
me
nts
(ari
thm
etic
me
an)
0.0001
0.001
0.01
0.1
1
10
100
1000
10000
STOFFENMANAGER 90% vs measurements
STOFFENMANAGER 90% Prediction
0.0001 0.001 0.01 0.1 1 10 100 1000 10000
Ag
gre
ga
ted
me
asu
rem
ent
s(a
rith
me
ticm
ea
n)
0.0001
0.001
0.01
0.1
1
10
100
1000
10000
Corr Coef = 0.35
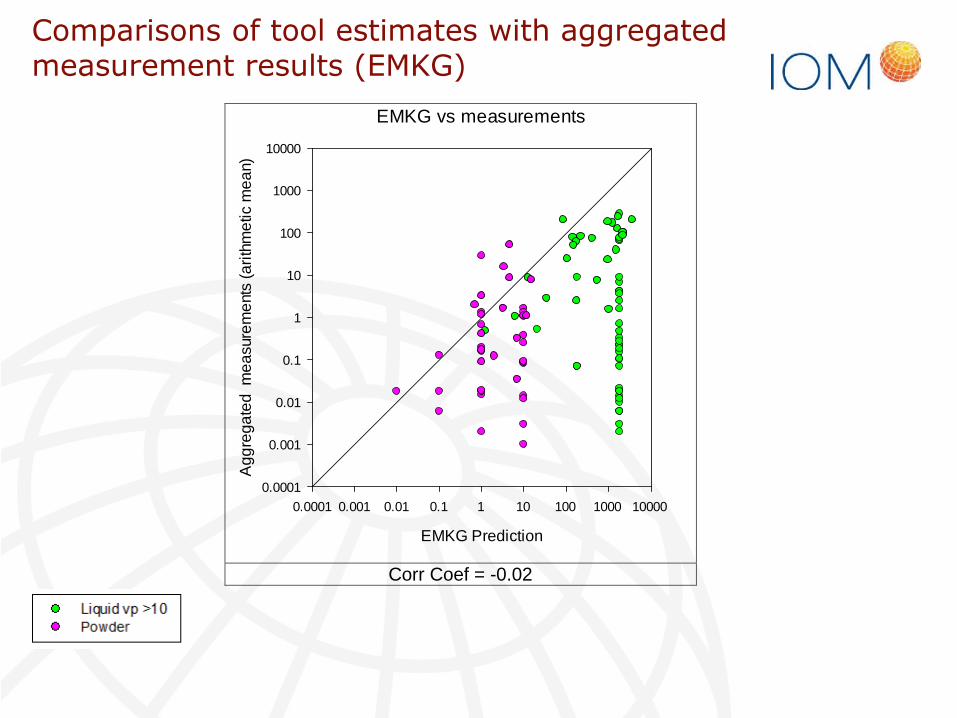
Comparisons of tool estimates with aggregatedmeasurement results (EMKG)
EMKG vs measurements
EMKG Prediction
0.0001 0.001 0.01 0.1 1 10 100 1000 10000
Ag
gre
ga
ted
me
asu
rem
ent
s(a
rith
me
ticm
ea
n)
0.0001
0.001
0.01
0.1
1
10
100
1000
10000
Corr Coef = -0.02
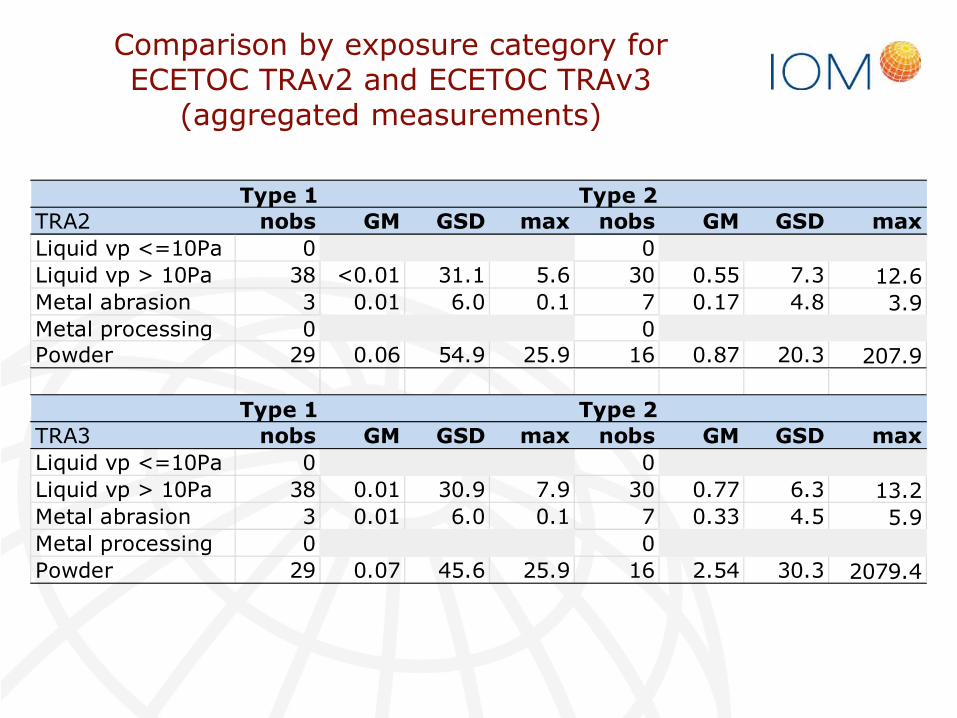
Comparison by exposure category forECETOC TRAv2 and ECETOC TRAv3
(aggregated measurements)
Type 1 Type 2TRA2 nobs GM GSD max nobs GM GSD max
Liquid vp <=10Pa 0 0
Liquid vp > 10Pa 38 <0.01 31.1 5.6 30 0.55 7.3 12.6Metal abrasion 3 0.01 6.0 0.1 7 0.17 4.8 3.9Metal processing 0 0Powder 29 0.06 54.9 25.9 16 0.87 20.3 207.9
Type 1 Type 2TRA3 nobs GM GSD max nobs GM GSD max
Liquid vp <=10Pa 0 0
Liquid vp > 10Pa 38 0.01 30.9 7.9 30 0.77 6.3 13.2Metal abrasion 3 0.01 6.0 0.1 7 0.33 4.5 5.9Metal processing 0 0
Powder 29 0.07 45.6 25.9 16 2.54 30.3 2079.4
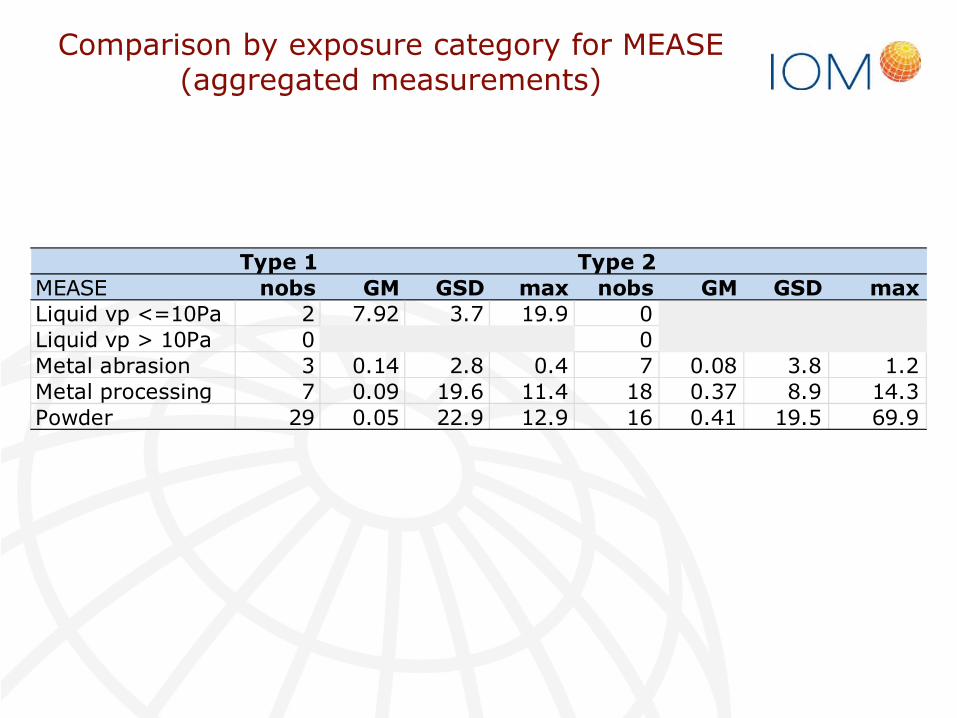
Comparison by exposure category for MEASE(aggregated measurements)
Type 1 Type 2MEASE nobs GM GSD max nobs GM GSD maxLiquid vp <=10Pa 2 7.92 3.7 19.9 0Liquid vp > 10Pa 0 0Metal abrasion 3 0.14 2.8 0.4 7 0.08 3.8 1.2Metal processing 7 0.09 19.6 11.4 18 0.37 8.9 14.3Powder 29 0.05 22.9 12.9 16 0.41 19.5 69.9
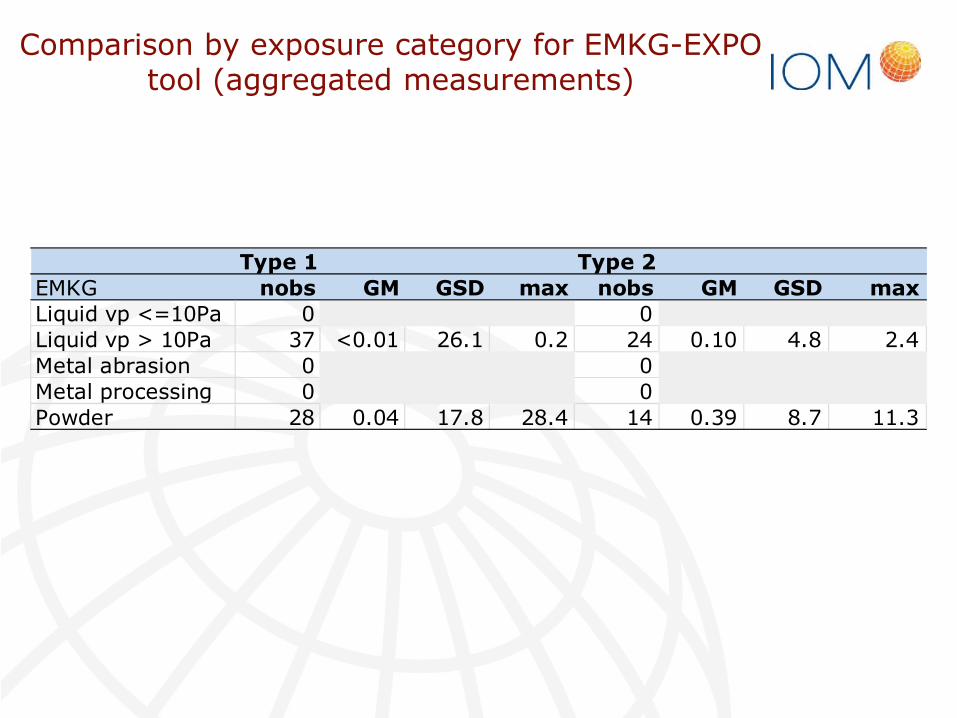
Comparison by exposure category for EMKG-EXPOtool (aggregated measurements)
Type 1 Type 2EMKG nobs GM GSD max nobs GM GSD maxLiquid vp <=10Pa 0 0Liquid vp > 10Pa 37 <0.01 26.1 0.2 24 0.10 4.8 2.4Metal abrasion 0 0Metal processing 0 0Powder 28 0.04 17.8 28.4 14 0.39 8.7 11.3

Comparison by exposure category for STM(aggregated measurements)
Type 1 Type 2 maxSTMGM nobs GM GSD max nobs GM GSDLiquid vp <=10Pa 1 29.61 29.6 4 0.11 6.3 0.4Liquid vp > 10Pa 38 0.03 17.0 11.7 30 1.11 5.8 21.3Metal abrasion 0 0Metal processing 0 0Powder 29 0.12 17.7 28.1 16 0.35 11.6 34.4
Type 1 Type 2STM75PC nobs GM GSD max nobs GM GSD maxLiquid vp <=10Pa 1 7.14 7.1 4 0.03 6.3 0.1Liquid vp > 10Pa 38 0.01 17.0 3.7 30 0.35 5.8 6.7Metal abrasion 0 0Metal processing 0 0Powder 29 0.04 17.7 8.7 16 0.11 11.6 10.7
Type 1 Type 2STM90PC nobs GM GSD max nobs GM GSD maxLiquid vp <=10Pa 1 2.00 2.0 4 0.01 6.3 0.0Liquid vp > 10Pa 38 <0.01 17.0 1.3 30 0.12 5.8 2.4Metal abrasion 0 0Metal processing 0 0Powder 29 0.01 17.7 3.0 16 0.04 11.6 3.7
Discussion
• Limited data for low volatile liquids andmetal processes
• Reasonable spread of data across PROCs,but clearly there are some missing (e.g.PROC 1 and 2)
• Across all data:
• Tools appear to be conservative• at ~ 70% (based on individual measurements)
• However, aggregated data show that averagemeasurements for situation can be higher than toolpredictions
• Limited correlation with measurements (exceptpowders)
Conclusions – non-volatile liquids
• Limited data, only comparison with MEASEand STM
• No evidence that these tools areconservative
• Low correlation between tool estimates andexposure
Conclusions – volatile liquids
• Reasonable amount of data
• Based on individual measurements the toolsare conservative (but ECETOC TRAv3 lessso than others)
• Some evidence from the aggregate datathat the ECETOC TRAv2, ECETOC TRAv3and STM are less conservative
• Correlation between tools estimates andmeasurement results
• ~0.4 for ECETOC TRAv2, ECETOC TRAv3 andSTM
• No correlation for EMKG-EXPO-Tool
Conclusions – Metal abrasion
• Limited data
• Only for ECETOC TRAv2, ECETOC TRAv3and MEASE
• No evidence that these tools areconservative
• No correlation with measured results
Conclusions – Metal processes
• Limited data
• Only for MEASE
• No evidence that MEASE is sufficientlyconservative
• Little or no correlation with measuredresults
Conclusions – Powders
• Reasonable amount of data
• Tools appear to be conservative, although EMKG-EXPO-Tool less so than others
• Good correlation with measurement results forECETOC TRAv2, ECETOC TRAv3 and STM (~0.8)
• Less correlation for EMKG-EXPO-Tool and no forMEASE
Summary• Tools appear to be conservative, however:
• not for all exposure categories
• Is the level of conservatism is sufficient? Probably not!
• What is the likelihood that false-negative conclusions aredrawn?
• For some tools (eg STM, EMKG) estimates were notcorrected for concentration of the agent in the mixture andduration of the exposure (relative to the measurementduration). If this were to be included, the levels ofconservatism will be reduced!
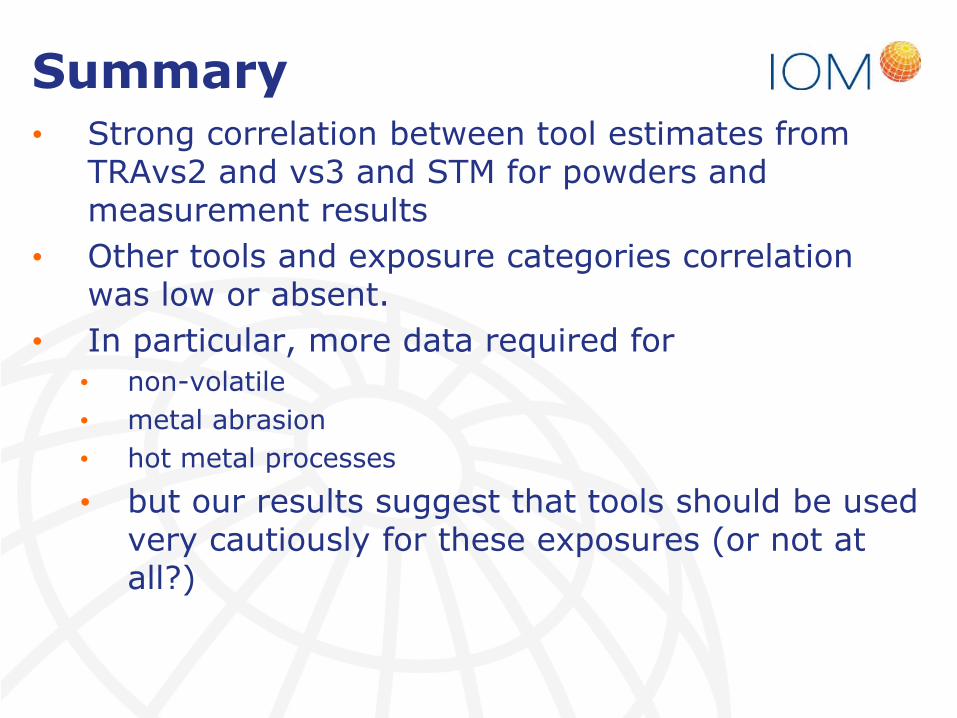
Summary• Strong correlation between tool estimates from
TRAvs2 and vs3 and STM for powders andmeasurement results
• Other tools and exposure categories correlationwas low or absent.
• In particular, more data required for• non-volatile
• metal abrasion
• hot metal processes
• but our results suggest that tools should be usedvery cautiously for these exposures (or not atall?)
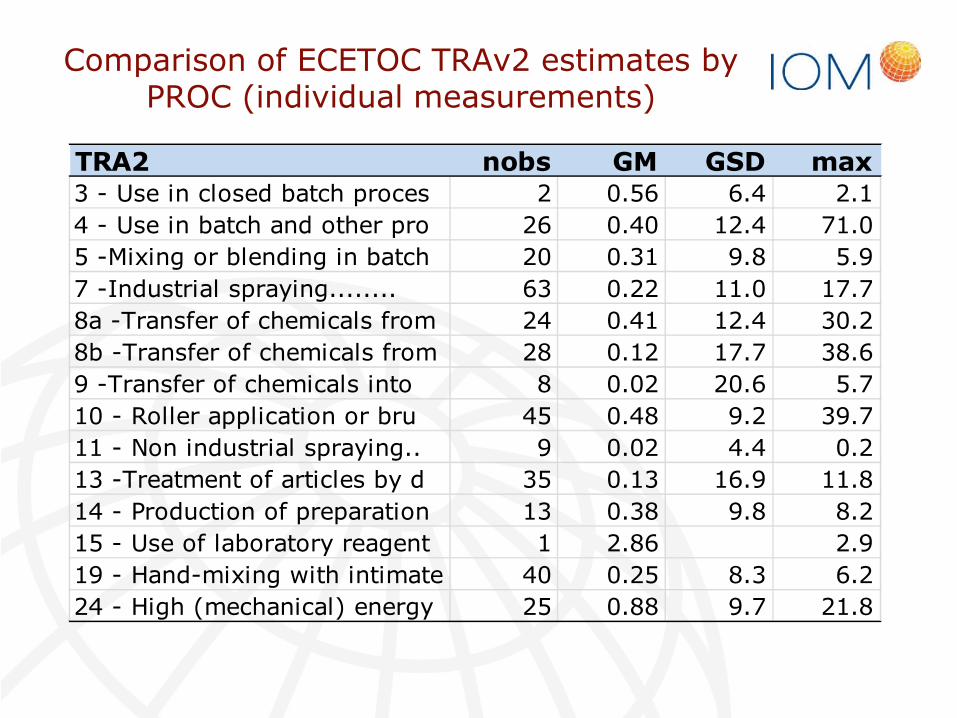
Comparison of ECETOC TRAv2 estimates byPROC (individual measurements)
TRA2 nobs GM GSD max3 - Use in closed batch proces 2 0.56 6.4 2.1
4 - Use in batch and other pro 26 0.40 12.4 71.0
5 -Mixing or blending in batch 20 0.31 9.8 5.9
7 -Industrial spraying........ 63 0.22 11.0 17.7
8a -Transfer of chemicals from 24 0.41 12.4 30.2
8b -Transfer of chemicals from 28 0.12 17.7 38.6
9 -Transfer of chemicals into 8 0.02 20.6 5.7
10 - Roller application or bru 45 0.48 9.2 39.7
11 - Non industrial spraying.. 9 0.02 4.4 0.2
13 -Treatment of articles by d 35 0.13 16.9 11.8
14 - Production of preparation 13 0.38 9.8 8.2
15 - Use of laboratory reagent 1 2.86 2.9
19 - Hand-mixing with intimate 40 0.25 8.3 6.2
24 - High (mechanical) energy 25 0.88 9.7 21.8
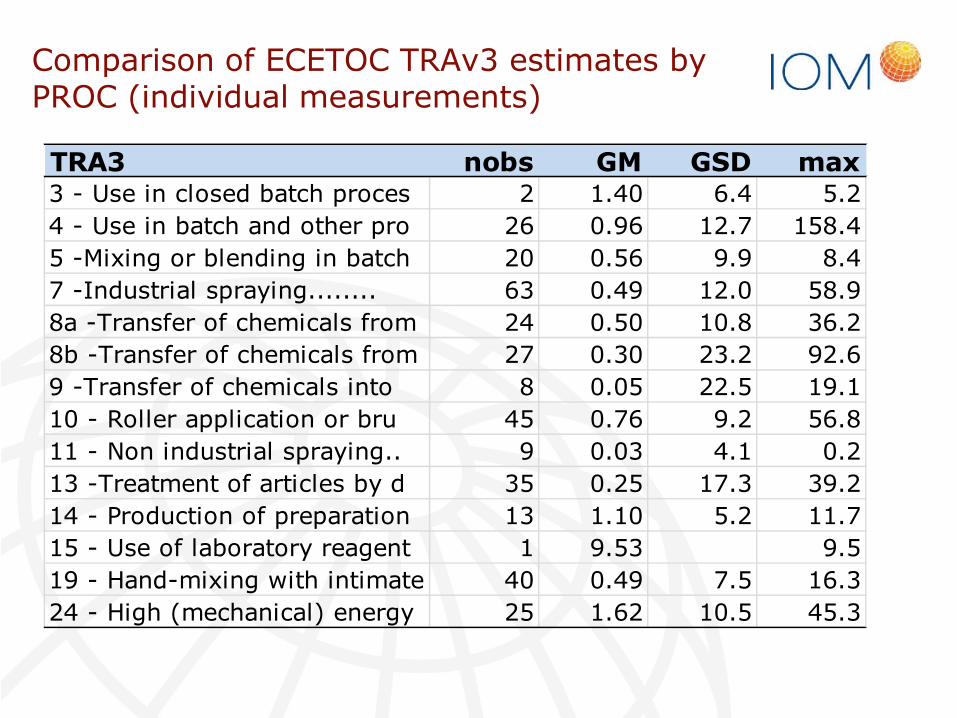
Comparison of ECETOC TRAv3 estimates byPROC (individual measurements)
TRA3 nobs GM GSD max3 - Use in closed batch proces 2 1.40 6.4 5.2
4 - Use in batch and other pro 26 0.96 12.7 158.4
5 -Mixing or blending in batch 20 0.56 9.9 8.4
7 -Industrial spraying........ 63 0.49 12.0 58.9
8a -Transfer of chemicals from 24 0.50 10.8 36.2
8b -Transfer of chemicals from 27 0.30 23.2 92.6
9 -Transfer of chemicals into 8 0.05 22.5 19.1
10 - Roller application or bru 45 0.76 9.2 56.8
11 - Non industrial spraying.. 9 0.03 4.1 0.2
13 -Treatment of articles by d 35 0.25 17.3 39.2
14 - Production of preparation 13 1.10 5.2 11.7
15 - Use of laboratory reagent 1 9.53 9.5
19 - Hand-mixing with intimate 40 0.49 7.5 16.3
24 - High (mechanical) energy 25 1.62 10.5 45.3
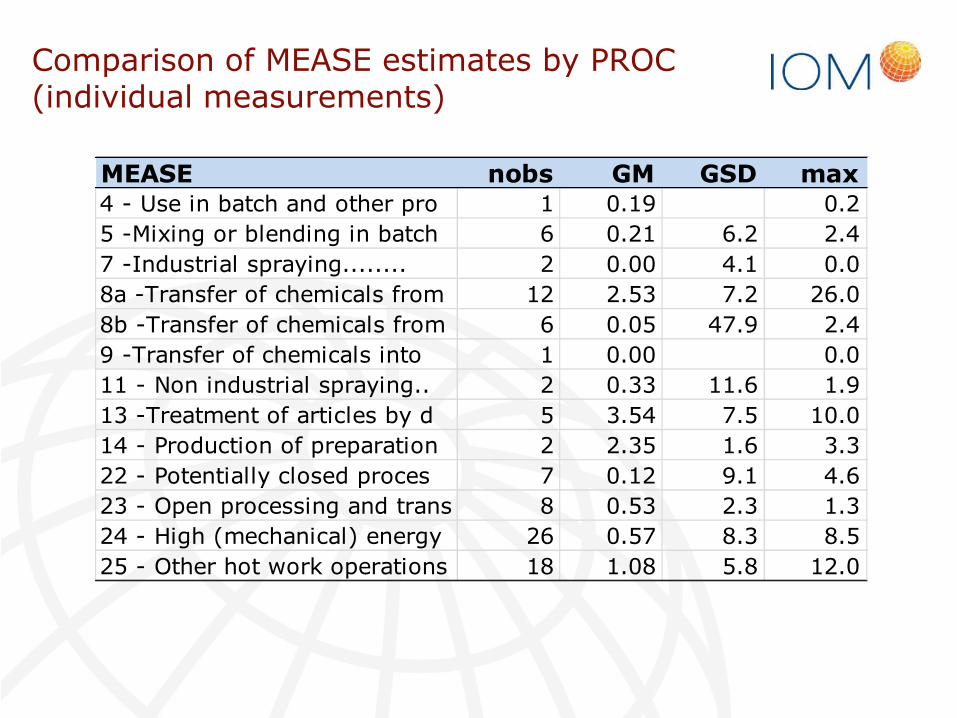
Comparison of MEASE estimates by PROC(individual measurements)
MEASE nobs GM GSD max4 - Use in batch and other pro 1 0.19 0.2
5 -Mixing or blending in batch 6 0.21 6.2 2.4
7 -Industrial spraying........ 2 0.00 4.1 0.0
8a -Transfer of chemicals from 12 2.53 7.2 26.0
8b -Transfer of chemicals from 6 0.05 47.9 2.4
9 -Transfer of chemicals into 1 0.00 0.0
11 - Non industrial spraying.. 2 0.33 11.6 1.9
13 -Treatment of articles by d 5 3.54 7.5 10.0
14 - Production of preparation 2 2.35 1.6 3.3
22 - Potentially closed proces 7 0.12 9.1 4.6
23 - Open processing and trans 8 0.53 2.3 1.3
24 - High (mechanical) energy 26 0.57 8.3 8.5
25 - Other hot work operations 18 1.08 5.8 12.0
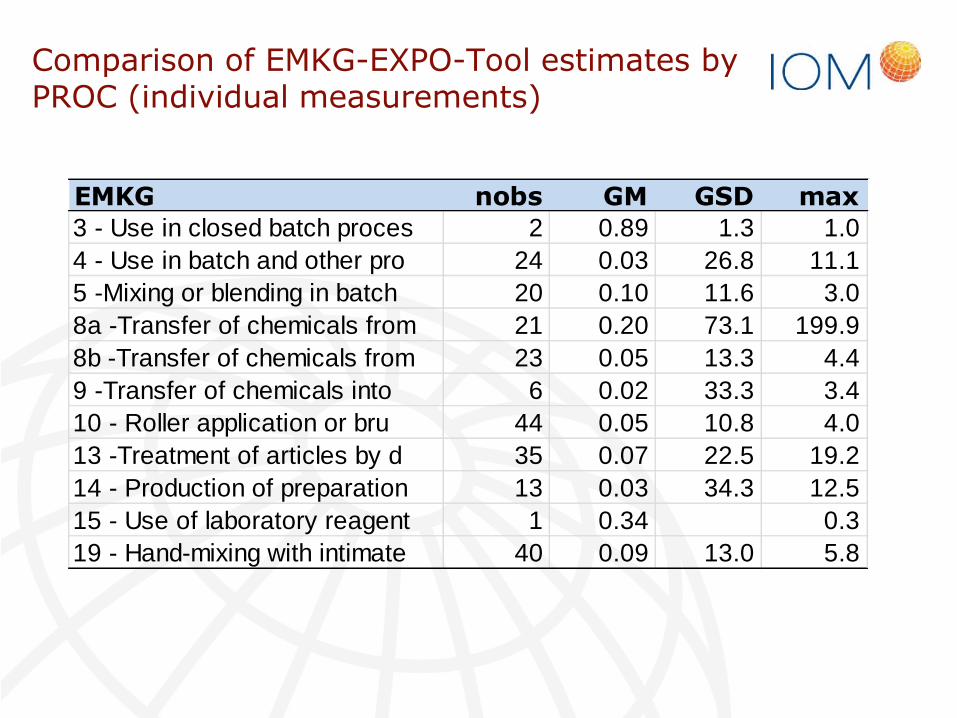
Comparison of EMKG-EXPO-Tool estimates byPROC (individual measurements)
EMKG nobs GM GSD max3 - Use in closed batch proces 2 0.89 1.3 1.0
4 - Use in batch and other pro 24 0.03 26.8 11.1
5 -Mixing or blending in batch 20 0.10 11.6 3.0
8a -Transfer of chemicals from 21 0.20 73.1 199.9
8b -Transfer of chemicals from 23 0.05 13.3 4.4
9 -Transfer of chemicals into 6 0.02 33.3 3.4
10 - Roller application or bru 44 0.05 10.8 4.0
13 -Treatment of articles by d 35 0.07 22.5 19.2
14 - Production of preparation 13 0.03 34.3 12.5
15 - Use of laboratory reagent 1 0.34 0.3
19 - Hand-mixing with intimate 40 0.09 13.0 5.8
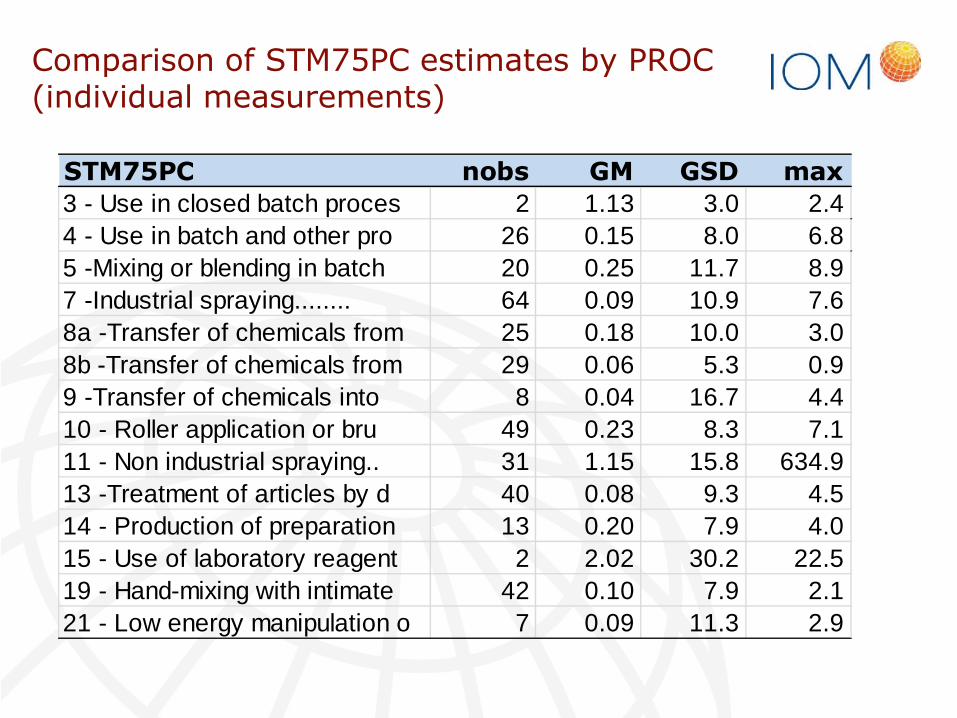
Comparison of STM75PC estimates by PROC(individual measurements)
STM75PC nobs GM GSD max
3 - Use in closed batch proces 2 1.13 3.0 2.4
4 - Use in batch and other pro 26 0.15 8.0 6.8
5 -Mixing or blending in batch 20 0.25 11.7 8.9
7 -Industrial spraying........ 64 0.09 10.9 7.6
8a -Transfer of chemicals from 25 0.18 10.0 3.0
8b -Transfer of chemicals from 29 0.06 5.3 0.9
9 -Transfer of chemicals into 8 0.04 16.7 4.4
10 - Roller application or bru 49 0.23 8.3 7.1
11 - Non industrial spraying.. 31 1.15 15.8 634.9
13 -Treatment of articles by d 40 0.08 9.3 4.5
14 - Production of preparation 13 0.20 7.9 4.0
15 - Use of laboratory reagent 2 2.02 30.2 22.5
19 - Hand-mixing with intimate 42 0.10 7.9 2.1
21 - Low energy manipulation o 7 0.09 11.3 2.9