presentation coal oil and gas scenario in the context of power...
TRANSCRIPT

Coal, Oil & Gas Availability & Affordability in the context of Indian Power Sector
Rakesh Kumar , Retd General Manager, NVVN/NTPC
&
Founder Director: Sun Solar Techno Electric ( India) Pvt Ltd

Electricity Sector of India 1. Electricity sector has a vital role in economic development as well as social progress
2. In 1971-91 period, capacity addition happened through 100 & 200 MW units and large pit head/ load centre coal stations. Post 1985, larger unit sizes & long EHV transmission lines became the norm.
3. Post 1991, great financial resource crunch & inability for govts budgetary supports, electricity sector opened for private sector.
4. With State Discoms unable to pay dues due to heavy drain through free/ heavily subsidised power and high commercial losses, electricity reforms & Electricity Act 2003 brought about vigorous growth of IPPs and Merchant power.
5. With need to speed up power sector growth and coal linkage problems along with concept of bringing tariff bidding to bring in efficiency through large private participation, UMPP were set up.
6. Till this stage focuses was to bring in distribution side reforms,efficiency & commercial viability with competitions on one side and supply side boosting through IPPsu, merchant power & UMPPs which was modelled as Integrated power-coal utilities.
7. Energy consumption in India is 4Th largest after China, USA & Russia . Total Primary Energy consumption in India was 595Mtoe in the year 2013 ; 29.45% from Cruid Oil, 7.7 % from Natural Gas, 54.7% from Coal, 1.26 % from Nuclear, 5.0 % from Hydro & 7.89 % RE.

Installed Capacities & Electricity Generation 2014-151. Total Utility level Installed capacity 2014-15 was 2,67,638MW , Captive
47082 MW ( > 1 MW size) and another 75000 MW Diesel Generators ( 100 to 1000KVA ) in Industries.
2. Utility scale composition : Coal 1,64,636 MW
Natural Gas 23062 MW
Hydro 41268 MW
Oil 1200 MW
RE 31692 MW
3. Capacities in State Sector 96963 ( 36.23%) , Central Secror 72521 (27.1% ) & Private sector 98152 MW ( 36.67% ).
4. As of 31st March 2015 annual electricity generation reached to 1106 billion units apart from captive generation of 166 billion units.
5. Per Capita electricity consumption was 1010 Kwhr.
6. Today, 35.5 % popultion still lives without any access to electricity.
7. During the 12th Plan , 84000MW targeted addition was planned.
8. Government has given a philip to the sector by aggressive RE capacity target of 100 GW Solar & almost 50 GW wind.
9. Proposed Electricity Act Amendment 2014 is expected to bring a substantial alignment to the Discom’s mandatory provisions, Clarity of roles and responsibility of Regulatory commissions & RE power incentivisation.


Dilemma of Electricity Sector Growth & Sustainability
• Electricity sector, today, is marred by greatest uncertainties on all process domains-financing, capital deployment, stressed assets, stalled assets, fuel security, tariff agreements (PPAs) & uncertain / inadequately predictive regulatory environment and long term tariff forecast, future of merchant power, high AT&C losses, slow progress & adaptation to reforms by DISCOMS.... Indeed a long list
• Whereas the flagship programs like ‘ Make In India ‘ , ‘Providing Power for All by 2020’ , 24X7 quality power, Rural and urban skill development & entrepreneurial programs, better energy access , all necessarily will ride on better adequate and cost effective availability of power which looks a very very far fetched dream in the current scenario.
• In light of fuel supply constraint, lack of demand & PPA and reduced of financial maneuverability of promoters to manage finances & working capital in adverse environment of the sector prevailing today, the merchant capacity has become almost a synonym to the dead capacity.
• Very firm political determination and firm regulatory discipline only can provide a ray of hope and confidence to sail over these seemingly unsurmountable problems of the sector.
• Fuel/Coal security and price volatility alongwith uncertain policy environment has taken the biggest toll on the sector in the recent history of electricity sector and proved to be a forth dimension hetherto taken for granted by the promoters and the policy makers not very long ago.

Coal Scenario i)Throughout history, coal has been used as an energy resource, primarily burned for the production of electricity and/or heat, and is also used for industrial purposes, such as refining metals. A fossil fuel, coal forms when dead plant matter is converted into peat, which in turn is converted into lignite, then sub-bituminous coal, after that bituminous coal, and lastly anthracite.
ii)Coal is the largest source of energy for the generation of electricity worldwide, as well as one of the largest worldwide anthropogenic sources of carbon dioxide releases. In 1999, world gross carbon dioxide emissions from coal usage were 8,666 million tonnes of carbon dioxide.[5] In 2011, world gross emissions from coal usage were 14,416 million tonnes.
iii)Since 1983 the world top coal producer has been China. In 2011 China produced 3,520 million tonnes of coal – 49.5% of 7,695 million tonnes world coal production. In 2011 other large producers were United States (993 million tonnes), India (589), European Union (576) and Australia (416). In 2010 the largest exporters were Australia with 328 million tonnes (27.1% of world coal export) and Indonesia with 316 million tonnes (26.1%), while the largest importers were Japan with 207 million tonnes (17.5% of world coal import), China with 195 million tonnes (16.6%) and South Korea with 126 million tonnes (10.7%).
Based on the ash percentage, the coal can be divided into various grades. These grades are:Steel Grade - I (Not exceeding 15%)Steel Grade -II (Exceeding 15% but not exceeding 18%)Washery Grade -I (Exceeding 18% but not exceeding 21%)Washery Grade -II (Exceeding 21% but not exceeding 24%)Washery Grade -III (Exceeding 24% but not exceeding 28%)Washery Grade -IV (Exceeding 28% but not exceeding 35%)Power Grade Coal unspecified Ash some times reaching to levels of 47-48%

(Contd.) Other facts on Coke , Pet Coke & GasificationThe coke must be strong enough to resist the weight of overburden in the blast furnace, which is why coking coal is so important in making steel using the conventional route. However, the alternative route is direct reduced iron, where any carbonaceous fuel can be used to make sponge or pelletised iron. Coke from coal is grey, hard, and porous and has a heating value of 24.8 million Btu/ton (29.6 MJ/kg). Some coke making processes produce valuable byproducts, including coal tar, ammonia, light oils, and coal gas.
Petroleum coke is the solid residue obtained in oil refining, which resembles coke, but contains too many impurities to be useful in metallurgical applications.
Gasification Main articles: Coal gasification and Underground coal gasificationCoal gasification can be used to produce syngas, a mixture of carbon monoxide (CO) and hydrogen (H2) gas. Often syngas is used to fire gas turbines to produce electricity, but the versatility of syngas also allows it to be converted into transportation fuels, such as gasoline and diesel, through the Fischer-Tropsch process; alternatively, syngas can be converted into methanol, which can be blended into fuel directly or converted to gasoline via the methanol to gasoline process.
During gasification, the coal is mixed with oxygen and steam while also being heated and pressurized. During the reaction, oxygen and water molecules oxidize the coal into carbon monoxide (CO), while also releasing hydrogen gas (H2).
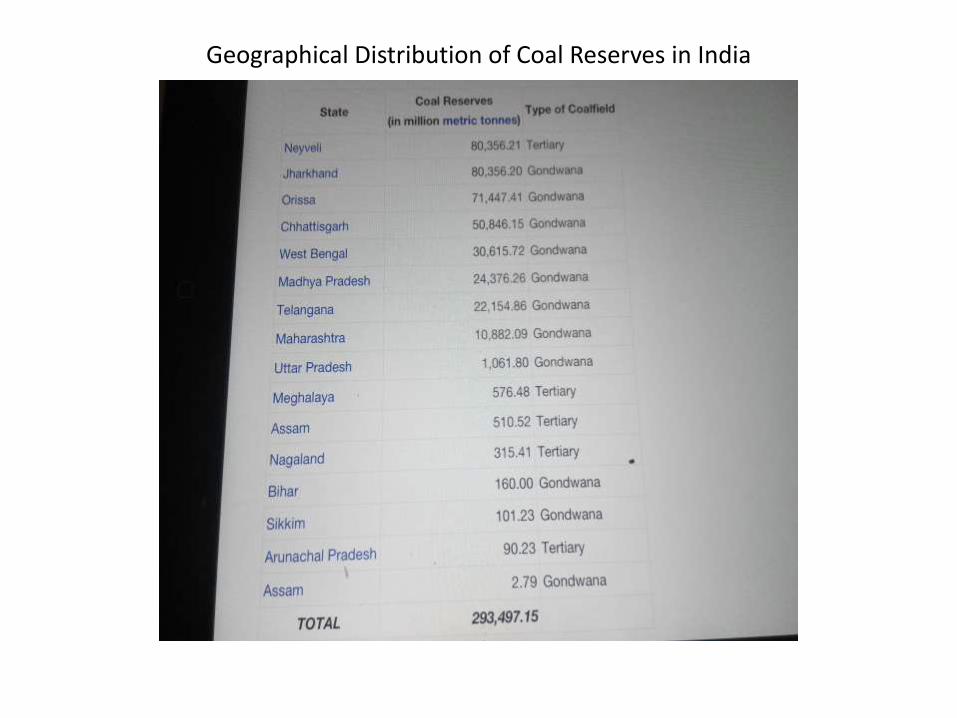
Geographical Distribution of Coal Reserves in India

COAL PRODUCTION & COAL MINE AUCTIONS • Coal scenario as of July 2015
• Coal India's production is expected to reach 560mt this year. New initiatives and revised plan are underway to bring in greater availability of coal and logistics have also been addressed in swapping and switching the coal linkages. Now a new policy is under draft stage to give priority allocation to those power companies who chatter to states/Discoms that are providing for subsidies power tariffs.
• For non- power companies and power companies having no coal linkages following auction methodology has been adopted by Ministry of Coal & Mines:-
• E.auction of. 500mt each through two windows• One for power co. with PPA but no coal linkage• Other for companies with no PPA and no coal linkages• This auction in June 15 , 60 power co. participated and 8 companies participated in reverse
bidding.
• Next round of auction....due in August will be for non-power companies.• Who should get these coal blocks & at What price that's the question that the govt shall not answer
or formulate to answer in isolation , the sectorial dynamics is incorporated but only to the detriment to the down stream price impact on costs , ultimately affecting the availability for the common people at affordable price without creating inflation.

CONTD.
• Major problem with this so called successful auction is that, in the face of acute shortage of coal and across the board Coal block cancellation affecting even the operating mines, very aggressive bidding took place with aggressive quotes except for few like that of JSPL bids which went for scrutiny.
• This aggressive bidding resulted in high revenue for states where these mines are located, but the expectation of large liabilities of the promotorscompanies cannot be ruled out. In some ceases it is said that even the mining cost will be difficult to recover.
• For smaller mines and smaller operators it will be difficult to achieve the economy of scale to mine coal at a viable and yet marketable costs.
• In several of the auctions of operating mines not much of headway was made in bringing back the operation by the new owners.
• Indian coal sector was also marred by poor rake availability. How ever the Rack availability improved dramatically over last one yr to 200 racked/day
• Additional 34 rakes has further been ordered by Coal India.
CHANGING DYNAMICS
This year , the coal shortage and power plant's concerns seam to have taken a new turn.
• Power plants presently have been facing high coal inventories of 20 days as against general norm of 7-10 days) and lower power demand from Discoms even during peak summer this yr, primarily due to Discoms purchasing power issues.
• This is expected a temporary phenomenon , and power ministry working out options with state govts to relieve this problem to max possible extent.
• Problem of no PPA or low PPA or no coal linkage is legacy of previous era of euphemism in power sectors.

CONTD.• Coal imports:::::
• Weakly Coal imports in 2013-14 when the surge in international coal prices were just coming off due to china slowing down, were about 3 mt, 80 % thermal coal & 20% cocking coal & pet coke.
• Major imports and practically all of thermal coal is from Indonesia and South Africa and most of coking coal from Australia. Hardly any thermal coal from Australia , which is off late somewhat improved. But some of coal assets leases procured in Australia by one or two power companies are terminated due to legal & environmental issues.
• Total imports in 2013-14 were around 150 mt ,• Now, although international coal prices are ruling at the bottom, freight also just started rising
from its bottom, but imports are almost stagnant even in thefaceof domestic coal shortages which is primarily due to weak Discoms power demands.
• -Economic down turn & high interest costs coupled to failure of companies to absorb rising input costs ... Forcing companies to down production vs Demand destruction.
• - State Discoms reducing demand of electricity forcing power stations backing down , so much that national PLF reduction 8-9% , 59% national & 67% NTPC
• - As perCERC 2014 tariff order. Only proportionate capacity charge for PLF < 85%
• Now here the PLF < 85% is because of less off take of power by Discoms

WILLFUL DEMAND CONTRACTION BY DISCOMS
B) Case of NTPC. For stations like Dadri, Badarpur, Jhajhhar , coal transportation cost is close to Rs 2 /- unit in the variable cost which is :
• 3.33 for Dadri stage I & for Badarpur• 4.18 for Dadri stage II
• Capacity charge 0.66 for Dadri stage I & 1.48 for Dadri stage II , due to low PLF 65% , 25% less recovery through tariff . Hence fixed cost
• Stage I is 0.90 / stageII 1.88
• Hence cost ex bus becomes Rs4.24/ unit...Dadri Stage I , and for BTPS
• and Rs 5.46 for Dadri stage II
• In the present scenario NTPCs merchant power which is low cost power , will also be difficult to sell even for mine based coal plants.

.


COAL PRODUCTION GROWTH

Oil & Gas scenario • In the year 2006, the country had a mean production of approximately 846,000 barrels per day (bbl/d) of total
oil liquids. Out of this, 103,000 m3/d (648,000 bbl/d) or 77% was petroleum.•
The approximated amount of oil used in the country during 2006 was 418,000 m3/d or 2.63 Mbbl/d.
• The Energy Information Administration (EIA) projected that India posted an increase in oil demand amounting to 16,000 m3/d (100,000 bbl/d) in 2006.
• The petroleum industry in India is controlled by government organizations. Over the past one or two decades, the Government of India took a number of initiatives to lift the regulations from the hydrocarbons sector and encourage higher international participation.
•The petroleum reserves of India, situated in Gujarat, Bombay High (next to the seashore of Maharashtra), eastern Assam, and Rajasthan satisfy about 1/4th of the requirements of the nation.
•Till January 2007, the established oil reserves of the country hold the second biggest volume in the Asia-Pacific territory and India ranks after China in this regard. This is as per statistics provided by EIA (Energy Information Administration), which is a statistical organization of the United States Department of Energy..
• The majority of petroleum reserves of the country lie in the western seashores of the country (including Mumbai High) and also in the northeastern region of India. However, a significant number of unexploited reserves are situated in Rajasthan and close to the coasts of the Bay of Bengal.
•
Contd.• Since the Government of India functions as a net importer of petroleum, it has launched a
number of guiding principles concentrating on enhancing internal oil output and oil excavation operations. In 2000, the Ministry of Petroleum and Natural Gas laid down the New Exploration License Policy (NELP) as a component of this venture.
• This new policy allows overseas corporations to own 100% stake holdings in oil and natural gas ventures. Nonetheless just limited number of regions rich in petroleum deposits are regulated by overseas companies
• The downstream segment of the petroleum industry of India is regulated by state-held corporations as well. In spite of this, private players have expanded their market shares over the last few years.
• India relies significantly on oil imports for fulfilling the usage requirements of the country. The blend of increasing oil usage and somewhat firm production volumes is the main reason behind this.
• Oil & Gas turmoil seen over past one year was not seen earlier since the oil shock of 1971 & 1987. Global Oil Politics, American Surplus Oil & Shale Gas on one side and China slow down & Iran Oil on the other side apart from OPEC resolve not to cut production are the mail culprits of drastic fall.
• India got the windfall gain in terms of industry wide lower input costs( with cascading effects ) & much higher leaverage for the Govt to manage the fiscal deficit.
•

contd• However, despite the great oil cushion , unsaid very tight fiscal discipline observed in 2014-15 and
carryover effects, almost choked the growth in the Industry taking a toll on Power sector as well in-terms of delayed recovery, deleted revival of power demand and hence that of languishing IPPs.
• As of July 2015, the price action of Global Oil & Gas on the face of china slow down, Iran Nuclear deal and US surplus situation, was as below :-
• On the New York Mercantile Exchange, crude oil for delivery in September hit an intraday low of $47.72 a barrel, a level not seen since April 1, before ending at $48.14, down 31 cents, or 0.64%.
• On the week, New York-traded oil futures tumbled $2.97, or 5.99%, the sixth consecutive weekly loss, as worries over high domestic U.S. oil production weighed.
• Nymex oil prices fell to the lowest levels of the session after industry research group Baker Hughes (NYSE:BHI) said late Friday that the number of rigs drilling for oil in the U.S. increased by 21 last week to 659, the most since May.
• Elsewhere, on the ICE Futures Exchange in London, Brent for September delivery declined 65 cents, or 1.18%, to close at $54.62 a barrel after hitting a session low of $54.30, the weakest level since April 2.
• For the week, London-traded Brent futures lost $2.50, or 4.34%, the fourth straight weekly decline, amid concerns a resumption of Iranian oil exports will add to a global glut.

contd• Iran and six world powers reached a long-awaited nuclear deal earlier in the
month that would end sanctions on Tehran in exchange for curbs on the country's disputed nuclear program. Iran reportedly hoards 30 million barrels of oil in its reserves ready for export.
• Global oil production is outpacing demand following a boom in U.S. shale oil production and after a decision by the Organization of Petroleum Exporting Countries last year not to cut production.
• Meanwhile, the spread between the Brent and the WTI crude contracts stood at $6.48 a barrel by close of trade on Friday, compared to $5.89 in the preceding week.
• Concerns over the health of China's economy also weighed. The preliminary reading of the Caixin/Markit manufacturing purchasing managers’ index fell to a 15-month low of 48.2 this month from a final reading of 49.4 in June.
• China is the world's second largest oil consumer after the U.S. and has been the engine of strengthening demand.
• As far as Natural Gas in India is concerned, Till January 2007, the volume of proven natural gas reserves in India was 38 trillion cubic feet (TCF) and this data has been provided by the Oil and Gas Journal. The lion's share of the natural gas output of the country is generated by the western parts of the country near the seashores, especially the Mumbai High area.

Contd.
• Similar to the petroleum exploration industry, the greater part of natural gas output in India is represented by the state-held corporations. OIL (Oil India Ltd.) and ONGC are the major corporations in India in terms of amount of output. At the same time, some international players also participate in upstream operations in collaborations/partnerships and output division agreements.
• Reliance Industries, a privately-held big corporate house in the country, is playing a significant role in the natural gas industry of the country due to a huge natural gas exploration in the river valleys of Krishna and Godavari in 2002.
• The inshore fields in Andhra Pradesh, Assam, and Gujarat are significant generators of natural gas as well. According to EIA (Energy Information Administration) statistics, the amount of natural gas generated by the country in 2004 was 996 billion cubic feet.
• The country is an importer of a nominal amount of natural gas. It used approximately 1,089x109 cubic feet (3.08x10¹⁰ m3) of natural gas. This was the same year when India demonstrated net imports of natural gas. The amount of liquefied natural gas imported from Qatar in 2004 was 93x109 cubic feet or 2.6x10⁹ m3. Liquefied natural gas is also termed as LNG.

contd
• GAIL or the Gas Authority of India Ltd. has a considerable command on natural gas supply and distribution operations. The Union Minister of Petroleum and Natural Gas introduced a new plan which permits private India-based corporations, overseas sponsors, and other country-based oil corporations to own to the extent of 100% holdings in pipeline ventures. This was introduced in the month of December 2006.
• Though the control of GAIL on natural gas supply and distribution is not backed by law, the company will keep on being the major participant in the industry due to its current natural gas network.
• Now Indian govt. ( ONGC ) is going to bid for acquiring USD 8.8 billion worth of gas fields globally.
• The great fall in Gas prices on one hand has vindicated the Govt action of not agreeing to earlier demand of USD 8.0
• But at the same time to look for better models to ramp up national gas production instead of investing globally.

THANK YOU
By Rakesh Kumar, MD, Rashmi Rooftop Solar Power & ex GM-NTPCEmail: [email protected]: 9891300686