presentación de powerpoint - sds-was.aemet.es filetraining course on wmo sds-was products 10-14 nov...
TRANSCRIPT

Training Course on WMO SDS-WAS products
10-14 Nov 2018, Ahvaz
Sergio Rodríguez
Experimental Station of Arid Zones, CSIC-EEZA
EEZA, Estación Experimental de Zonas ÁridasCSIC, Consejo Superior de Investigaciones Científicas
National Research Council of Spain Experimental Station of Arid Zones
dust impact on health in urban areas:
an overview & new directions

respiratory diseases
cardiovascular diseases
exposure to dust vs dust + pollutants in urban air
summary and recommendations

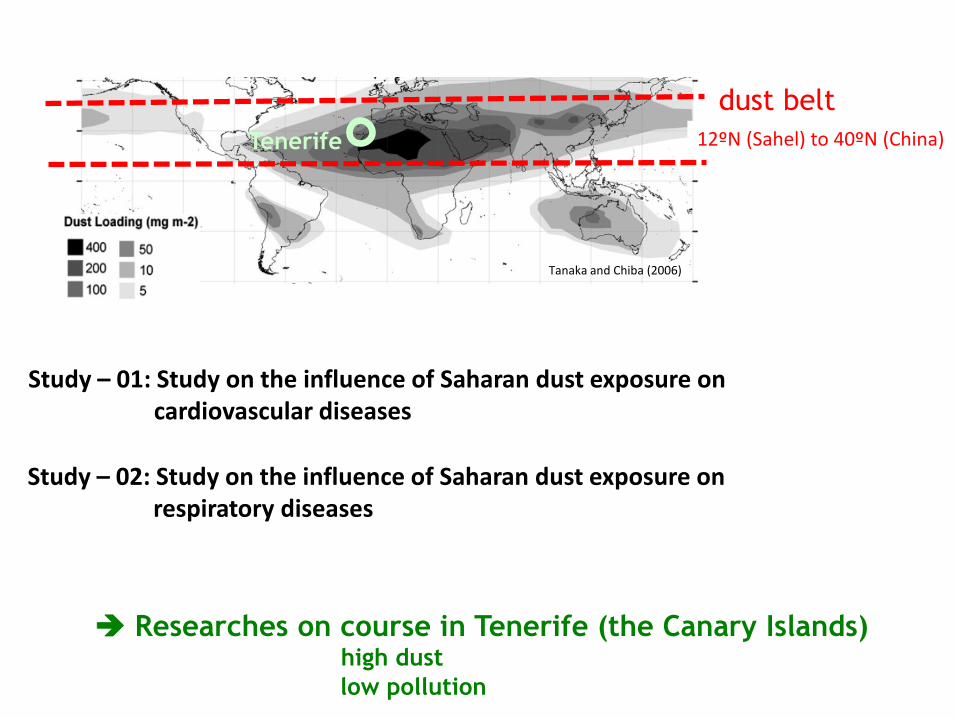
Tanaka and Chiba (2006)
dust belt
12ºN (Sahel) to 40ºN (China)

Tanaka and Chiba (2006)
1000
Longueville et al. (2010)
1
Dust Emissions, Tg ·y-1
dust
belt

health effects studies ≥ 1990s
Air Quality Standards PM10 and PM2.5
PM10
PM2.5
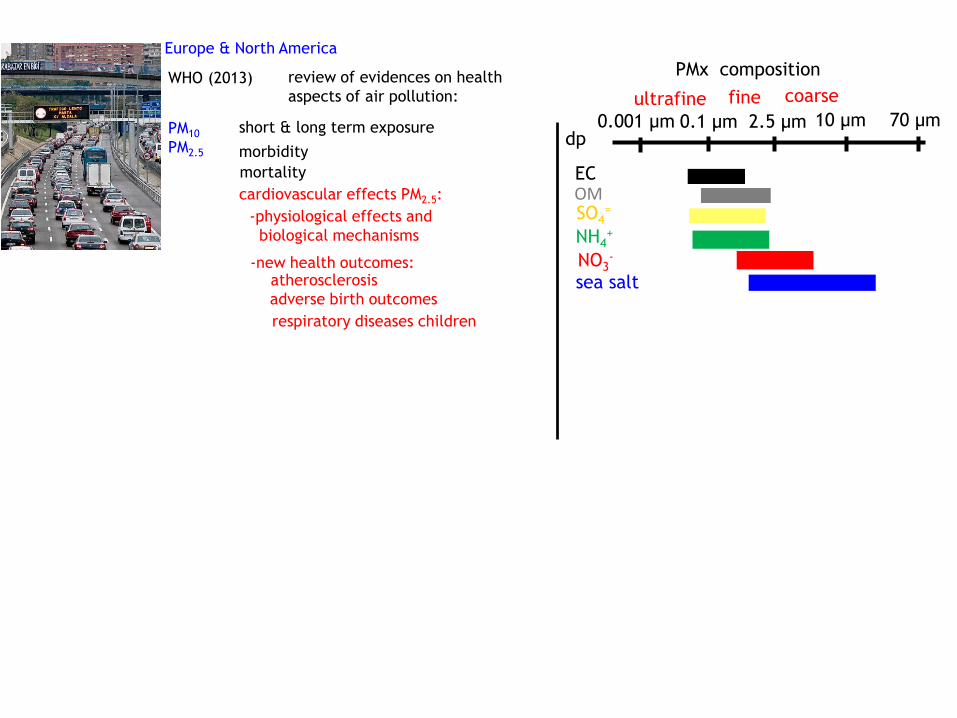
Europe & North America
WHO (2013) review of evidences on health
aspects of air pollution:
morbidity
mortality
short & long term exposure
cardiovascular effects PM2.5:
-physiological effects and
biological mechanisms
-new health outcomes:atherosclerosis
adverse birth outcomes
respiratory diseases children
70 µm0.001 µm 0.1 µm 2.5 µm 10 µm
fine coarseultrafine
dp
ECOMSO4
=
NH4+
NO3-
sea salt
PMx composition

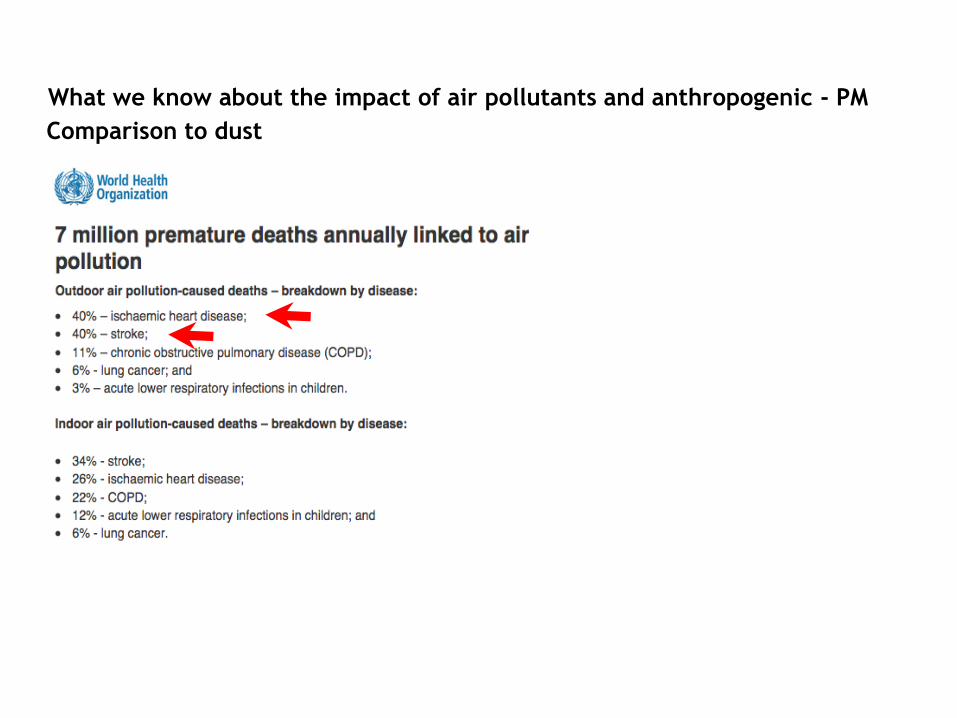
What we know about the impact of air pollutants and anthropogenic - PM
Comparison to dust

PM10
PM2.5
Europe & North America
WHO (2013) review of evidences on health
aspects of air pollution:
morbidity
mortality
short & long term exposure
cardiovascular effects PM2.5:
-physiological effects and
biological mechanisms
-new health outcomes:atherosclerosis
adverse birth outcomes
respiratory diseases children‘cities in the dust
belt’
PM10
PM2.5
North Africa, Middle East, Asia,
dust
70 µm0.001 µm 0.1 µm 2.5 µm 10 µm
fine coarseultrafine
dp
EC
OMSO4
=
NH4+
NO3-
sea salt
PMx composition
health effects due to
exposure to pollutants
+ dust mixing ?

people live in cities and breath
a cocktail dust + pollutants

respiratory diseases
cardiovascular diseases
exposure to dust vs dust + pollutants in urban air
summary and recommendations

respiratory diseases, Asia

respiratory diseases, Asia

respiratory diseases, Americas
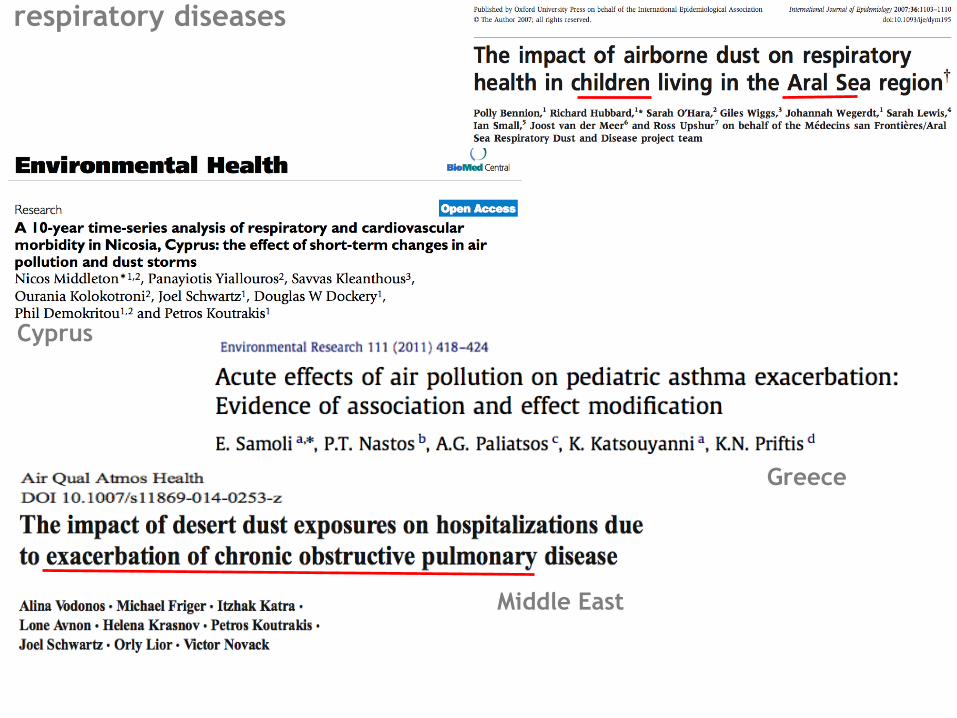
respiratory diseases
Cyprus
Greece
Middle East
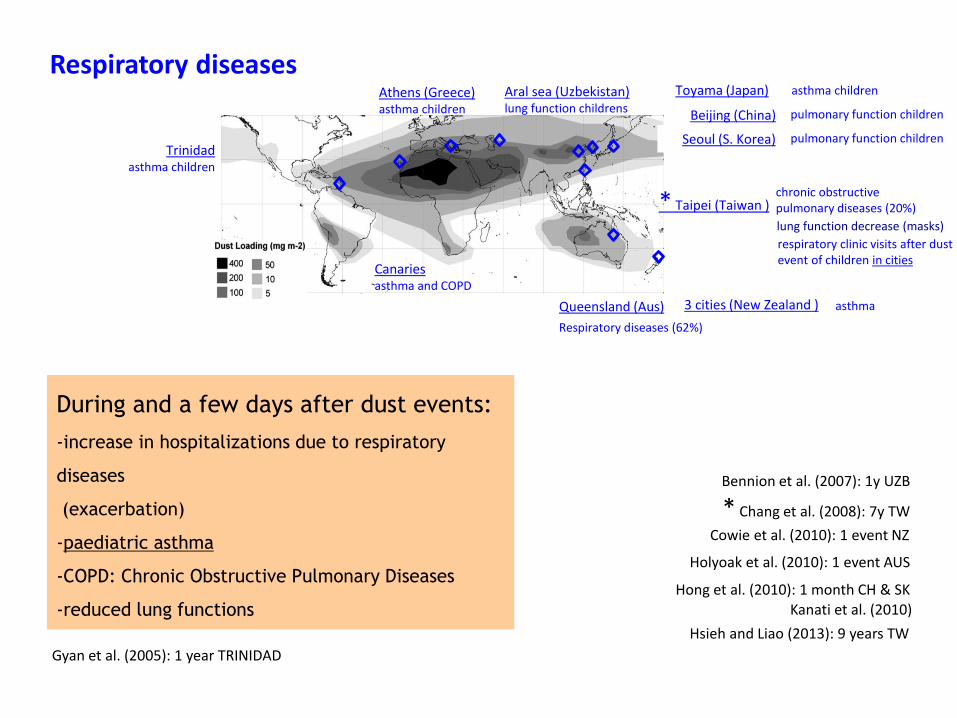
Respiratory diseasesAral sea (Uzbekistan)lung function childrens
pulmonary function children
* Taipei (Taiwan )chronic obstructivepulmonary diseases (20%)
Toyama (Japan)
3 cities (New Zealand )
Respiratory diseases (62%)
Seoul (S. Korea)
asthma children
pulmonary function childrenBeijing (China)
Cowie et al. (2010): 1 event NZ
Bennion et al. (2007): 1y UZB
Kanati et al. (2010)
Holyoak et al. (2010): 1 event AUS
Queensland (Aus) asthma
Hong et al. (2010): 1 month CH & SK
Athens (Greece)asthma children
lung function decrease (masks)
* Chang et al. (2008): 7y TW
Hsieh and Liao (2013): 9 years TW
respiratory clinic visits after dust event of children in cities
Trinidadasthma children
Gyan et al. (2005): 1 year TRINIDAD
Canariesasthma and COPD
During and a few days after dust events:
-increase in hospitalizations due to respiratory
diseases
(exacerbation)
-paediatric asthma
-COPD: Chronic Obstructive Pulmonary Diseases
-reduced lung functions
respiratory diseases
cardiovascular diseases
exposure to dust vs dust + pollutants in urban air
summary and recommendations
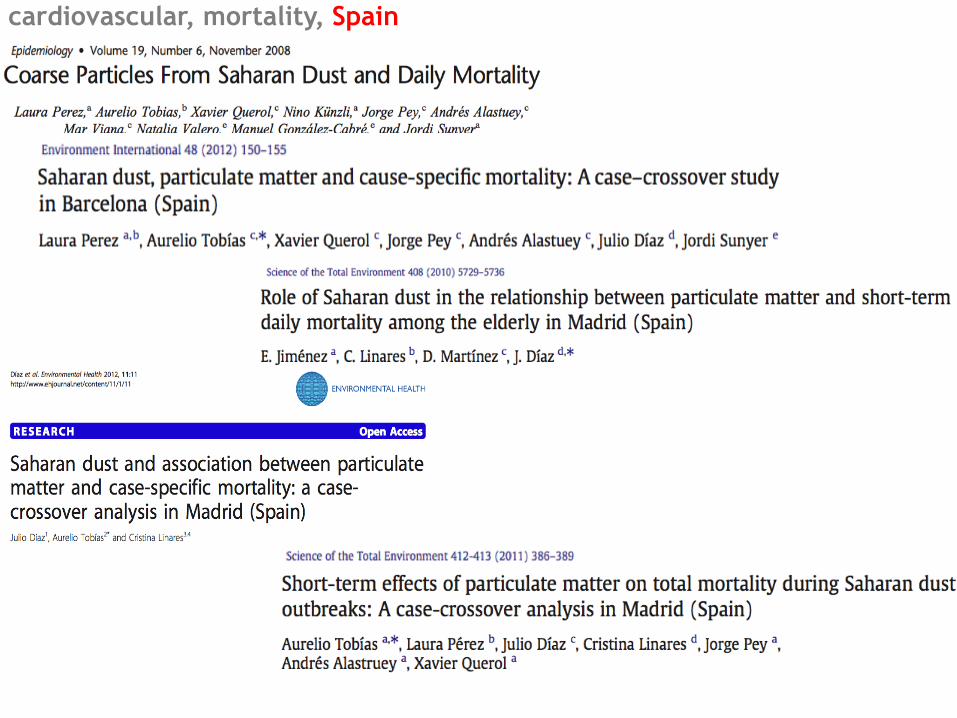
cardiovascular, mortality, Spain

cardiovascular, mortality, Italy

cardiovascular, mortality, Asia
...there more studies

Pérez et al. (2012)
-no associated with PM2.5
respiratory & cardiovascular mortality is associated with:
Barcelona
10 µg/m3 of PM10-2.5
mortality by:8.4% Saharan dust days1.4% non-Saharan dust days
Pérez et al. (2008)~25000 deaths
Madrid
-PM10 Saharan dust days,
10 µg/m3 of PM10-2.5
mortality by:2.8% in Saharan dust days0.6% non-dust days
-associated with PM2.5-10
Jiménez et al. (2010)
Tobias et al. (2011a)
Jiménez et al. (2012)
cardiovascular mortality:
-PM2.5 not Saharan dust days,
Mallone et al. (2011)
Rome
19.8 µg/m3 PM10
cardiac mortality:9.55% Saharan dust days3.50% no dust days
4 years
10.8 µg/m3 PM2.5-10
cardiovascular mortality:9.73% Saharan dust days0.86% no dust days
Increase ()
Sajani et al. (2011)
respiratory mortalityfor elderly people (≥75y)
during Saharan dust eventswith respect no dust events.
Emilia Romagna
22% in the whole year34% in summer
no modification of dust eventson the concentration-responserelationship between PM10 anddaily deaths
4 years
Mortality & cardiovascular diseases
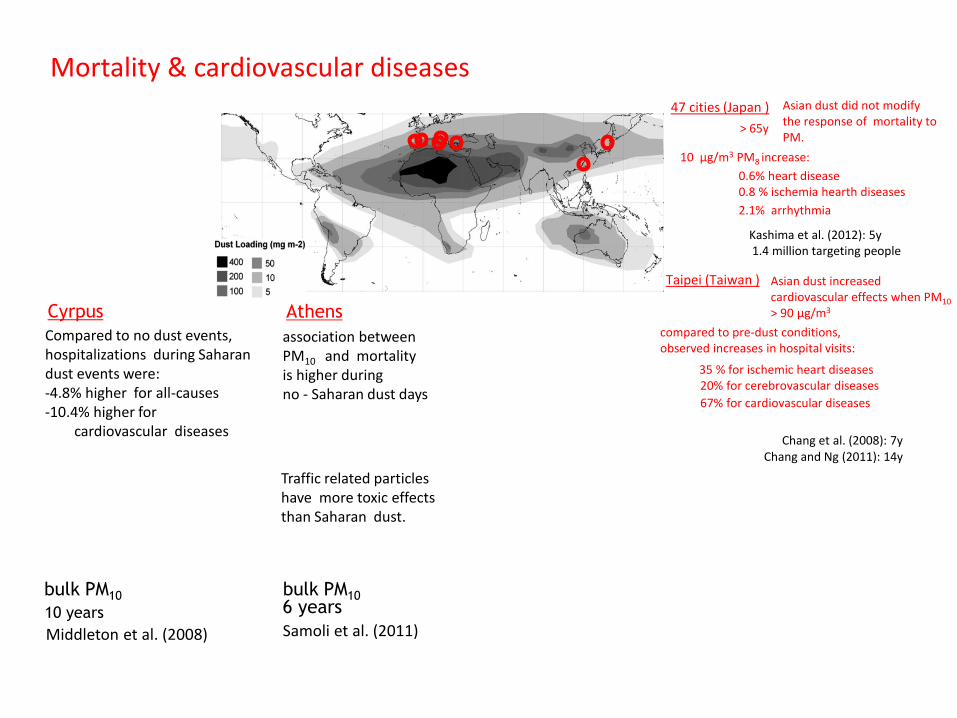
10 µg/m3 PM8 increase:
47 cities (Japan )
Kashima et al. (2012): 5y 1.4 million targeting people
0.8 % ischemia hearth diseases
2.1% arrhythmia
Asian dust did not modifythe response of mortality to PM.
> 65y
0.6% heart disease
Chang and Ng (2011): 14y
67% for cardiovascular diseases
Taipei (Taiwan )
compared to pre-dust conditions, observed increases in hospital visits:
Chang et al. (2008): 7y
Asian dust increased cardiovascular effects when PM10
> 90 µg/m3
35 % for ischemic heart diseases20% for cerebrovascular diseases
Athens
Samoli et al. (2011)
association between PM10 and mortality is higher during no - Saharan dust days
6 years
Traffic related particles have more toxic effects than Saharan dust.
Cyrpus
bulk PM10
Middleton et al. (2008)
10 years
Compared to no dust events,hospitalizations during Saharandust events were:-4.8% higher for all-causes-10.4% higher for
cardiovascular diseases
bulk PM10
Mortality & cardiovascular diseases
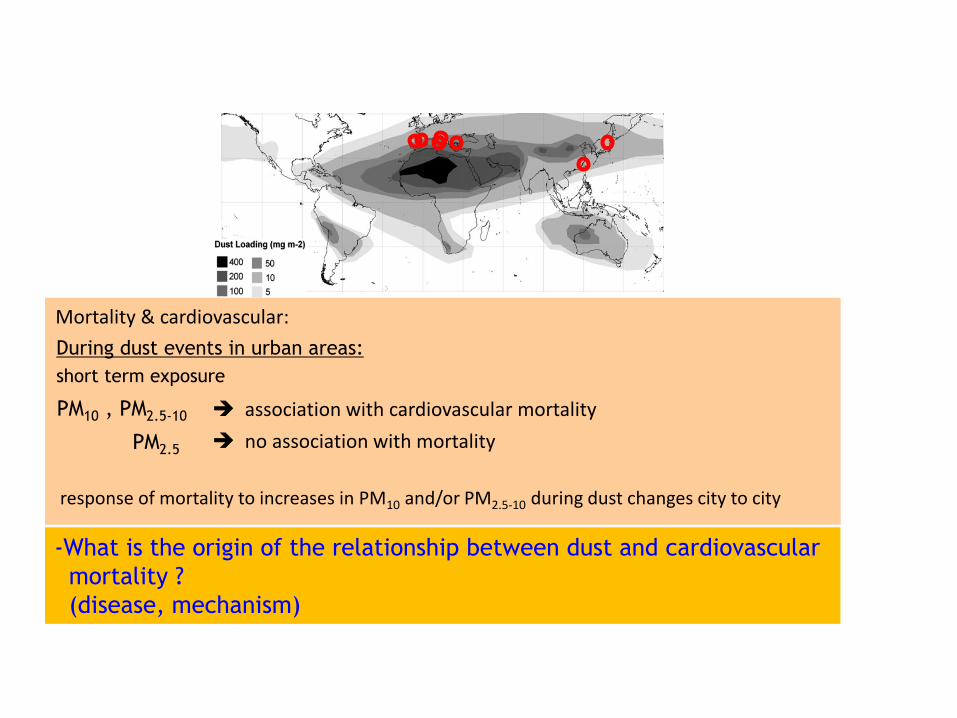
During dust events in urban areas:
PM10 , PM2.5-10
PM2.5
➔ association with cardiovascular mortality
➔ no association with mortality
response of mortality to increases in PM10 and/or PM2.5-10 during dust changes city to city
short term exposure
Mortality & cardiovascular:
-What is the origin of the relationship between dust and cardiovascular
mortality ?
(disease, mechanism)

respiratory diseases
cardiovascular diseases
exposure to dust vs dust + pollutants in urban air
Summary and recommendations

people live in cities and breath
a cocktail dust + pollutants
Some considerations:
1. In cities, people is exposed to a permanent high background of pollution (NO2,
SO2, soot black carbon, organics, etc..), this may be masking actual health
effects of dust in the studies performed in Southern Europe. Increases in
mortality during dust events may be prompted by the already damaged health
of people because of permanent exposure to high background levels of
pollutants.
3. Exposure to dust+pollutants may be worse than simple exposure to dust
2. Levels of local urban & industrial pollutants may be higher during dust-days
than during none-dust-days

Tenerife, Canary Islands
0
5
10
15
20
25
30
35
40
45
50
10
0
96
92
88
84
79
75
71
67
63
59
55
51
47
42
38
34
30
26
22
18
14
10 5 1
PM
2.5
, µ
g/m
3
Percentil
gravimetria - suma de fuentes
Marino
Mineral
Barcos
Refineria
Vehiculos
B)
0
10
20
30
40
50
60
70
80
90
1001
00
96
92
88
86
82
78
74
68
64
61
57
53
49
45
41
37
33
29
25
22
18
13 9 5 3
PM
10
, µ
g/m
3
Percentil
gravimetria - suma de fuentes
Marino
Mineral
Barcos
Refineria
Automóviles
B) sea salt
vehicle
exhausts
oil refineryships
dust
350
PMx = pollutants + dust
there is more pollution when there is dust
due to:
-Adverse meteorological conditions for
dispersion of pollutants during dust events
(observed in Mediterranean and Atlantic
cities)
-Reaction of local urban/industrial pollutants
with dust, resulting in dust coating by
pollutants (sulphate, nitrate, etc.)
heterogeneous reactions between dust and pollutants
HNO3 + CaCO3 [dust] → CaNO3 + .....
H2SO4 + CaCO3 [dust] → CaSO4 + .....
coating of find and coarse dust particles by pollutantsreactivity of the surface of dust particles

people live in cities and breath
a cocktail dust + pollutants
Some considerations:
1. In cities, people is exposed to a permanent high background of pollution (NO2,
SO2, soot black carbon, organics, etc..), this may be masking actual health
effects of dust in the studies performed in Southern Europe. Increases in
mortality during dust events may be prompted by the already damaged health
of people because of permanent exposure to high background levels of
pollutants.
3. Exposure to dust+pollutants may be worse than simple exposure to dust
2. Levels of local urban & industrial pollutants may be higher during dust-days
than during none-dust-days

a 7y study:
In Taiwan, an increase in children respiratory clinic visits is
observed just after Asian dust events. However, the relative
increase is higher in urban than in rural areas.
Yu et al. (2013). Environ. Int (54), 35-44.
Does the presence of pollutants increase
the sensitivity to dust exposure ?
Then, emissions of urban and industrial
pollutants should be reduced during dust
days
example-1

respiratory diseases
cardiovascular diseases
exposure to dust vs dust + pollutants in urban air
Summary and recommendations

Health effects
3. Heart diseases observed in urban areas of European-Mediterranean and Asia.
Europe, North America and Asia ➔ PM10 and PM2.5 = pollutants
dust belt (North Africa, Middle East, West Asia to Asia )
➔ PM10 and PM2.5 = dust + pollutants
1. health effects in the context of air quality
2. Respiratory diseases. Short time effects-increase in hospitalizations due to respiratory diseases (exacerbation)-paediatric asthma-COPD: Chronic Obstructive Pulmonary Diseases -reduced lung functions
-increase in hospitalizations due to cardiovascular diseases
PM10 and PM2.5-10: association with cardiovascular mortality
-response of mortality to increases in PM10 and/or PM2.5-10 during dust changes city to city
-mechanisms by which dust exposure increase cardiovascular mortality is still unknown.More Research is needed ➔ countries of the dust belt plays a key role

Longueville et al. (2010)
number of scientific papers on the impact of dust on air quality 1999-2009
2% Middle East to West Asia
1) 49% Asian dustChina, Taiwan,Southern Korea
Gobi desert
1% North African countries
2) 39% North African dust37% Europe23% Spain
9% North America
1% Latin AmericaOceania
More studies on dust and health effect are needed in the
dust belt

Tanaka and Chiba (2006)
1000
Longueville et al. (2010)
1
Dust Emissions, Tg ·y-1
dust belt
12ºN (Sahel) to 40ºN (China)

Tanaka and Chiba (2006)
Longueville et al. (2010)
dust belt
12ºN (Sahel) to 40ºN (China)
• European part of the Mediterranean: pollutants + dust (20 – 30 μg/m3)
• Asia: pollutants + dust (80 – 100 μg/m3)
• North Africa + Middle East + West Asia: pollutants + dust ( 103 – 104 μg/m3)
Dust concentrations are much higher in North Africa, Middle East and
Western Asian cities
➔ Implication to health effects, differentiated with respect to Europe
➔ More research and measurements needed in the dust belt
What we know about the impact of air pollutants and anthropogenic - PM
Comparison to dust

What we know about the impact of air pollutants and anthropogenic - PM
Comparison to dust
1. Studies focused on understanding the mechanisms by which PM-pollution
cause hearth diseases:

Tanaka and Chiba (2006)
Longueville et al. (2010)
dust belt
12ºN (Sahel) to 40ºN (China)
• European part of the Mediterranean: pollutants + dust (20 – 30 μg/m3)
• Asia: pollutants + dust (80 – 100 μg/m3)
• North Africa + Middle East + West Asia: pollutants + dust ( 103 – 104 μg/m3)
Dust concentrations are much higher in North Africa, Middle East and
Western Asian cities
➔ Implication to health effects, differentiated with respect to Europe
➔ More research and measurements needed in the dust belt
➔ Researches on course in Tenerife (the Canary Islands)
Tanaka and Chiba (2006)
dust belt
12ºN (Sahel) to 40ºN (China)
➔ Researches on course in Tenerife (the Canary Islands)high dust
low pollution
Study – 01: Study on the influence of Saharan dust exposure oncardiovascular diseases
Study – 02: Study on the influence of Saharan dust exposure onrespiratory diseases
Tenerife

AEMET, Agencia Estatal de Meteorología 39
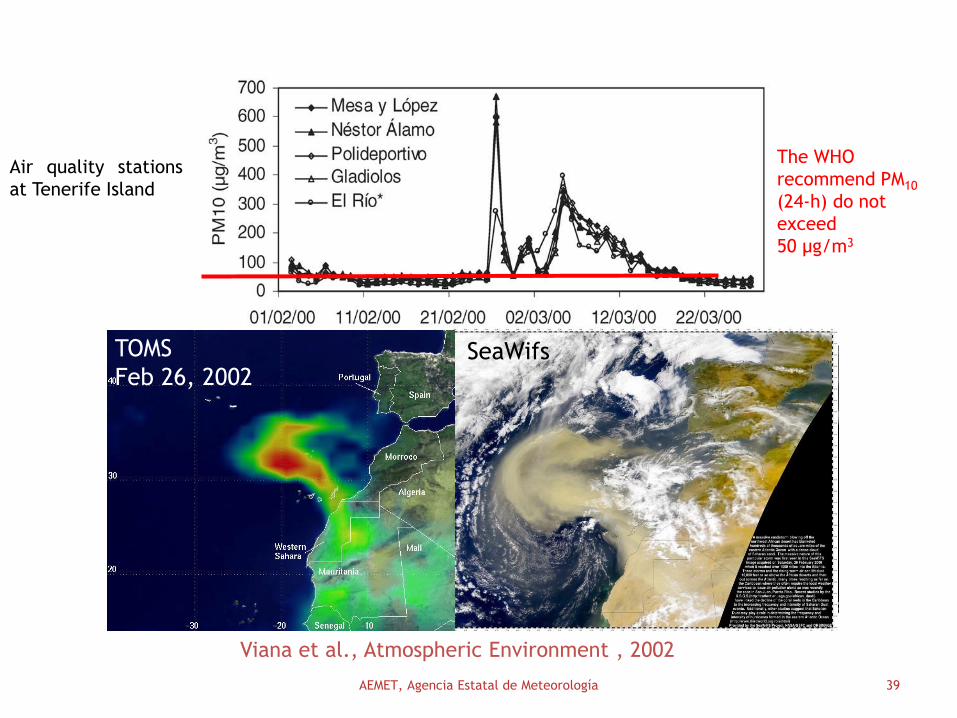
Viana et al., Atmospheric Environment , 2002
SeaWifsTOMS
Feb 26, 2002
Air quality stations
at Tenerife Island
The WHO
recommend PM10
(24-h) do not
exceed
50 μg/m3

Study on the influence of Saharan dust exposureon cardiovascular diseases
Study – 01:
objetive:HEART DISEASES:-acute coronary syndrome-arrhythmia-hearth failure-stroke-ischemic heart disease....-what is the profile of the people affected by dust ?
Alberto Dominguez-Rodriguez, Nestor Baez-Ferrer, Sergio Rodríguez,Pablo Avanzas, Pedro Abreu-Gonzalez, Emilio Cuevas
-Hospital University of Canary Islands-CSIC, Research Council of Spain
-AEMET, Meteorological State Agency of Spain

Study on the influence of Saharan dust exposureon cardiovascular diseases
Study – 01:
objetive:HEART DISEASES:-acute coronary syndrome-arrhythmia-hearth failure-stroke-ischemic heart disease....-what is the profile of the people affected by dust ?
the heart doesn’t pump enough
the question to address:why some people affected by hearth failure die some days after the hospital admission ?

Study on the influence of Saharan dust exposureon cardiovascular diseases
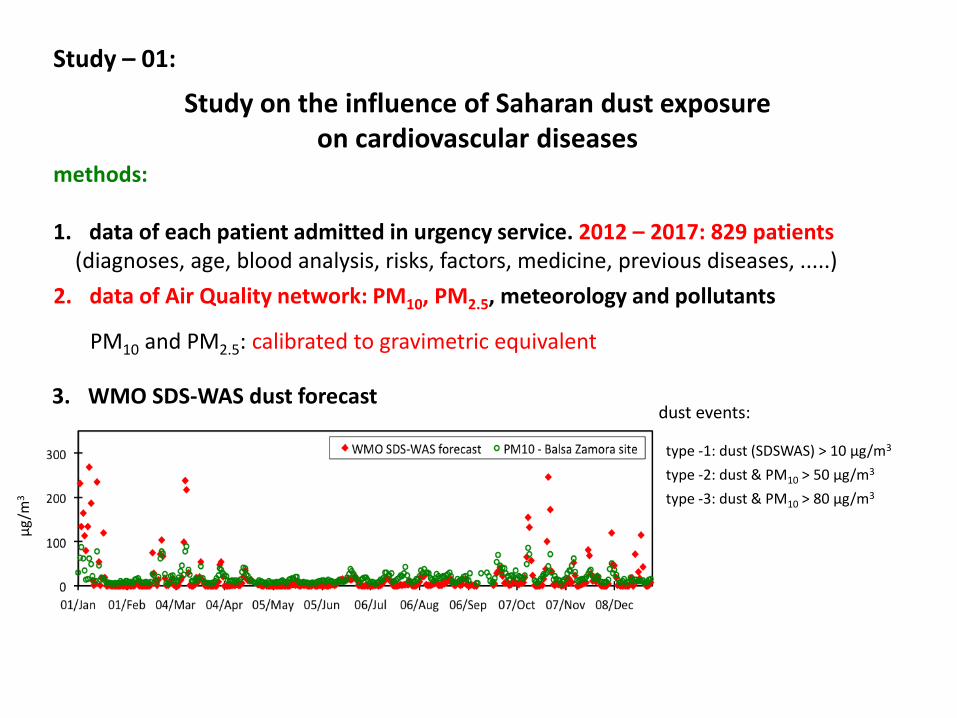
Study – 01:
methods:
1. data of each patient admitted in urgency service. 2012 – 2017: 829 patients(diagnoses, age, blood analysis, risks, factors, medicine, previous diseases, .....)

Study on the influence of Saharan dust exposureon cardiovascular diseases
Study – 01:
2. data of Air Quality network: PM10, PM2.5, meteorology and pollutants
PM10 and PM2.5: calibrated to gravimetric equivalent
methods:
1. data of each patient admitted in urgency service. 2012 – 2017: 829 patients(diagnoses, age, blood analysis, risks, factors, medicine, previous diseases, .....)
Study on the influence of Saharan dust exposureon cardiovascular diseases
Study – 01:
3. WMO SDS-WAS dust forecast
methods:
1. data of each patient admitted in urgency service. 2012 – 2017: 829 patients(diagnoses, age, blood analysis, risks, factors, medicine, previous diseases, .....)
2. data of Air Quality network: PM10, PM2.5, meteorology and pollutants
PM10 and PM2.5: calibrated to gravimetric equivalent
μg
/m3
dust events:
type -1: dust (SDSWAS) > 10 μg/m3
type -2: dust & PM10 > 50 μg/m3
type -3: dust & PM10 > 80 μg/m3

Study on the influence of Saharan dust exposureon cardiovascular diseases
Study – 01:
3. WMO SDS-WAS dust forecast
methods:
1. data of each patient admitted in urgency service. 2012 – 2017: 829 patients(diagnoses, age, blood analysis, risks, factors, medicine, previous diseases, .....)
2. data of Air Quality network: PM10, PM2.5, meteorology and pollutants
PM10 and PM2.5: calibrated to gravimetric equivalent
data analysis:
SPSS statistical package
-test: (i) U de Mann-Whitney, (ii) test t – Student and (iii) ji ^2 or -Fischer
-association with (intra-hospital) mortality: multi-variable logic regression

P < 0.01 ➔ statistically significant
Results:

✔
✔✔
✔
P < 0.01 ➔ statistically significant
Results:

✔
Elderly people (70 years old) increased risk of mortality during intense dust events (> 50 μg/m3)
Profile 01:
What to do now:
Conclusion:
Use the dust forecasts of SDSWAS to alert this people (profile 01) when a dust event > 50 μg/m3 will occur.
understand the mechanism by which dust promote heart failure and develop preventive medical treatment
P < 0.01 ➔ statistically significant
Results:

Study on the influence of Saharan dust exposureon respiratory diseases
Study – 02:
objetive:RESPIRATORY DISEASES:-asthma-COPD: Chronic Obstructive Pulmonary Disease....-what is the specific impact / damages ?
Study – 02:
methods:
1. data of 50 patient that participated in the study. Sep- Oct 2018(diagnoses, age, blood analysis, risks, factors, medicine, previous diseases, .....)
Study on the influence of Saharan dust exposureon respiratory diseases
Maximum breathing outflow, test control asthma, questionaries' asthma, accomplish ofthe medical treatment, exacerbation e hospital admission
data collected in the morning and in the evening and transmitted with an app in the cellphone

Study – 02:
methods:
1. data of 50 patient that participated in the study NEUMOCAN. Sep- Oct 2018(diagnoses, age, blood analysis, risks, factors, medicine, previous diseases, .....)
Study on the influence of Saharan dust exposureon respiratory diseases
data collected in the morning and in the evening and transmitted with an app in the cellphone
2. data of Air Quality network: PM10, PM2.5, meteorology and pollutants
PM10 and PM2.5: calibrated to gravimetric equivalent
Maximum breathing outflow, test control asthma, questionaries' asthma, accomplish ofthe medical treatment, exacerbation e hospital admission

Study – 02:
methods:
1. data of 50 patient that participated in the study NEUMOCAN. Sep- Oct 2018(diagnoses, age, blood analysis, risks, factors, medicine, previous diseases, .....)
Study on the influence of Saharan dust exposureon respiratory diseases
data collected in the morning and in the evening and transmitted with an app in the cellphone
3. WMO SDS-WAS dust forecast
2. data of Air Quality network: PM10, PM2.5, meteorology and pollutants
PM10 and PM2.5: calibrated to gravimetric equivalent
μg/
m3
dust events:
type -1: dust (SDSWAS) > 10 μg/m3
type -2: dust & PM10 > 50 μg/m3
type -3: dust & PM10 > 80 μg/m3
Maximum breathing outflow, test control asthma, questionaries' asthma, accomplish ofthe medical treatment, exacerbation e hospital admission

thank you
μg
/m3
• a decrease 28 ml in the maximum expiratory flow was registered
Dust events:
Results:
6 dust events occurred 1 intense dust event (≈200 μg/m3)
• recovery to regular condition 72h after the event
• during the dust event, the number of patients suffering asthma – wheezing, dyspnoea, thoracic oppression and of need of medication, multiplied by 2, compared to regular conditions
What to do now:
Use the dust forecasts of SDSWAS to alert this people (profile 01) when a dust event > 50 μg/m3 will occur.
understand the mechanism by which dust promote heart failure and develop preventive medical treatment

thank you