presentación de powerpoint - metro de santiago · metro - among the 14 leading subway systems in...
TRANSCRIPT
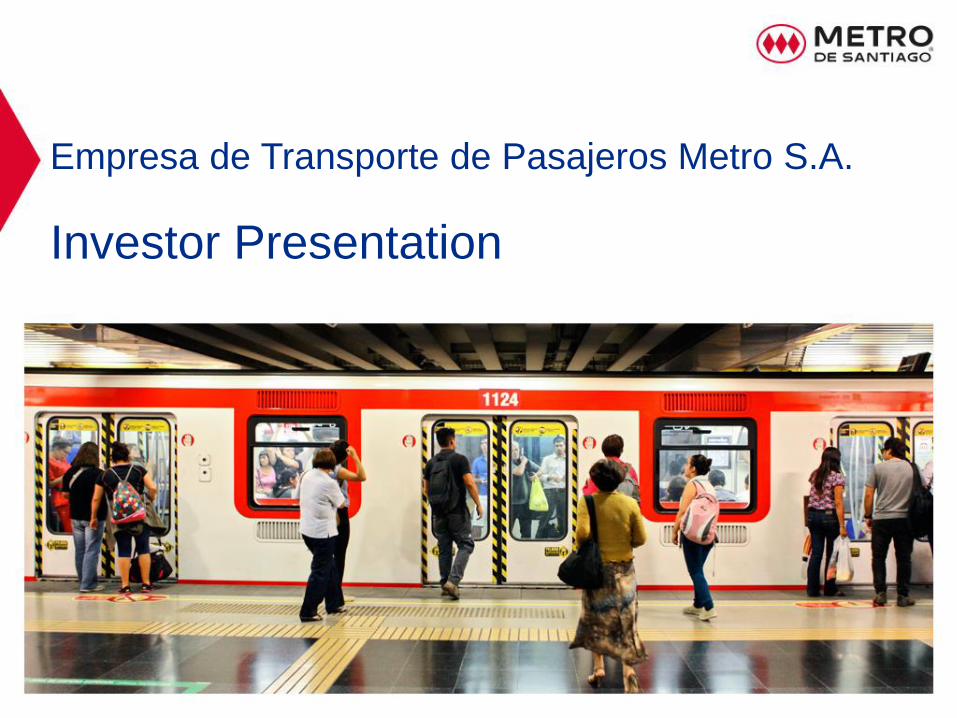
Empresa de Transporte de Pasajeros Metro S.A.
Investor Presentation

Metro at a glance
Key Investment Considerations
Financial Information

Metro Serves as the Backbone of Mass Transit in
Santiago
Metro owns and operates the entire underground
transportation system in Santiago, Chile
100% state-owned enterprise
Part of Transantiago, the city’s integrated public transport
system
To December 2014, 63% of all daily trips on public
transportation in Santiago use Metro
Current key subway network statistics:
o 103 kilometers of track and 108 stations on 5 lines
o 156 trains (1,093 cars)
o 2.4 million trips per workday
o 667.6 million passengers in 2014
Financial highlights:
o To December 2014 revenues of USD 464 million,
adjusted Ebitda and operating profit of USD 131
million and USD 9 million, respectively
o USD 6 billion in assets
o No subsidy required to generate an operating
surplus
Metro Overview Metro’s current network
3
Note: We define adjusted EBITDA as gross profit less administrative expenses plus depreciation and amortization

Metro’s Corporate History
2008, Metro
celebrates its 40th
anniversary
In 1968, President
Eduardo Frei
Montalva signed
the decree that
gave birth to Metro
In May 1975, the first
test trip took place
between “San Pablo”
station and “Estacion
Central” in Santiago.
Metro’s official
operations begin
In 1989, Metro
becomes a closed
stock corporation
and is registered
with the Chilean
Securities
Commission
(SVS). A board of
directors is
appointed to report
to its shareholders
Between 2010
and 2011
important
developments
begin at Metro,
with major line
extensions
2013-2018,
improvements to
existing lines and
construction of
lines 6 and 3
4
1997 Metro begins
operation of line 5
July 2011, Metro
announces the
construction of two
additional lines
In 2007, Metro
joins Transantiago,
the new integrated
transportation
system for the
capital city
In 2005, Metro
starts operating
lines 4 and 4A
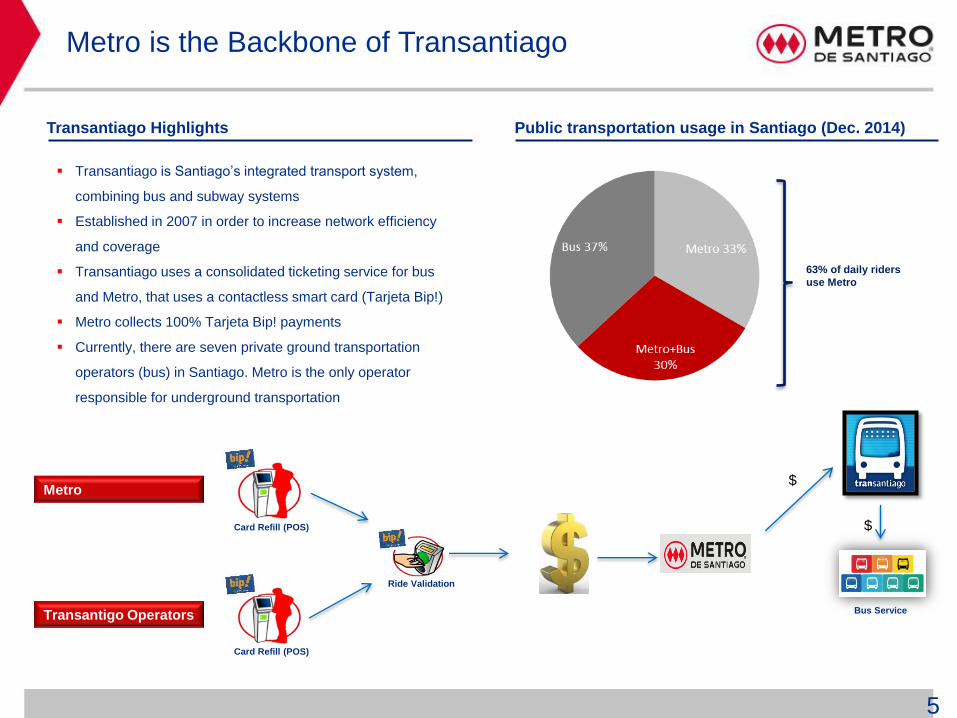
Metro is the Backbone of Transantiago
Transantiago is Santiago’s integrated transport system,
combining bus and subway systems
Established in 2007 in order to increase network efficiency
and coverage
Transantiago uses a consolidated ticketing service for bus
and Metro, that uses a contactless smart card (Tarjeta Bip!)
Metro collects 100% Tarjeta Bip! payments
Currently, there are seven private ground transportation
operators (bus) in Santiago. Metro is the only operator
responsible for underground transportation
Public transportation usage in Santiago (Dec. 2014)
Bus Service
Metro $
Transantiago Highlights
5
63% of daily riders
use Metro
$
Transantigo Operators
Card Refill (POS)
Card Refill (POS)
Ride Validation

Metro Grows Continuously to Serve Santiago
Project 63 & Network Strengthening Program (NSP) Planned layout for lines 6 and 3
6
Project 63, or the construction of new lines 6 & 3, is the
most significant undertaking and expansion effort in
Metro’s history
o 28 new stations and 37 kilometers of track
extensions
o Driverless trains
o Improved security by additional cameras in trains
and stations
o Overhead power line installation
o State-of-the-art information system for passengers
and workers
Total estimated investment of USD 2.8 billion
o 2/3 financed with government equity contributions
o 1/3 financed: Bond 144A/REG-S for USD 500
Million, Commercial Bank Facility Agreement for
USD 250 Million and ECA Multisource Facility
Agreement for USD 550 Million

126 new cars to be added to lines 1, 2 and 5 representing
a 20% increase in the total fleet for those lines
Air conditioning to be installed in all line 1 cars, and 60% of
line 2 and 5 cars
Refurbishment of NS74 trains (Metro’s oldest operating
trains), extending their useful life by 20 years (1/4 of the
current fleet)
New elevator access throughout the Metro network
Metro is upgrading the signaling system used on line 1
improve headway between trains
Metro Grows Continuously to Serve Santiago
Current and Upcoming Improvement Projects
7

Metro at a glance
Key Investment Considerations
Financial Information

Metro Benefits from Chile’s Growth and Stability
Source: World Bank and INE
(*) The International Rating Metro was recently ratified (04/17/15 Fitch, S & P 2/23/15)
The Government of Chile owns 100% of Metro
Ministerio
de Hacienda
State agency promoting
entrepreneurship and
innovation
Metro enjoys a stable economic backdrop
(po
pu
lati
on
in
mil
lio
ns
)
(po
pu
lati
on
in
mil
lio
ns
)
9
• Chile is the highest rated Latin American country
• Chile provides Metro with a stable political and regulatory
environment in an open economy with robust growth
• Unemployment and GDP figures 2011 – 2014:
17.2 17.3
17.5
16.0
16.5
17.0
17.5
18.0
2010 2011 2012
6.0 6.0 6.1
5.5
6.0
6.5
2010 2011 2012
Chile Santiago
• The Government of Chile regularly makes capital
contributions to Metro
• Demographics 2010 – 2012:
Chile’s Sovereign Credit Ratings
Agency Rating Outlook
Moody's Aa3 Stable
S&P AA- Stable
Fitch A+ Stable
Metro’s Credit Ratings
Agency Rating Outlook
Moody's - -
S&P (*) AA- Stable
Fitch (*) A Stable
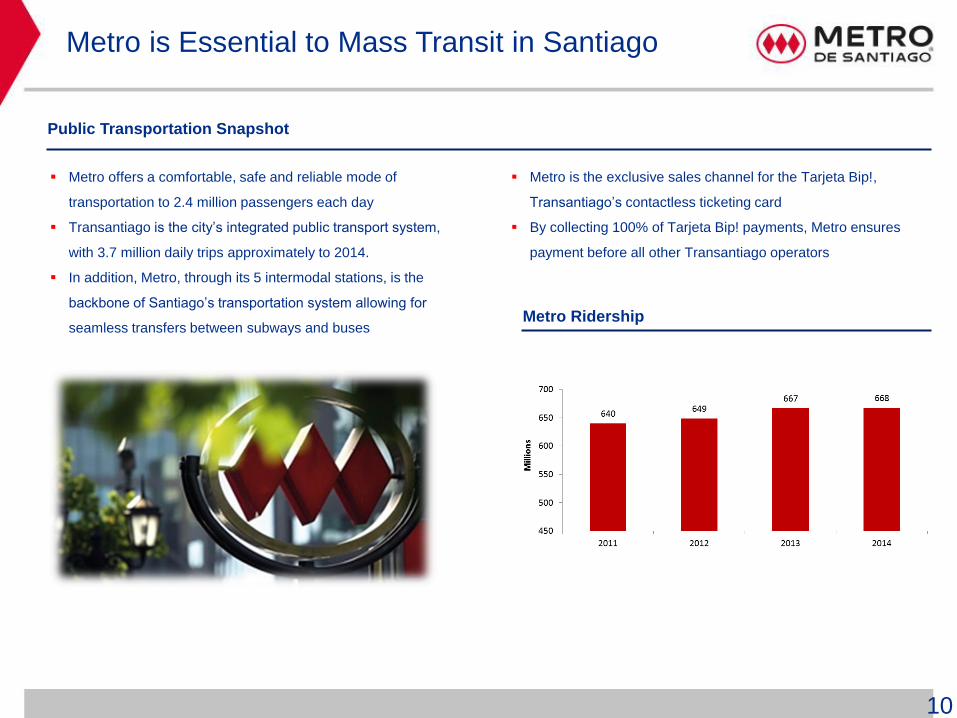
Metro is Essential to Mass Transit in Santiago
Metro offers a comfortable, safe and reliable mode of
transportation to 2.4 million passengers each day
Transantiago is the city’s integrated public transport system,
with 3.7 million daily trips approximately to 2014.
In addition, Metro, through its 5 intermodal stations, is the
backbone of Santiago’s transportation system allowing for
seamless transfers between subways and buses
Public Transportation Snapshot
10
Metro is the exclusive sales channel for the Tarjeta Bip!,
Transantiago’s contactless ticketing card
By collecting 100% of Tarjeta Bip! payments, Metro ensures
payment before all other Transantiago operators
Metro Ridership

Non-Fare Revenues Contribute Towards Higher
Margins
Non-Fare revenues
For december 2014, non-fare business accounts for 20% of Metro’s total revenue
Card Reloading (POS): Reloading service of Tarjeta Bip! at Metro ticket booths and load network surface
Intermodal: 5 intermodal stations
o Metro collects fees from bus companies for the use of these stations
Real Estate: Leasing of 340 stands and commercial spaces
Advertising: Over 10,000 advertising spaces on trains and stations
Services and Communications: 284 ATMs, 500 payphones, 18 cellular antennas, 57 kilometers fiber optics, among other services
11
Total Revenue Sources 2014
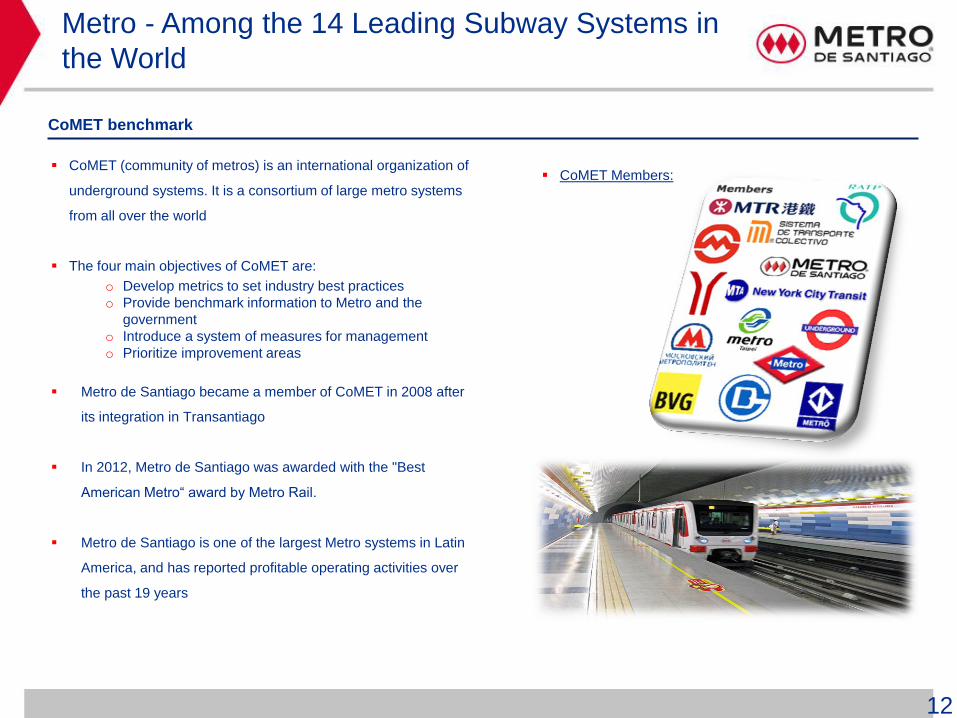
Metro - Among the 14 Leading Subway Systems in
the World
CoMET (community of metros) is an international organization of
underground systems. It is a consortium of large metro systems
from all over the world
The four main objectives of CoMET are:
o Develop metrics to set industry best practices
o Provide benchmark information to Metro and the
government
o Introduce a system of measures for management
o Prioritize improvement areas
Metro de Santiago became a member of CoMET in 2008 after
its integration in Transantiago
In 2012, Metro de Santiago was awarded with the "Best
American Metro“ award by Metro Rail.
Metro de Santiago is one of the largest Metro systems in Latin
America, and has reported profitable operating activities over
the past 19 years
CoMET benchmark
CoMET Members:
12

Metro at a glance
Key Investment Considerations
Financial Information

Total Revenues (USD Million) Adjusted Ebitda (USD Million)
Non-fare revenues (USD Million) Cost per Car-Km* (CLP Thousand)
Metro’s Solid Financial Metrics
14
Note: We define adjusted EBITDA as gross profit less administrative expenses plus depreciation and amortization
Figures have been converted from CLP to USD for the years 2014 & 2013 at a rate of CLP 606.75 & CLP 524.61 per USD 1 were used respectively; for the years ending 2012 & 2011 at a rate of CLP 479.96 & CLP 519.20
per USD 1 were used respectively
(*) Cost per Car-Km is calculated as (Cost of sale + admin. expenses) / Total of Car-Km

Debt to Capitalization* Interest Coverage (Adjusted Ebitda/Financial Expenses)
Shareholders’ Equity (USD Million) Debt/Equity
Metro’s Solid Financial Metrics (Cont’d)
Note: We define adjusted EBITDA as gross profit less administrative expenses plus depreciation and amortization
Figures have been converted from CLP to USD for the years 2014 & 2013 at a rate of CLP 606.75 & CLP 524.61 per USD 1 were used respectively; for the years ending 2012 & 2011 at a rate of CLP
479.96 & CLP 519.20 per USD 1 were used respectively
(*) Debt to Capitalization is calculated as Debt / (Debt + Equity)
15

Note: Figures in local currency (CLP) converted into USD (FX rate: 606.75 CLP / USD)
Figures may not add up due to rounding
Metro’s Debt Breakdown
Debt Structure (as of Dec. 2014)
Bonds (as of Dec. 2014)
Currency Breakdown (as of Dec. 2014)
Loans (as of Dec. 2014)
Total Bonds = USD 1,966MM Government Guaranteed = USD 875 MM
Non-Guaranteed = USD 1.091 MM
Total Debt = USD 2,481 MM Bonds = USD 1,966 MM
Loans = USD 500 MM
Total Loans = USD 500 MM Government Guaranteed = USD 136 MM
Non-Guaranteed = USD 364 MM
16
Derivatives = USD 1MM
Megaproject s withholding = USD 13 MM

Financial Information
(*) Adjusted Operating Profit = Gross Profit – Admin expenses (IFRS)
17
Note: Figures have been converted from CLP to USD for the years 2014 & 2013 at a rate of CLP 606.75 & CLP 524.61 per USD 1 were used
respectively; for the years ending 2012 & 2011 at a rate of CLP 479.96 & CLP 519.20 per USD 1 were used respectively
Balance Sheet 2011 2012 2013 2014
(USD Million) Current Assets 257 374 420 573
Non-Current Assets 5.196 5.830 5.555 5.226
Total Assets 5.453 6.204 5.975 5.800
Short-Term Liabilities 246 266 346 310
Long-Term Liabilities 2.338 2.459 2.158 2.363
Total Liabilities 2.583 2.725 2.503 2.674
Total Shareholders Equity 2.869 3.479 3.472 3.126
Total Shareholders Equity & Liabilities 5.453 6.204 5.975 5.800
Income Statement 2011 2012 2013 2014
(USD Million) Revenues 441 497 477 464
Cost of sales -379 -419 -414 -418
Gross Profit 62 78 63 46
Gross margin (%) 14,07% 15,68% 13,26% 9,82%
Admin expenses -39 -54 -48 -37
Net financial expenses -76 -88 -78 -66
Change in FX -84 65 -52 -95
Net Income -188 -52 -140 -216
Adjusted EBITDA 159 173 155 131
Adjusted Operating Profit (*) 23 11 15 9

Empresa de Transporte de Pasajeros Metro S.A.
Investor Presentation