prescriÇÃo de quinolonas - anci.pt · distribution of antimicrobial consumption of antibacterials...
TRANSCRIPT
PRESCRIÇÃO DE QUINOLONAS
ACES CÁVADO II – GERÊS/CABREIRA
Raul Varajão Borges
2015 - 03 - 13

ACES CÁVADO II – GERÊS / CABREIRA

O começo é a parte mais importante de qualquer trabalho.
PLATÃO

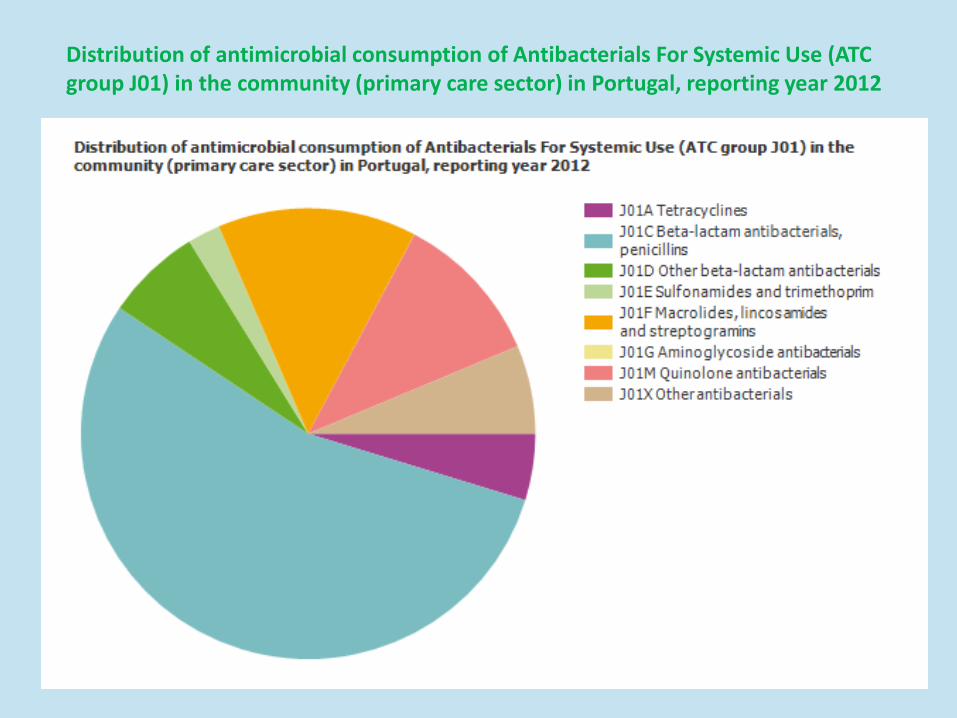
Distribution of antimicrobial consumption of Antibacterials For Systemic Use (ATC group J01) in the community (primary care sector) in Portugal, reporting year 2012
Antimicrobial class
ATC Code Name DDD per 1000
inhabitants and per day
Percent
J01A Tetracyclines 1.1 4.8%
J01B Amphenicols 0.0 0.0%
J01C Beta-lactam antibacterials, penicillins 12.4 54.6%
J01D Other beta-lactam antibacterials 1.5 6.8%
J01E Sulfonamides and trimethoprim 0.5 2.3%
J01F Macrolides, lincosamides and
streptogramins
3.2 14.2%
J01G Aminoglycoside antibacterials 0.0 <0.1%
J01M Quinolone antibacterials 2.5 10.9%
J01R Combinations of antibacterials 0.0 0.0%
J01X Other antibacterials 1.4 6.3%
Total 22.7 100.0%
Distribution of antimicrobial consumption of Antibacterials For Systemic Use (ATC group J01) in the community (primary care sector) in Portugal, reporting year 2012

Trend of antimicrobial consumption of Antibacterials For Systemic Use
(ATC group J01) in the community (primary care sector) in Portugal from
1997 to 2013
Year Portugal
1997 23.1
1998 23.3
1999 25.2
2000 24.9
2001 24.5
2002 26.5
2003 25.1
2004 23.8
2005 24.5
2006 22.7
2008 22.7
2009 22.9
2010 22.4
2011 23.2
2012 22.7
2013 -

Trend of antimicrobial consumption of Antibacterials For Systemic Use
(ATC group J01) in the community (primary care sector) in Portugal from
1997 to 2013

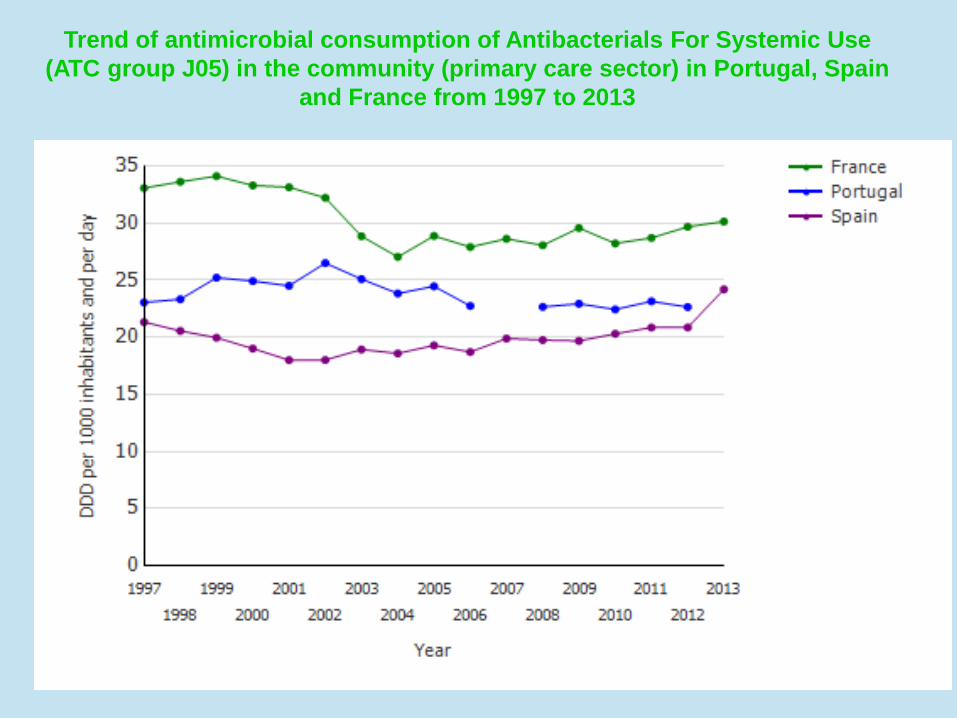
Trend of antimicrobial consumption of Antibacterials For Systemic Use
(ATC group J05) in the community (primary care sector) in Portugal, Spain
and France from 1997 to 2013
Year France Portugal Spain
1997 33.1 23.1 21.3
1998 33.6 23.3 20.6
1999 34.1 25.2 20.0
2000 33.3 24.9 19.0
2001 33.2 24.5 18.0
2002 32.2 26.5 18.0
2003 28.9 25.1 18.9
2004 27.1 23.8 18.6
2005 28.9 24.5 19.3
2006 27.9 22.7 18.7
2007 28.6 - 19.9
2008 28.1 22.7 19.8
2009 29.6 22.9 19.7
2010 28.2 22.4 20.3
2011 28.7 23.2 20.9
2012 29.7 22.7 20.9
2013 30.1 - 24.2
Trend of antimicrobial consumption of Antibacterials For Systemic Use
(ATC group J05) in the community (primary care sector) in Portugal, Spain
and France from 1997 to 2013
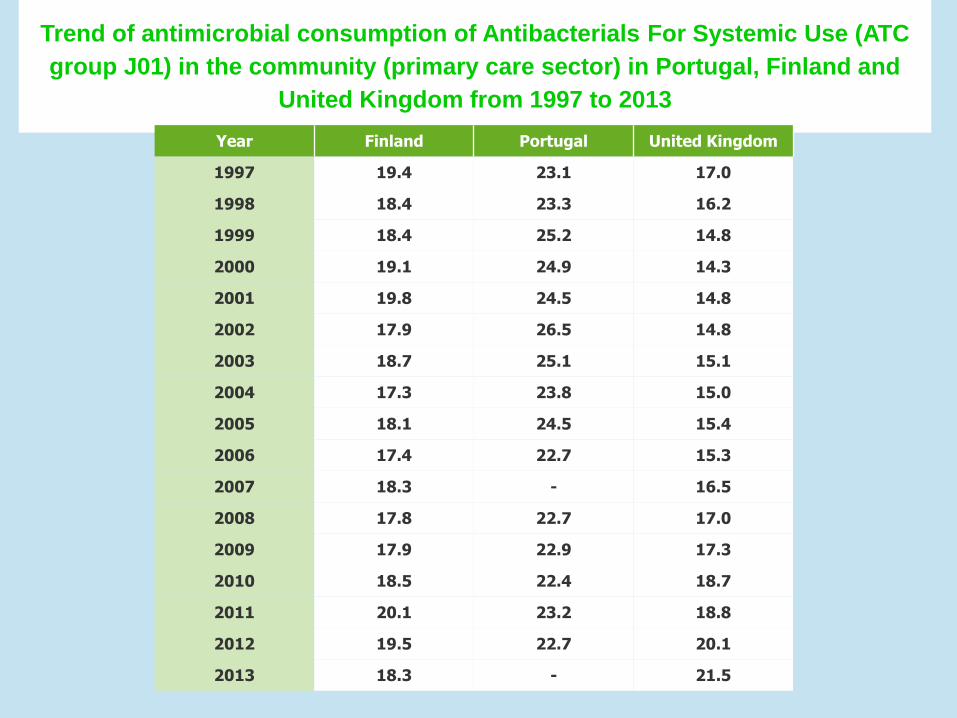
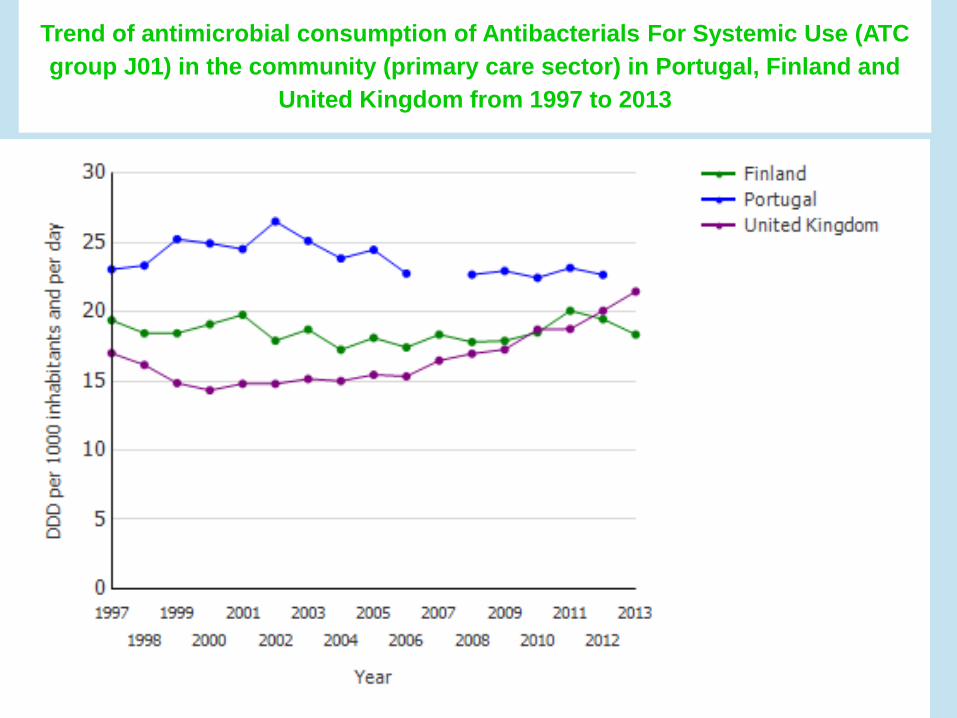
Trend of antimicrobial consumption of Antibacterials For Systemic Use (ATC
group J01) in the community (primary care sector) in Portugal, Finland and
United Kingdom from 1997 to 2013
Year Finland Portugal United Kingdom
1997 19.4 23.1 17.0
1998 18.4 23.3 16.2
1999 18.4 25.2 14.8
2000 19.1 24.9 14.3
2001 19.8 24.5 14.8
2002 17.9 26.5 14.8
2003 18.7 25.1 15.1
2004 17.3 23.8 15.0
2005 18.1 24.5 15.4
2006 17.4 22.7 15.3
2007 18.3 - 16.5
2008 17.8 22.7 17.0
2009 17.9 22.9 17.3
2010 18.5 22.4 18.7
2011 20.1 23.2 18.8
2012 19.5 22.7 20.1
2013 18.3 - 21.5
Trend of antimicrobial consumption of Antibacterials For Systemic Use (ATC
group J01) in the community (primary care sector) in Portugal, Finland and
United Kingdom from 1997 to 2013

Consumption of antimicrobials of Quinolone Antibacterials (ATC group J01M)
in the community (primary care sector) in Europe, reporting year 2012
Country DDD per 1000
inhabitants and per day
Austria 1.30
Belgium 2.76
Bulgaria 2.40
Croatia 1.49
Cyprus* 3.55
Czech Republic 1.06
Denmark 0.55
Estonia 0.85
Finland 0.89
France 1.92
Germany 1.45
Greece 2.37
Hungary 1.89
Iceland* 1.02
Ireland 0.87
Italy 3.48
Latvia 1.03
Liechtenstein -
Lithuania 1.00
Luxembourg 2.79
Malta 2.01
Netherlands 0.81
Norway 0.56
Poland 1.19
Portugal 2.47
Romania* 3.38
Slovakia 1.95
Slovenia 1.08
Spain 2.61
Sweden 0.75
United Kingdom 0.42
ACES Gerês/Cabreira (2012) 1.29
Country DDD per 1000
inhabitants and per
day

Consumption of antimicrobials of Quinolone Antibacterials (ATC group J01M)
in the community (primary care sector) in Europe, reporting year 2012
1.29

Trend of antimicrobial consumption of Quinolone Antibacterials (ATC group
J01M) in the community (primary care sector) in Portugal, Spain and France
from 1997 to 2013
Year France Portugal Spain
1997 1.83 3.04 2.18
1998 1.85 2.98 2.12
1999 1.90 3.09 2.17
2000 2.14 3.20 2.18
2001 2.34 3.65 2.22
2002 2.08 3.70 2.20
2003 2.04 3.10 2.24
2004 2.08 3.05 2.25
2005 2.17 3.04 2.26
2006 2.18 2.92 2.32
2007 2.19 - 2.47
2008 2.09 3.06 2.43
2009 2.00 3.04 2.42
2010 2.00 2.97 2.54
2011 1.79 2.69 2.57
2012 1.92 2.47 2.61
2013 1.84 - 2.81

Trend of antimicrobial consumption of Quinolone Antibacterials (ATC group
J01M) in the community (primary care sector) in Portugal, Spain and France
from 1997 to 2013
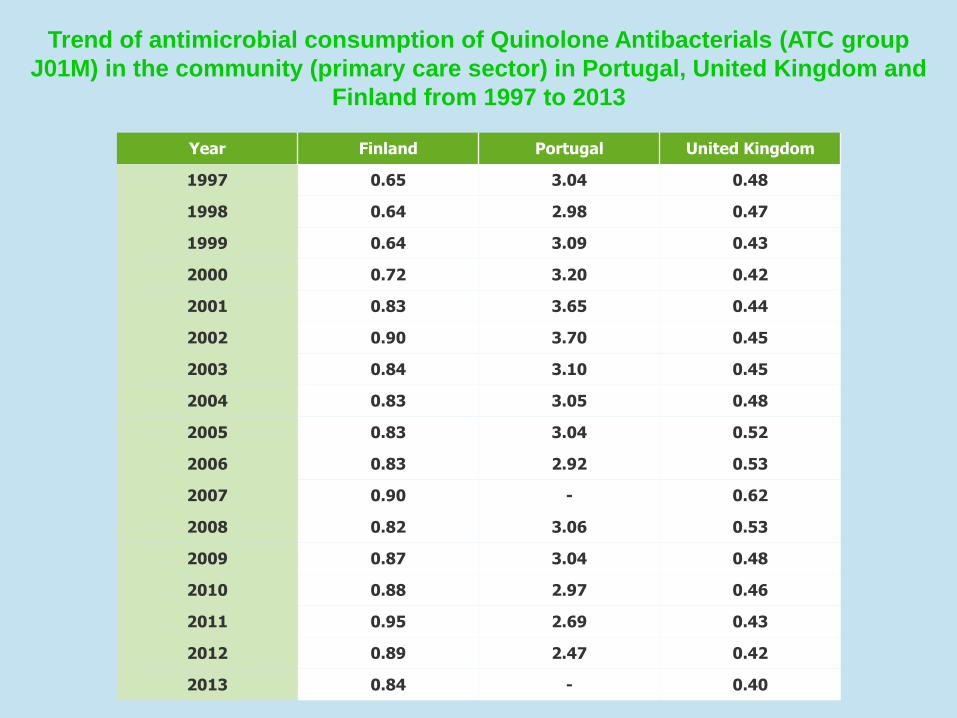
Trend of antimicrobial consumption of Quinolone Antibacterials (ATC group
J01M) in the community (primary care sector) in Portugal, United Kingdom and
Finland from 1997 to 2013
Year Finland Portugal United Kingdom
1997 0.65 3.04 0.48
1998 0.64 2.98 0.47
1999 0.64 3.09 0.43
2000 0.72 3.20 0.42
2001 0.83 3.65 0.44
2002 0.90 3.70 0.45
2003 0.84 3.10 0.45
2004 0.83 3.05 0.48
2005 0.83 3.04 0.52
2006 0.83 2.92 0.53
2007 0.90 - 0.62
2008 0.82 3.06 0.53
2009 0.87 3.04 0.48
2010 0.88 2.97 0.46
2011 0.95 2.69 0.43
2012 0.89 2.47 0.42
2013 0.84 - 0.40

Trend of antimicrobial consumption of Quinolone Antibacterials (ATC group
J01M) in the community (primary care sector) in Portugal, Spain and France
from 1997 to 2013


0
500
1000
1500
2000
2500
3000
3500
2012 2013 2014
3187 2975
2442
ACES Gerês/Cabreira Prescrição de Quinolonas
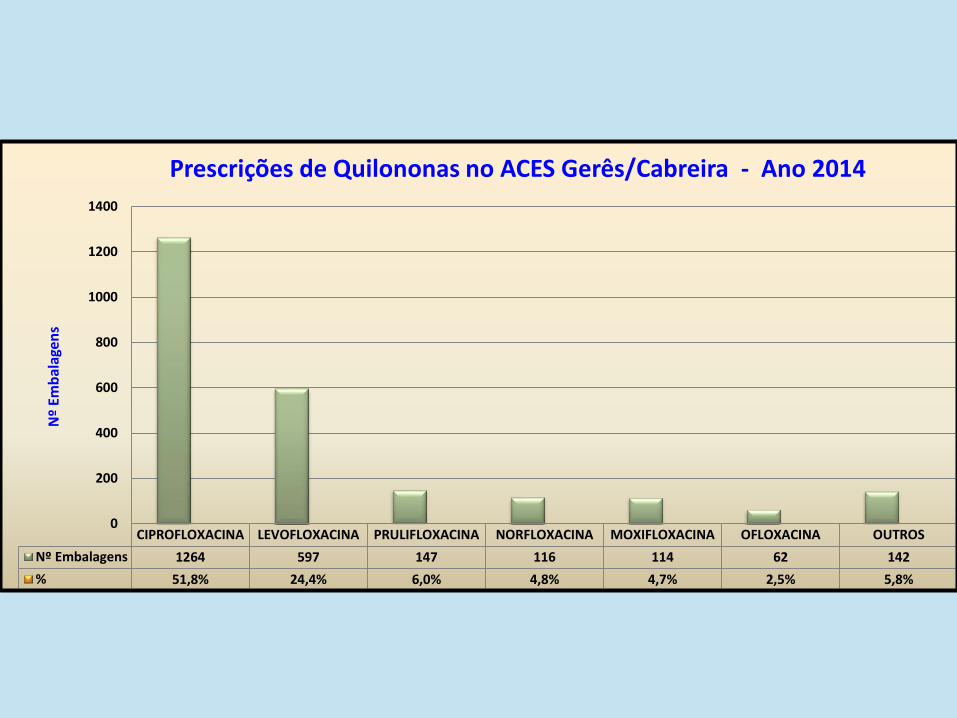
CIPROFLOXACINA LEVOFLOXACINA PRULIFLOXACINA NORFLOXACINA MOXIFLOXACINA OFLOXACINA OUTROS
Nº Embalagens 1264 597 147 116 114 62 142
% 51,8% 24,4% 6,0% 4,8% 4,7% 2,5% 5,8%
0
200
400
600
800
1000
1200
1400
Nº
Emb
alag
ens
Prescrições de Quilononas no ACES Gerês/Cabreira - Ano 2014

1. Prescrição de Quinolonas/Antibióticos no ACES 2014
0
1.000
2.000
3.000
4.000
5.000
6.000
7.000
8.000
9.000
10.000
Amares Póvoa Lanhoso Terras Bouro Vieira Minho Vila Verde
2.381 1.934 2.042
4.440
9.082
281 196 199 679
1.087
ACES Gerês/Cabreira
Nº de Antibióticos
Nº de Quinolonas

1. Prescrição de Quinolonas no ACES
11,8% Amares
10,1% Póvoa Lanhoso
9,7% Terras Bouro
15,3% Vieira Minho
12,0% Vila Verde
ACES Gerês/Cabreira 12,3 % Quinolonas prescritas em 2014

Há algo de fascinante na ciência: de um mínimo de factos pode retirar-se
um mundo de conjecturas.
MARK TWAIN (1835 – 1910)

Em que patologias são
prescritas quinolonas?

Infecções do Tracto Urinário

0
200
400
600
800
1000
1200
835
1046
601
138
Número de Amostras da Colheita de Urina
Vieira Minho Vila Verde Amares Póvoa Lanhoso


0%
10%
20%
30%
40%
50%
60%
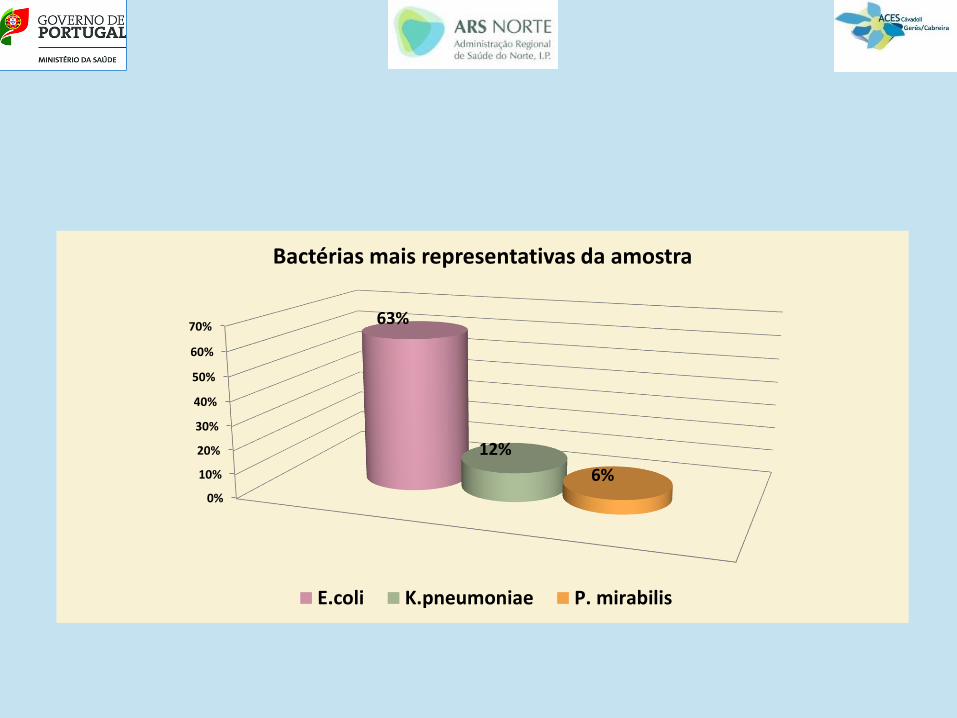
70% 63%
12%
6%
Bactérias mais representativas da amostra
E.coli K.pneumoniae P. mirabilis


0%
10%
20%
30%
40%
50%
60%
70%
80%
E.coli K.pneumoniae P. mirabilis
24% 23% 22%
76% 77% 78%
CIPROFLOXACINA
Resistente
Sensível

E.COLI
0%
10%
20%
30%
40%
50%
60%
AmpicilinaÁcido
Nalidíxico Cefalotina
58%
35%
32%
Resistência
94%
95%
96%
97%
98%
99%
100%100% 100%
97%
96%
Sensibilidade
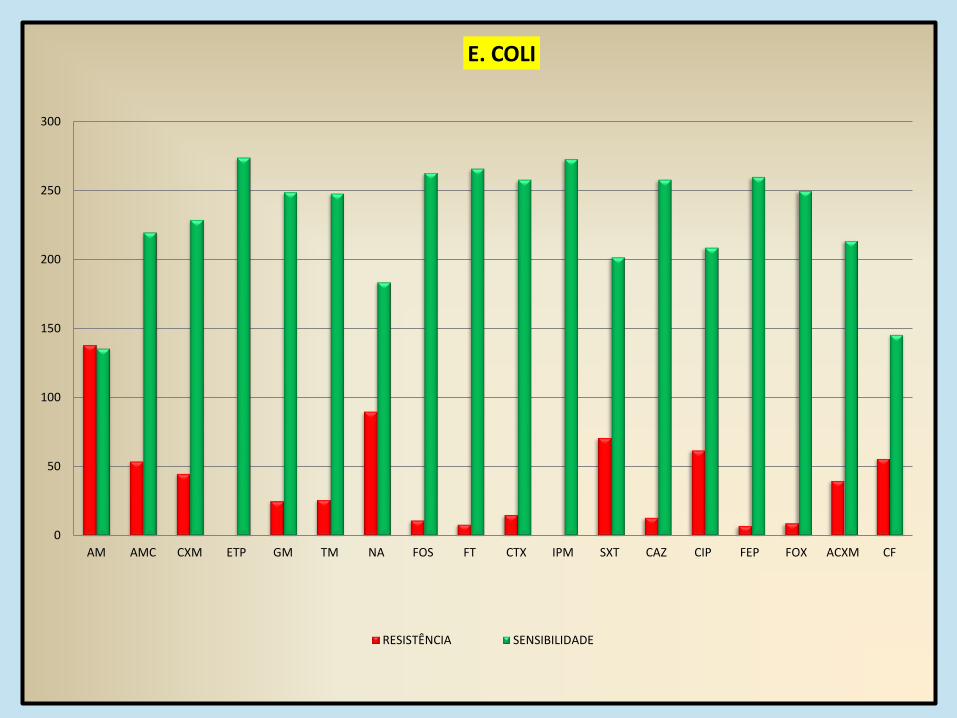
0
50
100
150
200
250
300
AM AMC CXM ETP GM TM NA FOS FT CTX IPM SXT CAZ CIP FEP FOX ACXM CF
E. COLI
RESISTÊNCIA SENSIBILIDADE

K.PNEUMONIAE
0%
20%
40%
60%
80%
100%
AmpicilinaFosfomicina
ÁcidoNalidíxico
100%
49%
39%
Resistência
94%95%
96%
97%
98%
99%
100%100% 100%
96% 96%
Sensibilidade
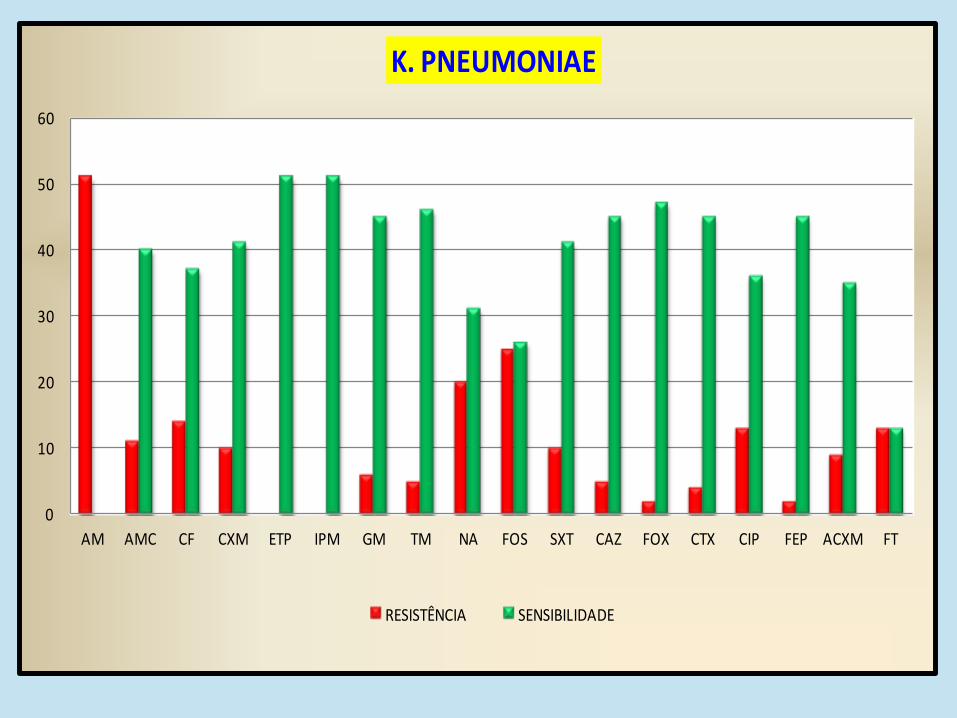
0
10
20
30
40
50
60
AM AMC CF CXM ETP IPM GM TM NA FOS SXT CAZ FOX CTX CIP FEP ACXM FT
K. PNEUMONIAE
RESISTÊNCIA SENSIBILIDADE

P. MIRABILIS
0%
20%
40%
60%
80%
100%100%
50% 46% 46%
Resistência
0%
20%
40%
60%
80%
100%100% 100% 100% 100% 100%
Sensibilidade

0
5
10
15
20
25
AM AMC CXM CTX CAZ FEP GM TM NA FOS FT SXT ACXM FOX ETP CF CIP IPM
P. MIRABILIS
RESISTÊNCIA SENSIBILIDADE

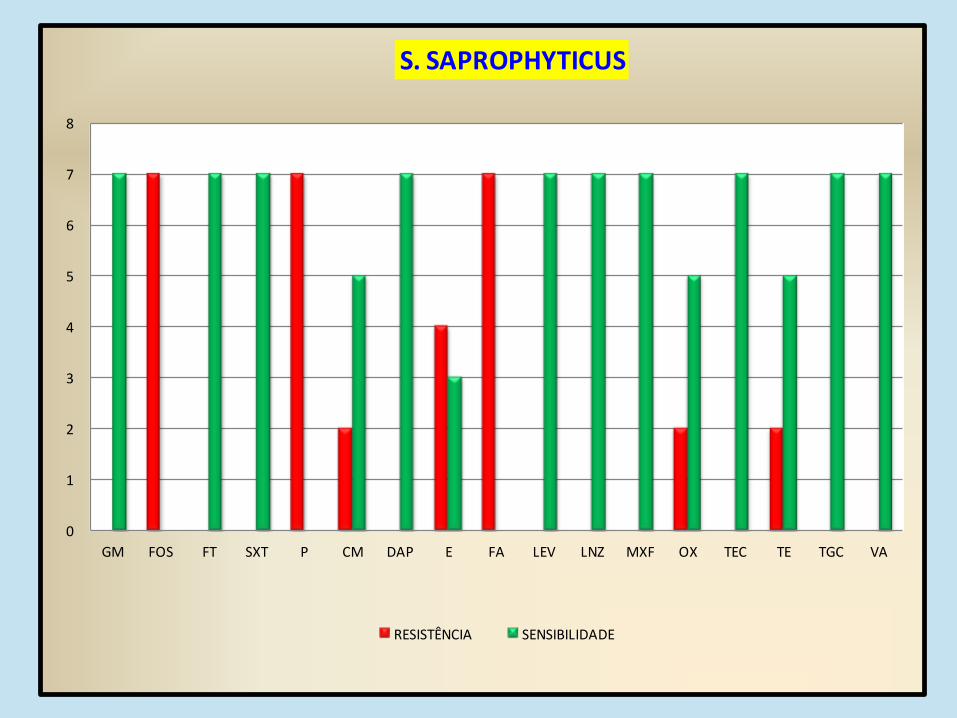
0
1
2
3
4
5
6
7
8
GM FOS FT SXT P CM DAP E FA LEV LNZ MXF OX TEC TE TGC VA
S. SAPROPHYTICUS
RESISTÊNCIA SENSIBILIDADE

É a penicilina que cura o povo … mas é o vinho que os torna felizes.
A. FLEMING (1881 – 1955)

3. CONCLUSÕES
1. A prescrição de quinolonas parece estar a diminuir em Portugal;
2. As doses diárias definidas no ACES Gerês/Cabreira estão em 1,29 (em Portugal:
2,47 - 2012);
3. A quinolona mais prescrita no ACES Gerês/Cabreira é a Ciprofloxacina;
4. Claramente a E. Coli é a bactéria mais encontrada em infecções urinárias , e
particularmente em mulheres;
5. A Klebsiella é rara abaixo dos 50 anos (2.8% ) e em homens (5.5% );
6. No tratamento das diversas infecções existem muitos antibióticos, ainda com
sensibilidade para as diferentes bactérias, não havendo necessidade de recurso
às quinolonas.
7. Com estas e outras informações talvez se consigam propôr alguns esquemas
antibióticos.

Sou inimigo das explicações longas; elas enganam a quem as dá ou a quem as
ouve … em geral a ambos.
J. W. von GOETHE (1749 – 1832)