prepublication copy - e&e news -- the essential … prepublication copy water science and...
TRANSCRIPT
Tyin
THIS PRcommittemade thrNational
PR
ng Floo
REPUBLICAee’s findingsoughout the Academies
REPU
od InsurStruc
ATION VERs. Although text prior toPress in the
NOT FO
UBLIC
rance tctures in
RSION has bthe substanc
o publicationSummer of
OR PUBL
Friday,
at 11:
CATI
to Floon the F
been providece of the repn. The final 2015.
LIC RELE
June 19,
00 a.m. E
ION C
d RiskFloodpl
d to facilitatport is final, ereport will b
EASE BE
2015
EDT
COPY
k for Lolain
te timely acceditorial chabe available
EFORE
Y
ow-Lyi
cess to the anges may bthrough the
ing
e
PR
Tying F
Committee
P R E
REPU
Flood InsStru
e on Risk-BasStructur
W
Board on MDivisi
THE
E P U B L I
UBLIC
surance tuctures i
sed Methods fores in the Nati
Water ScienceDivision on E
Mathematical ion on Engine
E NATIONAWash
ww
C A T I O N
CATI
to Floodin the Fl
for Insurance Pional Flood In
e and TechnoloEarth and Life
Sciences and
eering and Phy
AL ACADEMhington, D.C
ww.nap.edu
N C O P Y
ION C
d Risk fooodplain
Premiums of Nnsurance Progr
ogy Board e Studies
d Their Applicysical Science
MIES PRESSC.
Y
COPY
or Low-Ln
Negatively Elram
cations es
S
Y
Lying
levated

ii P R E P U B L I C A T I O N C O P Y
THE NATIONAL ACADEMIES PRESS 500 Fifth Street, N.W. Washington, DC 20001
NOTICE: The project that is the subject of this report was approved by the Governing Board of the National Research Council, whose members are drawn from the councils of the National Academy of Sciences, the National Academy of Engineering, and the Institute of Medicine. The members of the committee responsible for the report were chosen for their special competences and with regard for appropriate balance.
Support for this study was provided by Federal Emergency Management Agency under contract number HSHQDC-11-D-0009/HSFE60-13-J-0026. Any opinions, findings, conclusions, or rec-ommendations expressed in this publication are those of the author(s) and do not necessarily re-flect the views of the organizations or agencies that provided support for the project.
Library of Congress Control Number
International Standard Book Number
Additional copies of this report are available for sale from the National Academies Press, 500 Fifth Street, NW, Keck 360, Washington, DC 20001; (800) 624-6242 or (202) 334-3313; Inter-net, http://www.nap.edu.
Copyright 2015 by the National Academy of Sciences. All rights reserved.
Printed in the United States of America

The Natiguished sscience agranted tfederal gNational
The Natitional Acin its admSciences neering ation and president
The Instcure the matters pthe Natiogovernmtion. Dr.
The Natiassociatethering kpolicies dboth the services Council CiceroneCouncil.
ional Acadescholars engand technoloto it by the Cgovernment o
Academy o
ional Acadecademy of Scministration the respons
also sponsorresearch, ant of the Natio
itute of Meservices of
pertaining toonal Academ
ment and, upoVictor J. Dz
ional Researe the broad cknowledge andetermined bNational Acto the goveis administe
e and Dr. C.
P R E
emy of Sciegaged in scieogy and to thCongress in on scientificf Sciences.
emy of Engciences, as aand in the sibility for ads engineerin
nd recognizeonal Academ
dicine was eeminent me
o the health omy of Scienon its own inzau is preside
rch Councilcommunity ond advising by the Acadcademy of Sernment, theered jointly D. Mote, Jr.
P U B L I
ences is a prentific and eheir use for th
1863, the Ac and technic
gineering waa parallel orgselection of dvising the fng programs s the superio
my of Engine
established iembers of apof the publicces by its cnitiative, to ient of the In
l was organiof science athe federal g
demy, the CoSciences ande public, anby both Aca., are chair a
iii C A T I O
rivate, nonpengineering rhe general w
Academy hascal matters. D
as establisheganization ofits membersfederal goveaimed at me
or achievemeering.
in 1970 by tppropriate pc. The Instituongressionaidentify issu
nstitute of Me
ized by the Nand technologovernment.ouncil has bd the Nationad the scientademies andand vice chai
N C O P Y
rofit, self-peresearch, de
welfare. Upos a mandate Dr. Ralph J.
ed in 1964, f outstandings, sharing wernment. Theeeting nation
ments of engi
the Nationalprofessions iute acts und
al charter to ues of medicedicine.
National Acaogy with the . Functioninecome the pal Academy tific and end the Institutir, respective
www
Y
erpetuating edicated to thon the author
that require. Cicerone is
under the chg engineers.
with the Natioe National Anal needs, enineers. Dr. C
l Academy oin the exam
der the respobe an advis
cal care, rese
ademy of Sc Academy’s
ng in accordaprincipal ope
of Engineerngineering cte of Medicely, of the N
w.national-
society of dhe furtheranrity of the ches it to adviss president o
harter of the It is autonomonal Academ
Academy of Encourages ed
C. D. Mote, J
of Sciences tmination of ponsibility givser to the feearch, and ed
ciences in 19 purposes oance with geerating agenring in provommunities
cine. Dr. RalNational Res
-academies
distin-nce of harter se the of the
e Na-mous
my of Engi-duca-Jr., is
to se-policy ven to ederal duca-
916 to f fur-
eneral ncy of viding . The lph J. earch
s.org

v P R E P U B L I C A T I O N C O P Y
COMMITTEE ON RISK-BASED METHODS FOR INSURANCE PREMIUMS OF NEGATIVELY ELEVATED STRUCTURES IN THE
NATIONAL FLOOD INSURANCE PROGRAM DAVID T. FORD, Chair, David Ford Consulting Engineers, Sacramento, California ROSS B. COROTIS, University of Colorado, Boulder WEI DU, CoreLogic Spatial Solutions, Springfield, Virginia CLIVE Q. GOODWIN, FM Global Insurance Company, Johnston, Rhode Island LARRY LARSON, Association of State Floodplain Managers, Madison, Wisconsin HOWARD LEIKIN, FEMA, retired, Silver Spring, Maryland MARTIN W. MCCANN, Jack R. Benjamin & Associates, Menlo Park, California LAURA A. MCLAY, University of Wisconsin, Madison ERWANN MICHEL-KERJAN, University of Pennsylvania, Philadelphia LINDENE PATTON, CoreLogic Spatial Solutions, Springfield, Virginia* PATRICIA TEMPLETON-JONES, Wright National Flood Insurance Company, St. Petersburg,
Florida SUSAN E. VOSS, American Enterprise Group, Inc., Des Moines, Iowa * Since October 2014; previously at Zurich Insurance Group, Washington, DC NRC STAFF ANNE M. LINN, Study Director, Board on Earth Sciences and Resources SCOTT T. WEIDMAN, Director, Board on Mathematical Sciences and Their Applications ANITA A. HALL, Senior Program Associate, Water Science and Technology Board
vi P R E P U B L I C A T I O N C O P Y
WATER SCIENCE AND TECHNOLOGY BOARD GEORGE M. HORNBERGER, Chair, Vanderbilt University, Nashville, Tennessee EDWARD J. BOUWER, Johns Hopkins University, Baltimore, Maryland YU-PING CHIN, Ohio State University, Columbus DAVID A. DZOMBAK, Carnegie Mellon University, Pittsburgh, Pennsylvania M. SIOBHAN FENNESSY, Kenyon College, Gambier, Ohio BEN GRUMBLES, Clean Water America Alliance, Washington, D.C. GEORGE R. HALLBERG, The Cadmus Group, Watertown, Massachusetts CATHERINE L. KLING, Iowa State University, Ames DEBRA S. KNOPMAN, RAND Corporation, Arlington, Virginia LARRY LARSON, Association of State Floodplain Managers, Madison, Wisconsin RITA P. MAGUIRE, Maguire & Pearce PLLC, Phoenix, Arizona DAVID I. MAURSTAD, OST, Inc., McLean, Virginia ROBERT SIMONDS, The Robert Simonds Company, Culver City, California FRANK H. STILLINGER, Princeton University, Princeton, New Jersey GEORGE VALENTIS, Veolia Institute, Paris, France MARYLYNN V. YATES, University of California, Riverside JAMES W. ZIGLAR, SR., Van Ness Feldman, Washington, D.C. STAFF JEFFREY JACOBS, Director LAURA J. EHLERS, Senior Program Officer STEPHANIE E. JOHNSON, Senior Program Officer EDMOND J. DUNNE, Program Officer M. JEANNE AQUILINO, Financial and Administrative Associate MICHAEL J. STOEVER, Research Associate ANITA A. HALL, Senior Program Associate BRENDAN R. MCGOVERN, Senior Program Assistant

vii P R E P U B L I C A T I O N C O P Y
BOARD ON MATHEMATICAL SCIENCES AND THEIR APPLICATIONS DONALD G. SAARI, Chair, University of California, Irvine DOUGLAS N. ARNOLD, University of Minnesota, Minneapolis JOHN B. BELL, E.O. Lawrence Berkeley National Laboratory, Berkeley, California VICKI M. BIER, University of Wisconsin, Madison JOHN R. BIRGE, The University of Chicago, Illinois L. ANTHONY COX, JR, Cox Associates, Denver, Colorado MARK L. GREEN, University of California, Los Angeles JOSEPH A. LANGSAM, University of Maryland, College Park BRYNA KRA, Northwestern University, Evanston, Illinois ANDREW W. LO, Massachusetts Institute of Technology, Cambridge, Massachusetts DAVID MAIER, Portland State University, Portland, Oregon WILLIAM A. MASSEY, Princeton University, Princeton, New Jersey JUAN C. MEZA, University of California, Merced CLAUDIA NEUHAUSER, University of Minnesota, Minneapolis FRED S. ROBERTS, Rutgers University, Piscataway, New Jersey GUILLERMO SAPIRO, Duke University, Durham, North Carolina CARL P. SIMON, University of Michigan, Ann Arbor KATEPALLI SREENIVASAN, New York University, New York ELIZABETH A. THOMPSON, University of Washington, Seattle STAFF SCOTT T. WEIDMAN, Director NEAL D. GLASSMAN, Senior Program Officer MICHELLE K. SCHWALBE, Program Officer RODNEY HOWARD, Administrative Assistant


ix P R E P U B L I C A T I O N C O P Y
Acknowledgments
The report was reviewed in draft form by individuals chosen for their breadth of perspec-tives and technical expertise in accordance with the procedures approved by the National Acad-emies’ Report Review Committee. The purpose of this independent review was to provide can-did and critical comments to assist the institution in ensuring that its published report is scientifi-cally credible and that it meets institutional standards for objectivity, evidence, and responsive-ness to the study charge. The review comments and draft manuscript remain confidential to pro-tect the integrity of the deliberative process. We wish to thank the following individuals for their review of this report:
Jeroen C.J.H. Aerts, VU University Amsterdam, The Netherlands Gregory B. Baecher, University of Maryland, College Park Wouter Botzen, VU University Amsterdam, The Netherlands Patrick L. Brockett, University of Texas, Austin W. Hans de Moel, VU University Amsterdam, The Netherlands Robert E. Hoyt, University of Georgia, Athens Christopher Jones, Professional Engineer, Durham, NC David R. Maidment, University of Texas, Austin Edward T. Pasterick, FEMA, retired, Bowie, MD Jery R. Stedinger, Cornell University, Ithaca, NY
Although the reviewers listed above have provided many constructive comments and sug-
gestions, they were not asked to endorse the conclusions or recommendations nor did they see the final draft of the report before its release. The review of this report was overseen by Gerald Galloway, University of Maryland, College Park, and Robin McGuire, Lettis Consultants Inter-national, Inc., Boulder, Colorado. Appointed by the National Research Council, they were re-sponsible for making certain that an independent examination of this report was carried out in accordance with institutional procedures and that all review comments were carefully consid-ered. Responsibility for the final content of this report rests entirely with the authoring commit-tee and the NRC.

xi P R E P U B L I C A T I O N C O P Y
Contents SUMMARY 1 1 THE NATIONAL FLOOD INSURANCE PROGRAM AND THE NEED FOR ACCURATE RATES 9 National Flood Insurance Program, 12 Organization of the Report, 17 2 NFIP PROCEDURES FOR ANALYZING FLOOD HAZARD AND CALCULATING INSURANCE RATES 19 Floodplain Analysis and Mapping, 19 NFIP Insurance Rates, 24 3 METHODS FOR ASSESSING FLOOD RISK 29 Assessing the Components of Flood Risk, 29 NFIP Hydrologic Method, 34 U.S. Army Corps of Engineers Method, 37 Catastrophe Models, 38 Refinements to Current Methods, 40 Comprehensive Risk Assessment, 42 Comparison of Approaches, 43 4 FACTORS THAT AFFECT RISK-BASED PREMIUMS FOR NEGATIVELY ELEVATED STRUCTURES 45 PELV, 45 DELV, 50 Underinsurance, 56 Deductibles, 61
xii Contents
P R E P U B L I C A T I O N C O P Y
5 ALTERNATIVE APPROACHES AND IMPLEMENTATION 63 Current NFIP Methods, 63 Alternative Approaches, 64 Supporting Data, 68 Feasibility, Implementation, and Cost, 73 REFERENCES 81 APPENDIXES A. Biographical Sketches of Committee Members 85 B. Glossary 89 C. Acronyms and Abbreviations 93
1 P R E P U B L I C A T I O N C O P Y
Summary
Floods take a heavy toll on society, costing lives, damaging buildings and property, dis-rupting livelihoods, and sometimes necessitating federal disaster relief, which has risen to record levels in recent years. The National Flood Insurance Program (NFIP) was created in 1968 to re-duce the flood risk to individuals and their reliance on federal disaster relief by making federal flood insurance available to residents and businesses if their community adopted floodplain man-agement ordinances and minimum standards for new construction in floodprone areas. Insurance rates for structures built after a floodplain map was adopted by the community were intended to reflect the actual risk of flooding (i.e., risk-based rates), taking into account the likelihood of in-undation, the elevation of the structure, and the relationship of inundation to damage to the struc-ture. Charging higher premiums for structures expected to suffer greater flood damage would make people aware of their flood risk and would transfer the cost of losses from taxpayers to property owners. Rates for existing structures were subsidized to encourage insurance purchase and community participation in the NFIP. The NFIP designers anticipated that the need for such subsidies would diminish over time as aging structures left the portfolio.
Today, rates are subsidized for one-fifth of the NFIP’s 5.5 million policies. Structure eleva-tions are not known for most subsidized policies. However, the NFIP believes that most of these structures are negatively elevated, that is, the elevation of the lowest floor (including basement) is lower than the NFIP benchmark for construction standards and floodplain management ordi-nances—the water surface elevation with a 1 chance in 100 of being exceeded annually (called the 1 percent annual chance exceedance elevation or base flood elevation). Compared to struc-tures built above the base flood elevation, negatively elevated structures are more likely to incur a loss because they are inundated more frequently, and the depths and durations of inundation are greater.
When subsidies are phased out to improve the fiscal health of the NFIP, as required by the Biggert-Waters Flood Insurance Reform Act of 2012 and subsequent legislation, premiums for negatively elevated structures will rise, in some cases substantially, to cover the expected losses. Consequently, it is important to ensure that NFIP methods used to calculate risk-based premiums for negatively elevated structures are credible, fair, and transparent. This report examines current NFIP methods for calculating risk-based rates for negatively elevated structures; identifies

2 Tying Flood Insurance to Flood Risk for Low-Lying Structures in the Floodplain
P R E P U B L I C A T I O N C O P Y
changes in analysis methods and data collection that are needed to support risk-based premiums; and discusses the feasibility, implementation, and cost of making these changes (Box S.1).
BOX S.1 Study Charge
An ad hoc committee will conduct a study of pricing negatively elevated structures in the National
Flood Insurance Program. Specifically, the committee will:
1. Review current NFIP methods for calculating risk-based premiums for negatively elevated structures, including risk analysis, flood maps, and engineering data.
2. Evaluate alternative approaches for calculating “full risk-based premiums” for negatively elevat-ed structures, considering current actuarial principles and standards.
3. Discuss engineering, hydrologic, and property assessment data and analytical needs associat-ed with fully implementing full risk-based premiums for negatively elevated structures.
4. Discuss approaches for keeping these engineering, hydrologic, or property assessment data updated to maintain full risk-based rates for negatively elevated structures.
5. Discuss feasibility, implementation, and cost of underwriting risk-based premiums for negatively elevated structures, including a comparison of factors used to set risk-based premiums.
CURRENT NFIP METHODS
The first task of the committee was to review current NFIP methods for calculating risk-based premiums, including the floodplain analysis and mapping that support insurance rate set-ting (Box S.1). The NFIP expresses flood risk in terms of the expected economic loss due to in-undation and the probability of that loss. Information about the flood hazard, determined through NFIP flood studies, the vulnerability of the structure being insured, and the performance of cer-tain flood protection measures is incorporated into a flood risk assessment, which yields an esti-mate of the average annual loss. The insurance rate is determined from this loss after adjusting for expenses, deductibles, underinsurance, and other factors. This process is described in more detail below.
Flood Hazard Analysis and Mapping
In inland areas, NFIP flood studies focus on the expected behavior of a watershed, river channel, and adjacent floodplain where structures are located. In coastal areas, the studies also assess the effects of storm surge and wave action. Models of relevant physical processes are cou-pled with statistical models of weather events to compute flood depths and velocities, and their likelihood of occurring. The model prediction results are summarized in reports and portrayed on Flood Insurance Rate Maps, which show water surface elevations, floodplain boundaries, zones of flood severity, and other information. The maps are used to identify locations of high flood
Summary 3
P R E P U B L I C A T I O N C O P Y
risk, to determine whether flood insurance is required, and, if so, to inform determination of a flood insurance premium.
Flood Risk Assessment
Flood risk assessments generally focus on four components:
1. Flood hazard—the probability and magnitude of flooding 2. Exposure—the economic value of assets subjected to flood hazard 3. Vulnerability—the relationship of flood hazard properties to economic loss 4. Performance—the effect of flood protection and damage mitigation measures in modi-
fying the flood hazard, the exposure, or the vulnerability The NFIP describes flood hazard using water surface elevation–probability functions, referred to as PELV curves. The curves, which were developed from flood studies in the early 1970s, repre-sent natural watershed, channel, and tidal and wind behaviors throughout the range of possible flood events, and show the annual probability that flood waters will reach or exceed a given depth relative to the base flood elevation. Variations in flood hazard are described with 30 PELV curves, representing topographies ranging from broad, shallow floodplains to narrow, steep mountain valleys.
The NFIP describes vulnerability by relating expected damage to depth of inundation. A depth–percent damage function, referred to as a DELV curve, expresses damage as a percentage of a structure’s replacement value (the exposure) for a specified depth of water in the structure. The NFIP uses two models—damage functions derived from NFIP claims data and U.S. Army Corps of Engineers (USACE) damage functions—to develop a blended DELV curve.
The NFIP describes the performance of levees and flood storage and diversion by compar-ing the properties of these measures to design and operation standards. If a measure meets those standards, then it is considered to provide complete protection from the 1 percent annual chance exceedance flood as well as floods with lesser velocities, water surface elevations, and discharge rates.
Risk-Based Insurance Rates
The NFIP determines insurance rates for classes of structures that share similar characteris-tics, including flood zone, occupancy, type of construction, the location of contents in the struc-ture, and the structure’s elevation relative to the base flood elevation. The average annual loss is computed by summing the product of the DELV curve for a class of structures and each PELV curve, and then averaging the computed losses over the set of 30 PELV curves, weighted by the estimated fraction of structures in the various flood zones at various elevations. The average an-nual loss for the class of structures is converted to an insurance rate for that class by adjusting for expenses, the amount of underinsurance (because not all structures can be or are insured to their

4 Tying Flood Insurance to Flood Risk for Low-Lying Structures in the Floodplain
P R E P U B L I C A T I O N C O P Y
full value), the portion of the claim that will not be covered because of the policy deductible, and other factors.
NFIP methods for setting risk-based rates focus on rating structures that comply with NFIP construction standards, and their use has been optimized for structures with lowest floor eleva-tions at or above the base flood elevation. However, the NFIP has applied risk-based methods to about 240,000 negatively elevated structures that have had an elevation survey. The NFIP uses the same method to calculate risk-based rates for negatively elevated structures, but requires ad-ditional information to be collected on building construction and contents value, a more detailed review of the policy application, and possibly verification of building construction details. The additional data are used to adjust the rate on a more individualized basis for negatively elevated structures.
Overall, the committee found that current NFIP methods for setting risk-based rates do not accurately and precisely describe critical hazard and vulnerability conditions that affect flood risk for negatively elevated structures, including very frequent flooding, a longer duration of flooding, and a higher proportion of damage from small flood events. In addition, the PELV and DELV curves have not been updated with modern data. Finally, many NFIP methods were de-veloped decades ago and do not take full advantage of modern technological and analysis capa-bilities. Potential changes to NFIP methods to address these issues are summarized below.
ALTERNATIVE APPROACHES
The second task of the committee was to evaluate alternative approaches for calculating risk-based premiums for negatively elevated structures (Box S.1). The committee considered both incremental changes to current NFIP methods and different approaches, which would re-quire research, development, and standardization; new data collection; and user training.
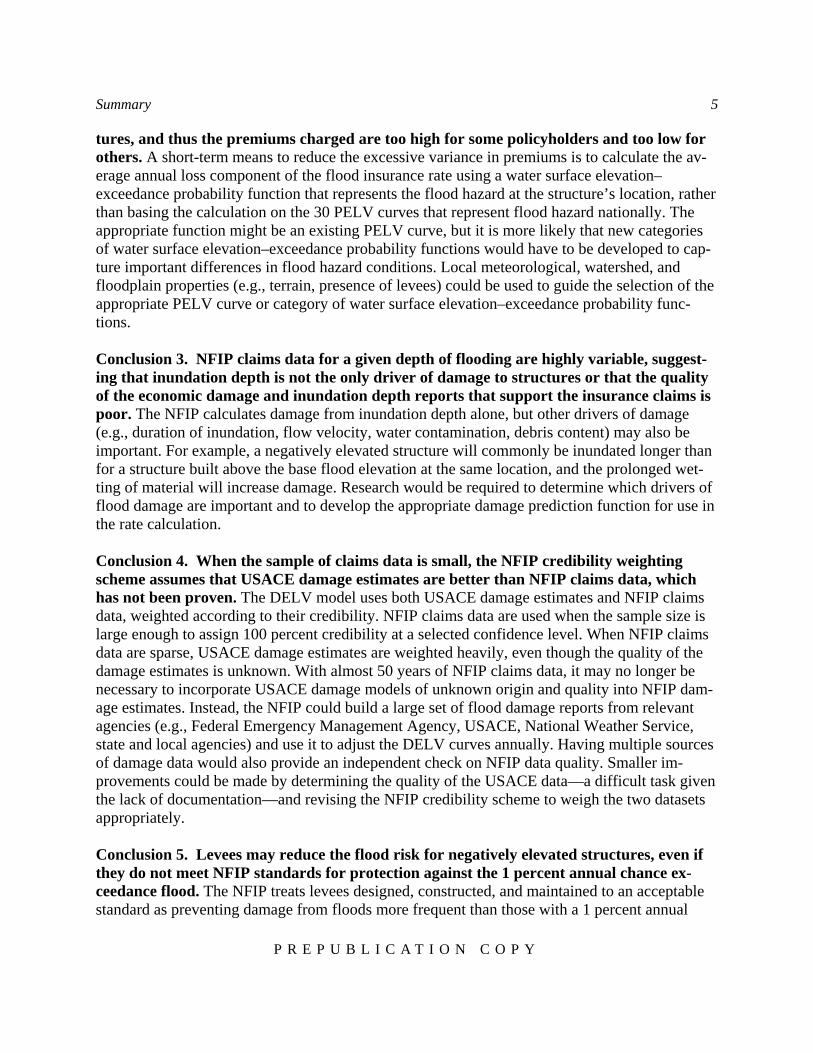
Incremental Changes to Current NFIP Methods Conclusion 1. Careful representation of frequent floods in the NFIP PELV curves is im-portant for assessing losses for negatively elevated structures. The shape of the PELV curve depends primarily on the difference between the 1 percent and 10 percent annual chance exceed-ance depths. However, a significant portion of potential losses to negatively elevated structures are caused by floods more frequent than those with a 10 percent annual chance of exceedance. A short-term solution is to use information from existing detailed flood studies to refine the PELV curves so that they define more accurately the water surface elevations for frequent floods. If a flood study developed the frequency information needed to determine the 1 percent annual chance exceedance elevation, it could be easily expanded to determine more frequent water sur-face elevations. Conclusion 2. Averaging the average annual loss over a large set of PELV curves leads to rate classes that encompass high variability in flood hazard for negatively elevated struc-
Summary 5
P R E P U B L I C A T I O N C O P Y
tures, and thus the premiums charged are too high for some policyholders and too low for others. A short-term means to reduce the excessive variance in premiums is to calculate the av-erage annual loss component of the flood insurance rate using a water surface elevation–exceedance probability function that represents the flood hazard at the structure’s location, rather than basing the calculation on the 30 PELV curves that represent flood hazard nationally. The appropriate function might be an existing PELV curve, but it is more likely that new categories of water surface elevation–exceedance probability functions would have to be developed to cap-ture important differences in flood hazard conditions. Local meteorological, watershed, and floodplain properties (e.g., terrain, presence of levees) could be used to guide the selection of the appropriate PELV curve or category of water surface elevation–exceedance probability func-tions. Conclusion 3. NFIP claims data for a given depth of flooding are highly variable, suggest-ing that inundation depth is not the only driver of damage to structures or that the quality of the economic damage and inundation depth reports that support the insurance claims is poor. The NFIP calculates damage from inundation depth alone, but other drivers of damage (e.g., duration of inundation, flow velocity, water contamination, debris content) may also be important. For example, a negatively elevated structure will commonly be inundated longer than for a structure built above the base flood elevation at the same location, and the prolonged wet-ting of material will increase damage. Research would be required to determine which drivers of flood damage are important and to develop the appropriate damage prediction function for use in the rate calculation. Conclusion 4. When the sample of claims data is small, the NFIP credibility weighting scheme assumes that USACE damage estimates are better than NFIP claims data, which has not been proven. The DELV model uses both USACE damage estimates and NFIP claims data, weighted according to their credibility. NFIP claims data are used when the sample size is large enough to assign 100 percent credibility at a selected confidence level. When NFIP claims data are sparse, USACE damage estimates are weighted heavily, even though the quality of the damage estimates is unknown. With almost 50 years of NFIP claims data, it may no longer be necessary to incorporate USACE damage models of unknown origin and quality into NFIP dam-age estimates. Instead, the NFIP could build a large set of flood damage reports from relevant agencies (e.g., Federal Emergency Management Agency, USACE, National Weather Service, state and local agencies) and use it to adjust the DELV curves annually. Having multiple sources of damage data would also provide an independent check on NFIP data quality. Smaller im-provements could be made by determining the quality of the USACE data—a difficult task given the lack of documentation—and revising the NFIP credibility scheme to weigh the two datasets appropriately. Conclusion 5. Levees may reduce the flood risk for negatively elevated structures, even if they do not meet NFIP standards for protection against the 1 percent annual chance ex-ceedance flood. The NFIP treats levees designed, constructed, and maintained to an acceptable standard as preventing damage from floods more frequent than those with a 1 percent annual

6 Tying Flood Insurance to Flood Risk for Low-Lying Structures in the Floodplain
P R E P U B L I C A T I O N C O P Y
chance of exceedance. Levees (or levee segments) that do not meet that standard are treated as providing lesser or no flood protection. However, these non-accredited levees may provide some protection against the 50 percent and 10 percent annual chance exceedance floods, which con-tribute significantly to losses for negatively elevated structures. A short-term change is to modify the NFIP Levee Analysis and Mapping Procedure to assess the ability of non-accredited levees to prevent inundation of negatively elevated structures by events more frequent than the 1 percent annual chance exceedance flood. Conclusion 6. When risk-based rates for negatively elevated structures are implemented, premiums are likely to be higher than they are today, creating perverse incentives for poli-cyholders to purchase too little or no insurance. As a result, the concept of recovering loss through pooling premiums breaks down, and the NFIP may not collect enough premiums to cover losses and underinsured policyholders may have inadequate financial protection. The NFIP encourages the purchase of sufficient flood insurance to cover the value of the struc-ture, but the mandatory purchase statute requires only that the amount of insurance cover the out-standing balance of the federally backed mortgage, if any. (In addition, the statutory limit of $250,000 coverage for single family structures, unchanged since 1994, means that many struc-tures cannot be insured to their full value). The NFIP could discourage the deliberate purchase of too little insurance, and fairly compensate for it, by tying the underinsurance adjustment to the ratio of the amount of insurance purchased to the replacement cost value of the structure, as is currently done for structures in high-hazard coastal zones. Alternatively, the NFIP could reduce loss payments or impose other penalties for severely underinsured structures, although public policy issues may also have to be considered. Conclusion 7. Adjustments in deductible discounts could help reduce the high risk-based premiums expected for negatively elevated structures. The current NFIP minimum deductible ranges from $1,000 to $2,000 for structure and for contents coverages. The NFIP offers premium discounts based on the dollar amount of the deductible chosen and whether the structure was built before or after floodplain maps were adopted by the community. However, more refined PELV curves and more accurate replacement cost information in rating policies could be used to develop deductible discounts that are more appropriate to individual expected annual losses. Minimum deductibles could also be increased, which would reduce premiums as well as NFIP expected claims payouts overall.
New Approach: A Comprehensive Risk Assessment Conclusion 8. Modern technologies, including analysis tools and improved data collection and management capabilities, enable the development and use of comprehensive risk as-sessment methods, which could improve NFIP estimates of flood loss. A comprehensive risk assessment would describe risk over the entire range of flood hazard conditions and flood events, including the large, infrequent floods that cause substantial losses to the NFIP portfolio, and the

Summary 7
P R E P U B L I C A T I O N C O P Y
smaller, frequent floods that make up a significant portion of loss to negatively elevated struc-tures. Major differences from current NFIP methods include the following:
Rather than using a standard set of national PELV curves to describe flood hazard, wa-ter surface elevation–exceedance probability functions would be developed for a study area and used to determine the flood hazard for individual structures by modeling watershed, channel, and floodplain characteristics at fine spatial resolution.
In addition to describing the effectiveness of levees and flood storage and diversion in protecting against the 1 percent annual chance exceedance flood, a comprehensive risk assess-ment would describe the various levels of protection offered by all elements of a flood protection system (e.g., reservoirs, levees, floodwalls, diversions and bypasses, channels, warning systems) and mitigation measures (e.g., elevating structures) through the entire range of flood events.
A comprehensive risk analysis would account explicitly for all uncertainties—including uncertainties about current and future flood hazard; structure value, vulnerability, and elevation; and the current and future performance of flood protection measures—and account for them through the risk analysis. These changes would improve both the accuracy and precision of flood loss estimates for struc-tures or groups of structures, and thus, the accuracy and precision of rates based upon the loss estimates.
SUPPORTING DATA
The third and fourth tasks of the committee concern collecting and updating engineering, hydrologic, and property assessment data needed for implementing risk-based premiums for neg-atively elevated structures (Box S.1). The committee focused on near-term data issues, which have been documented or seem likely to arise. Conclusion 9. Risk-based rating for negatively elevated structures requires, at a minimum, structure elevation data, water surface elevations for frequent flood events, and new infor-mation on structure characteristics to support the assessment of structure damage and flood risk. For risk-based rating, the NFIP requires an Elevation Certificate, which records the elevation of the lowest floor of a structure, measured by a land survey. However, the accuracy of the data is difficult to confirm. Vehicle-mounted lidar could potentially be used to validate struc-ture elevation data on Elevation Certificates or to collect structure elevation data at a much lower cost. Because lidar measures the highest adjacent grade elevation, some work would have to be done to convert the data to lowest floor elevations.
The NFIP collects basic information on structure characteristics, such as the number of floors and the type of supporting foundation, but additional information is needed to support models that predict damage from inundation, duration of flooding, or other drivers of damage at the structure level (see Conclusion 3). New data needs include the characteristics and usage of basements, the properties of the foundation, the type of structure or architecture, the type of inte-
8 Tying Flood Insurance to Flood Risk for Low-Lying Structures in the Floodplain
P R E P U B L I C A T I O N C O P Y
rior and exterior finishes, and the quality of construction. Finally, water surface elevation predic-tions for frequent events can be extracted from existing or new flood studies. Structure elevations and, in some cases, flood studies would have to be updated following a major flood event or the accumulation of sufficient vertical land motion to change the rate class. Structure characteristics would have to be updated after a major renovation. Conclusion 10. The lack of uniformity and control over the methods used to determine structure replacement cost values and the insufficient quality control of NFIP claims data undermine the accuracy of NFIP flood loss estimates and premium adjustments. The NFIP obtains replacement cost data from insurance companies and agents, who use their own methods to make estimates. Replacement cost values could potentially be improved by (1) requiring all insurance companies and agents to use a single cost estimation method or (2) purchasing data already collected by private companies that use consistent methods to estimate replacement costs across the nation. Having multiple sources of replacement cost data would enable the NFIP to assess data quality and to choose which source is best for rating purposes. Replacement cost val-ues would have to be updated following a disaster, structural modification, or a major socioeco-nomic change in the community.
Inconsistent replacement cost data and inaccurate and incomplete damage data may con-tribute to the documented variability in NFIP claims data for a given depth of inundation (see Conclusion 3). Data quality could be improved by collecting more data in damage reports, im-plementing a more thorough quality control and review process, or strengthening requirements on how data are collected and reported.
FEASIBILITY, IMPLEMENTATION, AND COST
The fifth task of the committee was to discuss the feasibility, implementation, and cost of underwriting risk-based premiums for negatively elevated structures (Box S.1). Changes to the water surface elevation–exceedance probability functions and the flood damage functions would strengthen the scientific and technical foundation for setting risk-based rates for negatively ele-vated structures. The incremental changes to PELV, DELV, and levee performance summarized above could be implemented quickly and at low or moderate cost (e.g., a few person months to a few person years). However, over the longer term, implementing a comprehensive risk analysis methodology and developing site-specific flood hazard descriptions, models that predict damage from multiple drivers, and probabilistic models that describe the performance of flood risk reduc-tion measures would yield a much improved assessment of flood losses, and thereby strengthen the foundation for rate setting. Work done by other agencies (e.g., USACE) demonstrates that these changes are feasible. Implementation could be done in stages, and the use of relevant in-formation, models, and analysis methods developed by other government agencies (e.g., USACE data on structures and derived information on hazard and performance) would speed the work and stretch NFIP resources. The changes outlined above will improve the accuracy and precision of loss estimates for negatively elevated structures, which in turn will increase the credibility, fairness, and transparency of premiums for policyholders.
9 P R E P U B L I C A T I O N C O P Y
1
The National Flood Insurance Program and the Need for Accurate Rates
Floods take a heavy toll on society, costing lives, damaging homes and property, and dis-rupting businesses and livelihoods (e.g., Figure 1.1). Of all natural disasters, floods are the most costly (Miller et al., 2008) and affect the most people (Stromberg, 2007). Since 1953, nearly two-thirds of presidential disaster declarations—which trigger the release of federal funds for com-munity recovery and relief—have been flood related. Moreover, the number of flood disaster declarations has increased over the past 60 years, from an average of about 8 per year in the 1950s to a record high of 51 in 2008 and 2010 (Figure 1.2). Flood losses are increasing because more people are living in harm’s way; more expensive homes are being built in the floodplain (Michel-Kerjan, 2010); and development in watersheds and climate changes, such as sea level rise and more frequent heavy rainstorms (IPCC, 2012; Melillo et al., 2014), are increasing flood risk (the likelihood and consequence of flooding) in some areas.
The National Flood Insurance Program (NFIP) was created in 1968 to reduce the flood risk to individuals and their reliance on federal post-disaster aid. The program enabled residents and businesses to purchase federal flood insurance if their community adopted floodplain manage-ment ordinances and minimum standards for new construction in floodprone areas. Insurance rates for new structures were intended to reflect the risk of flooding (i.e., risk-based rates), with rates depending on structure elevation and other factors. Rates for existing structures were subsi-dized to keep property values from dropping immediately and to encourage communities to par-ticipate in the NFIP and manage development in the floodplain. Within NFIP participating com-munities, flood insurance is mandatory for homes and businesses with a federally backed or reg-ulated mortgage in high flood risk areas (called Special Flood Hazard Areas), and is available for homes and businesses in moderate to low flood risk areas.

10
FIGURE River (alsEmergenclibrary/ass
FIGURE flood-relahttp://ww
1
Num
ber o
f Pre
side
ntia
l Dis
aste
r De
clar
atio
ns
1.1 Floodingso known as thcy Managemesets/images/5
1.2 Number ated events (bw.fema.gov/d
0
10
20
30
40
50
60
70
80
90
100
1953
1955
1957
Tyin
g of homes anhe Mouse Rivent Agency (F59875.
of presidentialue line) fromdisasters/grid/
1959
1961
1963
1965
1967
All Disasters
Flood Disaste
ng Flood Insu
PREPUBL
nd businesses ver) overflowFEMA). Avai
al disaster decm 1953 to 201/year.
1967
1969
1971
1973
1975
rs
urance to Risk
LICATION C
in Minot, Nowed its banks. ilable at http:/
clarations (bl3. SOURCE
1977
1979
1981
1983
1985
k for Low-Lyi
COPY
orth Dakota, in SOURCE: P
//www.fema.g
ack line) and E: Data from F
1985
1987
1989
1991
1993
ing Structures
n July 2011, wPhoto by Patsgov/media-
declarations FEMA,
1995
1997
1999
2001
s in the Flood
when the Souy Lynch, Fed
associated w
2003
2005
2007
2009
2011
dplain
uris deral
with
2011
2013

The National Flood Insurance program and the Need for Accurate Rates 11
P R E P U B L I C A T I O N C O P Y
Today, about 20 percent of the NFIP’s 5.5 million policies receive subsidized flood insur-ance rates. Subsidized structures are located across the nation, with the largest concentrations along the coasts (NRC, 2015). Rates for subsidized structures do not depend on elevation (alt-hough elevation affects risk), and so only a few of these structures have been surveyed to deter-mine their elevation. However, most subsidized structures are thought to be negatively elevated (see Figure 7.2 in PWC, 1999),1 that is, to have lowest floor elevations lower than the base flood elevation. This is the water surface elevation with 1 percent annual chance of being exceeded, and it is the NFIP benchmark for construction standards and floodplain management ordinances. Structures with lowest floor elevations equal to the base flood elevation have a 26 percent chance of flooding during the lifetime of a 30-year mortgage (compared with a 1–2 percent chance of catching fire; FEMA, 1998). Negatively elevated structures have a much higher chance of flood-ing over the same period and a greater potential for damage.
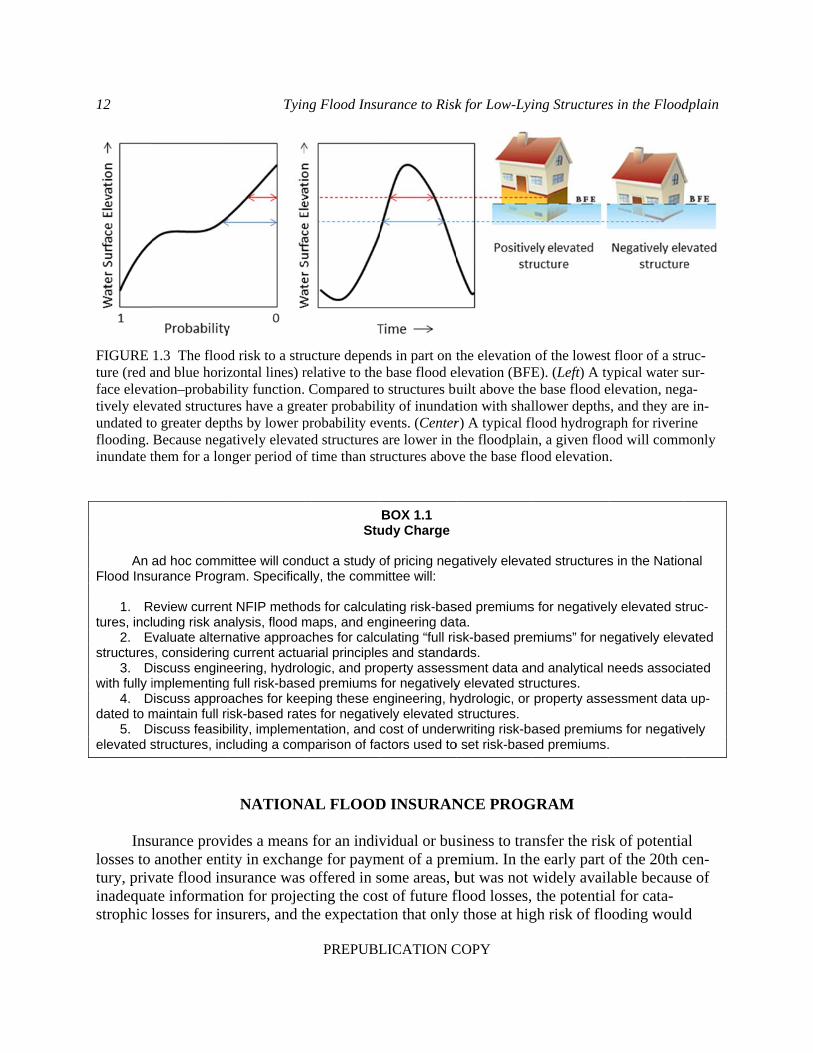
With the passage of the Biggert-Waters Flood Insurance Reform Act of 20122 and subse-quent legislation, subsidies are beginning to be phased out and premiums are expected to rise to levels that reflect the full risk of flooding (see “National Flood Insurance Program” below). Pre-mium increases for those negatively elevated structures are likely to be substantial, given the high flood risk and loss of the large subsidy. The NFIP’s current method for calculating risk-based rates was developed for structures built at or above the base flood elevation, but negatively elevated structures are susceptible to different flood conditions (e.g., more frequent flooding) and drivers of loss and damage (e.g., deeper and longer duration of flooding; Figure 1.3). Adjust-ments to account for these conditions in the rate setting method may be necessary to ensure that rates for negatively elevated structures are credible and fair.
This report evaluates methods for calculating risk-based premiums for negatively elevated structures and examines data and analysis needed to support risk-based premiums for these struc-tures, as well as issues of feasibility, implementation, and cost of underwriting risk-based premi-ums for negatively elevated structures (Box 1.1). As specified in the charge, the focus is on the methods for calculating premiums, not on what those premiums should be. A separate report (NRC, 2015) addresses the affordability of NFIP insurance premiums. At the request of the NFIP, the analysis focused on single family homes, which make up the majority of NFIP poli-cies.
1 Personal communication from Andy Neal, Federal Emergency Management Agency (FEMA), on July 9, 2014. The NFIP has elevation data for only 2.2 million policies, most of which are charged actuarial rates. 2 Public Law 112-141.
12
FIGURE ture (red aface elevatively elevundated toflooding. inundate t
An
Flood Insu
1. Rtures, incl
2. Estructures
3. Dwith fully i
4. Ddated to m
5. Delevated s
Insu
losses to tury, privinadequastrophic l
1.3 The flooand blue horization–probabivated structuro greater deptBecause negathem for a lon
ad hoc commurance Progra
Review currenuding risk anvaluate altern
s, consideringDiscuss engineimplementing
Discuss appromaintain full ri
Discuss feasibstructures, inc
urance provianother enti
vate flood inate informatilosses for in
Tyin
d risk to a struzontal lines) rility function.res have a greths by lower patively elevatnger period of
mittee will conam. Specifica
t NFIP methoalysis, flood mnative approag current actuaeering, hydro
g full risk-baseaches for keeisk-based rate
bility, implemecluding a com
NATIONA
ides a meansity in exchansurance wason for projecsurers, and t
ng Flood Insu
PREPUBL
ucture dependrelative to the Compared to
eater probabilprobability evted structures f time than str
Stu
duct a study oally, the comm
ods for calculamaps, and enaches for calcarial principlelogic, and proed premiums eping these ees for negativ
entation, and cmparison of fa
AL FLOOD
s for an indivnge for payms offered in scting the costhe expectati
urance to Risk
LICATION C
ds in part on te base flood eo structures buity of inundat
vents. (Centerare lower in tructures abov
BOX 1.1 udy Charge
of pricing negmittee will:
ating risk-basngineering datulating “full ris
es and standaoperty assessfor negativelyngineering, h
vely elevated cost of underwctors used to
D INSURAN
vidual or bument of a presome areas, bst of future fion that only
k for Low-Lyi
COPY
the elevation elevation (BFEuilt above thetion with shalr) A typical flthe floodplain
ve the base flo
gatively eleva
sed premiumsta. sk-based pre
ards. sment data any elevated str
hydrologic, or structures.
rwriting risk-bao set risk-base
NCE PROG
siness to tranemium. In thbut was not wflood losses, y those at hig
ing Structures
of the lowestE). (Left) A tye base flood ellower depths
flood hydrogran, a given floood elevation
ted structures
s for negative
emiums” for ne
nd analytical nructures. property asse
ased premiumed premiums.
GRAM
nsfer the riskhe early part widely avail the potentiagh risk of flo
s in the Flood
t floor of a strypical water selevation, negs, and they areaph for riverinod will comm
n.
s in the Natio
ly elevated st
egatively elev
needs associ
essment data
ms for negativ.
k of potentiaof the 20th clable becausal for cata-ooding woul
dplain
ruc-sur-ga-e in-ne
monly
nal
truc-
vated
ated
a up-
vely
al cen-e of
d
The National Flood Insurance program and the Need for Accurate Rates 13
P R E P U B L I C A T I O N C O P Y
seek insurance, thus diminishing the ability to spread risk (Pasterick, 1988). State regulation of insurance prices and tax policies limiting the ability to build adequate reserves added further dis-incentives for private companies to offer flood insurance. Private insurance companies stopped covering flood losses in 1929, a few years after a Mississippi River flood inundated 13 million acres of land and left more than 700,000 people homeless (AIR, 2005).
After devastating flooding from Hurricane Betsy triggered losses of more than $11 billion (in 2014 dollars; Michel-Kerjan, 2010) in 1965, the federal government began studying the fea-sibility of offering flood insurance (AIR, 2005). A few years later, Congress passed the National Flood Insurance Act of 1968,3 which established the National Flood Insurance Program. The program set minimum standards for development in the floodplain (i.e., elevating structures to at least the base flood elevation, limiting development in designated floodways) and offered federal flood insurance to residents and businesses in communities that agreed to adopt and enforce or-dinances that meet or exceed NFIP standards. Under the program, federally funded engineering studies and modeling would be used to assess and map flood hazards. This information would be used to promote better land use and construction decisions, and thereby reduce future flood loss-es as the vulnerability to inundation diminished over time. It would also be used to support in-surance rate setting. The Federal Emergency Management Agency currently administers the NFIP, sets insurance rates commensurate with program guidelines, and carries out floodplain mapping and analysis to support rate setting and floodplain management.
The NFIP was modeled after personal lines of insurance (e.g., homeowners, automobile), with risks grouped into classes and limited use of individual risk ratings. However, NFIP insur-ance differed from private insurance in three key ways. First, the NFIP was not initially capital-ized. Rather than hold sufficient funds for eventual heavy flood losses, the program would re-ceive an infusion of funds from the federal treasury when necessary. Limited borrowing authori-ty from the federal treasury would provide a short-term backstop to enable insured claims to be paid in cases of high losses. Second, the NFIP could not choose who would be insured. All resi-dents and businesses in a participating community would have access to NFIP flood insurance, even the high risk policyholders. Third, owners of existing homes and businesses (the majority of policyholders) were charged premiums that were significantly lower than warranted by their risk of flooding. It was anticipated that over time, older floodprone construction would be removed from the policyholder base, and the new policyholders would pay risk-based rates. No provision was made to cover the premium shortfall, such as routinely infusing funds into the program or building additional charges into premiums for newer construction.
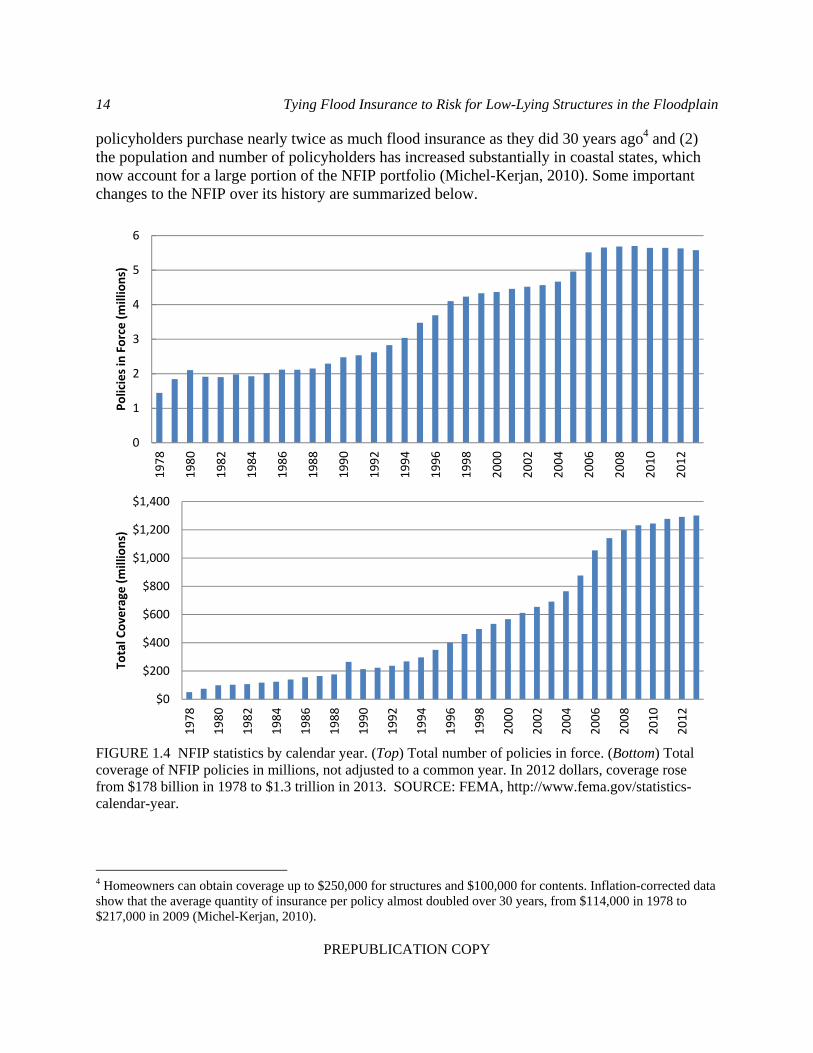
Over the years, Congress made a number of adjustments to the NFIP. A changing mix of incentives and penalties, coupled with periodic reminders of the adverse consequences of flood-ing, led to significant growth of the program. The number of policies issued rose from about 1.5 million in 1978 to 5.5 million at the end of 2013 (Figure 1.4, top). In addition, the total value of property insured by the NFIP rose from $178 billion in 1978 (in 2012 prices) to $1.3 trillion in 2013 (Figure 1.4, bottom). The increase in insured value has been attributed to two factors: (1)
3 Public Law 90-448.
14 Tying Flood Insurance to Risk for Low-Lying Structures in the Floodplain
PREPUBLICATION COPY
policyholders purchase nearly twice as much flood insurance as they did 30 years ago4 and (2) the population and number of policyholders has increased substantially in coastal states, which now account for a large portion of the NFIP portfolio (Michel-Kerjan, 2010). Some important changes to the NFIP over its history are summarized below.
FIGURE 1.4 NFIP statistics by calendar year. (Top) Total number of policies in force. (Bottom) Total coverage of NFIP policies in millions, not adjusted to a common year. In 2012 dollars, coverage rose from $178 billion in 1978 to $1.3 trillion in 2013. SOURCE: FEMA, http://www.fema.gov/statistics-calendar-year.
4 Homeowners can obtain coverage up to $250,000 for structures and $100,000 for contents. Inflation-corrected data show that the average quantity of insurance per policy almost doubled over 30 years, from $114,000 in 1978 to $217,000 in 2009 (Michel-Kerjan, 2010).
0
1
2
3
4
5
6
1978
1980
1982
1984
1986
1988
1990
1992
1994
1996
1998
2000
2002
2004
2006
2008
2010
2012
Polic
ies i
n Fo
rce
(mill
ions
)
$0
$200
$400
$600
$800
$1,000
$1,200
$1,400
1978
1980
1982
1984
1986
1988
1990
1992
1994
1996
1998
2000
2002
2004
2006
2008
2010
2012
Tota
l Cov
erag
e (m
illio
ns)
The National Flood Insurance program and the Need for Accurate Rates 15
P R E P U B L I C A T I O N C O P Y
Evolution of the NFIP
The NFIP began operations in 1969, and a consortium of private companies (the National Flood Insurers Association) was established to sell and service NFIP flood insurance policies (AIR, 2005). At the time, the purchase of flood insurance was not required. In 1972, Hurricane Agnes revealed that few property owners had availed themselves of NFIP flood insurance. The Flood Disaster Protection Act of 19735 made insurance purchase mandatory for any resident with a federally backed mortgage in a NFIP-participating community. Lenders were responsible for ensuring that this requirement was carried out. To encourage acceptance of the new insurance purchase requirements, insurance subsidies were expanded to cover structures built after initial floodplain mapping, but before 1975, and the subsidized rates were substantially lowered. As a result, community and state participation in the NFIP greatly expanded and the number of poli-cies increased.
Other public policy decisions made in the 1970s concerned changing flood risks. Develop-ment in the floodplain and other factors (e.g., climate change) might increase the flood risk for some structures that had been built in compliance with NFIP standards. To prevent large increas-es in premiums, these structures were allowed to retain their lower risk rating classification if conditions beyond the control of the property owner later increased the flood risk. This practice is often referred to as administrative grandfathering. It was anticipated that the rates for classes with grandfathered properties would have to be adjusted over time to reflect the mix of some higher risk properties.
In the 1970s, most of the properties in the NFIP were older construction and received sub-sidized insurance rates. Consequently, the premiums collected were insufficient to cover the an-nual costs of the program. From 1981 to 1988, rates were increased and coverage was changed to reduce premium subsidies and to improve the financial condition of the NFIP. Another major change concerned private insurance company participation in the NFIP. In 1977, the National Flood Insurers Association dissolved its relationship with the NFIP because of disagreements about authority, financial control, and other operational matters (AIR, 2005). In 1983, the Write Your Own Program reestablished a relationship with insurance companies, allowing them to sell and service the standard NFIP policies in their own names, without bearing any of the risk, in exchange for a fee. The objective was to use insurance industry knowledge and capabilities to increase the size and geographic distribution of the NFIP policy base and to improve service to NFIP policyholders.6
In the late 1980s, it became clear that older floodprone construction was only slowly being removed from the policyholder base, and so mitigation began to be considered. The Robert T. Stafford Disaster Relief and Emergency Assistance Act of 19887 authorized funding for hazard mitigation projects aimed at reducing the risk of future flood damage or loss, such as elevating buildings, utilities, or roads; increasing the capacity of storm drainage systems; restoring wet-lands or landforms that provide natural flood protection; or removing structures that are flooded
5 Public Law 93-234. 6 See http://www.fema.gov/national-flood-insurance-program/what-write-your-own-program. 7 Public Law 100-707.
16 Tying Flood Insurance to Risk for Low-Lying Structures in the Floodplain
PREPUBLICATION COPY
repeatedly. In 1990, the NFIP implemented the Community Rating System, which rewarded community floodplain management efforts that go beyond minimum NFIP standards. Under the Community Rating System, communities receive points for taking additional actions related to flood hazard mapping and regulations, flood damage reduction, flood preparedness, and public education about flood risk in Special Flood Hazard Areas. These points are translated into dis-counts on insurance premiums for policyholders in that community.8
In 1993, record flooding in the upper Mississippi and lower Missouri River basins showed that only about 10 percent of properties eligible for flood insurance were insured (AIR, 2005). The NFIP Reform Act of 19949 introduced monetary penalties for lenders who do not enforce federal flood insurance requirements and denied future federal disaster assistance to property owners who allowed their flood insurance policy to lapse after receiving disaster assistance. In the late 1990s and early 2000s, Congress turned its attention to properties that flooded repeated-ly. The Flood Insurance Reform Act of 200410 targeted mitigation funding toward the worst re-petitive loss properties and denied subsidized premiums to property owners who refused mitiga-tion assistance.
From 1987 to 2005, the NFIP had been able to use premium income to repay funds it bor-rowed from the U.S. Treasury to cover insured flood losses. Premium income was set to cover the historical average loss year, from 1978 to present. In 2005, hurricanes Dennis, Katrina, Rita, and Wilma struck, causing the first truly catastrophic losses to the NFIP in its history (Figure 1.5). In fact, NFIP claims from these hurricanes, which were nearly $19 billion, exceeded the total losses of the program over its history (AIR, 2005). In December 2013, the NFIP owed the Treasury $24 billion, primarily to pay claims associated with hurricanes Katrina and Sandy (GAO, 2014).
A recent review of the NFIP concluded that “the NFIP is constructed using an actuarially sound formulaic approach for the full-risk classes of policies, but is financially unsound in the aggregate because of constraints (i.e., legislative mandates) that go beyond actuarial considera-tions” (NRC, 2013, p. 79). The Biggert-Waters Flood Insurance Reform Act of 2012 aimed to put the NFIP on sounder financial footing by authorizing higher premiums to build up program reserves in advance of heavy loss years. The act also phased out subsidized and grandfathered insurance rates over several years. However, if a policy lapsed or the structure was sold, then the owner would then be charged the risk-based rate based on the latest flood maps.11 Premiums be-gan increasing at the end of 2013, and some of these increases were large. The Homeowner Flood Insurance Affordability Act of 201412 rolled back these large, sudden increases and gave
8 Currently about two-thirds of all NFIP insurance policies in force are in Community Rating System communities. Approximately 56 percent of participating communities take actions that earn premium discounts of 5–10 percent, and 43 percent of communities earn discounts of 15–25 percent. Only a few communities earn premium discounts of 30–45 percent. See the Community Rating Fact Sheet, http://www.fema.gov/media-library-data/20130726-1605-20490-0645/communityratingsystem_2012.pdf. 9 Public Law 103-325. 10 Public Law 108-264. 11 A recent analysis of the NFIP portfolio revealed that the average tenure of flood insurance is between 3 and 4 years, so this provision is likely to affect a significant number of homeowners (Michel-Kerjan et al., 2012). 12 Public Law 113-89.

The National Flood Insurance program and the Need for Accurate Rates 17
P R E P U B L I C A T I O N C O P Y
the NFIP the flexibility to set annual rate increases up to 18 percent for most policies.13 Although the goal of phasing in risk-based rates has not changed, the annual rate increase that the NFIP chooses will determine how long it will take to reach this goal.
FIGURE 1.5 Annual insured claims paid by the NFIP, unadjusted to a common year. SOURCE: FEMA, http://www.fema.gov/statistics-calendar-year.
ORGANIZATION OF THE REPORT
This report examines methods for calculating risk-based rates for negatively elevated struc-tures in the NFIP. Chapter 2 provides an overview of current NFIP methods for calculating flood insurance rates, as well as the flood studies and mapping used to support rate setting. Setting risk-based insurance rates depends on an accurate assessment of flood risk—the magnitude of flood loss and the likelihood that losses of that magnitude will occur. Chapter 3 compares the NFIP and other methods for assessing flood risk and calculating flood losses. Chapter 4 identi-fies factors that affect negatively elevated structures and changes to NFIP methods that could address them. Finally, Chapter 5 presents the committee’s conclusions and discusses data and implementation issues. Biographical sketches for the committee members (Appendix A), a glos-sary of technical terms used in this report (Appendix B), and a list of acronyms and abbreviations (Appendix C) appear at the end of the report.
13 See the overview of the Homeowner Flood Insurance Affordability Act, http://www.fema.gov/flood-insurance-reform.
02468
101214161820
1978
1980
1982
1984
1986
1988
1990
1992
1994
1996
1998
2000
2002
2004
2006
2008
2010
2012
Loss
Dol
lars
Pai
d (m
illio
ns)

19 P R E P U B L I C A T I O N C O P Y
2
NFIP Procedures for Analyzing Flood Hazard and Calculating Insurance Rates
Under the National Flood Insurance Program (NFIP), engineers carry out hydrologic and hydraulic analyses to describe flood hazard, calculate flood elevations, delineate floodplain boundaries, and designate flood zones for insurance rating. The results of the flood studies are summarized in reports and portrayed graphically on Flood Insurance Rate Maps (FIRMs). The NFIP, Write Your Own Companies, and insurance agencies use the maps to determine whether a structure being insured is located in a Special Flood Hazard Area, and, if so, its elevation relative to the base flood elevation. This information is combined with additional information about the flood hazard, exposure to the hazard, structure characteristics, expenses, and other factors to de-termine insurance rates. This chapter provides an overview of NFIP flood studies, Flood Insur-ance Rate Maps, and methods for calculating flood insurance rates.
FLOODPLAIN ANALYSIS AND MAPPING
NFIP flood study methods and maps were reviewed in detail in Mapping the Zone: Improv-ing Flood Map Accuracy (NRC, 2009), and are summarized below.
Flood Studies
The type of flood study depends on the type of flood hazard, primarily riverine or coastal. Riverine flood studies focus on the river’s watershed, precipitation, the topography along the riv-er and adjacent floodplain, and the hydraulic characteristics of the river and floodplain. The stud-ies involve the following steps, which are illustrated in Figure 2.1:
1. Hydrologic analyses are conducted to estimate the river discharge rate with 1 percent annual chance of exceedance. Depending on data availability, the discharge rate is estimated us-ing (a) statistical analyses of historical annual maximum discharges measured at stream gages; (b) regression equations derived from observations at similar locations in the region to estimate the 1 percent annual chance exceedance discharge as a function of drainage area and other river

20 Tying Flood Insurance to Flood Risk for Low-Lying Structures in the Floodplain
P R E P U B L I C A T I O N C O P Y
basin characteristics; or (c) precipitation-runoff models, which convert rainfall and snowmelt to stream discharge rates. These calculations are based on past events and do not account for chang-ing hydrologic conditions resulting from watershed development, increased storm intensity, or other factors.
2. Hydraulic modeling is carried out to determine the depths that correspond to the river discharge rates estimated in the hydrologic analyses. Software applications such as HEC-RAS are commonly used to model the movement of water. HEC-RAS simulates flow that is predomi-nantly parallel to the channel, based on the geometry of the channel and floodplain, the slope of the channel and ground, the resistance to flow due to channel roughness and bridges and obstruc-tions, and ponding and pooling of water in the channel and on the floodplain. In the analysis, levees that meet NFIP standards are modeled as blocking flow onto the floodplain, and levees that do not meet the standard are modeled as if they fail to protect. This model accounts for the loss of natural water storage in the floodplain. The result of the computation is an estimated base flood elevation for a cross section of the channel and floodplain. When flow patterns are more spatially variable, a two-dimensional hydraulic model is used to compute the maximum water surface elevation for cells or polygons that represent the channel and floodplain geometry.
3. Comparisons of estimated water surface elevations at river cross sections (or cells or polygons) to the ground elevations along the river are made to define the extent and properties of the inundated floodplain. If the computed water surface elevation for a point or cell is greater than the ground elevation, then the point or cell will be inundated by the 1 percent annual chance exceedance flood and the difference between the two elevations is the inundation depth. Ground elevations are estimated using topographic data collected in field surveys or taken from digital elevation models derived from aerial surveying (photogrammetry) or, since the early 2000s, from remote sensing technologies, such as lidar (light detection and ranging).
The same process is followed for the 0.2 percent annual chance exceedance flood and de-lineation of the moderate flood hazard area. The studies also establish the floodway—the stream channel and adjacent part of the floodplain that must remain open to permit passage of the 1 per-cent annual chance exceedance discharge, and thus prevent an increase in flood levels.
Coastal flood studies are similar to riverine flood studies, but they also assess the effects of storm surge (water piled up against the shore during a storm) and tidal- and wind-driven wave action. The studies use data on fetch (the distance over water that the wind blows in a single di-rection), near-shore terrain and water depths, and wind speed to predict storm surge properties. Data on past storms from gages and historic high water marks are used with statistical and con-ceptual models to determine the storm surge elevations that have a 1 percent chance of being ex-ceeded annually. Next, transects perpendicular to the shoreline are surveyed to determine on-shore and offshore ground elevations. The elevations are then used to compute the height of wave crests and wave run-up (the rush of waves up a slope or structure). For coastal flooding, the base flood elevation is the stillwater elevation plus wave run-up, or the wave crest elevation, whichever is greater (FEMA, 2011).

NFIP Procedures for Analyzing Flood Hazard and Calculating Insurance Rates 21
P R E P U B L I C A T I O N C O P Y
HydraulicModels WSE Flood
MapQp
Rainfall-RunoffModels
Statistical Analysis
Regional/LocalRegression
Hyd
rom
eteo
rolo
gica
l Dat
a(P
reci
pita
tion,
Stre
amflo
w) Base Maps &
Surveys
DEM
FIGURE 2.1 Schematic of an idealized riverine flood study showing the data inputs (rounded boxes), models and methods used in the hydrologic and hydraulic analysis (boxes), and outputs (circles), includ-ing the flood discharge (Qp) and the water surface elevation (WSE). Note: DEM = digital elevation mod-el. SOURCE: NRC (2009).
Flood studies can be expensive (up to a few tens of thousands of dollars per stream mile; NRC, 2009), so the NFIP strategy is to carry out the detailed studies described above in densely populated areas. In relatively unpopulated areas, the NFIP generally conducts approximate stud-ies, which use existing flood data and floodplain information (e.g., historic high water marks, aerial photographs of previous floods, empirical information on stream characteristics) to gener-ate an approximate outline of the Special Flood Hazard Area. Because detailed hydraulic anal-yses are not performed, base flood elevations are generally not determined in approximate stud-ies.
Flood Insurance Rate Maps
Results from flood studies are portrayed graphically on FIRMs, which show flood hazard areas and flood zones, and may also show base flood elevations, floodways, and other data. An example of a FIRM in a riverine area is shown in Figure 2.2. FIRMs are used for a variety of purposes, including rating flood insurance policies; regulating new development in floodprone areas; determining whether flood insurance must be purchased as a condition of a loan; and local flood mitigation planning, evacuation, and infrastructure design.
About one-third of the nation’s 3.5 million miles of rivers and coasts has been mapped, covering more than 90 percent of the U.S. population (NRC, 2009). Only about half of those maps have flood elevations. Moreover, the age and quality of these maps vary. In 2008, half of
22
the NFIP(GAO, 2flood hazappropriastudies, b
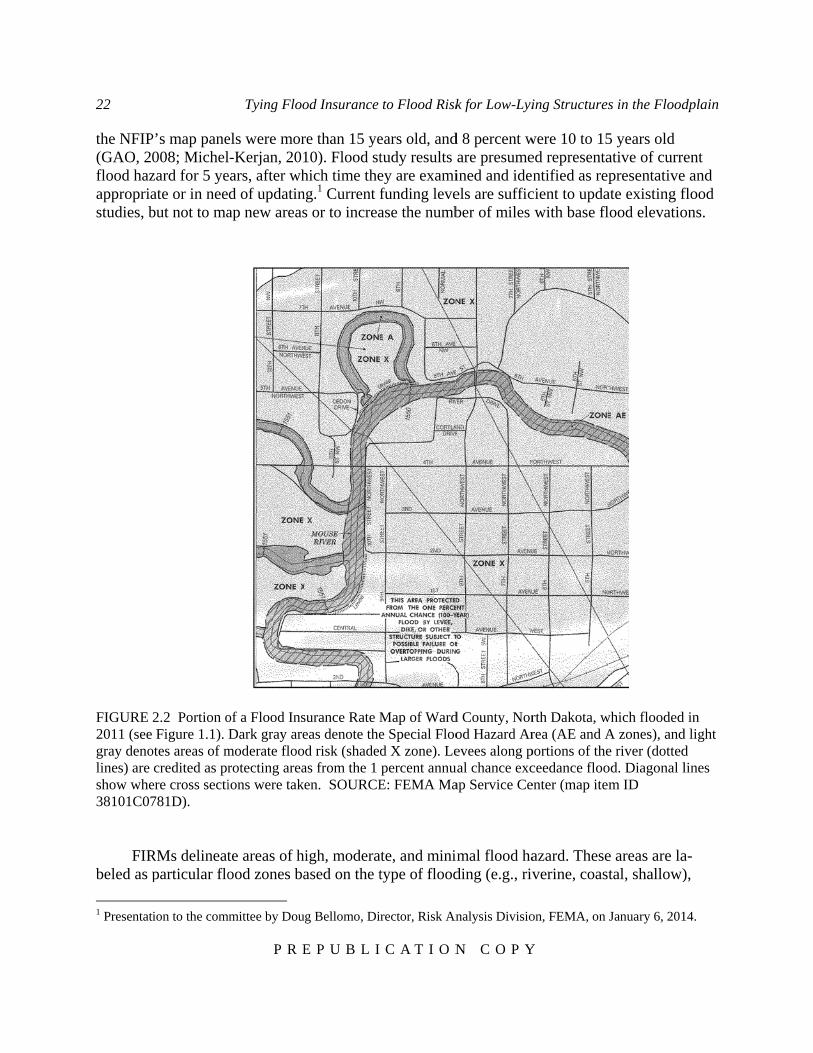
FIGURE 2011 (seegray denolines) are show whe38101C07
FIRbeled as p
1 Presentat
P’s map pane008; Michelzard for 5 yeate or in neebut not to ma
2.2 Portion o Figure 1.1).
otes areas of mcredited as pr
ere cross secti781D).
RMs delineatparticular flo
tion to the com
Tying Floo
P R E
els were morl-Kerjan, 201ears, after whd of updatinap new areas
of a Flood InsDark gray are
moderate floorotecting areaions were tak
te areas of hood zones ba
mmittee by Dou
od Insurance
E P U B L I
re than 15 ye10). Flood sthich time theng.1 Current fs or to increa
surance Rate Meas denote thed risk (shaded
as from the 1 en. SOURCE
igh, moderaased on the t
ug Bellomo, Di
to Flood Risk
C A T I O N
ears old, andtudy results ey are examifunding levease the numb
Map of Warde Special Flood X zone). Lepercent annu
E: FEMA Ma
ate, and minitype of flood
rector, Risk An
k for Low-Lyi
N C O P Y
d 8 percent ware presumeined and ideels are sufficber of miles
d County, Norod Hazard Arevees along p
ual chance excap Service Ce
mal flood hading (e.g., riv
nalysis Divisio
ing Structures
Y
were 10 to 15ed representantified as rep
cient to updawith base fl
rth Dakota, wrea (AE and A
portions of theceedance flooenter (map item
azard. Theseverine, coast
on, FEMA, on
s in the Flood
5 years old ative of currepresentative
ate existing flood elevatio
which flooded A zones), ande river (dottedod. Diagonal lm ID
e areas are latal, shallow)
January 6, 201
dplain
ent e and flood ons.
in d light d lines
a-),
14.
NFIP Procedures for Analyzing Flood Hazard and Calculating Insurance Rates 23
P R E P U B L I C A T I O N C O P Y
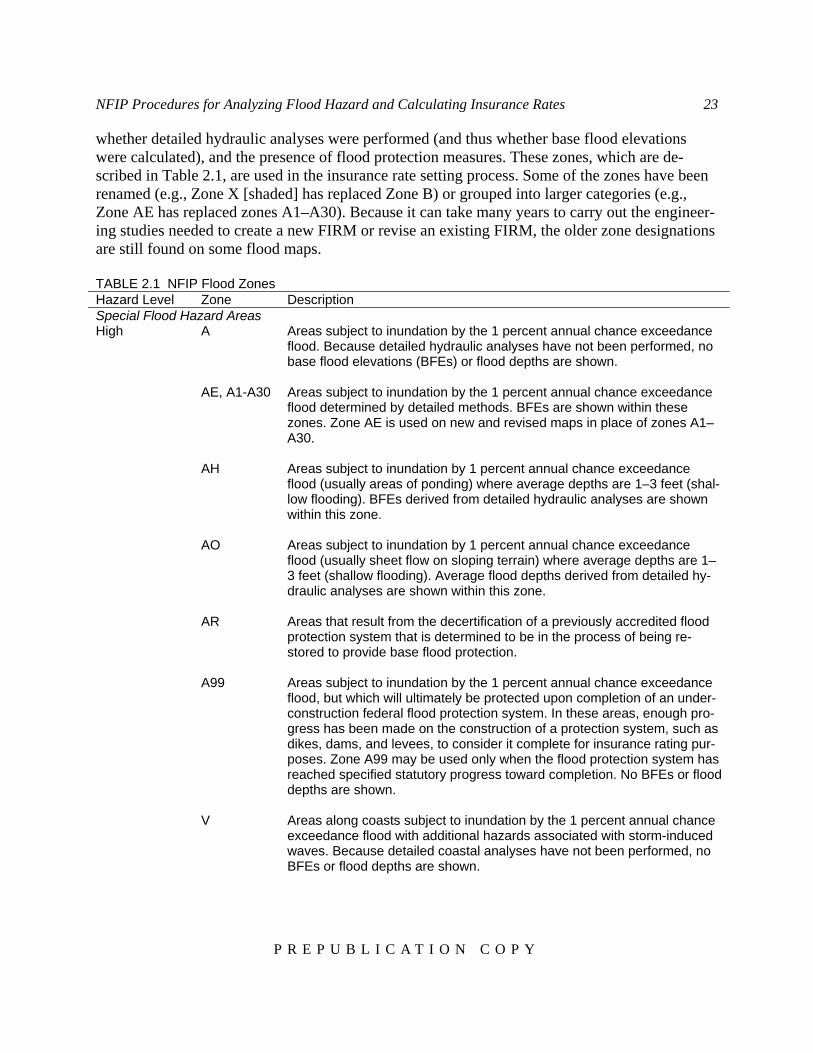
whether detailed hydraulic analyses were performed (and thus whether base flood elevations were calculated), and the presence of flood protection measures. These zones, which are de-scribed in Table 2.1, are used in the insurance rate setting process. Some of the zones have been renamed (e.g., Zone X [shaded] has replaced Zone B) or grouped into larger categories (e.g., Zone AE has replaced zones A1–A30). Because it can take many years to carry out the engineer-ing studies needed to create a new FIRM or revise an existing FIRM, the older zone designations are still found on some flood maps. TABLE 2.1 NFIP Flood Zones Hazard Level Zone Description Special Flood Hazard Areas High A Areas subject to inundation by the 1 percent annual chance exceedance
flood. Because detailed hydraulic analyses have not been performed, no base flood elevations (BFEs) or flood depths are shown.
AE, A1-A30 Areas subject to inundation by the 1 percent annual chance exceedance flood determined by detailed methods. BFEs are shown within these zones. Zone AE is used on new and revised maps in place of zones A1–A30.
AH Areas subject to inundation by 1 percent annual chance exceedance flood (usually areas of ponding) where average depths are 1–3 feet (shal-low flooding). BFEs derived from detailed hydraulic analyses are shown within this zone.
AO Areas subject to inundation by 1 percent annual chance exceedance flood (usually sheet flow on sloping terrain) where average depths are 1–3 feet (shallow flooding). Average flood depths derived from detailed hy-draulic analyses are shown within this zone.
AR Areas that result from the decertification of a previously accredited flood protection system that is determined to be in the process of being re-stored to provide base flood protection.
A99 Areas subject to inundation by the 1 percent annual chance exceedance flood, but which will ultimately be protected upon completion of an under-construction federal flood protection system. In these areas, enough pro-gress has been made on the construction of a protection system, such as dikes, dams, and levees, to consider it complete for insurance rating pur-poses. Zone A99 may be used only when the flood protection system has reached specified statutory progress toward completion. No BFEs or flood depths are shown.
V Areas along coasts subject to inundation by the 1 percent annual chance exceedance flood with additional hazards associated with storm-induced waves. Because detailed coastal analyses have not been performed, no BFEs or flood depths are shown.
24 Tying Flood Insurance to Flood Risk for Low-Lying Structures in the Floodplain
P R E P U B L I C A T I O N C O P Y
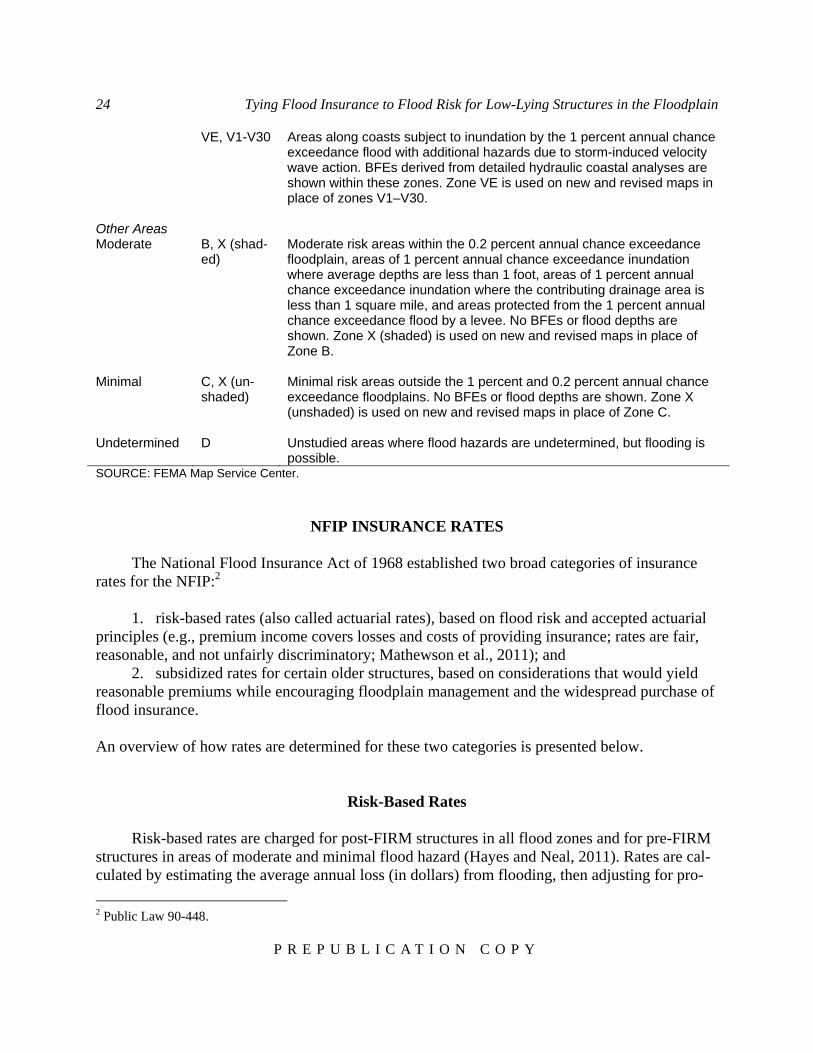
VE, V1-V30 Areas along coasts subject to inundation by the 1 percent annual chance exceedance flood with additional hazards due to storm-induced velocity wave action. BFEs derived from detailed hydraulic coastal analyses are shown within these zones. Zone VE is used on new and revised maps in place of zones V1–V30.
Other Areas Moderate B, X (shad-
ed) Moderate risk areas within the 0.2 percent annual chance exceedance floodplain, areas of 1 percent annual chance exceedance inundation where average depths are less than 1 foot, areas of 1 percent annual chance exceedance inundation where the contributing drainage area is less than 1 square mile, and areas protected from the 1 percent annual chance exceedance flood by a levee. No BFEs or flood depths are shown. Zone X (shaded) is used on new and revised maps in place of Zone B.
Minimal C, X (un-
shaded) Minimal risk areas outside the 1 percent and 0.2 percent annual chance exceedance floodplains. No BFEs or flood depths are shown. Zone X (unshaded) is used on new and revised maps in place of Zone C.
Undetermined D Unstudied areas where flood hazards are undetermined, but flooding is
possible. SOURCE: FEMA Map Service Center.
NFIP INSURANCE RATES
The National Flood Insurance Act of 1968 established two broad categories of insurance rates for the NFIP:2
1. risk-based rates (also called actuarial rates), based on flood risk and accepted actuarial principles (e.g., premium income covers losses and costs of providing insurance; rates are fair, reasonable, and not unfairly discriminatory; Mathewson et al., 2011); and
2. subsidized rates for certain older structures, based on considerations that would yield reasonable premiums while encouraging floodplain management and the widespread purchase of flood insurance. An overview of how rates are determined for these two categories is presented below.
Risk-Based Rates
Risk-based rates are charged for post-FIRM structures in all flood zones and for pre-FIRM structures in areas of moderate and minimal flood hazard (Hayes and Neal, 2011). Rates are cal-culated by estimating the average annual loss (in dollars) from flooding, then adjusting for pro-
2 Public Law 90-448.

NFIP Procedures for Analyzing Flood Hazard and Calculating Insurance Rates 25
P R E P U B L I C A T I O N C O P Y
gram costs (Box 2.1). NFIP estimates of average annual loss are made using the NFIP hydrologic method, which has two components (FEMA, 2013d):
1. a description of the hazard that estimates the probability of various depths of flood wa-ter in the structure (denoted PELV in the rate formula), based on selected NFIP hydrologic and hydraulic analyses; and
2. a description of exposure and vulnerability that estimates the damage that flood water depths would cause (denoted DELV), based on NFIP claims from similar inundation depths. The average annual loss is calculated by summing the probability-weighted estimate of damage amounts for each possible inundation depth within the structure.
BOX 2.1 NFIP Formula for Calculating Risk-Based Rates
The NFIP actuarial rate formula for calculating risk-based rates is as follows:
= × × × × , where PELV is the annual probability that flood waters will reach or exceed a given depth relative to the base flood elevation. PELVi is the incremental probability that the flood water depths are in a certain interval DELV is the damage to the property, expressed as a percentage of the total property value (replacement value for structure, actual cash value for contents), resulting from that level of flood water. DELVi is the average damage within a certain depth interval corresponding to PELVi Min is the minimum elevation relative to the lowest floor at which flood damage occurs Max is the elevation relative to the lowest floor at which flood damage approaches a maximum LADJ is a loading factor to account for loss adjustment expenses DED is a factor to eliminate that portion of the loss that will be borne by the policyholder through his or her deductible UINS is a factor to adjust for how much a policyholder has underinsured his or her property EXLOSS is the expected loss ratio, which serves as a loading for underwriting expenses, a contingency factor, and other factors ________ SOURCE: FEMA (2013d).
The average annual loss is converted into an insurance rate by adjusting for expenses and
other factors (the second term of the formula in Box 2.1). Rates are adjusted upward (loaded) to account for loss adjuster fees and claims investigations costs (LADJ) as well as agent commis-sions and acquisition expenses and contingencies (EXLOSS). The rates are also adjusted upward to account for underinsurance (UINS; i.e., the insured value is less than the full value of the property). Rates are adjusted downward to account for the portion of the claim that will not be covered because of the policy deductible (DED). It should be noted that the rate formula present-
26 Tying Flood Insurance to Flood Risk for Low-Lying Structures in the Floodplain
P R E P U B L I C A T I O N C O P Y
ed here is a simplification useful for illustrating the concepts. The actual rate formula employed by the NFIP contains more complicated terms for adjusting for underinsurance and for compu-ting rates for basic and additional limits of insurance coverage (see Hayes and Neal, 2011).
Application of the rate formula yields a price per unit of insurance for each $100 of proper-ty coverage. The rate is multiplied by the amount of insurance being purchased to determine the premium a policyholder pays. In Community Rating System communities, policyholders receive premium discounts for mitigation actions taken to reduce flood risk in the community, such as improving drainage systems (see Chapter 1, “National Flood Insurance Program”). Individual policyholders can also reduce their premiums through mitigation, for example, by elevating their home or business. In such cases, the average flood losses will be lower, and the insurance rating will be redone using the revised rating elements. The effect of most substantive mitigation ac-tions can be accommodated in the current rate setting process. The impact on rates and the costs of mitigation actions, including those not covered in current rate setting and underwriting pro-cesses (e.g., residential floodproofing), are being investigated by the NFIP (FEMA, 2015).
The hydrologic method is used to determine risk-based rates in Special Flood Hazard Area zones, where the most detailed engineering studies are carried out and base flood elevations are established. About one-third of the risk-based insurance policies cover structures in other zones (e.g., Zone X; Hayes and Neal, 2011).3 In these zones, the NFIP has determined that the costs to develop flood magnitude and probability functions are too high relative to the program’s flood-plain management benefits (Hayes and Neal, 2011). Consequently, risk-based rates in these zones are based on extrapolations of the hydrologic method, along with other actuarial and engi-neering judgments and underwriting experience.
The insurance premium paid by a flood insurance policyholder depends on the flood zone, occupancy (e.g., single family, nonresidential), construction (e.g., no basement), the location of contents (e.g., lowest floor, above the lowest floor), the number of floors, the type of supporting foundation, and the structure’s elevation relative to the base flood elevation (FEMA, 2013b). The NFIP uses these factors to group structures into classes, then determines the average annual loss and insurance rates for each class, rather than for individual structures. Consequently, a policy-holder will pay an amount averaged over the pool of all other policyholders in a given class of structures, which may be somewhat higher or lower than the premium would be if it were based on his or her individual flood risk (e.g., see Michel-Kerjan et al., 2015). Grouping insureds into classes is a standard industry practice.
Subsidized Rates
Subsidized rates are available by statute for older structures built before floodplain maps were issued and adopted by the community (pre-FIRM structures) as well as for certain newer (post-FIRM) structures, such as those with protective structural measures under construction. Pre-FIRM subsidized rates do not depend on the structure elevation. Rather, the insurance rate is based on the flood zone, occupancy, construction, and contents location (FEMA, 2013b). Pre-
3 Personal communication from Andy Neal, FEMA, on March 3, 2014.
NFIP Procedures for Analyzing Flood Hazard and Calculating Insurance Rates 27
P R E P U B L I C A T I O N C O P Y
FIRM subsidized rates are employed primarily in Special Flood Hazard Areas where insurance purchase is mandatory. Subsidized rates for structures that are not primary residences or that suf-fer severe repetitive losses are beginning to be phased out (see “National Flood Insurance Pro-gram” in Chapter 1).
Subsidized rates are based both on subjective (e.g., political, public policy) considerations and objective processes, including comparisons with the amount needed to meet NFIP premium income targets. Prior to 2005, the NFIP total annual premium income was targeted so that the combination of subsidized and risk-based premiums would be at least sufficient for the historical average loss year, based on losses and associated expenses since 1978, and corrected for inflation and changes in coverage and mix of policy holders. However, catastrophic flood losses to the NFIP in 2005 (from hurricanes Katrina, Rita, and Wilma) raised the historical average loss year so much that using it to set NFIP premium income targets would have required the elimination of subsidized premiums. Consequently, the NFIP gives only partial weight to the 2005 losses in es-tablishing the historical losses benchmark (Hayes and Neal, 2011), which reduces, but does not eliminate subsidies.
Pre-FIRM subsidized premiums are about 55–60 percent lower than warranted by their true flood risk (Hayes and Neal, 2011). However, the average subsidized premium being paid is still significantly higher than the average risk-based premium being paid, because the flood risk to pre-FIRM structures is generally so much higher than the flood risk to structures that comply with modern floodplain management ordinances.
Rating for Negatively Elevated Structures
The vast majority of negatively elevated structures in Special Flood Hazard areas are pre-FIRM structures eligible for subsidized rates and post-FIRM structures grandfathered into rates that are lower than indicated by new mapping. Of the approximately 1 million negatively elevat-ed structures in the NFIP portfolio, only about 240,000 have structure elevation data and have been actuarially rated.4 These structures are mainly post-FIRM construction built out of compli-ance with the base flood elevation standard. An example comparing subsidized and risk-based premiums for a single family home in an AE zone is given in Table 2.2. The premiums for nega-tively elevated structures are highlighted in green.
The process for setting risk-based rates for negatively elevated structures is similar to that used for structures built at or above the base flood elevation, although additional underwriting procedures are required. In particular, the valuation of machinery, equipment, and appliances in basements, enclosures, and crawlspaces is factored into the rate; and additional information is collected on the construction and use of crawlspaces. Policy applications for structures that are more than 1 foot below the base flood elevation in an AE zone or more than 3 feet below the base flood elevation in a VE zone receive a more detailed review (FEMA, 2013c). In some cases, a local building official, engineer, or architect must validate assertions about the construction of the structure and enclosures below (e.g., crawlspaces, garage), as well as how a structure is ele-
4 Personal communication from Andy Neal, FEMA, on July 9, 2014.

28 Tying Flood Insurance to Flood Risk for Low-Lying Structures in the Floodplain
P R E P U B L I C A T I O N C O P Y
vated off the ground (e.g., foundation walls, piles). These additional procedures are intended to determine the vulnerability of negatively elevated structures to damage and how that vulnerabil-ity might affect the potential for damage to upper portions of the structure. TABLE 2.2 Comparison of Subsidized and Risk-Based Premiums for a Single Family Home in an AE Zone
Premium for Type of Structurea Type of Rating
Difference between lowest floor elevation and base flood elevation
2 or more floors with basement, no machinery or equipmentb
1 floor, non-elevated, no basement or crawlspacec
Subsidized rating Not applicable $4,203 $3,600 Risk-based rating +4 feet $553 $553 +3 feet $572 $591 +2 feet $604 $667 +1 feet $712 $931 +0 feet $1,090 $1,815 -1 feet $2,610 $5,642 -2 feet $2,764 $6,443 -3 feet $2,894 $8,589 -4 feet $3,035 $10,723 -5 feet $3,574 $13,081 -6 feet $4,169 $15,184 -7 feet $4,970 $17,215 -8 feet $5,977 $19,382 -9 feet $7,200 $21,467 -10 feet $8,814 $23,496 a Premium calculation includes coverage of $250,000 for the structure and $100,000 for its contents, a standard de-ductible, federal policy fee and reserve, and no Community Rating System discount. b Limited basement coverage generally means lower premiums. c All habitable space at ground level increases the premium. SOURCE: Presentation to the committee by Joseph Cecil, Insurance Examiner, FEMA, on January 6, 2014.
The additional underwriting procedures described above provide a means to set risk-based rates for negatively elevated structures without adjusting the terms of rate formula to ac-commodate the flood conditions and drivers of damage and loss that affect these structures. The following chapters examine the terms in the actuarial rate formula in more detail, and discuss how they can be adjusted to develop fair and credible rates for negatively elevated structures.
29 P R E P U B L I C A T I O N C O P Y
3
Methods for Assessing Flood Risk
A key to informed decision making on risk management and risk transfer (insurance) is an accurate assessment of risk. In the context of this report, flood risk refers to the magnitude of economic flood loss and the probability that losses of that magnitude will occur. Flood risk as-sessments focus on four main components:
1. Flood hazard—the probability and magnitude (e.g., depth, velocity, discharge) of flood-ing
2. Exposure—the economic value of assets subjected to flood hazard 3. Vulnerability—the relationship of flood hazard properties to economic loss 4. Performance—the effectiveness and behavior of flood protection and damage mitiga-
tion measures that modify the flood hazard, the exposure, or the vulnerability This chapter describes how these four flood risk components are commonly assessed and dis-cusses variations in assessment approaches used by government agencies and private companies to carry out their particular flood risk management or flood insurance responsibilities.
ASSESSING THE COMPONENTS OF FLOOD RISK
Assessing Flood Hazard
Flood hazard assessment estimates the probability of different magnitudes of damaging flood conditions, such as the depth of inundation, duration of inundation, velocity of moving wa-ter, quality of water, debris content of water, or the wave height in addition to still water level. For example, in many urban riverine settings, the most important flood condition is the annual maximum depth of inundation at the location of an insured structure. The depth of inundation is computed as the difference between the annual maximum water surface elevation and a reference elevation at the structure (commonly the lowest floor elevation of the structure, because this is the elevation above which water ponding will cause damage). The hazard in that location can be represented as a water surface elevation–exceedance probability function, as shown in Figure

30
3.1a. Thia specifiehave lessmeteoroland floodfor currenchange, u
FIGURE exceedancderived frface elevaof exceed
Thetistical anappropriastructureprobabilihydraulicprobabilifunction dischargestream rethese datchannel b
1 In this rep10 percent
is function reed location wser probabilitlogical, hydrdplains at annt conditionurban growth
3.1 (a) Floodce probabilityrom a discharation functiondance. SOUR
e water surfanalysis of obate sample o. However, hity function ic processes. ity function ((Figure 3.1ce–exceedancegulation thea are not avabehavior.
port, probabilitannual chance
Tying Floo
P R E
epresents thewill equal orty of exceed
rological, hynd upstream os or for futurh in floodpla
(a) d hazard for riy function, usuge–exceedanc
n (c). The annRCE: Courtesy
ace elevationbservations oof historical vhistorical dais usually deFor riverine(Figure 3.1bc) to derive tce probabiliten carrying oailable, by u
ty is expressede exceedance e
od Insurance
E P U B L I
e probabilityr exceed a spdance. The mdraulic, and of the locatiore conditionains).
iverine systemually derivedce probability
nual exceedany of David Fo
n–exceedancof annual mavalues is ava
ata are limiteerived using e systems, anb), then transthe water surty function foout a statisticusing models
d as a percent cvent has an ann
to Flood Risk
C A T I O N
y that the annpecified magmagnitudes fo
topographicon of interess (e.g., extre
ms may be rep from flood s
y function (b)ce probability
ord, David Fo
ce probabilityaximum wateailable from d, and so theconceptual a
nalysts commsform that wirface elevati
for a stream mcal analysis os of the water
hance exceedanual exceedanc
k for Low-Lyi
N C O P Y
nual maximugnitude.1 Grefor the variouc properties ost. These maeme precipita
(b) presented wittudies. Altern
), transformedy means the s
ord Consulting
y function mer surface ela stream gage water surfaand empirica
monly develoith a discharon–exceedanmay be deveof historical rshed respon
ance, which is pce probability
ing Structures
Y
um water sureater water suus probabilitof the water
agnitudes canation as a re
th a water surnatively, the fd with a dischsame thing as g Engineers, I
may be derivlevations at age at or nearace elevational models ofop a dischargrge–water sunce probabil
eloped by codischarge o
nse to precip
probability × 1of 0.10.
s in the Flood
rface elevatiurface elevaties depend oshed, channen be determisult of clima
rface elevationfunction may harge–water s
the annual chInc.
ved through sa location if r the insuredn–exceedancf hydrologic ge–exceedan
urface elevatlity function
orrecting for observations pitation and
100. For examp
dplain
ion at ations on els, ined ate
(c) n–be ur-hance
sta-an
d ce and
nce tion n. The
or, if
ple, a
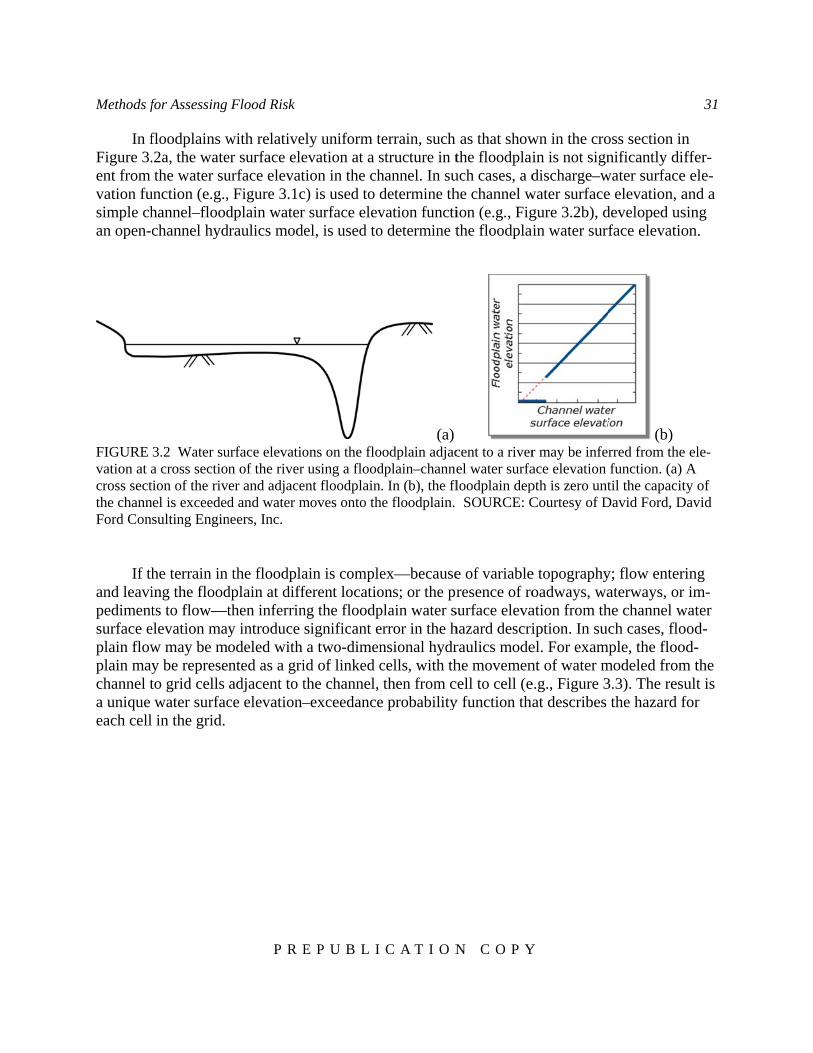
Methods f
In fFigure 3.ent from vation fusimple chan open-c
FIGURE vation at across sectthe channFord Con
If thand leavipedimentsurface eplain flowplain maychannel ta unique each cell
for Assessing
floodplains w.2a, the watethe water su
unction (e.g.,hannel–floodchannel hyd
3.2 Water sua cross sectiotion of the rivnel is exceededsulting Engin
he terrain in ing the floodts to flow—t
elevation mayw may be my be represeto grid cells water surfac in the grid.
Flood Risk
P R E
with relativeer surface eleurface elevat, Figure 3.1cdplain water
draulics mode
urface elevation of the river er and adjaced and water m
neers, Inc.
the floodpladplain at diffthen inferriny introduce odeled with nted as a griadjacent to tce elevation–
E P U B L I
ely uniform tevation at a stion in the chc) is used to dr surface elevel, is used to
ons on the flousing a flood
ent floodplainmoves onto th
ain is compleferent locationg the floodpsignificant ea two-dimen
id of linked cthe channel, –exceedance
C A T I O N
terrain, such structure in thannel. In sudetermine thvation functio determine t
(a)oodplain adjacdplain–channen. In (b), the flhe floodplain.
ex—becauseons; or the prplain water serror in the hnsional hydrcells, with ththen from c
e probability
N C O P Y
as that showthe floodplaiuch cases, a dhe channel wion (e.g., Figthe floodpla
cent to a riverel water surfaloodplain dep SOURCE: C
e of variableresence of ro
surface elevahazard descriraulics modehe movemencell to cell (ey function tha
Y
wn in the croin is not signdischarge–w
water surfacegure 3.2b), din water surf
r may be inferace elevation pth is zero untCourtesy of D
e topographyoadways, waation from thiption. In sucel. For examnt of water me.g., Figure 3at describes
oss section innificantly dif
water surfacee elevation, adeveloped usface elevatio
(b) rred from thefunction. (a) til the capacit
David Ford, D
y; flow enteraterways, or he channel wch cases, flo
mple, the floomodeled from3.3). The resuthe hazard f
31
n ffer-
e ele-and a sing on.
e ele-A
ty of David
ring im-
water ood-od-m the ult is for
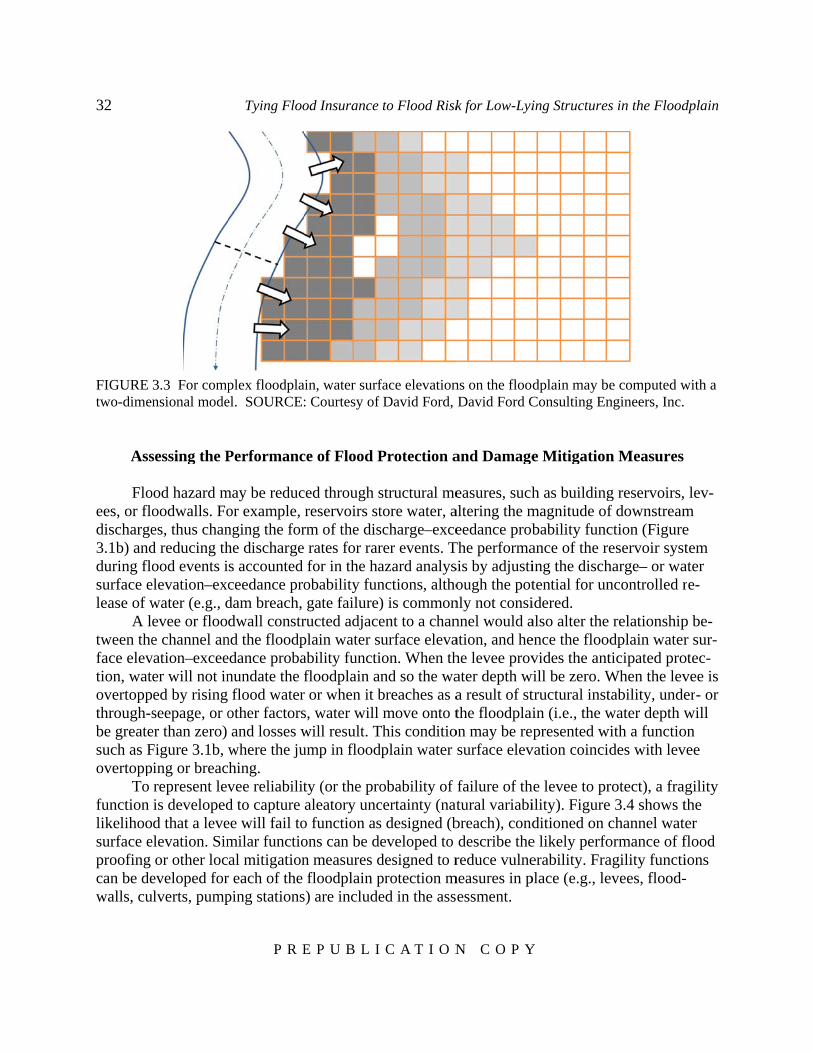
32
FIGURE two-dimen
Ass
Floees, or flodischarge3.1b) andduring flosurface elease of w
A ltween theface elevtion, watovertoppthrough-sbe greatesuch as Fovertopp
To function likelihoosurface eproofing can be dewalls, cu
3.3 For compnsional mode
sessing the P
ood hazard moodwalls. Foes, thus chand reducing thood events i
elevation–excwater (e.g., devee or flooe channel an
vation–exceeer will not ined by rising seepage, or o
er than zero) Figure 3.1b, wing or breacrepresent levis developedd that a leve
elevation. Simor other loc
eveloped forulverts, pump
Tying Floo
P R E
plex floodplael. SOURCE:
Performanc
may be reducor example, nging the forhe discharges accounted ceedance prodam breach, dwall constr
nd the floodpedance probanundate the fflood water
other factorsand losses wwhere the juhing. vee reliabilitd to capture ee will fail tomilar functioal mitigation
r each of the ping stations
od Insurance
E P U B L I
ain, water surf: Courtesy of
ce of Flood P
ced through sreservoirs strm of the dis rates for rarfor in the ha
obability fungate failure)
ructed adjaceplain water sability functifloodplain ar or when it bs, water will will result. Tump in flood
ty (or the proaleatory unc
o function asons can be den measures dfloodplain p
s) are include
to Flood Risk
C A T I O N
face elevationf David Ford,
Protection a
structural metore water, ascharge–excerer events. Tazard analysnctions, altho) is commonent to a chanurface elevaion. When thnd so the wabreaches as amove onto t
This conditiodplain water
obability of certainty (nats designed (beveloped to designed to rprotection med in the ass
k for Low-Lyi
N C O P Y
ns on the flooDavid Ford C
and Damage
easures, suchaltering the meedance prob
The performasis by adjustiough the pot
nly not consinnel would aation, and hehe levee provater depth wa result of stthe floodplai
on may be resurface elev
failure of thtural variabibreach), conddescribe the
reduce vulnemeasures in p
essment.
ing Structures
Y
dplain may bConsulting En
e Mitigation
h as buildingmagnitude ofbability funcance of the ring the dischtential for unidered. also alter theence the floovides the ant
will be zero. Wtructural instin (i.e., the wpresented w
vation coinci
he levee to prility). Figureditioned on ce likely perfoerability. Fraplace (e.g., le
s in the Flood
e computed wngineers, Inc.
n Measures
g reservoirs,f downstreamction (Figureeservoir syst
harge– or wancontrolled r
e relationshipodplain waterticipated proWhen the levtability, undewater depth w
with a functiodes with lev
rotect), a frae 3.4 shows tchannel watormance of fagility functievees, flood-
dplain
with a
lev-m e tem ater re-
p be-r sur-
otec-vee is er- or will
on vee
agility the ter flood ions -

Methods f
FIGURE with a fraDavid For
Exp
tween theinundatiodepth–datential dacident inuof the stror other cThe damexpresseddamage f
FIGURE which mavalue of th
for Assessing
3.4 Variabiligility functionrd Consulting
posure and ve flood hazaon depth–damamage functiamage to theundation dep
ructure and itcharacteristiage predictod as a percenfunction is il
3.5 Exposureay be develophe asset (b).
Flood Risk
P R E
ity in the perfn, which is in
g Engineers, I
Asse
vulnerabilityrd and damamage functioion may be de insured strupths for simits content; tocs; and then
or for the catntage of the llustrated in
e and vulneraed from a genSOURCE: Co
E P U B L I
formance of flncluded in theInc.
essing Expo
analysis exaage to the asson for the strdeveloped fructure and/orilar structureo categorize to predict th
tegory is devtotal structuFigure 3.5b.
ability are reprneric inundatiourtesy of Da
C A T I O N
flood protectioe risk assessm
osure and V
amines the vset. This inforucture, as ilrom a detailer statistical aes. A typicalthe structur
he damage cveloped withure and conte.
(a)resented withion depth–peravid Ford, Da
N C O P Y
on systems, su
ment. SOURC
Vulnerability
value of an aformation mallustrated byed valuation analysis of rel approach isre according correspondinh a conceptuaent value. An
h an inundatiorcent damageavid Ford Con
Y
uch as leveesCE: Courtesy
y
asset and theay be represe
y Figure 3.5aand investigeports of dams to determinto its constr
ng to specifical or empiricn inundation
(bon depth–dame function, scansulting Engin
s, is representeof David For
relationshipented with aa. The inundagation of themage and cone the total vruction type,c water depthcal model, ann depth–perc
b) mage functionaled by the totneers, Inc.
33
ed rd,
p be-an ation po-
oin-value use, hs. nd is ent
n (a), tal

34
The
exceedanfunction damage f3.6), whiwith prob
FIGURE SOURCE
Thedamage tveloped fis integrathe avera“NFIP In
Theresponsib
The
using a hsurface earea, thening a moprobabili
e consequennce probabili(Figure 3.2bfunction (Figich describesbabilities nea
3.6 Flood risE: Courtesy of
e damage–exthat can occufor an indiviated to compage annual lonsurance Rate following sbility for floo
e National Fhydrologic melevation–excn transformsdel of damagity function i
Tying Floo
P R E
ce of floodinity function b), a levee frgure 3.5a). Ts the risk. Coar 0.50. Grea
sk is commonf David Ford,
xceedance prur for each fidual structurpute the expeoss. The avertes” in Chaptsections sumod risk mana
NF
lood Insuranmethod devel
ceedance pros that functioge as a functis then integ
od Insurance
E P U B L I
Ass
ng is assesse(Figure 3.1a
ragility functThe result is ommon amoater damage
nly representeDavid Ford C
robability fuflood over thre category oected annual rage annual ter 2).
mmarize risk agement or f
FIP HYDRO
nce Programloped in the obability funon to an inuntion of depth
grated to com
to Flood Risk
C A T I O N
essing Risk
ed by transfoa) with a chation (Figure a damage–ex
ounts of dam is less likely
d with a damConsulting En
unction showhe range of por for an entdamage for loss is the b
assessment flood insuran
OLOGIC M
m (NFIP) asse1960s (HUDnction to desndation damah of inundatimpute the ave
k for Low-Lyi
N C O P Y
k
orming the wannel–floodp3.4), and a fxceedance p
mage are neary, with prob
mage–exceedan
ngineers, Inc.
wn in Figure possible floodtire portfolior the full rangasis for setti
approaches nce.
METHOD
esses flood rD, 1966). Thscribe the floage–exceedaion (Box 2.1erage annual
ing Structures
Y
water surfaceplain water sfloodplain inprobability fur the center obabilities app
nce probabili.
3.6 represends. This func
o of structurege of floods,ing risk-base
used by org
risk for insurhe method deood hazard inance probabi). The damal loss.
s in the Flood
e elevation–urface eleva
nundation defunction (Figof the diagraproaching ze
ity function.
nts the floodction can be es. The funct, also knowned rates (see
ganizations w
rance purposerives a waten a geographility functionage–exceeda
dplain
ation epth–gure am, ero.
d de-tion n as
with
ses er hical n us-ance
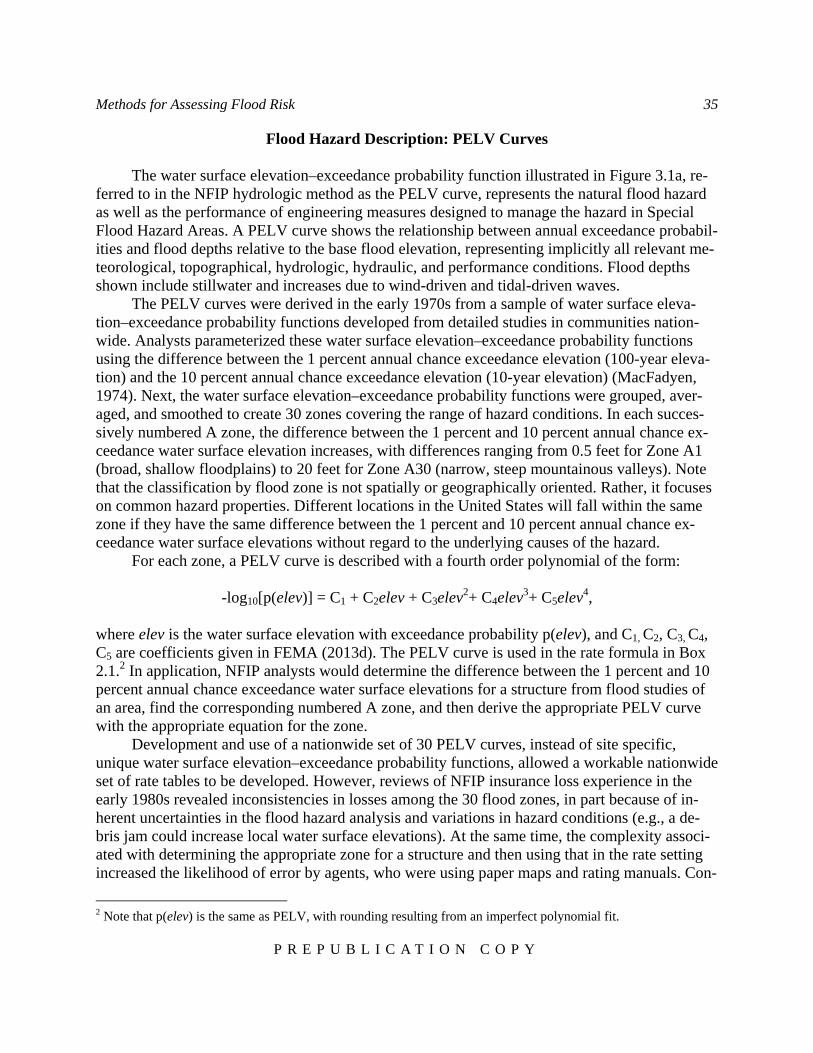
Methods for Assessing Flood Risk 35
P R E P U B L I C A T I O N C O P Y
Flood Hazard Description: PELV Curves
The water surface elevation–exceedance probability function illustrated in Figure 3.1a, re-ferred to in the NFIP hydrologic method as the PELV curve, represents the natural flood hazard as well as the performance of engineering measures designed to manage the hazard in Special Flood Hazard Areas. A PELV curve shows the relationship between annual exceedance probabil-ities and flood depths relative to the base flood elevation, representing implicitly all relevant me-teorological, topographical, hydrologic, hydraulic, and performance conditions. Flood depths shown include stillwater and increases due to wind-driven and tidal-driven waves.
The PELV curves were derived in the early 1970s from a sample of water surface eleva-tion–exceedance probability functions developed from detailed studies in communities nation-wide. Analysts parameterized these water surface elevation–exceedance probability functions using the difference between the 1 percent annual chance exceedance elevation (100-year eleva-tion) and the 10 percent annual chance exceedance elevation (10-year elevation) (MacFadyen, 1974). Next, the water surface elevation–exceedance probability functions were grouped, aver-aged, and smoothed to create 30 zones covering the range of hazard conditions. In each succes-sively numbered A zone, the difference between the 1 percent and 10 percent annual chance ex-ceedance water surface elevation increases, with differences ranging from 0.5 feet for Zone A1 (broad, shallow floodplains) to 20 feet for Zone A30 (narrow, steep mountainous valleys). Note that the classification by flood zone is not spatially or geographically oriented. Rather, it focuses on common hazard properties. Different locations in the United States will fall within the same zone if they have the same difference between the 1 percent and 10 percent annual chance ex-ceedance water surface elevations without regard to the underlying causes of the hazard.
For each zone, a PELV curve is described with a fourth order polynomial of the form:
-log10[p(elev)] = C1 + C2elev + C3elev2+ C4elev3+ C5elev4, where elev is the water surface elevation with exceedance probability p(elev), and C1, C2, C3, C4, C5 are coefficients given in FEMA (2013d). The PELV curve is used in the rate formula in Box 2.1.2 In application, NFIP analysts would determine the difference between the 1 percent and 10 percent annual chance exceedance water surface elevations for a structure from flood studies of an area, find the corresponding numbered A zone, and then derive the appropriate PELV curve with the appropriate equation for the zone.
Development and use of a nationwide set of 30 PELV curves, instead of site specific, unique water surface elevation–exceedance probability functions, allowed a workable nationwide set of rate tables to be developed. However, reviews of NFIP insurance loss experience in the early 1980s revealed inconsistencies in losses among the 30 flood zones, in part because of in-herent uncertainties in the flood hazard analysis and variations in hazard conditions (e.g., a de-bris jam could increase local water surface elevations). At the same time, the complexity associ-ated with determining the appropriate zone for a structure and then using that in the rate setting increased the likelihood of error by agents, who were using paper maps and rating manuals. Con-
2 Note that p(elev) is the same as PELV, with rounding resulting from an imperfect polynomial fit.
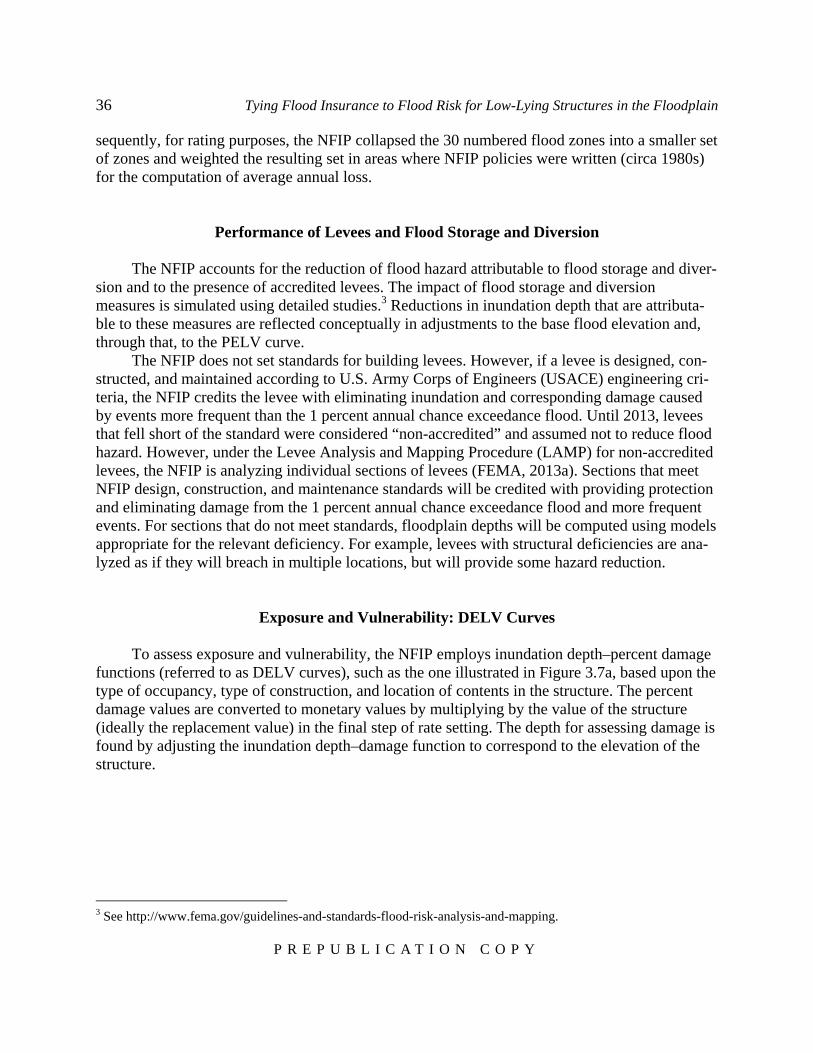
36 Tying Flood Insurance to Flood Risk for Low-Lying Structures in the Floodplain
P R E P U B L I C A T I O N C O P Y
sequently, for rating purposes, the NFIP collapsed the 30 numbered flood zones into a smaller set of zones and weighted the resulting set in areas where NFIP policies were written (circa 1980s) for the computation of average annual loss.
Performance of Levees and Flood Storage and Diversion
The NFIP accounts for the reduction of flood hazard attributable to flood storage and diver-sion and to the presence of accredited levees. The impact of flood storage and diversion measures is simulated using detailed studies.3 Reductions in inundation depth that are attributa-ble to these measures are reflected conceptually in adjustments to the base flood elevation and, through that, to the PELV curve.
The NFIP does not set standards for building levees. However, if a levee is designed, con-structed, and maintained according to U.S. Army Corps of Engineers (USACE) engineering cri-teria, the NFIP credits the levee with eliminating inundation and corresponding damage caused by events more frequent than the 1 percent annual chance exceedance flood. Until 2013, levees that fell short of the standard were considered “non-accredited” and assumed not to reduce flood hazard. However, under the Levee Analysis and Mapping Procedure (LAMP) for non-accredited levees, the NFIP is analyzing individual sections of levees (FEMA, 2013a). Sections that meet NFIP design, construction, and maintenance standards will be credited with providing protection and eliminating damage from the 1 percent annual chance exceedance flood and more frequent events. For sections that do not meet standards, floodplain depths will be computed using models appropriate for the relevant deficiency. For example, levees with structural deficiencies are ana-lyzed as if they will breach in multiple locations, but will provide some hazard reduction.
Exposure and Vulnerability: DELV Curves
To assess exposure and vulnerability, the NFIP employs inundation depth–percent damage functions (referred to as DELV curves), such as the one illustrated in Figure 3.7a, based upon the type of occupancy, type of construction, and location of contents in the structure. The percent damage values are converted to monetary values by multiplying by the value of the structure (ideally the replacement value) in the final step of rate setting. The depth for assessing damage is found by adjusting the inundation depth–damage function to correspond to the elevation of the structure.
3 See http://www.fema.gov/guidelines-and-standards-flood-risk-analysis-and-mapping.
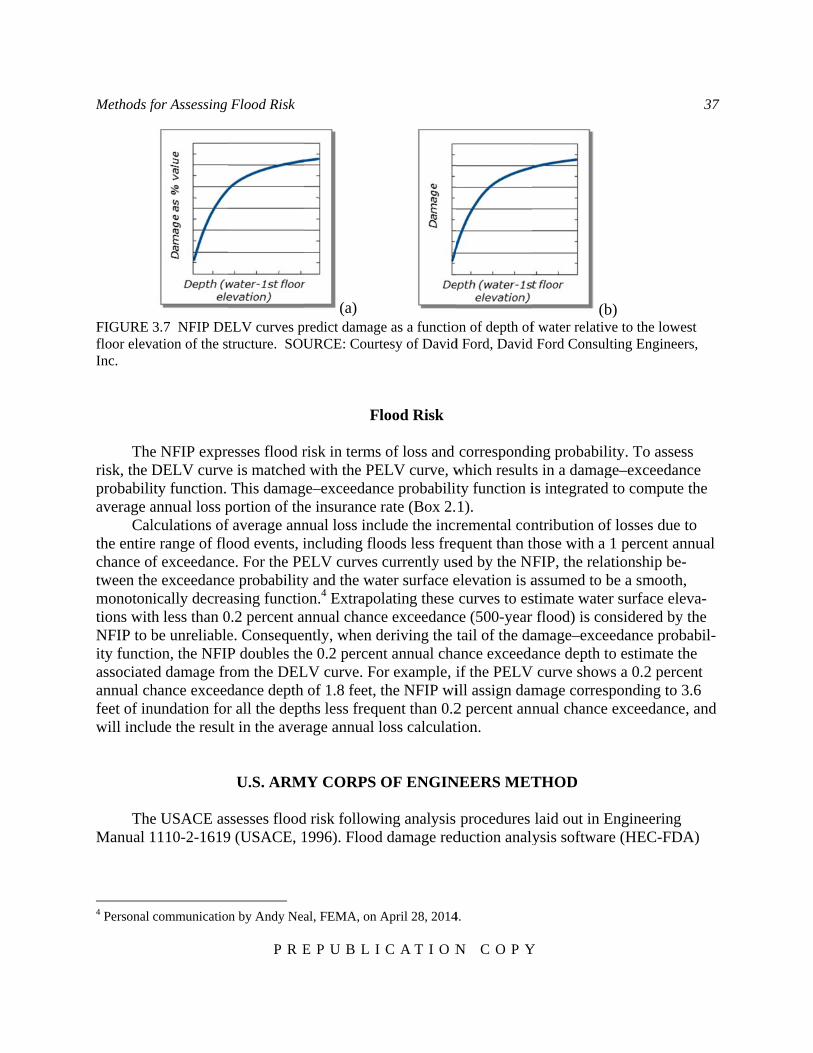
Methods f
FIGURE floor elevInc.
The
risk, the Dprobabiliaverage a
Calthe entirechance otween themonotontions withNFIP to bity functiassociateannual chfeet of inwill inclu
The
Manual 1
4 Personal
for Assessing
3.7 NFIP DEation of the s
e NFIP expreDELV curveity function. annual loss plculations ofe range of flof exceedance exceedanc
nically decreah less than 0be unreliableion, the NFIPed damage frhance exceed
nundation forude the resul
e USACE as1110-2-1619
communicatio
Flood Risk
P R E
ELV curves ptructure. SOU
esses flood re is matchedThis damag
portion of thf average annood events, ie. For the PEe probabilityasing functio0.2 percent ae. ConsequeP doubles throm the DELdance depth r all the deptlt in the aver
U.S. ARM
ssesses flood9 (USACE, 1
n by Andy Nea
E P U B L I
(a) predict damagURCE: Court
Fl
risk in termsd with the PEge–exceedane insurance nual loss incincluding floELV curves y and the waon.4 Extrapo
annual chancntly, when d
he 0.2 percenLV curve. Fo
of 1.8 feet, ths less frequrage annual l
MY CORPS
d risk follow1996). Flood
al, FEMA, on A
C A T I O N
ge as a functiotesy of David
lood Risk
s of loss and ELV curve, wce probabilitrate (Box 2.
clude the incroods less frecurrently us
ater surface eolating these ce exceedancderiving the nt annual chaor example, ithe NFIP wiuent than 0.2loss calculat
OF ENGIN
ing analysis d damage red
April 28, 2014
N C O P Y
on of depth ofd Ford, David
correspondiwhich resultty function i1). remental con
equent than thsed by the NFelevation is acurves to es
ce (500-year tail of the daance exceedaif the PELVill assign dam2 percent anntion.
NEERS MET
procedures duction analy
4.
Y
(bf water relativ
d Ford Consul
ing probabilis in a damagis integrated
ntribution ofthose with a FIP, the relaassumed to bstimate waterr flood) is coamage–exceance depth t
V curve showmage corresnual chance
THOD
laid out in Eysis softwar
b) ve to the lowelting Engineer
ity. To assesge–exceedand to compute
f losses due 1 percent an
ationship be-be a smooth,r surface ele
onsidered by eedance probto estimate th
ws a 0.2 perceponding to 3exceedance
Engineering re (HEC-FDA
37
est rs,
ss nce
the
to nnual -, eva-the
babil-he ent 3.6 e, and
A)

38 Tying Flood Insurance to Flood Risk for Low-Lying Structures in the Floodplain
P R E P U B L I C A T I O N C O P Y
uses methods from the engineering manual with results of traditional hydrologic engineering and economic analyses to assess flood risk.5
The USACE approach is similar to the NFIP’s, but includes the results of site-specific flood hazard assessment and an evaluation of uncertainties in the assessment of flood hazard and levee fragility. The USACE method begins with deriving a discharge–exceedance probability function for a particular location using statistical analysis of available records or precipitation–runoff modeling of the contributing watershed. The function includes discharge values for a range of probabilities, commonly between 50 percent and 0.2 percent annual chance exceedance. The discharge–exceedance probability function is transformed to a water surface elevation–exceedance probability function using hydraulic model studies based on the best available bath-ymetric and topographic information. Applications are site specific, with hydraulic modeling methods selected as appropriate for the channel and floodplain properties. If levees or other wa-ter control features alter the hazard, then their performance is assessed, and uncertainty about their performance is represented with a fragility function.
Vulnerability and exposure are assessed using the depreciated replacement value of assets and inundation depth–percent damage functions developed by the USACE (2000, 2003). The inundation depth–damage functions are consistent with, but not identical to, those used by the NFIP. Moreover, the NFIP uses the replacement value of the structure in its calculation of aver-age annual loss, rather than the depreciated replacement value. The USACE estimates the depre-ciated replacement value by first estimating the replacement value, then reducing that value us-ing the results of a site inspection to account for the condition and remaining useful life of the structure. The expected annual damage (average annual loss) is computed by integrating the damage–exceedance probability function.
The USACE risk analysis method considers the aleatory uncertainty in the assessment of flood hazard and levee performance, and in the estimation of water surface elevations from river discharges. Consideration is also given to selected sources of epistemic uncertainty. For exam-ple, the method uses probability distributions to describe the uncertainty about inputs, including uncertainties about (a) the discharge–exceedance probability function, (b) the discharge-to-water surface elevation transformation, (c) the lowest floor elevation of a structure, and (d) the values of assets. Monte Carlo sampling is used to develop the required damage–exceedance probability function and the uncertainty distributions. Results are reported with levels of significance at-tached.
CATASTROPHE MODELS
Many private insurers use catastrophe models to assess the risk of natural hazards, includ-ing wind, earthquakes, wildfire, and, more recently, floods (e.g., see Grossi and Kunreuther, 2005). These models are generally developed for large or geographically diverse insurance port-folios for which it is important to assess the likelihood of catastrophic losses. The models can be used to assess individual or aggregated risk (e.g., entire insurance portfolios).
5 See http://www.hec.usace.army.mil/software/hec-fda/.
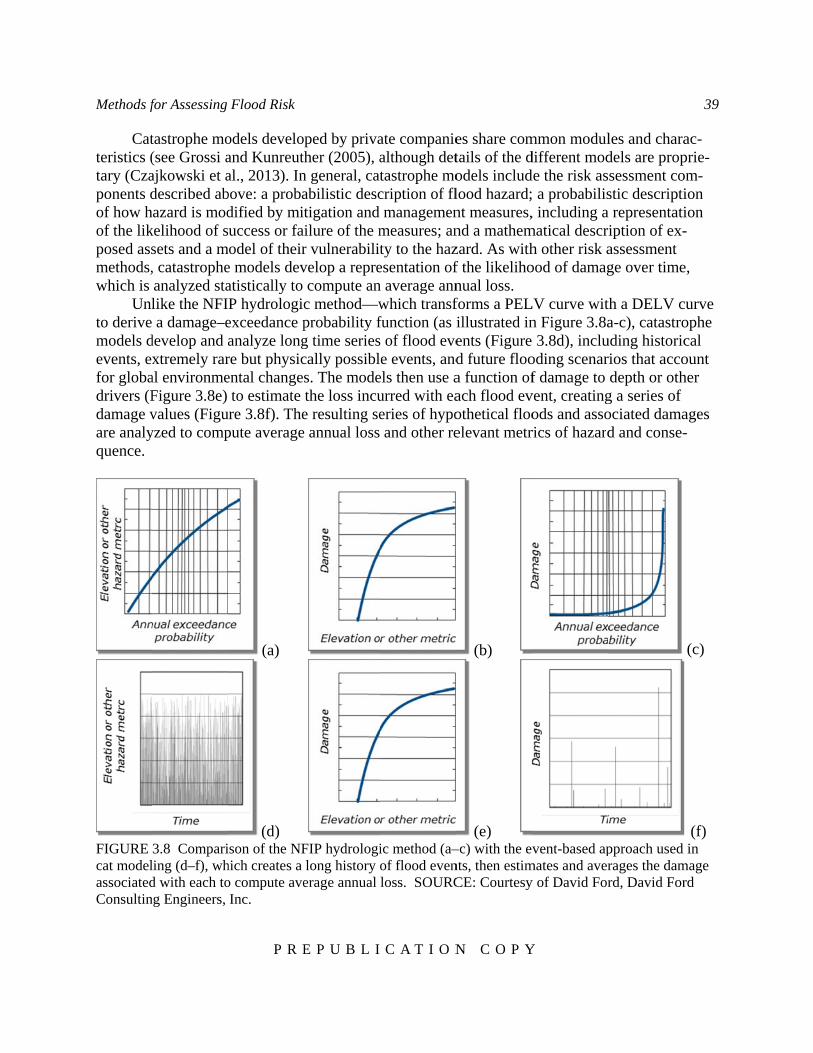
Methods f
Catteristics (tary (Czaponents dof how hof the likposed assmethods,which is
Unlto derivemodels devents, exfor globadrivers (Fdamage vare analyquence.
FIGURE cat modelassociatedConsultin
for Assessing
tastrophe mo(see Grossi aajkowski et adescribed ab
hazard is modkelihood of ssets and a m, catastropheanalyzed stalike the NFI a damage–e
develop and axtremely rar
al environmeFigure 3.8e) values (Figuyzed to comp
3.8 Compariling (d–f), whd with each tong Engineers,
Flood Risk
P R E
odels develoand Kunreuthal., 2013). Inbove: a probadified by mituccess or fa
model of theire models devatistically to P hydrologicexceedance panalyze longre but physicental change
to estimate ure 3.8f). Thepute average
(a)
(d) ison of the NFhich creates a o compute aveInc.
E P U B L I
ped by privaher (2005), a
n general, catabilistic desctigation and ilure of the mr vulnerabilitvelop a reprecompute anc method—wprobability fg time seriescally possibls. The modethe loss incue resulting see annual loss
FIP hydrologilong history oerage annual
C A T I O N
ate companiealthough dettastrophe mocription of flmanagemen
measures; anty to the haz
esentation ofn average annwhich transffunction (as is of flood evee events, and
els then use aurred with eaeries of hypoand other re
ic method (a–of flood evenloss. SOURC
N C O P Y
es share comtails of the dodels includlood hazard;nt measures,nd a mathemzard. As withf the likelihonual loss. forms a PELillustrated inents (Figure d future flooa function ofach flood evothetical flooelevant metr
(b)
(e) –c) with the evnts, then estimCE: Courtesy
Y
mmon moduldifferent modde the risk as
a probabilis, including a
matical descrh other risk aood of damag
LV curve witn Figure 3.8a 3.8d), inclu
oding scenarf damage to
vent, creatingods and assorics of hazard
vent-based apmates and avery of David For
les and charadels are propsessment costic descripti
a representatiiption of ex-assessment ge over time
th a DELV ca-c), catastro
uding historicrios that accodepth or oth
g a series of ociated damad and conse-
pproach used rages the damrd, David For
39
ac-prie-om-ion ion -
e,
curve ophe cal ount her
ages -
(c)
(f) in
mage rd

40 Tying Flood Insurance to Flood Risk for Low-Lying Structures in the Floodplain
P R E P U B L I C A T I O N C O P Y
Private insurers often collect detailed construction and occupancy information to develop loss estimates for anticipated flood events. This information can then be used to develop site-specific predictors (similar to Figure 3.8e) for use in a catastrophe model. In the absence of site-specific information, classes of risk are determined and available information used to assign the structure to a class.
Catastrophe models are developed for and fitted to conditions for the floodplain of interest, and therefore do not need to average hazard, performance, exposure, or vulnerability over time or space. Instead, site-specific detailed meteorological, hydrological, hydraulic, and consequence models can be developed and applied. For example, the loss calculations (using a function such as shown in Figure 3.8e) may include one or more drivers of damage beyond water depth, such as duration, velocity, quality of flood waters, season of flooding, or other factors.
REFINEMENTS TO CURRENT METHODS
North Carolina Flood Risk Information System
The North Carolina Floodplain Mapping Program is assessing certain components of flood risk as a part of a statewide program to provide seamless, accurate, statewide modeling and map-ping of flood hazards.6 To assess flood hazard, North Carolina developed site-specific water surface elevation–exceedance probability functions using hydrologic and hydraulic studies carried out by the state7 and by the NFIP, and high-resolution airborne lidar terrain data. The state’s 3 meter lidar data is being replaced with quality level 2 lidar data (see Dewberry, 2011, for a description), which is similar to high precision survey data. This information has been used to determine base flood elevations for more than 300,000 locations in the state. In addition, the state has determined water surface elevations and flood depths for five flood probabilities: 10 percent (10-year depth), 4 percent (25-year depth), 2 percent (50-year depth), 1 percent (100-year depth), and 0.2 percent (500-year depth) annual chance exceedance. The 1 percent annual chance exceedance depths along a portion of a North Carolina river are illustrated in Figure 3.9. North Carolina is the first state to have performed such an analysis and to acquire high-resolution lidar statewide.
6 See http://fris.nc.us/fris. 7 North Carolina has generated and incorporated more than 300,000 base flood elevations on Flood Insurance Rate Maps for the state. See the presentation to the committee by John Dorman, North Carolina Floodplain Mapping Pro-gram, on May 12, 2014.
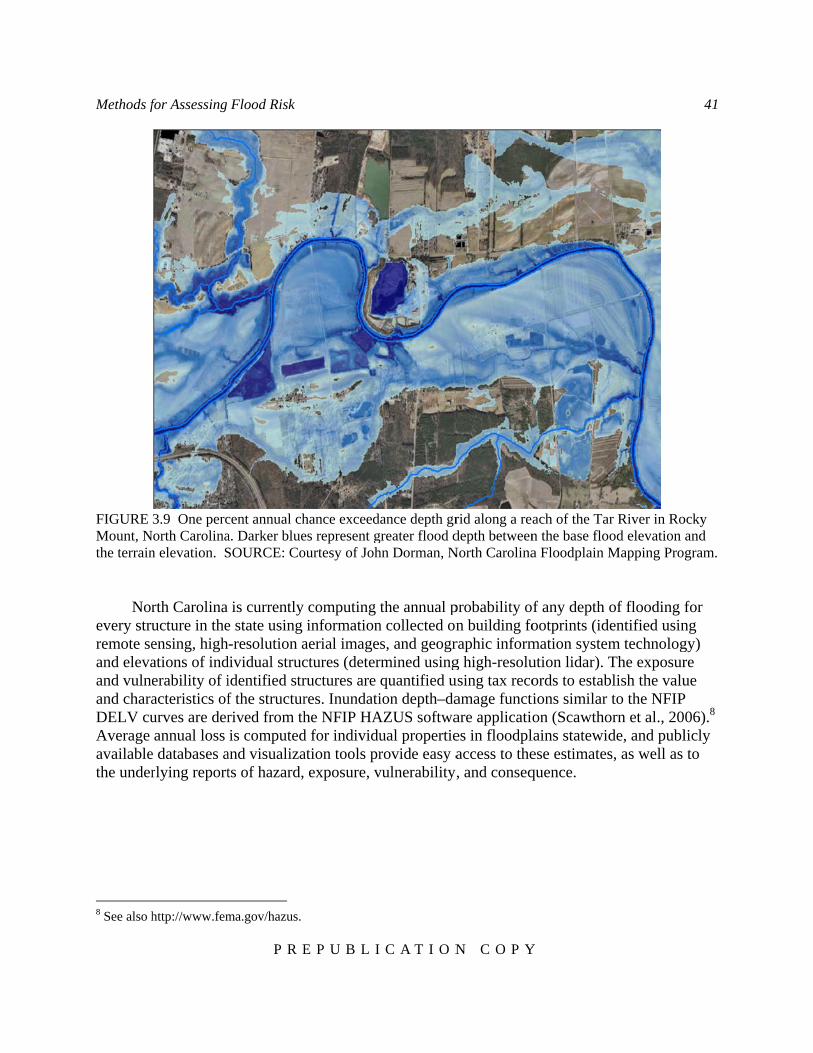
Methods f
FIGURE Mount, Nthe terrain
Norevery struremote seand elevaand vulneand charaDELV cuAverage availablethe under
8 See also h
for Assessing
3.9 One percNorth Carolinan elevation. S
rth Carolina ucture in theensing, highations of inderability of iacteristics ofurves are derannual loss
e databases arlying report
http://www.fem
Flood Risk
P R E
cent annual cha. Darker blueSOURCE: Co
is currently e state using -resolution a
dividual strucidentified strf the structurrived from this computed
and visualizats of hazard,
ma.gov/hazus.
E P U B L I
hance exceedes represent gourtesy of Joh
computing tinformation
aerial imagectures (deterructures are res. Inundatihe NFIP HAd for individuation tools pr exposure, v
C A T I O N
ance depth grgreater flood dhn Dorman, N
the annual pn collected ons, and geogr
rmined usingquantified uion depth–da
AZUS softwaual propertierovide easy a
vulnerability
N C O P Y
rid along a readepth between
North Carolina
probability on building foraphic informg high-resoluusing tax recoamage functare applicatioes in floodplaccess to the, and conseq
Y
ach of the Tan the base floa Floodplain M
f any depth ootprints (idmation systemution lidar). Tords to estabions similar on (Scawtholains statewidese estimatesquence.
ar River in Rood elevation Mapping Pro
of flooding dentified usinm technologThe exposur
blish the valuto the NFIP
orn et al., 20de, and publs, as well as
41
ocky and gram.
for ng gy) re ue
P 06).8 licly to
42 Tying Flood Insurance to Flood Risk for Low-Lying Structures in the Floodplain
P R E P U B L I C A T I O N C O P Y
NFIP Multi-Frequency Depth Grids
The NFIP has been developing multi-frequency depth grids to analyze flood risk since 2009. The multi-frequency depth grids are intended to provide a platform for NFIP hydrologic and hydraulic analyses and to help individuals better understand and visualize their flood hazard. The NFIP analyzes flood depth at the same flood probabilities as North Carolina’s (10 percent, 4 percent, 2 percent, 1 percent, and 0.2 percent annual chance exceedance), and uses similar meth-ods for producing the depth grids (FEMA, 2014). Depths for the grids are currently determined using spatial interpolation schemes, which estimate grid cell water surface elevations from re-sults of state-of-practice hydraulic models. The description and display of site-specific flood hazard at a relatively fine spatial scale are also similar to those of North Carolina. The depth grid datasets currently cover about 20 percent of the U.S. population.9 This technology—if integrated with reliable structure elevation and replacement value information—will eventually permit great spatial resolution of flood risk, perhaps to a neighborhood or structure level nationwide, similar to what is done on a smaller scale in North Carolina.
COMPREHENSIVE RISK ASSESSMENT
The 2013 NRC report Levees and the National Flood Insurance Program: Improving Poli-cies and Practices recommended and summarized the advantages of the NFIP moving toward a more comprehensive approach to risk analysis that builds on current USACE and catastrophe model methods. As described in the NRC report, a comprehensive risk assessment (1) derives a site-specific water surface elevation–exceedance probability function to represent hazard; (2) takes into account the performance and reliability of flood protection measured aimed at reduc-ing inundation depths, as well as the effect that their failure may have on flooding and, ultimate-ly, damages; (3) determines inundation depths throughout a floodplain with appropriate hydrau-lic analyses; (4) estimates the damage to exposed assets as a consequence of the inundation (or other relevant drivers), which is necessary for developing the damage–exceedance probability function; and (5) evaluates the aleatory and epistemic uncertainty (natural variability and knowledge uncertainty) in each of the elements of the analysis and propagates them through the estimate of risk. The elements of the flood risk model are combined to derive the frequency dis-tribution of the flood damage for individual structures or for a community as well as the uncer-tainty in these estimates. From these results, the average annual loss can be computed for a struc-ture or a group of structures. The comprehensive risk assessment method has been applied in at least two large-scale flood studies (see URS/JBA, 2008; IPET, 2009).
9 Personal communication by Paul Rooney, FEMA, on May 13, 2014.
Methods for Assessing Flood Risk 43
P R E P U B L I C A T I O N C O P Y
COMPARISON OF APPROACHES
All four of the flood risk assessment approaches described in this chapter (NFIP hydrologic method, USACE method, catastrophe models, and comprehensive risk assessment) address the main components of risk (i.e., flood hazard, the performance of flood protection measures, expo-sure, and vulnerability) using methods tailored to each organization’s needs. Each of the flood risk assessment methods describes flood hazard using hydrologic and hydraulic models that rep-resent the watershed, channel, and tidal behavior for the entire range of possible events. The NFIP hydrologic method, the USACE method, and the comprehensive risk assessment recom-mended in NRC (2013) use an inundation depth–exceedance probability function to describe flood hazard, whereas catastrophe models typically use Monte Carlo sampling to generate a long series of synthetic stream flows or ocean tides derived from a probability function. A critical dif-ference among the methods is the extent to which the hazard description represents the unique conditions at a site. The NFIP PELV curves are spatial averages that do not represent unique weather, watershed, or channel features. Other methods capture those unique features.
The performance of flood protection measures is represented in all the methods, albeit in different ways. The USACE method, the comprehensive risk assessment, and catastrophe models explicitly account for uncertainty about levee performance with fragility functions. In contrast, the NFIP treats certified and accredited levees as preventing damage from floods more frequent than the 1 percent annual chance exceedance event, and treats non-accredited levees (or levee segments) as providing lesser or no flood protection. Both the NFIP and USACE methods ac-count for the performance of flood storage and diversion, although in a simplistic and somewhat optimistic manner. For example, both presume that reservoir water control manuals will be fol-lowed exactly; in practice such adherence is difficult.
All risk assessment methods described in this chapter model exposure and vulnerability in a similar manner. The methods predict damage as a function of inundation depth, typically using damage ratio models. All methods require estimates of the value of a structure and its contents to calculate damage, and these estimates are made in a variety of ways. The USACE commonly uses building unit cost information and structure type and size to estimate replacement value, which is then adjusted to account for depreciation. The NFIP uses replacement cost values. De-tailed information about construction and occupancy collected by private insurers can be used to develop site-specific inundation depth–damage functions for use in a catastrophe model. If this detailed information is not available, then inundation depth–damage functions are developed for classes of structures.
A significant difference among the risk assessment methods is that the NFIP method was developed to assess flood losses for individual structures, whereas the USACE, comprehensive risk assessment, and catastrophe modeling methods can assess individual or aggregated risk (e.g., a community or an entire insurance portfolio). Assessing aggregated risk is useful for determin-ing the financial soundness of the insurance portfolio.
Another significant difference among the methods is the treatment of aleatory and epistem-ic uncertainties about the hazard, performance, exposure, and vulnerability inputs to flood loss calculations. Although some aleatory uncertainties are considered in the NFIP hydrologic meth-od, epistemic uncertainties are not explicitly considered or integrated into the risk assessment.

44 Tying Flood Insurance to Flood Risk for Low-Lying Structures in the Floodplain
P R E P U B L I C A T I O N C O P Y
Instead, in the average annual loss calculation, the NFIP relies on judgments and empirical ad-justments to accommodate uncertainties in the flood risk analyses and underwriting process (Hayes and Neal, 2011). In contrast, the comprehensive risk assessment, catastrophe models, and, to a lesser extent, the USACE method account for both aleatory and epistemic uncertainty about the various inputs to the average annual loss calculation. For example, the NFIP mathemat-ically treats the water surface elevation–exceedance probability function as if quantiles were known with certainty. In contrast, with the comprehensive risk assessment and, to a lesser de-gree, the USACE method, epistemic uncertainty about the water surface elevation–exceedance probability function is described with a probability distribution about the mean value of elevation predicted for a specified probability. Similarly, the NFIP rate formula mathematically treats the inundation depth–damage functions as known with certainty, whereas the USACE method, ca-tastrophe models, and comprehensive risk assessment consider the impact of small samples and imperfect knowledge on relationships to predict damage associated with depth. These three methods then derive sample probability distributions that describe variations from the average values predicted in the hazard, performance, exposure, and vulnerability models.
The appropriate method for assessing risk depends on the application. Possible changes in methods for improving flood insurance rates are described in Chapters 4 and 5.

45 P R E P U B L I C A T I O N C O P Y
4
Factors That Affect Risk-Based Premiums for Negatively Elevated Structures
The National Flood Insurance Program (NFIP) method for calculating risk-based premiums was developed for rating post-FIRM (Flood Insurance Rate Map) structures, and its use has been tailored for structures with lowest floor elevations at or above the base flood elevation. However, negatively elevated structures are typically affected by different flood conditions (e.g., more fre-quent floods) and different drivers of damage and loss (e.g., longer duration of flooding) than structures above the base flood elevation. Moreover, risk-based insurance premiums for nega-tively elevated structures are expected to be high when subsidies are phased out, simply because flood risks are higher. This chapter identifies potential changes to the NFIP method for calculat-ing risk-based rates for negatively elevated structures. Of particular interest are the water surface elevation–exceedance probability functions (PELV curves), the inundation depth–damage func-tions (DELV curves), underinsurance, and deductibles. Associated data issues are discussed in Chapter 5.
PELV
The NFIP develops rates for a class of structures by computing the average annual loss, ac-counting for the elevation of the structure relative to the base flood elevation, and then adjusting that value for expenses and other factors. Rates are computed by integrating the product of the DELV curve for a class of structures and each PELV curve to compute an average annual loss, and then averaging the computed losses over the set of PELV curves, weighted by the estimated fraction of structures in each PELV zone equivalent. This averaging step can result in premiums that are representative of the flood risk for the structure class as a whole, but not for individual structures within the class. In addition, the PELV curves were developed with a focus on the dif-ference between the 1 percent and 10 percent annual chance exceedance elevations and may not adequately capture the loss potential from frequent flooding, which can be significant for nega-tively elevated structures. These issues and possible changes to the NFIP method are described below.
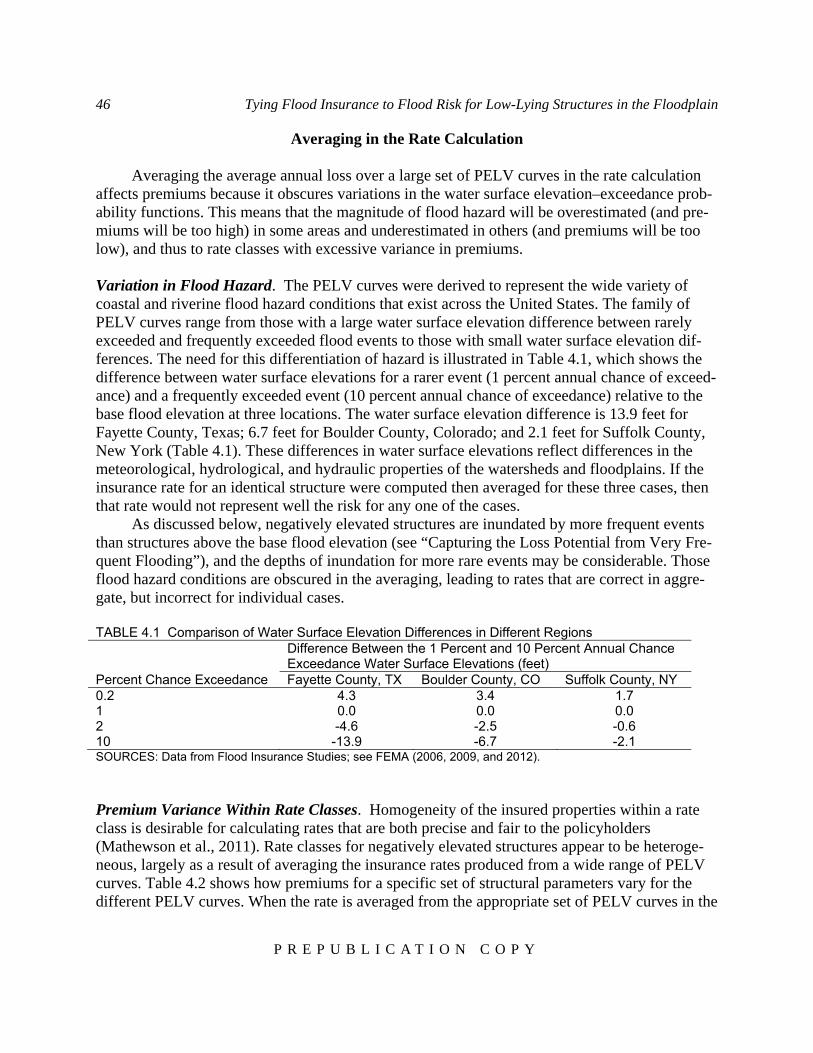
46 Tying Flood Insurance to Flood Risk for Low-Lying Structures in the Floodplain
P R E P U B L I C A T I O N C O P Y
Averaging in the Rate Calculation
Averaging the average annual loss over a large set of PELV curves in the rate calculation affects premiums because it obscures variations in the water surface elevation–exceedance prob-ability functions. This means that the magnitude of flood hazard will be overestimated (and pre-miums will be too high) in some areas and underestimated in others (and premiums will be too low), and thus to rate classes with excessive variance in premiums. Variation in Flood Hazard. The PELV curves were derived to represent the wide variety of coastal and riverine flood hazard conditions that exist across the United States. The family of PELV curves range from those with a large water surface elevation difference between rarely exceeded and frequently exceeded flood events to those with small water surface elevation dif-ferences. The need for this differentiation of hazard is illustrated in Table 4.1, which shows the difference between water surface elevations for a rarer event (1 percent annual chance of exceed-ance) and a frequently exceeded event (10 percent annual chance of exceedance) relative to the base flood elevation at three locations. The water surface elevation difference is 13.9 feet for Fayette County, Texas; 6.7 feet for Boulder County, Colorado; and 2.1 feet for Suffolk County, New York (Table 4.1). These differences in water surface elevations reflect differences in the meteorological, hydrological, and hydraulic properties of the watersheds and floodplains. If the insurance rate for an identical structure were computed then averaged for these three cases, then that rate would not represent well the risk for any one of the cases.
As discussed below, negatively elevated structures are inundated by more frequent events than structures above the base flood elevation (see “Capturing the Loss Potential from Very Fre-quent Flooding”), and the depths of inundation for more rare events may be considerable. Those flood hazard conditions are obscured in the averaging, leading to rates that are correct in aggre-gate, but incorrect for individual cases. TABLE 4.1 Comparison of Water Surface Elevation Differences in Different Regions Difference Between the 1 Percent and 10 Percent Annual Chance
Exceedance Water Surface Elevations (feet) Percent Chance Exceedance Fayette County, TX Boulder County, CO Suffolk County, NY 0.2 4.3 3.4 1.7 1 0.0 0.0 0.0 2 -4.6 -2.5 -0.6 10 -13.9 -6.7 -2.1 SOURCES: Data from Flood Insurance Studies; see FEMA (2006, 2009, and 2012).
Premium Variance Within Rate Classes. Homogeneity of the insured properties within a rate class is desirable for calculating rates that are both precise and fair to the policyholders (Mathewson et al., 2011). Rate classes for negatively elevated structures appear to be heteroge-neous, largely as a result of averaging the insurance rates produced from a wide range of PELV curves. Table 4.2 shows how premiums for a specific set of structural parameters vary for the different PELV curves. When the rate is averaged from the appropriate set of PELV curves in the
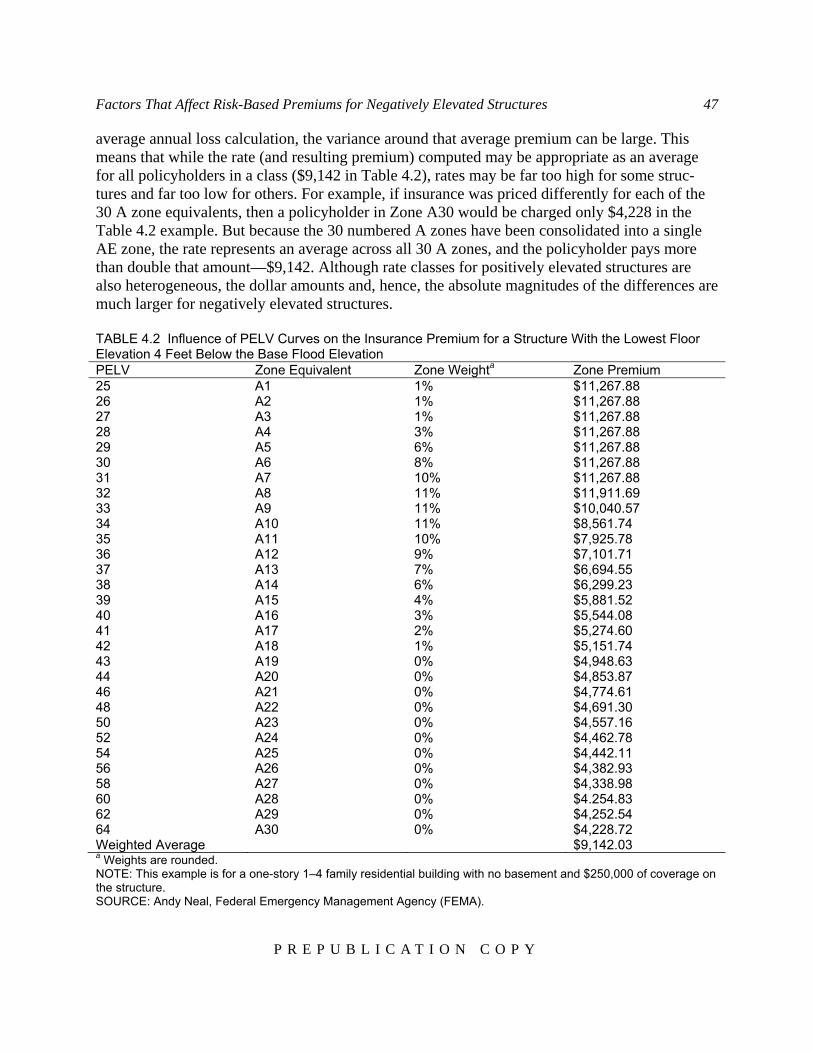
Factors That Affect Risk-Based Premiums for Negatively Elevated Structures 47
P R E P U B L I C A T I O N C O P Y
average annual loss calculation, the variance around that average premium can be large. This means that while the rate (and resulting premium) computed may be appropriate as an average for all policyholders in a class ($9,142 in Table 4.2), rates may be far too high for some struc-tures and far too low for others. For example, if insurance was priced differently for each of the 30 A zone equivalents, then a policyholder in Zone A30 would be charged only $4,228 in the Table 4.2 example. But because the 30 numbered A zones have been consolidated into a single AE zone, the rate represents an average across all 30 A zones, and the policyholder pays more than double that amount—$9,142. Although rate classes for positively elevated structures are also heterogeneous, the dollar amounts and, hence, the absolute magnitudes of the differences are much larger for negatively elevated structures. TABLE 4.2 Influence of PELV Curves on the Insurance Premium for a Structure With the Lowest Floor Elevation 4 Feet Below the Base Flood Elevation PELV Zone Equivalent Zone Weighta Zone Premium 25 A1 1% $11,267.88 26 A2 1% $11,267.88 27 A3 1% $11,267.88 28 A4 3% $11,267.88 29 A5 6% $11,267.88 30 A6 8% $11,267.88 31 A7 10% $11,267.88 32 A8 11% $11,911.69 33 A9 11% $10,040.57 34 A10 11% $8,561.74 35 A11 10% $7,925.78 36 A12 9% $7,101.71 37 A13 7% $6,694.55 38 A14 6% $6,299.23 39 A15 4% $5,881.52 40 A16 3% $5,544.08 41 A17 2% $5,274.60 42 A18 1% $5,151.74 43 A19 0% $4,948.63 44 A20 0% $4,853.87 46 A21 0% $4,774.61 48 A22 0% $4,691.30 50 A23 0% $4,557.16 52 A24 0% $4,462.78 54 A25 0% $4,442.11 56 A26 0% $4,382.93 58 A27 0% $4,338.98 60 A28 0% $4.254.83 62 A29 0% $4,252.54 64 A30 0% $4,228.72 Weighted Average $9,142.03 a Weights are rounded. NOTE: This example is for a one-story 1–4 family residential building with no basement and $250,000 of coverage on the structure. SOURCE: Andy Neal, Federal Emergency Management Agency (FEMA).
48 Tying Flood Insurance to Flood Risk for Low-Lying Structures in the Floodplain
P R E P U B L I C A T I O N C O P Y
Another issue is that computed rates for negatively elevated structures generally increase as the difference between the 1 percent and 10 percent annual chance exceedance depths decrease (PELV numbers decrease; see Table 4.2). The opposite is true for positively elevated structures. As discussed below, this trend can be attributed to the large contributions from more frequent floods to the total flood risk for negatively elevated structures, and thus there is great sensitivity to PELV values associated with floods of high annual probabilities (10 percent or greater annual chance exceedance). Potential Changes to the NFIP Method. Representing flood hazard variation more precisely and accurately in the average annual loss computation would reduce inequities that result when all policyholders with the same structure type and elevation pay a rate averaged over hazard con-ditions. Precise hazard representation requires structure elevations and site-specific water surface elevation–exceedance probability functions developed from detailed flood studies. In some cas-es, local flood study reports may yield the required water surface elevation–exceedance probabil-ity functions. For example, the site-specific water surface elevation–exceedance probability func-tions developed and used by the U.S. Army Corps of Engineers (USACE) for planning studies and by North Carolina for risk communication define flood hazard with the necessary precision. The NFIP’s multi-frequency depth grids represent a step toward site-specific hazard definition.
If deriving and using site-specific water surface elevation–exceedance probability functions is not practical, then the NFIP could group and average the functions to capture important differ-ences in flood hazard conditions, and use the average function that best represents the hazard at a structure. This strategy is similar to the NFIP’s now abandoned strategy of using numbered A zones (or V zones) for rate setting. Research, guided by the extent of the variance in premiums within rate classes, would be required to determine how many categories of water surface eleva-tion–exceedance probability functions would be needed to create more homogeneous rate classes for negatively elevated structures, and thus to increase fairness to policyholders. Once the cate-gories are determined, new flood studies and mapping would likely be required in regions with significant numbers of negatively elevated structures.
If new flood studies are not feasible, then alternative strategies could be developed to guide selection of the appropriate category of water surface elevation–exceedance probability function to use for rating a structure. For example, a strategy similar in concept to the U.S. Geological Survey’s regional regression equations1 for estimating flood flow discharges from selected mete-orological, hydrologic, and hydraulic properties of the watershed, channel, and floodplain could be employed to guide selection of the appropriate water surface elevation–exceedance probabil-ity function. Such an approach would account for all drivers of rising water surface elevations, including coastal waves where appropriate.
1 See http://water.usgs.gov/osw/programs/nss/pubs.html.

Factors That Affect Risk-Based Premiums for Negatively Elevated Structures 49
P R E P U B L I C A T I O N C O P Y
Capturing the Loss Potential from Very Frequent Flooding
The accuracy with which more frequently exceeded floods are represented in the water sur-face elevation–exceedance probability function is particularly important for assessing risk for negatively elevated structures. In the NFIP average annual loss calculation, the loss attributable to each depth of inundation is multiplied by the probability of that inundation, then summed over all possible probability values. Thus, higher probability events have a significant impact on the average annual loss. Depending on the inundation depth–exceedance probability function and the structure elevation, the threshold annual chance exceedance value for damage to negatively ele-vated structures may be as great as 50 percent (the 2-year flood), with a significant portion of the loss caused by floods with the value much greater than 1 percent (i.e., by floods more frequent than the 100-year flood).
Figure 4.1 shows the annual damage–exceedance probability function derived for a $250,000 structure located 4 feet below the 1 percent annual chance exceedance elevation. The structure in this example is in a floodplain for which the 10 percent annual chance exceedance water surface elevation is 3 feet less than the 1 percent annual chance exceedance water surface elevation (Zone A6). The average annual loss for the structure, computed by integrating the damage–exceedance probability function, is approximately $8,880. For this negatively elevated structure, approximately 30 percent of that loss is attributable to events more frequent than the 10 percent annual chance exceedance (10-year) event, and 60 percent of the loss is attributable to events more frequent than the 5 percent annual chance exceedance (20-year) event. Only 11 per-cent of the average annual loss is attributable to events less frequent than the 1 percent annual chance exceedance event. By comparison, all of the loss to a structure with a first floor elevation equal to the base flood elevation is attributable to events less frequent than the 1 percent annual chance exceedance event (dashed line in Figure 4.1).
The contribution of small flood events to the average annual loss is greater in locations with smaller differences between the 1 percent and 10 percent annual chance exceedance water surface elevations. For example, if the water surface elevation difference is 0.5 feet (Zone A1), then 88 percent of the average annual loss is due to the 10 percent annual chance exceedance (10-year) event or to more frequent events. If the water surface elevation difference is 8 feet (Zone A16), then 49 percent of the average annual loss is due to events less frequent than the 1 percent annual chance exceedance (100-year) event, while events more frequent than the 5 per-cent annual chance exceedance (20-year) event contribute nothing to the loss.
Average annual loss calculations for negatively elevated structures are also sensitive to even small inaccuracies in inundation depth estimates at the lower end of the water surface ele-vation–exceedance probability function. For the example shown in Figure 4.1, if inundation depths for events more frequent than those with a 10 percent annual chance of exceedance are 0.3 feet greater than those shown in the PELV curve (a reasonable tolerance in hydrologic and hydraulic analysis model results), then the average annual loss increases from $8,800 to approx-imately $10,220 (a 15 percent increase). If the inundation depths are 0.3 feet less than shown in the PELV curve, then the average annual loss is approximately $7,960 (a 10 percent decrease).

50
FIGURE vations. (Sstructure) Potentialdriven byance. Carout the enevents. Sthe full raelevationries of PEevents. Tand 10 pecurves wference b
The
damage awater in tclaims dablended Dthe two m
4.1 IllustratioSolid line) Lo. (Dashed line
l Changes toy losses fromreful definitintire range o
Site-specific ange of floo
n–exceedancELV curves,
The shape of ercent annua
would also habetween the
e NFIP predias a percentathe structureata and the UDELV modemodels. The
Tying Floo
P R E
on of a damagowest floor ele) Lowest flo
o the NFIP Mm floods morion of the waof floods wouwater surfacds, includinge probability, as describe
f the current Pal chance excave to reflect1 percent, 10
icts economage (damagee. The NFIP U.S. Army Cel. A standarmore credib
od Insurance
E P U B L I
ge–exceedancevation 4 feetor elevation e
Method. Thre frequent thater surface uld ensure th
ce elevation–g very frequy functions id in the prevPELV curveceedance det the relative0 percent, an
ic loss due toe ratio) of a suses two mo
Corps of Engrd actuarial tble the NFIP
to Flood Risk
C A T I O N
ce probabilityt below the bequal to the b
he loss potenhan those wielevation–exhat the PELV–exceedanceent floods. Iis not practicvious sectiones is dictatedepths. For nee magnitude nd 50 percen
DELV
o inundationstructure’s reodels—the d
gineers (USAtechnique (crclaims data
k for Low-Lyi
N C O P Y
y function forase flood elev
base flood elev
ntial for negaith 1 percentxceedance pV curves cape probability If developingcal, then the n, with specid by the diffeegatively elevof more freq
nt annual cha
n using a DEeplacement vdamage funcACE) damagredibility we
a, the less we
ing Structures
Y
r the same struvation (negativation.
atively elevat annual cha
probability fupture the mofunctions w
g site-specifiNFIP could
ial attention erence betwevated structuquent eventsance exceeda
ELV curve, wvalue for a sctions derivege functions—eighting) is ueight is given
s in the Flood
ucture at twoively elevated
ated structureance of exceeunction throuost frequent fwould represefic water surfd develop cat
given to freqeen the 1 perures, the PELs, such as theance depths.
which exprespecified depd from the N
—to developused to combn to the USA
dplain
ele-d
es is ed-ugh-flood ent face tego-quent rcent LV e dif-.
sses pth of NFIP p a bine
ACE

Factors That Affect Risk-Based Premiums for Negatively Elevated Structures 51
P R E P U B L I C A T I O N C O P Y
damage estimates. Different DELV curves are developed for different structure types and con-tents locations.
Three aspects of the inundation depth–damage function and its development affect premi-ums for structures in the NFIP portfolio, including negatively elevated structures. First, inunda-tion depth–damage data are highly variable. Second, data quality problems may compromise the integrity of the DELV curves (see Chapter 5). Third, the NFIP credibility weighting method in many cases assigns greater weight to the USACE damage estimates for a selected inundation depth than the NFIP damage estimates for the same depth without considering whether the quali-ty of the underlying USACE data is better than the NFIP data.
Variability of NFIP Damage Estimates
A reliable damage estimate is critical to the computation of the average annual loss. The NFIP frequently refines its inundation damage prediction functions using actual claims data. However, the claims data for a selected depth of inundation used in this refining are highly vari-able. For example, Figure 4.2 shows the distribution of damages reported for 2 feet of inundation depth in 2 years: 2005 and 2012. In these examples, damage ratios vary from zero to 100 percent. Figure 4.3 shows the coefficient of variation, which is the ratio of the standard deviation to the mean damage ratio, for one-story residential structures with no basement. The coefficient of var-iation is greater than 0.6 for water surface elevations -4 feet below to +4 feet above the lowest floor elevation, and is greater than 1.0 for some water surface elevations below the lowest floor elevation. In other types of structures, the coefficient of variation may be different.
The variance observed in Figure 4.2 may be attributable to (1) a failure of inundation depth alone to adequately predict damage, (2) poor data quality (see Chapter 5), or (3) unrecognized variability within a structure class. Besides depth, characteristics of flood events that may influ-ence the nature and extent of flood damage to a structure (and the observed variance in NFIP re-ported claims) include tidal- and wind-driven wave height, flow velocity, duration of inundation, debris and impact loads, sediment load, buoyancy, scour effects, erosion, and contamination (McBean et al., 1988; Thieken et al., 2005). As a result, floods with the same inundation depth may cause different damage. A suggestion that some of these factors contribute to damage is il-lustrated in Figure 4.4, which shows the mean flood damage ratio as a function of inundation depths for 2005 and 2012. The data for 2005 are dominated by Hurricane Katrina, which caused extensive damage in Louisiana and Mississippi. In New Orleans, where many structures behind levees are negatively elevated, some structures were inundated for an unusually long period of time, exacerbating damage, and others were near levee breaches where higher flow velocities increased forces on structures and caused more damage than predicted by depth alone. In Missis-sippi, which was not protected by coastal barriers, flood damage caused by high inundation depths and wind-driven waves extended many miles inland (Fritz et al., 2007). The difference between the 2005 and 2012 data could be interpreted as reflecting the effect of duration of inun-dation or to other factors, such as wave effects, scour at levee breaches, or the effects of debris.
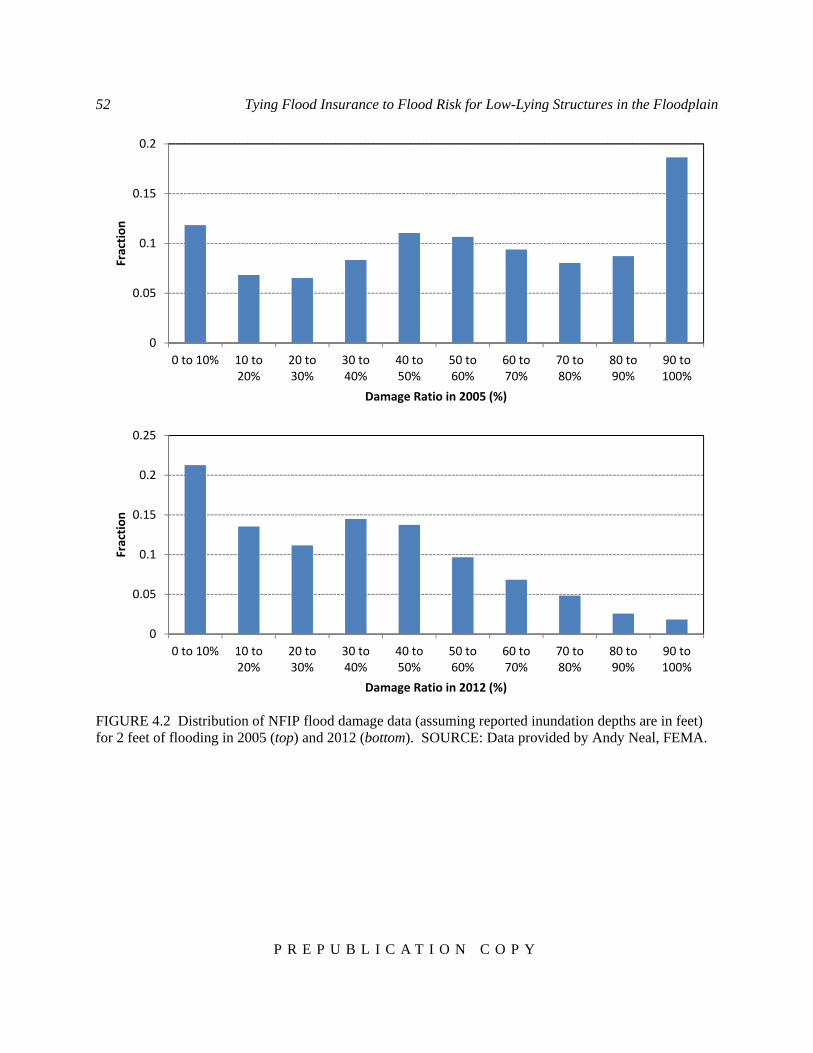
52 Tying Flood Insurance to Flood Risk for Low-Lying Structures in the Floodplain
P R E P U B L I C A T I O N C O P Y
FIGURE 4.2 Distribution of NFIP flood damage data (assuming reported inundation depths are in feet) for 2 feet of flooding in 2005 (top) and 2012 (bottom). SOURCE: Data provided by Andy Neal, FEMA.
0
0.05
0.1
0.15
0.2
0 to 10% 10 to20%
20 to30%
30 to40%
40 to50%
50 to60%
60 to70%
70 to80%
80 to90%
90 to100%
Frac
tion
Damage Ratio in 2005 (%)
0
0.05
0.1
0.15
0.2
0.25
0 to 10% 10 to20%
20 to30%
30 to40%
40 to50%
50 to60%
60 to70%
70 to80%
80 to90%
90 to100%
Frac
tion
Damage Ratio in 2012 (%)

Factors That Affect Risk-Based Premiums for Negatively Elevated Structures 53
P R E P U B L I C A T I O N C O P Y
FIGURE 4.3 Coefficient of variation—the ratio of the standard deviation to the mean damage ratio—determined for one-story residential structures with no basement in the NFIP portfolio. Damage reports from 2005 are excluded to avoid biasing results with damage from extreme coastal flooding in that year. SOURCE: Data provided by Andy Neal, FEMA.
FIGURE 4.4 Variation in the mean damage as a function of the inundation depth (assumed to be in feet) for the NFIP for 2005 and 2012. SOURCE: Data provided by Andy Neal, FEMA.
The variance in damage reports may also be attributable to vulnerability differences among structures within a given category. For example, the NFIP develops a DELV curve for all one-story, no basement residential structures without regard to the replacement value of the struc-tures. However, the higher quality materials and construction used in more expensive structures
0
0.5
1
1.5
2
-5 0 5 10 15 20Coef
ficie
nt o
f Var
iatio
n of
Dam
age
Repo
rted
for S
peci
fied
Inun
datio
n De
pth
Depth of Water Relative to the Lowest Floor Elevation (feet)
0%
10%
20%
30%
40%
50%
60%
70%
80%
90%
100%
2 3 4 5 6 7 8
Mea
n D
amag
e R
atio
Depth Above the First Floor Elevation (feet)
2005
2012
2005
2012
2005
2012
2005
2012
2005
2012
2005
2012
2005
2012
2005
2012
2005
2012

54 Tying Flood Insurance to Flood Risk for Low-Lying Structures in the Floodplain
P R E P U B L I C A T I O N C O P Y
may suffer greater damage (have higher damage ratios) at lower inundation depths than the mate-rials and construction used in less expensive structures. Potential Changes to the NFIP Method. To better understand the large variance in damage da-ta, additional data on flood hazard characteristics (e.g., depth and duration of flooding, flow ve-locity, sediment load) and structure vulnerability (e.g., properties of the foundation, quality of materials used in the construction and finish) would have to be collected in damage reports and analyzed. In addition, more classes of damage prediction functions may have to be developed to capture critical differences in drivers in the risk calculation. For example, functions might be de-veloped to represent damage that is due primarily to inundation depth; damage that is due pri-marily due to inundation depth and duration (likely to be particularly important for negatively elevated structures); and so on. Developing these functions would require improved data collec-tion (see Chapter 5) and research to establish reliable predictors of damage and their probabili-ties.
Weight Assigned to USACE Damage Estimates
The NFIP credibility weighting procedure (FEMA, 2003) estimates damage for each speci-fied inundation depth as follows:2
If the NFIP claims sample is large enough to assign 100 percent credibility at a selected confidence level (e.g., 90 percent),3 then the NFIP uses the damage estimate from claims reports.
If NFIP claims data are not available, then the NFIP uses the USACE estimate of dam-age.
If NFIP claims data are available, but not fully credible because of the small sample size, then the NFIP uses a weighted average of the NFIP claims data and the USACE damage estimates.
Figure 4.5 shows an example of the credibility analysis for 2005 loss data. The top figure shows the relative weights given to NFIP and USACE loss data from the credibility analysis. For inundation depths between zero and 5 feet, there are a sufficient number of NFIP claims data to assign full weight to the damages predicted with them; no weight is assigned to the USACE es-timates for inundation depths in that range (Figure 4.5, top). For greater and lesser inundation depths, NFIP claims data are sparse, and the USACE damage estimates are weighted heavily. The bottom figure shows the damage ratio function derived from NFIP claims data, USACE
2 Personal communication from Andy Neal, FEMA, on April 11, 2014. 3 The number of claims needed for full credibility =
×× , where Z is half the standard normal distribution value
corresponding to a required confidence, S is the sample (collection of claims corresponding to a water depth catego-ry) standard deviation, D is the desired relative error of the estimated mean, and X is the sample mean (FEMA, 2003).
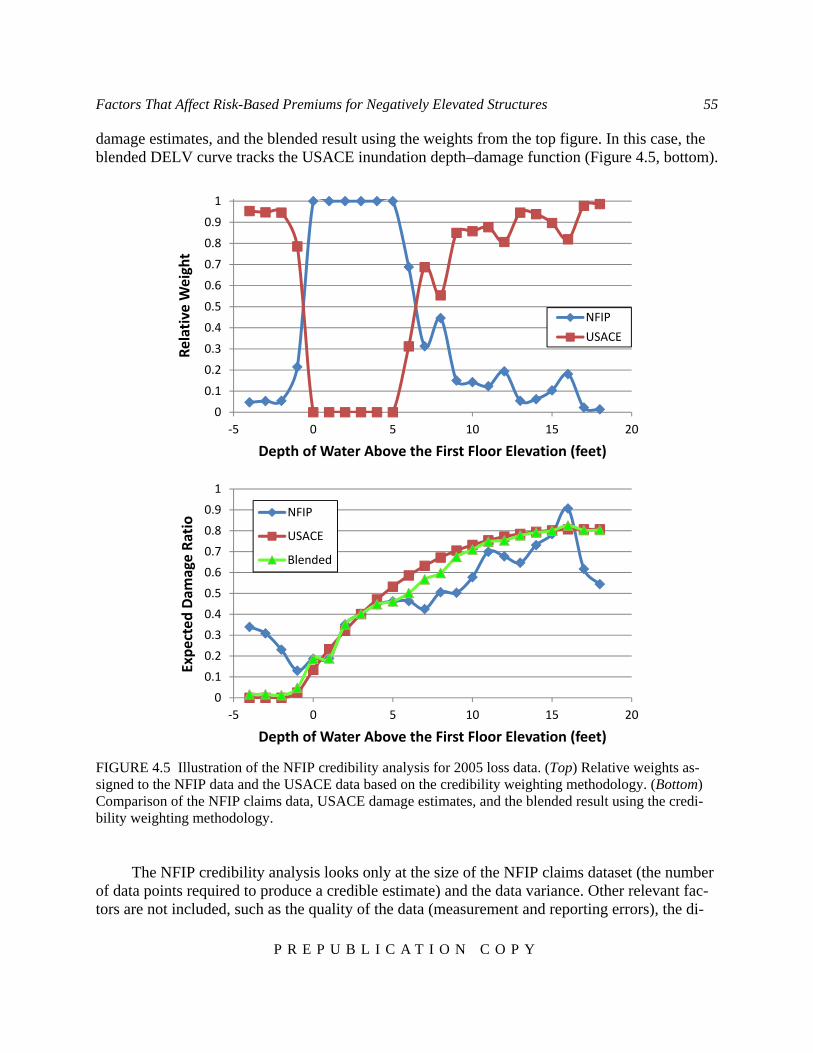
Factors That Affect Risk-Based Premiums for Negatively Elevated Structures 55
P R E P U B L I C A T I O N C O P Y
damage estimates, and the blended result using the weights from the top figure. In this case, the blended DELV curve tracks the USACE inundation depth–damage function (Figure 4.5, bottom).
FIGURE 4.5 Illustration of the NFIP credibility analysis for 2005 loss data. (Top) Relative weights as-signed to the NFIP data and the USACE data based on the credibility weighting methodology. (Bottom) Comparison of the NFIP claims data, USACE damage estimates, and the blended result using the credi-bility weighting methodology.
The NFIP credibility analysis looks only at the size of the NFIP claims dataset (the number of data points required to produce a credible estimate) and the data variance. Other relevant fac-tors are not included, such as the quality of the data (measurement and reporting errors), the di-
00.10.20.30.40.50.60.70.80.9
1
-5 0 5 10 15 20
Rela
tive
Wei
ght
Depth of Water Above the First Floor Elevation (feet)
NFIPUSACE
00.10.20.30.40.50.60.70.80.9
1
-5 0 5 10 15 20
Expe
cted
Dam
age
Ratio
Depth of Water Above the First Floor Elevation (feet)
NFIP
USACE
Blended
56 Tying Flood Insurance to Flood Risk for Low-Lying Structures in the Floodplain
P R E P U B L I C A T I O N C O P Y
versity of the data (e.g., the number of flood events, variability among flood events), the number of damage observations associated with individual flood events, structure variability, or other drivers of damage. In addition, the credibility criteria (data variance and size of the claims da-taset) are applied only to the NFIP data, not to the USACE inundation depth–damage function. Finally, the NFIP does not evaluate the quality of the USACE damage data. Thus, in some cases, unreliable estimates from the USACE will be given higher weight than high-quality but sparse NFIP claims data. Potential Changes to the NFIP Method. The NFIP could improve estimates of potential dam-age due to inundation by developing new inundation depth–damage functions using long-term averages of NFIP claims data or data from other sources. A new credibility analysis could then be implemented to adjust values as newer claim data become available. Smaller improvements could be made using the current weighting procedure, incorporating an assessment of the sample size and quality of both NFIP claims data and USACE damage estimates. Such changes would enhance the weighting procedure, and thus improve estimates of potential damage due to inunda-tion—or at least improve the confidence in those values. To incorporate the credibility of the USACE damage estimates into the weighting procedure, the NFIP would have to investigate and assess the quality and statistical significance of the USACE inundation depth–damage functions used. This may be straightforward with the new USACE damage functions being created (e.g., USACE, 2015), but would likely prove to be a challenge with the USACE inundation depth–damage functions used in the credibility analysis because little documentation of those functions is available.
UNDERINSURANCE
The NFIP computes flood loss by applying the damage ratio from the appropriate DELV curve to the replacement cost value of the structure. The objective is to set a rate that, when mul-tiplied by an amount of insurance, will produce a premium that makes a sufficient contribution to the risk pool to cover the NFIP’s expected losses. If the insurance limit of a policy is significant-ly less than the replacement value of the structure—a situation referred to as underinsurance—then the concept of recovering loss through pooling premiums can break down, and both the pol-icyholder and the insurer are threatened financially. For the policyholder, underinsurance means a loss may not be covered fully if the loss exceeds the amount of insurance purchased. For the insurer, underinsurance means that premiums collected for the underinsured property may not adequately reflect the loss, unless adjustments are made.
Empirical evidence shows that homeowners are often reluctant to protect themselves against low-probability high-consequence events, such as floods, and so purchase too little or no insurance unless required to do so (e.g., Kunreuther, 1984). The NFIP encourages, but does not require, the purchase of “insurance to value,” hence avoiding underinsurance, by providing re-placement cost coverage if a single family structure is insured to at least 80 percent of its value at the time of loss (or to the full statutory limit of $250,000 for structures). Otherwise, the loss is settled on an actual cash value basis. The program also encourages the purchase of higher

Factors That Affect Risk-Based Premiums for Negatively Elevated Structures 57
P R E P U B L I C A T I O N C O P Y
amounts of insurance by charging less for amounts of insurance purchased above the basic limits threshold, currently $60,000 for a single family building. The statutory mandatory flood insur-ance purchase requirement ties the amount of insurance to be purchased to the outstanding bal-ance of the loan on the property for federally backed or regulated mortgages (if there is one). This balance may be less than the replacement value, and some lenders require insurance to val-ue. In addition, the statutory limit of $250,000 on coverage for single family structures means that many structures cannot be covered to their full value. These statutory limitations may lead to underinsurance.
The NFIP method to compensate for underinsurance is to use a loading factor (UINS) in the rate formula. The loading factor adjusts the rate so that collectively the premiums reflect the amount of expected annual loss, thus protecting the NFIP from potential premium shortfalls as a result of underinsurance. To calculate underinsurance, the rate formula shown in Box 2.1 is ex-panded to account for losses that are not covered when the limits are lower than the property val-ue (see Formula 3 in FEMA, 2013d). Application of the NFIP rate formula to the rate classes produces results that are consistent with the first loss scales approach (Box 4.1). The breadth of a rate class can be a factor in how effective either approach is in treating underinsurance and in pricing the different layers of risk.
BOX 4.1 First Loss Scales
Financial risk in insurance can be treated as having three layers: the deductible, the insured limit,
and the difference between the insured limit and the value of the property (if it exceeds the policy limit of liability). The standard private industry practice is to apply a rate to the total replacement value of the property to develop the pure premium (average annual loss) and then to modify this rate to take account of the uninsured layers. The relative price for each layer is determined by applying what is referred to as a first loss scale. Claims data are used to determine the frequency of loss relative to the insured amount, and this relationship is used to assign the relative price of each layer of risk. Generally, for any given property, the first dollars of coverage are more expensive to provide than the last. This is why increasing a deductible (the first layer of financial risk) can have a large impact on reducing the premium, whereas purchasing higher amounts of coverage (second layer of financial risk) may not increase the overall pre-mium very much.
First loss scales are generally used in the insurance industry to rate individual properties. The NFIP rate formula is applied to classes of properties, but the resulting rates are consistent with those that would be developed for classes of properties using first loss scales.
In the VE zone (along coasts, with additional hazard due to wave velocity), where very
high premiums and high building values can lead to underinsurance, the NFIP rate depends on how much insurance is being purchased as a percentage of the building value. In all other zones, the rate loadings reflect a broader average of the amounts of insurance purchased relative to the building values. This broader averaging may be problematic if properties within a rate class are underinsured by substantially different amounts, as may happen when negatively elevated struc-tures are in the rate class. In such cases, the premiums paid for fully insured properties can end up subsidizing the underinsured properties.
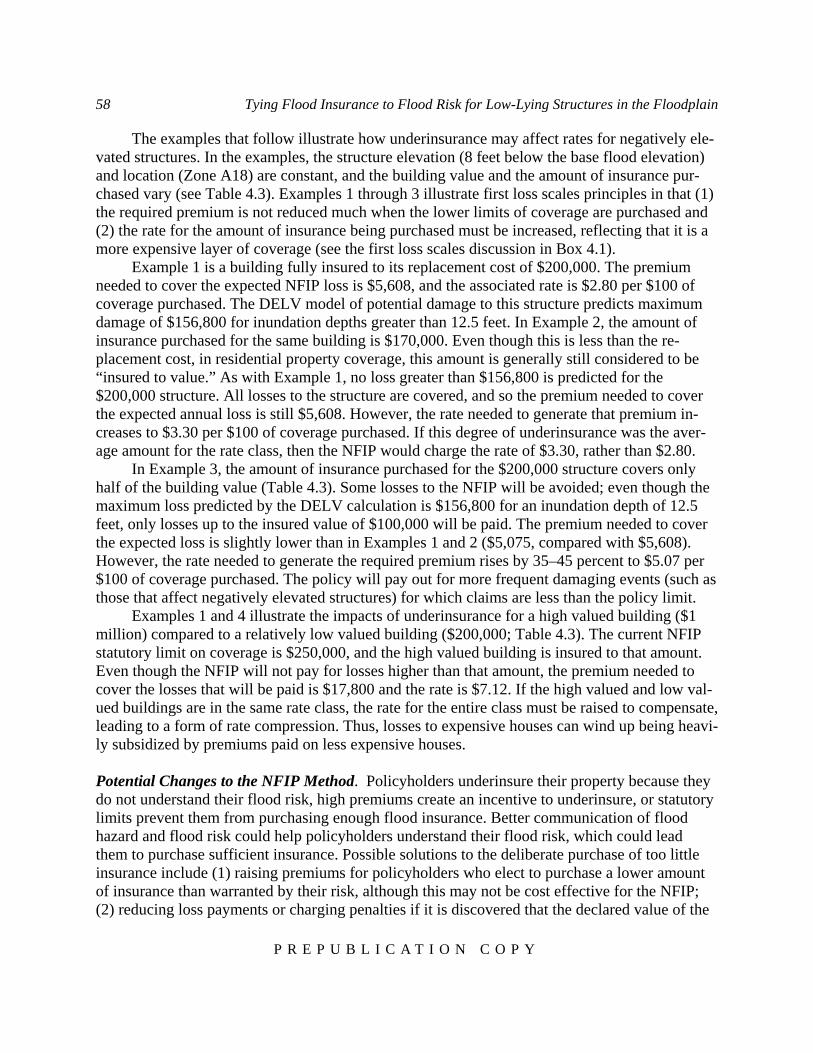
58 Tying Flood Insurance to Flood Risk for Low-Lying Structures in the Floodplain
P R E P U B L I C A T I O N C O P Y
The examples that follow illustrate how underinsurance may affect rates for negatively ele-vated structures. In the examples, the structure elevation (8 feet below the base flood elevation) and location (Zone A18) are constant, and the building value and the amount of insurance pur-chased vary (see Table 4.3). Examples 1 through 3 illustrate first loss scales principles in that (1) the required premium is not reduced much when the lower limits of coverage are purchased and (2) the rate for the amount of insurance being purchased must be increased, reflecting that it is a more expensive layer of coverage (see the first loss scales discussion in Box 4.1).
Example 1 is a building fully insured to its replacement cost of $200,000. The premium needed to cover the expected NFIP loss is $5,608, and the associated rate is $2.80 per $100 of coverage purchased. The DELV model of potential damage to this structure predicts maximum damage of $156,800 for inundation depths greater than 12.5 feet. In Example 2, the amount of insurance purchased for the same building is $170,000. Even though this is less than the re-placement cost, in residential property coverage, this amount is generally still considered to be “insured to value.” As with Example 1, no loss greater than $156,800 is predicted for the $200,000 structure. All losses to the structure are covered, and so the premium needed to cover the expected annual loss is still $5,608. However, the rate needed to generate that premium in-creases to $3.30 per $100 of coverage purchased. If this degree of underinsurance was the aver-age amount for the rate class, then the NFIP would charge the rate of $3.30, rather than $2.80.
In Example 3, the amount of insurance purchased for the $200,000 structure covers only half of the building value (Table 4.3). Some losses to the NFIP will be avoided; even though the maximum loss predicted by the DELV calculation is $156,800 for an inundation depth of 12.5 feet, only losses up to the insured value of $100,000 will be paid. The premium needed to cover the expected loss is slightly lower than in Examples 1 and 2 ($5,075, compared with $5,608). However, the rate needed to generate the required premium rises by 35–45 percent to $5.07 per $100 of coverage purchased. The policy will pay out for more frequent damaging events (such as those that affect negatively elevated structures) for which claims are less than the policy limit.
Examples 1 and 4 illustrate the impacts of underinsurance for a high valued building ($1 million) compared to a relatively low valued building ($200,000; Table 4.3). The current NFIP statutory limit on coverage is $250,000, and the high valued building is insured to that amount. Even though the NFIP will not pay for losses higher than that amount, the premium needed to cover the losses that will be paid is $17,800 and the rate is $7.12. If the high valued and low val-ued buildings are in the same rate class, the rate for the entire class must be raised to compensate, leading to a form of rate compression. Thus, losses to expensive houses can wind up being heavi-ly subsidized by premiums paid on less expensive houses. Potential Changes to the NFIP Method. Policyholders underinsure their property because they do not understand their flood risk, high premiums create an incentive to underinsure, or statutory limits prevent them from purchasing enough flood insurance. Better communication of flood hazard and flood risk could help policyholders understand their flood risk, which could lead them to purchase sufficient insurance. Possible solutions to the deliberate purchase of too little insurance include (1) raising premiums for policyholders who elect to purchase a lower amount of insurance than warranted by their risk, although this may not be cost effective for the NFIP; (2) reducing loss payments or charging penalties if it is discovered that the declared value of the

Factors That Affect Risk-Based Premiums for Negatively Elevated Structures 59
P R E P U B L I C A T I O N C O P Y
property is too low, although heavy penalties may be hard to impose in practice because they would likely cause political problems; and (3) expanding the treatment of underinsurance for VE zone structures to all structures in the NFIP portfolio. The first two are practices used in the in-surance industry. The third is used by the NFIP. Rather than making one overall adjustment in the rate for underinsurance in VE zones, the NFIP varies the rate based on the ratio of the amount of insurance purchased to the replacement cost value of the building. Three ratios are considered: less than 0.5; between 0.5 and 0.74; and 0.75 or more. A more refined classification scheme such as this could reduce the potential for cross subsidies.
Although outside the control of the NFIP, raising the statutory limits on federal flood insur-ance could lessen the underinsurance problem. The limits have not changed since 1994, even to correct for inflation ($250,000 in 1994 is equivalent to $402,000 in 2014). As a reference point, the average value of owner-occupied houses in California was $108,000 in 1994 and $233,600 in 2014.4 These are only averages, meaning that many policyholders have a structure value above the current $250,000 limit. At a national level, the committee’s analysis of the NFIP portfolio reveals that the proportion of single-family flood insurance policies at the $250,000 limit has in-creased from 11 percent in 2000 to 48 percent in 2012. As building replacement cost values in-crease over time, larger numbers of buildings may become underinsured, worsening the problem of cross subsidies illustrated above.
Another issue that affects the treatment of underinsurance is data quality. In the NFIP, in-surance companies and agents use their own methods to estimate replacement cost (e.g., property sales data, construction costs, maximum amount of insurance coverage), and so the estimates are often inconsistent. More consistent replacement cost values could improve the underinsurance adjustment as well as other terms in the NFIP actuarial rate formula, such as DELV. Potential ways to improve replacement cost values are discussed in Chapter 5.
4 Data from http://www.lincolninst.edu/subcenters/land-values/land-prices-by-state.asp.
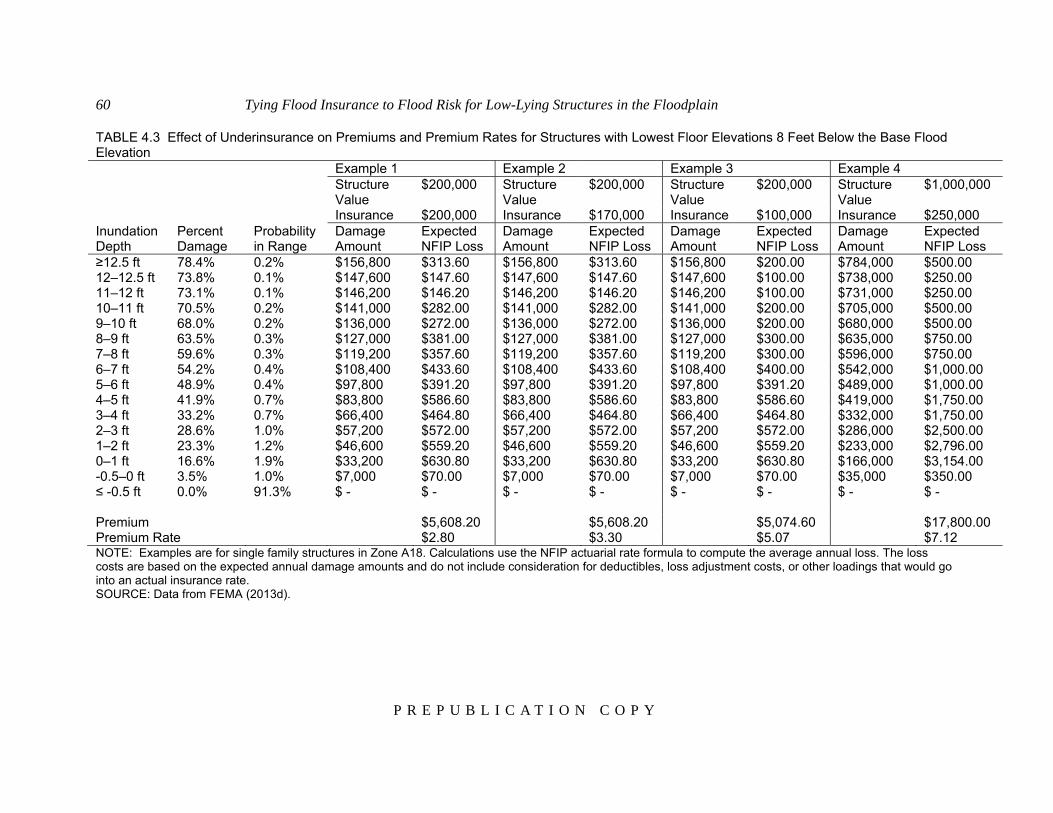
60 Tying Flood Insurance to Flood Risk for Low-Lying Structures in the Floodplain
P R E P U B L I C A T I O N C O P Y
TABLE 4.3 Effect of Underinsurance on Premiums and Premium Rates for Structures with Lowest Floor Elevations 8 Feet Below the Base Flood Elevation Example 1 Example 2 Example 3 Example 4 Structure
Value $200,000 Structure
Value $200,000 Structure
Value $200,000 Structure
Value $1,000,000
Insurance $200,000 Insurance $170,000 Insurance $100,000 Insurance $250,000 Inundation Depth
Percent Damage
Probability in Range
Damage Amount
Expected NFIP Loss
Damage Amount
Expected NFIP Loss
Damage Amount
Expected NFIP Loss
Damage Amount
Expected NFIP Loss
≥12.5 ft 78.4% 0.2% $156,800 $313.60 $156,800 $313.60 $156,800 $200.00 $784,000 $500.00 12–12.5 ft 73.8% 0.1% $147,600 $147.60 $147,600 $147.60 $147,600 $100.00 $738,000 $250.00 11–12 ft 73.1% 0.1% $146,200 $146.20 $146,200 $146.20 $146,200 $100.00 $731,000 $250.00 10–11 ft 70.5% 0.2% $141,000 $282.00 $141,000 $282.00 $141,000 $200.00 $705,000 $500.00 9–10 ft 68.0% 0.2% $136,000 $272.00 $136,000 $272.00 $136,000 $200.00 $680,000 $500.00 8–9 ft 63.5% 0.3% $127,000 $381.00 $127,000 $381.00 $127,000 $300.00 $635,000 $750.00 7–8 ft 59.6% 0.3% $119,200 $357.60 $119,200 $357.60 $119,200 $300.00 $596,000 $750.00 6–7 ft 54.2% 0.4% $108,400 $433.60 $108,400 $433.60 $108,400 $400.00 $542,000 $1,000.00 5–6 ft 48.9% 0.4% $97,800 $391.20 $97,800 $391.20 $97,800 $391.20 $489,000 $1,000.00 4–5 ft 41.9% 0.7% $83,800 $586.60 $83,800 $586.60 $83,800 $586.60 $419,000 $1,750.00 3–4 ft 33.2% 0.7% $66,400 $464.80 $66,400 $464.80 $66,400 $464.80 $332,000 $1,750.00 2–3 ft 28.6% 1.0% $57,200 $572.00 $57,200 $572.00 $57,200 $572.00 $286,000 $2,500.00 1–2 ft 23.3% 1.2% $46,600 $559.20 $46,600 $559.20 $46,600 $559.20 $233,000 $2,796.00 0–1 ft 16.6% 1.9% $33,200 $630.80 $33,200 $630.80 $33,200 $630.80 $166,000 $3,154.00 -0.5–0 ft 3.5% 1.0% $7,000 $70.00 $7,000 $70.00 $7,000 $70.00 $35,000 $350.00 ≤ -0.5 ft 0.0% 91.3% $ - $ - $ - $ - $ - $ - $ - $ - Premium $5,608.20 $5,608.20 $5,074.60 $17,800.00 Premium Rate $2.80 $3.30 $5.07 $7.12 NOTE: Examples are for single family structures in Zone A18. Calculations use the NFIP actuarial rate formula to compute the average annual loss. The loss costs are based on the expected annual damage amounts and do not include consideration for deductibles, loss adjustment costs, or other loadings that would go into an actual insurance rate. SOURCE: Data from FEMA (2013d).

Factors That Affect Risk-Based Premiums for Negatively Elevated Structures 61
P R E P U B L I C A T I O N C O P Y
DEDUCTIBLES
A deductible is the amount a policyholder pays for a loss before the insurance coverage is triggered. Deductibles can provide savings both to the insurer and the policyholder. For the in-surer, deductibles reduce a portion of the loss or eliminate smaller claims and the associated claim handling expenses. For the policyholder, deductibles lower the insurance premium. In gen-eral, the higher the deductible, the lower the premium because the deductible reduces the pre-dicted claim loss for the insurer. In addition, paying some part of the loss can encourage policy-holders to take mitigation actions, thereby reducing the potential for losses to both policyholders and insurers.
Deductibles can be offered as a defined amount unrelated to the limits of liability or the in-sured asset value, as a percentage of the limits of liability, or as a percentage of the insured asset value. To address any potential underreporting of values, the deductible is most often expressed as a percentage of value at the time of loss. The NFIP offers deductible options as set dollar amounts, not as percentages of insurance purchased or property value. Because premiums for negatively elevated structures are expected to be high when risk-based rates are implemented, it is important for the NFIP to look for ways that policyholders can reduce their premiums and re-ceive deductible discounts that are appropriate for the expected losses.
The current NFIP minimum deductibles for building and contents coverages range from $1,000 to $2,000 (Table 4.4), and the maximum deductible available for residential properties is $5,000 each for structure and contents coverage. Research shows that most people prefer low deductibles for all types of insurance, even though they will have to pay more for losses (Eldred, 1980; Cutler and Zeckhauser, 2004; Sydnor, 2006). In an analysis of flood insurance deductible choices of homeowners in Florida, Michel-Kerjan and Kousky (2010) found that nearly 80 per-cent of policyholders chose the lowest building deductible available, and about 18 percent chose the second lowest deductible available ($500 at the time). Such a low deductible has a significant financial impact on the NFIP. The committee’s analysis of national claims data for single family residences insured by the NFIP shows that increasing the minimum deductible to $2,500 would have saved the NFIP $1.6 billion in claims payments over the 1985–2009 period, and that in-creasing the minimum deductible to $5,000 would have saved $3.4 billion in claims payments. Of course, NFIP savings from these higher deductibles would be partly offset by the larger pre-mium discounts offered to policyholders. TABLE 4.4 Current Minimum Deductibles for all NFIP Policies Post-FIRM Rating Pre-FIRM Rating Building Coverage Building Contents Building Contents Below $100,000 $1,000 $1,000 $1,500 $1,500 Above $100,000 $1,250 $1,250 $2,000 $2,000 SOURCE: NFIP Insurance Agents Manual, June 2014, pp. 14-15.
Potential Changes to the NFIP Method. One way to reduce the anticipated premium increase for negatively elevated structures is to increase the minimum deductible. In addition, changes could be made in the way premium discounts are calculated. The current NFIP premium dis-

62 Tying Flood Insurance to Flood Risk for Low-Lying Structures in the Floodplain
P R E P U B L I C A T I O N C O P Y
counts for single family residences depend only on the dollar amount of the deductible selected and whether the insurance rating is for a pre-FIRM or post-FIRM structure. This simple ap-proach averages the effect of different deductibles on losses, masking connections between de-ductible amounts, premium discounts for deductibles, and loss drivers, such as flood hazard and structure value. Refining the current NFIP approach to account for differences in flood risk and structure values would result in higher premium discounts and thus lower premiums for lower valued properties. These higher discounts could be meaningful with the high premiums antici-pated for negatively elevated structures. The NFIP could also explore expressing deductibles as a percentage of the insured value, as is done in earthquake and hurricane insurance policies. This approach would more closely align the deductible discounts with the replacement values of the structures.
Regardless of which approach is taken, making the results widely available and as trans-parent as possible could promote policyholders’ understanding of the effects of deductible choic-es. For example, tools like the price simulator applications found on some private insurance company websites show how premiums would change for different deductible amounts and cov-erage limits, helping policyholders make more informed decisions on purchasing insurance.

63 P R E P U B L I C A T I O N C O P Y
5
Alternative Approaches and Implementation
National Flood Insurance Program (NFIP) methods for calculating risk-based premiums balance statutory requirements, actuarial principals, and practical considerations, such as feasi-bility, cost, and ease of implementation. Much of this balancing was based on the data and tech-nology that were available in the early years of the program. However, expected statutory chang-es (i.e., a shift from subsidized to risk-based rates for negatively elevated structures) and con-cerns raised in program reviews (e.g., GAO, 2014) are driving a change in NFIP methods. In ad-dition, technological advances (e.g., increased computing power; availability of lidar and web-based mapping; new techniques for providing greater spatial resolution in hazard modeling) are enabling analyses that were not practical in the early 1970s, when NFIP methods were devel-oped. This chapter presents the committee’s primary conclusions about calculating risk-based rates for negatively elevated structures, organized around the study tasks (Box 1.1).
CURRENT NFIP METHODS
The first task of the committee was to review current NFIP methods for calculating risk-based premiums for negatively elevated structures, including risk analysis, flood maps, and engi-neering data (see Box 1.1). NFIP methods for setting risk-based rates were developed for rating post-FIRM structures (i.e., those complying with NFIP construction standards), and their use has been tailored for structures with lowest floor elevations at or above the base flood elevation. The methods have also been applied for setting rates for about one-quarter of the negatively elevated structures in the NFIP portfolio (see “NFIP Insurance Rates” in Chapter 2).
Overall, the committee found that current NFIP methods for setting risk-based rates do not accurately and precisely describe critical hazard and vulnerability conditions that affect negative-ly elevated structures, including very frequent flooding, a longer duration of flooding, and a higher proportion of damage from small flood events. In addition, many NFIP methods were de-veloped decades ago and do not take full advantage of modern technological and analysis capa-bilities. Specific conclusions about NFIP methods are summarized below.

64 Tying Flood Insurance to Flood Risk for Low-Lying Structures in the Floodplain
P R E P U B L I C A T I O N C O P Y
ALTERNATIVE APPROACHES
The second task of the committee was to evaluate alternative approaches for calculating risk-based premiums for negatively elevated structures. The committee considered both incre-mental changes to current NFIP methods and different approaches, which would require re-search, development, and standardization; new data collection; and user training.
Incremental Changes to Current NFIP Methods Conclusion 1. Careful representation of frequent floods in the NFIP PELV curves is im-portant for assessing losses for negatively elevated structures. The shape of the PELV curve depends primarily on the difference between the 1 percent and 10 percent annual chance exceed-ance depths. However, a significant portion of potential losses to negatively elevated structures are caused by depths exceeded more frequently than once in 10 years on average (those with a 10 percent annual chance of exceedance). A short-term step to address this problem is to use infor-mation from existing detailed flood studies to refine the PELV curves so that they define more accurately the water surface elevations for frequent floods. If a flood study developed the flow frequency information needed to determine a base flood elevation (1 percent annual chance ex-ceedance elevation), then it could easily be expanded to determine more frequent water surface elevations. The incremental cost to extract this information from existing studies and to use it to refine the PELV curves is small compared to the cost of carrying out a new detailed flood study (typically $13,000 per mile in riverine areas and $9,300 per mile in coastal areas; see NRC, 2009). Conclusion 2. Averaging the average annual loss over a large set of PELV curves leads to rate classes that encompass high variability in flood hazard for negatively elevated struc-tures, and thus the premiums charged are too high for some policyholders and too low for others. An incremental change is to calculate the average annual flood loss component of the premium rate using a PELV curve that represents the flood hazard at the structure’s location, ra-ther than basing the calculation on the 30 PELV curves that represent flood hazard nationally. Local meteorological, watershed, and floodplain properties (e.g., terrain, presence of levees) could be used to guide the selection of the appropriate PELV curve or to develop new PELV curves using longer records and modern analysis techniques. This adjustment would lead to more narrowly defined rate classes and premiums that better reflect the local flood hazard. Conclusion 3. NFIP claims data for a given depth of flooding are highly variable, suggest-ing that inundation depth is not the only driver of damage to structures or that the quality of the economic damage and inundation depth reports that support the insurance claims is poor. Investigating the relationship between claims and the depth and duration of inundation is particularly important for negatively elevated structures, which are inundated by a flood longer than structures above the base flood elevation. An incremental improvement is to develop new classes of damage prediction functions that capture key damage drivers (e.g., depth and duration
Alternative Approaches and Implementation 65
P R E P U B L I C A T I O N C O P Y
of inundation, flow velocity, water contamination, debris content) and use the appropriate func-tion in the rate calculation. Research and new data collection would be required to determine which drivers for estimating flood damage are important. The incremental costs for collecting additional data on structure characteristics is likely to be low, and the cost for carrying out the research is likely to be moderate. The contribution of data quality to the variability in claims data is discussed below (see “Supporting Data”). Conclusion 4. When the sample of claims data is small, the NFIP credibility weighting scheme assumes that U.S. Army Corps of Engineers (USACE) damage estimates are better than NFIP claims data, which has not been proven. With almost 50 years of NFIP claims da-ta, it may no longer be necessary to incorporate USACE damage models of unknown origin and quality into NFIP damage estimates. Instead, the NFIP could rely on improved damage models (see Conclusion 3) and its own and other flood damage reports (including damage reports from USACE, the National Weather Service, and state and local agencies involved in post-flood dam-age assessments) to adjust the DELV curves annually. This approach would take advantage of better models, a larger dataset, and multiple sources of damage data, which would provide an independent check on NFIP data quality. Smaller improvements could be made by determining the quality of the USACE data—a difficult task given the lack of documentation—and revising the NFIP credibility scheme to weigh the two datasets appropriately. Conclusion 5. Levees may reduce the flood risk for negatively elevated structures, even if they do not meet NFIP standards for protection against the 1 percent annual chance ex-ceedance flood. An incremental step is to modify the Levee Analysis and Mapping Procedure (LAMP) to assess the ability of non-accredited levees to prevent inundation of negatively elevat-ed structures by events more frequent than the 1 percent annual chance exceedance flood. LAMP implementation has only recently begun, and so the cost of application is uncertain. Much of the effort focuses on developing and calibrating models that can be used for floods with various ex-ceedance probabilities. The effort to modify the procedure and use the results in the average an-nual loss calculation is likely to be moderate. The procedure is already being applied for the 1 percent annual chance exceedance flood, and so the incremental cost to apply it for more fre-quent events will likely be low. However, the cost to collect the data necessary to assess the lev-ee performance and reduction of flood risk may be high, especially for levees that have never been certified. Conclusion 6. When risk-based rates for negatively elevated structures are implemented, premiums are likely to be higher than they are today, creating perverse incentives for poli-cyholders to purchase too little or no insurance. As a result, the concept of recovering loss through pooling premiums breaks down, and the NFIP may not collect enough premiums to cover losses and underinsured policyholders may have inadequate financial protection. A short term solution for discouraging the deliberate purchase of too little insurance, and to fairly compensate for it, is to tie the underinsurance adjustment to the ratio of the amount of insurance purchased to the replacement cost value of the structure, as is currently done for structures in the VE zone. Alternatively, the NFIP could reduce loss payments or impose other penalties for se-
66 Tying Flood Insurance to Flood Risk for Low-Lying Structures in the Floodplain
P R E P U B L I C A T I O N C O P Y
verely underinsured structures, although public policy issues may also have to considered. The cost to implement these changes will likely be low. Conclusion 7. Adjustments in deductible discounts could help reduce the high risk-based premiums expected for negatively elevated structures. Premium discounts are currently based on the dollar amount of the deductible chosen and whether the structure is pre- or post-FIRM. However, more refined PELV curves and more accurate replacement cost information in rating policies can be used to structure deductible discounts that are more appropriate to individual ex-pected annual losses. Minimum deductibles could also be increased, which would reduce premi-ums as well as NFIP expected claims payouts overall. The costs to implement these changes are likely to be low.
New Approach: A Comprehensive Risk Assessment Conclusion 8. Modern technologies, including analysis tools and improved data collection and management capabilities, enable the development and use of comprehensive risk as-sessment methods, which could improve NFIP estimates of flood loss. A comprehensive risk assessment would describe risk over the entire range of flood hazard conditions and flood events, including the large, infrequent floods that cause substantial losses to the NFIP portfolio, and the smaller, frequent floods that make up a significant portion of loss to negatively elevated struc-tures. It would also describe the various levels of protection offered by all elements of a flood protection system (e.g., reservoirs, levees, floodwalls, diversions and bypasses, channels, warn-ing systems) and mitigation measures (e.g., elevating structures) through the entire range of flood events. Finally, a comprehensive risk assessment would account explicitly for uncertainty and changing conditions. Epistemic and aleatory uncertainties are accounted for through the risk analysis, including uncertainty about current and future flood hazard; structure value, vulnerabil-ity, and elevation; and current and future performance of flood protection measures. The results of a comprehensive risk assessment would improve the accuracy, precision, and robustness of flood loss estimates. It would also provide additional information to support management of the NFIP portfolio.
The NFIP already has taken some steps toward a comprehensive risk assessment (e.g., by developing multi-frequency depth grids). In addition, the NFIP is collaborating with the USACE to align methods. For example, a joint USACE–Federal Emergency Management Agency (FEMA) task force recommended the following for the NFIP (USACE and FEMA, 2013, p. 14):
Eliminate the concept of levee system accreditation and instead implement a risk-informed suite of NFIP actions. This involves a more holistic change within the NFIP from a single “in or out” boundary of 1 percent annual chance exceedance for insurance and floodplain management to grad-uated zones that reflect risk, including consequences. This could include insurance premiums scaled for each parcel/risk zone, whether leveed or not, and implementation of risk-informed floodplain management requirements scaled to the risk zones.

Alternative Approaches and Implementation 67
P R E P U B L I C A T I O N C O P Y
Key steps in implementing a comprehensive risk assessment include the following:
Develop or adapt a framework and software for the analysis. The software would have to integrate descriptions of hazard, exposure, vulnerability, performance, and uncertainty about those components to compute the distribution of flood losses and the average annual loss and to assess risk for individual structures, communities, or the entire portfolio of insured structures. The procedures and software would have to be consistent and applicable for a broad user base. Developing the software and procedures, training users, and shifting operations from the current hydrologic method to a comprehensive risk assessment would likely be expensive. However, tak-ing advantage of existing procedures and software tools developed by the USACE (USACE, 1996),1 the NFIP,2 or other government agencies and private companies involved in floodplain management could yield significant cost savings.
Describe flood hazard for every structure by modeling watershed, channel, tidal, and riverine and coastal floodplain characteristics at fine spatial resolution. This description would replace the hazard information currently provided by the PELV curves. The NFIP’s multi-frequency depth grids, which use available hydrologic and hydraulic analysis to describe site-specific flood hazard, are a step in this direction. In certain cases, information from existing flood studies completed by the NFIP, the USACE, or other agencies is adequate for this purpose. In other cases, new studies will have to be completed to define the water surface elevation–exceedance probability functions. Modeling costs will be consistent with those incurred by the NFIP today, although additional model applications will have to be developed to compute inun-dation depths for the full range of flood frequencies. Where the terrain and hydraulics are com-plex, multi-dimensional hydraulic models will have be developed to capture the water move-ment. These come at a greater cost. However, the capabilities of readily available, commonly used software—notably HEC-RAS—are expanding, permitting multi-dimensional modeling to be carried out cheaper and faster than before (Brunner, 2014).
Describe quantitatively the uncertainty about all of the components of the flood risk analysis. For example, it will be important to describe the distribution about the mean 50, 10, 1, and 0.2 percent annual chance exceedance inundation depths. This distribution will depend on how the inundation depth–exceedance probability function is defined, including the size of the historical sample used to fit the probability model. Integrating uncertainty analysis into the rate calculation would add costs, because it imposes two new requirements on the NFIP: (1) the de-velopment of probability distributions of key inputs and (2) numerous repetitions of calculations. For some inputs, the probability distributions could be estimated with little additional effort. For example, information about the distribution of damage incurred for a given inundation depth is currently reported and could be used to derive the distribution about the mean damage. Estimat-ing uncertainty about other inputs would require more effort. In addition, training in methods for describing uncertainty of the various flood risk components will likely be required.
Determine the elevation, replacement value, and relevant characteristics of insured structures. Structure elevation data are needed to develop a predictor of potential damage to the
1 See http://www.hec.usace.army.mil/software/hec-fda/. 2 See http://www.fema.gov/hazus.

68 Tying Flood Insurance to Flood Risk for Low-Lying Structures in the Floodplain
P R E P U B L I C A T I O N C O P Y
structure for all inundation depths. Replacement values are needed to identify the maximum po-tential damage and to develop more realistic damage models. Relevant structure characteristics need to be determined so that a proper predictor of damage can be used when structures are grouped for damage assessment. Low cost methods for obtaining structure elevation, replace-ment values, and structure characteristics are discussed below.
Describe the performance of levees and other flood protection measures with probabil-istic models, which are not typically used in NFIP analyses. Developing these models is likely to be one of the more expensive elements of a comprehensive risk analysis framework. Some of the required input has been developed by the USACE, but the analysis would go further by capturing the system-wide performance of all elements of a flood protection system. In addition, the NFIP technical investigations and analyses for levee certification are similar to those that would be re-quired to develop fragility functions for each flood protection measure. New standards for these analyses and models would have to be developed and promulgated to ensure they are applied consistently.
The greatest improvements in precision and accuracy and the fewest integration problems are likely if NFIP takes all steps, making the holistic change recommended by the USACE–FEMA interagency task force. However, these steps could be implemented independently, with some attention to their eventual inclusion in a comprehensive risk assessment.
SUPPORTING DATA
The third and fourth tasks of the committee concern data. Task 3 was to discuss engineer-ing, hydrologic, and property assessment data needed for implementing risk-based premiums for negatively elevated structures, and Task 4 was to discuss approaches for keeping these data up-dated. The discussion below focuses on near-term data issues, which have been documented or seem likely to arise.
Data Collection Conclusion 9. Risk-based rating for negatively elevated structures requires, at a minimum, structure elevation data, water surface elevations for frequent flood events, and new infor-mation on structure characteristics to support the assessment of structure damage and flood risk. Water surface elevation data can be extracted from existing flood studies (see Con-clusion 2). Data on structure elevation and characteristics will have to be collected. Structure Elevation. Structure elevations have not been determined for approximately three-quarters of the structures in the NFIP thought to be negatively elevated. The NFIP requires an Elevation Certificate for risk-based rating (FEMA, 2004). An Elevation Certificate records the elevation of the lowest floor of a structure and also includes information on the property, the Flood Insurance Rate Map for the community, and photographs and comments describing the

Alternative Approaches and Implementation 69
P R E P U B L I C A T I O N C O P Y
building. Figure 5.1 shows an Elevation Certificate for a negatively elevated structure in Isleton, California. For this structure, the base flood elevation is 9 feet (item B9), and the top of bottom floor and the lowest adjacent grade are far below that (item C2).
For a given rate class, the lower the elevation of the structure, the higher the premium, with large premium increases every foot below the base flood elevation (e.g., see Table 2.2). Conse-quently, it is important to obtain accurate estimates of structure elevations, particularly for nega-tively elevated structures. Errors in the structure elevation used for risk-based rating can result in policyholders paying too much or too little for flood insurance. A Dewberry (2005) study found a significant number of errors in Elevation Certificates. For example, in Pinellas County, Florida, 12.5 percent of 1,524 certificates had either no lowest floor elevation or grossly erroneous eleva-tions. Detecting and correcting errors and omissions in the forms is the responsibility of the communities that maintain the Elevation Certificates (FEMA, 2004). In practice, however, it is difficult for a community to confirm whether the information on an Elevation Certificate is accu-rate, and so audits tend to focus on whether the blanks are filled in. This raises important ques-tions about the quality of the existing certificates.
An Elevation Certificate prepared by a licensed surveyor or engineer generally costs $500 to $1,000, and the cost is usually borne by policyholders. Substantial cost savings are possible if large groups of structures (e.g., a neighborhood) are surveyed with common land surveying methods. Obtaining commercial data may also be cost effective. In addition, new technologies have the potential to estimate structure elevation at a much lower cost. For example, vehicle-mounted lidar is being used in North Carolina to acquire highest adjacent grade elevations for approximately $25 per structure.3 However, some work would have to be done to determine the extent to which these highest adjacent grade elevations can be translated to lowest floor eleva-tions. For example, a Dewberry (2005) report found that lidar measurements would have to be supplemented with on-site precise survey measurements. Cross-checking structure elevations from vehicle-mounted lidar and from Elevation Certificates may offer a means of validating both measurements.
Structure elevations (and in some cases, flood studies) have to be updated following a ma-jor flood event or the accumulation of enough vertical land motion (e.g., uplift from tectonics, subsidence from sediment compaction or extraction of water or hydrocarbons) to change the rate class. These updates will maintain the accuracy of the flood hazard assessments. Vertical land motion is significant in some parts of the country. For example, the coasts of Oregon and Wash-ington are rising about 1.5–3.0 mm per year due to tectonics, and parts of the Los Angeles Basin have risen or dropped by more than 10 mm per year due to hydrocarbon and groundwater with-drawal and faulting (NRC, 2012).
3 Presentation to the committee by John Dorman, Program Director, North Carolina Floodplain Mapping Program, on May 12, 2014.
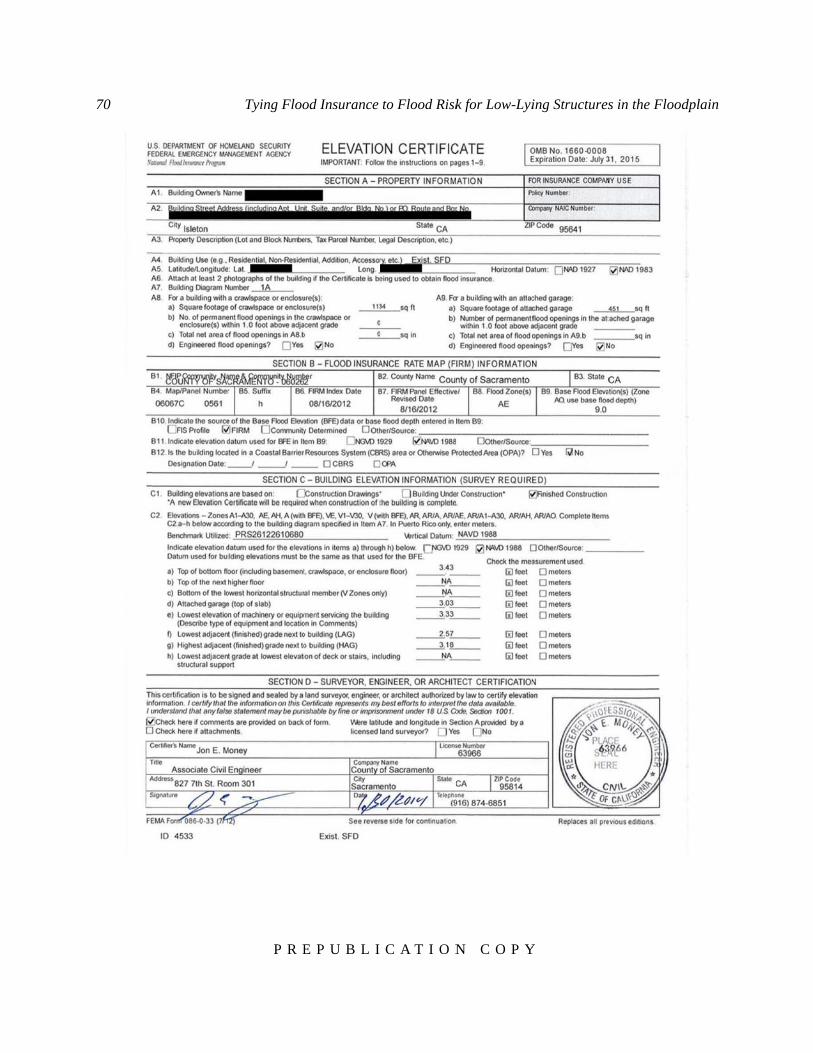
70
Tying Floo
P R E
od Insurance
E P U B L I
to Flood Risk
C A T I O N
k for Low-Lyi
N C O P Y
ing Structures
Y
s in the Flooddplain

Alternativ
FIGURE elevated hEngineer,
ve Approache
5.1 Examplehouse built in Sacramento
es and Implem
P R E
e of an Elevat1970 in IsletCounty, Calif
mentation
E P U B L I
ion Certificatton, Californiafornia.
C A T I O N
te, with identia. SOURCE:
N C O P Y
ifying feature: Courtesy of
Y
es redacted, fof George Boot
or a negativelth, Senior Civ
71
ly vil
72 Tying Flood Insurance to Flood Risk for Low-Lying Structures in the Floodplain
P R E P U B L I C A T I O N C O P Y
Structure Characteristics. Information on structure characteristics is used to understand the ex-posure and vulnerability of structures to damage from flooding. The NFIP collects some infor-mation on structures, including the construction characteristics (e.g., presence of a basement), the number of floors, and the type of supporting foundation. However, additional information would have to be collected to support the development and use of improved damage prediction models that consider flood duration, which is likely important for negatively elevated structures, as well as other possible drivers of flood damage. New data needs include the characteristics and usage of basements, the properties of the foundation, the type of structure or architecture, the type of interior and exterior finishes (e.g., brick vs. siding; wood vs. vinyl floors), and the quality of con-struction. These data would likely need to be updated only after a major renovation. The incre-mental cost for collecting additional data on structure characteristics is likely to be low.
Data Quality and Consistency Conclusion 10. The lack of uniformity and control over the methods used to determine structure replacement cost values and the insufficient quality control of NFIP claims data undermine the accuracy of NFIP flood loss estimates and premium adjustments. Replacement Cost. The NFIP obtains replacement cost data from insurance companies and agents, who use their own methods to estimate replacement cost (e.g., property sales data, con-struction costs, maximum amount of insurance coverage). Consequently, replacement cost esti-mates are often inconsistent. Replacement cost values could potentially be improved by (1) re-quiring all insurance companies and agents to use a single cost estimation method or (2) purchas-ing replacement cost data from commercial databases that use consistent methods to estimate replacement costs. A single method for estimating replacement costs, either developed or en-dorsed by the NFIP, would yield more consistent results and also be less liable to manipulation. The cost of obtaining more accurate estimates of replacement values from insurance companies need not exceed the current cost. An alternative is to purchase commercially available property replacement values estimated from regional and local property sales data, construction cost data, and other proprietary information, as is commonly done in the private insurance industry. Re-placement cost estimates provided to this committee by two commercial data providers are in the range of $0.40 to $0.60 per property for the NFIP portfolio (about $2.5 million for all NFIP poli-cies). Having multiple sources of replacement cost data would also enable the NFIP to assess the quality of replacement cost data and to choose which is best for rating purposes.
The value of a structure will change following a disaster (e.g., flood, fire, earthquake), structural modification, or socioeconomic factors (e.g., regional economic trends). Replacement cost data for affected properties could be purchased following these triggers. Increases in con-struction costs due to local demand surge in a post-disaster environment could be predicted with engineering and economic indices.
Alternative Approaches and Implementation 73
P R E P U B L I C A T I O N C O P Y
NFIP Claims Data. The variability in NFIP claims data for a given depth of inundation may partly reflect the inconsistent replacement cost data discussed above or the quality of damage reports. For example, the units for reporting inundation depths are not always specified consist-ently (e.g., 2 feet versus 2 inches), creating considerable uncertainty.4 In addition, basic data that are used to estimate flood damages (e.g., base flood elevation, depth of flooding, losses above the amount of flood insurance carried) are not always accurate or complete (Galloway et al., 2006; GAO, 2008). While data needed for later analysis can be cleaned up by adjusting for what appear to be erroneous values or outliers, ongoing efforts to improve quality at the point of data collection are important to the NFIP ratemaking method.
Data quality could be improved by collecting more data in damage reports and implement-ing a more thorough quality control and review process. A focused sampling of historical loss claims could reveal where data quality has compromised rate setting. For example, verifying his-torical inundation depths (e.g., by using stream gage data) and analyzing spatial statistics on a sample of structure elevations could show the extent to which unreported units of inundation depth are a problem. In addition, systemic changes in the manner data are collected and reported could improve data quality. For example, damage report forms could be revised to specify that inundation depths are reported in inches. Other changes could include more stringent require-ments and standardized procedures for Write Your Own companies and contractors involved in NFIP insurance operations as well as targeted efforts in the ongoing operational reviews of those entities.
FEASIBILITY, IMPLEMENTATION, AND COST
The fifth task of the committee was to discuss feasibility, implementation, and cost of un-derwriting risk-based premiums for negatively elevated structures, including a comparison of factors used to set risk-based premiums. A detailed assessment of implementation options was beyond the capability of the committee because it requires detailed information on NFIP opera-tions, costs, and plans, as well as the knowledge and experience of NFIP analysts. Consequently, the committee used its judgment, gained through experience with similar risk assessments, to discuss issues of timing, costs, and level of effort associated with adjusting NFIP methods. These issues are discussed below and summarized in Table 5.1.
Feasibility
Many of the analysis approaches identified by the committee are already being carried out by other organizations, and so should be feasible for the NFIP to implement. For example, the USACE analyzes risk on a site-specific basis for its planning studies, developing water surface elevation–exceedance probability functions and computing average annual loss for individual structures or groups of structures. This approach demonstrates that site-specific precision for risk
4 Personal communication from Andy Neal, FEMA, on July 7, 2014.

74 Tying Flood Insurance to Flood Risk for Low-Lying Structures in the Floodplain
P R E P U B L I C A T I O N C O P Y
analysis is feasible. The performance of levees in reducing flood risk has been described using probabilistic models by the USACE and others (URS/JBA, 2008; IPET, 2009). This approach was recommended by the USACE–FEMA task force and was expected to have a cost compara-ble to the cost of NFIP levee accreditation (USACE and FEMA, 2013). Modeling and analysis of site-specific information and future flood scenarios are already used in the private flood insur-ance market (see “Catastrophe Models” in Chapter 3), demonstrating that more refined rating models are feasible. Finally, the state of North Carolina has demonstrated that lidar mounted on vehicles can be used to determine individual structure elevations on a large scale and at low cost. It has also shown that a digital environment that displays information on flood hazard, structure vulnerability, and flood risk management options for individual structures can be created at rela-tively low cost ($3,000–$12,000 per county in North Carolina).5
Cost
As discussed above and summarized in Table 5.1, incremental changes to current NFIP methods can be accomplished at low or moderate cost. Implementing new approaches, such as those included in a comprehensive risk assessment, will carry higher costs. However, the use of relevant information, models, and analysis methods developed by other government agencies would speed the work and stretch NFIP resources. For example, the USACE collects data on structure elevations, types, and replacement values in floodprone areas, and derives hazard and performance information for its planning studies. Similarly, California has collected information on flood hazard, performance, exposure, and vulnerability in the Central Valley.6 Obtaining such information would enable the NFIP to move to a comprehensive risk analysis in some areas without incurring all costs associated with developing new models and gathering new data. Easy access to flood risk databases, such as those maintained by North Carolina, could also reduce costs for insurance companies and agents that write NFIP policies by reducing the need to collect information or interpret map data in some areas.
Implementation
This report identifies a menu of possible changes to NFIP methods, ranging from simple to complex. Ultimately, the NFIP needs methods that rest on a firm scientific and technical founda-tion, which is important for setting rates that are credible, fair, and transparent. Changes to the water surface elevation–exceedance probability functions and to the flood damage functions would strengthen the scientific and technical foundation for setting risk-based rates for negative-ly elevated structures. If immediate changes must be made (e.g., a congressionally mandated end to subsidies and shift to risk-based rates), then the NFIP could implement the incremental chang-es to PELV, DELV, and levee performance. Otherwise, taking the time and effort to implement a
5 Presentation to the committee by John Dorman, North Carolina Floodplain Mapping Program, on May 12, 2014. 6 See http://www.water.ca.gov/cvfmp/2012cvfpp.cfm.
Alternative Approaches and Implementation 75
P R E P U B L I C A T I O N C O P Y
comprehensive risk analysis methodology and to develop site-specific flood hazard descriptions, models that predict damage from multiple drivers, and probabilistic models that describe the per-formance of risk reduction measures would yield a better assessment of flood losses, and thereby provide a firmer foundation for rate setting.
The challenge for the NFIP is to determine how to integrate the components of a compre-hensive risk analysis into the rate-setting process. Although it is feasible to estimate the average annual loss for each structure, it may not be practical for a national insurance program to admin-ister a program with potentially millions of structure-specific rates. For example, premium rates may vary by only a few cents per $1,000 among similar structures in a neighborhood, because of slight differences in the water surface elevation–exceedance probability functions. The accuracy achieved with these rates would not be worth the administrative burden. However, flood losses calculated for individual structures could be used to inform the assignment of those structures to rate classes.
Similarly, some evaluation will be required to balance the higher costs of data analysis and training against the benefits of a thorough uncertainty analysis. These benefits include a more reliable estimate of the expected loss, including losses from low-probability high-consequence events such as hurricanes Katrina and Sandy, and a clear statement of the limitations of the un-derlying analysis. In addition, the analysis would identify areas of high uncertainty, and thus where enhanced data collection or refinements to the rate model would be most productive. For example, if uncertainty analysis demonstrates that rates are most sensitive to variations about mean inundation depth, then the NFIP may choose not to invest in expanding the current depth–damage predictors to include flood duration, velocity, or other damage drivers.
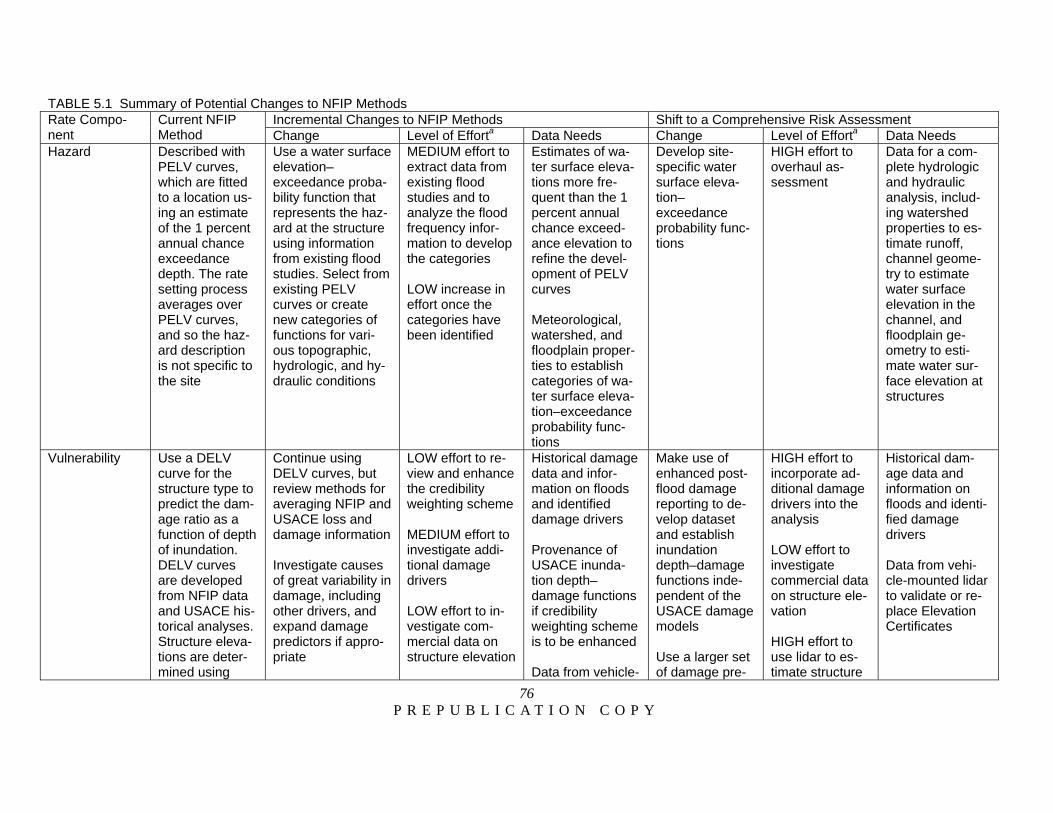
76 P R E P U B L I C A T I O N C O P Y
TABLE 5.1 Summary of Potential Changes to NFIP Methods Rate Compo-nent
Current NFIP Method
Incremental Changes to NFIP Methods Shift to a Comprehensive Risk Assessment Change Level of Efforta Data Needs Change Level of Efforta Data Needs
Hazard Described with PELV curves, which are fitted to a location us-ing an estimate of the 1 percent annual chance exceedance depth. The rate setting process averages over PELV curves, and so the haz-ard description is not specific to the site
Use a water surface elevation–exceedance proba-bility function that represents the haz-ard at the structure using information from existing flood studies. Select from existing PELV curves or create new categories of functions for vari-ous topographic, hydrologic, and hy-draulic conditions
MEDIUM effort to extract data from existing flood studies and to analyze the flood frequency infor-mation to develop the categories LOW increase in effort once the categories have been identified
Estimates of wa-ter surface eleva-tions more fre-quent than the 1 percent annual chance exceed-ance elevation to refine the devel-opment of PELV curves Meteorological, watershed, and floodplain proper-ties to establish categories of wa-ter surface eleva-tion–exceedance probability func-tions
Develop site-specific water surface eleva-tion–exceedance probability func-tions
HIGH effort to overhaul as-sessment
Data for a com-plete hydrologic and hydraulic analysis, includ-ing watershed properties to es-timate runoff, channel geome-try to estimate water surface elevation in the channel, and floodplain ge-ometry to esti-mate water sur-face elevation at structures
Vulnerability Use a DELV curve for the structure type to predict the dam-age ratio as a function of depth of inundation. DELV curves are developed from NFIP data and USACE his-torical analyses. Structure eleva-tions are deter-mined using
Continue using DELV curves, but review methods for averaging NFIP and USACE loss and damage information Investigate causes of great variability in damage, including other drivers, and expand damage predictors if appro-priate
LOW effort to re-view and enhance the credibility weighting scheme MEDIUM effort to investigate addi-tional damage drivers LOW effort to in-vestigate com-mercial data on structure elevation
Historical damage data and infor-mation on floods and identified damage drivers Provenance of USACE inunda-tion depth–damage functions if credibility weighting scheme is to be enhanced Data from vehicle-
Make use of enhanced post-flood damage reporting to de-velop dataset and establish inundation depth–damage functions inde-pendent of the USACE damage models Use a larger set of damage pre-
HIGH effort to incorporate ad-ditional damage drivers into the analysis LOW effort to investigate commercial data on structure ele-vation HIGH effort to use lidar to es-timate structure
Historical dam-age data and information on floods and identi-fied damage drivers Data from vehi-cle-mounted lidar to validate or re-place Elevation Certificates

Alternative Approaches and Implementation 77
P R E P U B L I C A T I O N C O P Y
ground surveys Require property owners to obtain Elevation Certifi-cates Investigate using commercial sources of structure eleva-tion data Investigate using vehicle-mounted lidar to estimate lowest floor eleva-tion
HIGH effort to use lidar to estimate structure eleva-tions
mounted lidar to validate or replace Elevation Certifi-cates
dictors to cap-ture the relevant drivers of dam-age Investigate us-ing vehicle-mounted lidar to estimate lowest floor elevation
elevations
Exposure Use structure replacement values reported by insurance agents
Obtain consistent structure replace-ment values by set-ting standards for insurance compa-nies or purchasing commercial data
LOW effort to ob-tain accurate structure re-placement values
Accurate and consistent struc-ture replacement values
Same as incre-mental change
Same as incre-mental change
Same as incre-mental change
Performance Credit levees and other flood protection measures with reducing risk from the 1 per-cent annual chance exceed-ance and more frequent events if the levee meets NFIP standards; ig-nore other lev-
Credit levees with providing full or par-tial protection, as determined with expanded applica-tion of LAMP for events more fre-quent than 1 per-cent annual chance exceedance
LOW effort to col-lect additional da-ta on the perfor-mance of certified levees; HIGH ef-fort to collect data on levees that have not been certified MEDIUM effort to adjust the LAMP analysis proce-dure and the av-
Additional infor-mation on levee performance for events more fre-quent and less frequent than the 1 percent annual chance exceed-ance flood
Use fragility functions to de-scribe the per-formance of and uncertainty of all flood protection measures, at-tributing risk re-duction as ap-propriate
HIGH effort to develop fragility functions for all flood protection measures affect-ing insured properties HIGH effort to adjust risk anal-ysis procedures to include those fragility functions
Additional infor-mation on the performance of flood protection measures, includ-ing results of ge-otechnical engi-neering explora-tions and anal-yses
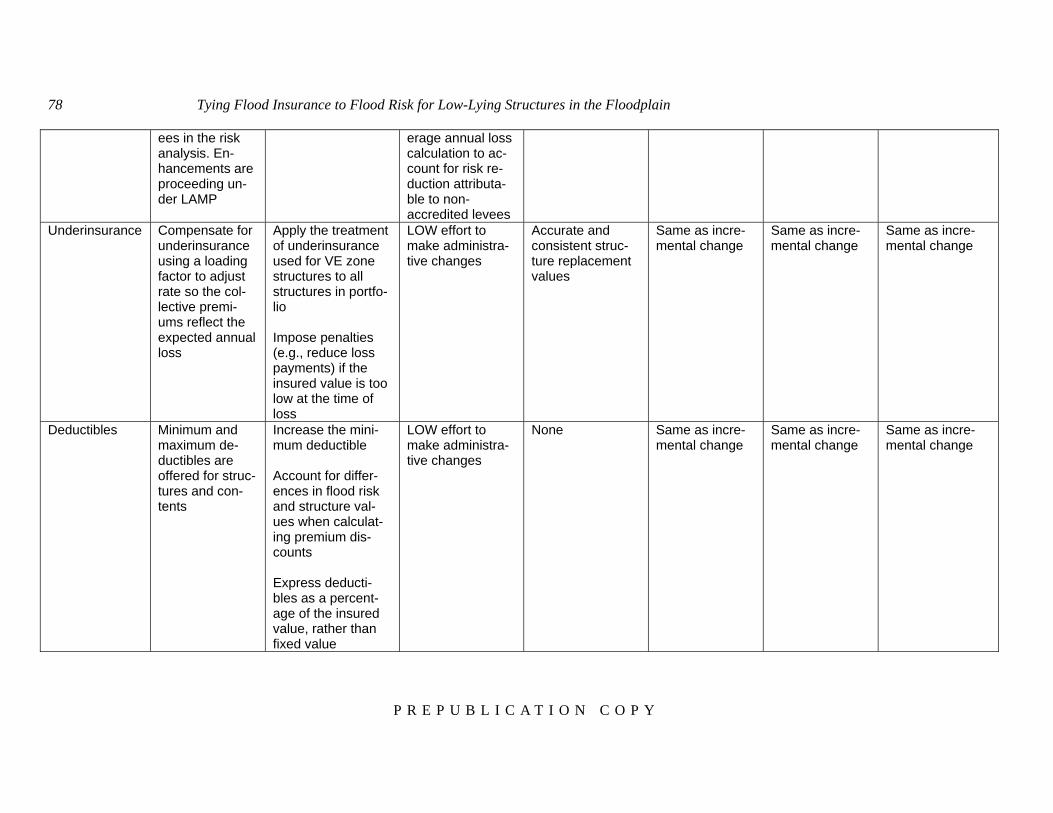
78 Tying Flood Insurance to Flood Risk for Low-Lying Structures in the Floodplain
P R E P U B L I C A T I O N C O P Y
ees in the risk analysis. En-hancements are proceeding un-der LAMP
erage annual loss calculation to ac-count for risk re-duction attributa-ble to non-accredited levees
Underinsurance Compensate for underinsurance using a loading factor to adjust rate so the col-lective premi-ums reflect the expected annual loss
Apply the treatment of underinsurance used for VE zone structures to all structures in portfo-lio Impose penalties (e.g., reduce loss payments) if the insured value is too low at the time of loss
LOW effort to make administra-tive changes
Accurate and consistent struc-ture replacement values
Same as incre-mental change
Same as incre-mental change
Same as incre-mental change
Deductibles Minimum and maximum de-ductibles are offered for struc-tures and con-tents
Increase the mini-mum deductible Account for differ-ences in flood risk and structure val-ues when calculat-ing premium dis-counts Express deducti-bles as a percent-age of the insured value, rather than fixed value
LOW effort to make administra-tive changes
None Same as incre-mental change
Same as incre-mental change
Same as incre-mental change
Alternative Approaches and Implementation 79
P R E P U B L I C A T I O N C O P Y
a A low level of effort means that existing resources can be reapplied to make the change (e.g., a few person months). Medium effort means that existing resources plus some addi-tional resources would be required to make the change (e.g., a few person years). High effort means that substantial new resources would be required to make the change (e.g., a person decade).


81 P R E P U B L I C A T I O N C O P Y
References AIR (American Institutes for Research). 2005. A Chronology of Major Events Affecting the National
Flood Insurance Program. The American Institutes for Research. 86 pp. Available at https://www.fema.gov/media-library/assets/documents/9612?id=2601.
Brunner, G.W. 2014. Combined 1D and 2D Modeling with HEC-RAS. Hydraulic Engineering Center, U.S. Army Corps of Engineers, 130 pp. Available at http://www.hec.usace.army.mil/misc/files/ras/Combined_1D_and_2D_Modeling_with_HEC-RAS.pdf.
CDWR (California Department of Water Resources) and USACE (U.S. Army Corps of Engineers). 2013. California’s Flood Future: Recommendations for Managing the State’s Flood Risk, p. G-7. Available at http://www.water.ca.gov/sfmp/resources/Attachment_G_Risk_Information.pdf.
Cutler, D., and R. Zeckhauser. 2004. Extending the Theory to Meet the Practice of Insurance. Washington, DC: The Brookings Institute. Available at http://scholar.harvard.edu/files/cutler/files/cutler_zeckhauser_theory_and_practice_of_insurance.pdf.
Czajkowski, J., H. Kunreuther, and E. Michel-Kerjan. 2013. Catastrophe model based quantification of riverine and storm surge flood risk in Texas. Working Paper # 2013-01, The Wharton School Risk Management and Decision Processes Center. Available at http://opim.wharton.upenn.edu/risk/library/WP201301_JC-HK-EMK_CatModelQuant.pdf.
Dewberry. 2005. Final Report: Evaluation of Alternatives in Obtaining Structural Elevation Data. 136 pp. Available at http://www.fema.gov/media-library-data/20130726-1752-25045-6052/elevations_final.pdf.
Dewberry. 2011. Final report of the National Enhanced Elevation Assessment (revised 2012). Fairfax, VA: Dewberry, 84 pp. plus appendixes. Available at http://www.dewberry.com/services/geospatial/national-enhanced-elevation-assessment.
Eldred, G.W. 1980. How wisely do consumers select their property and liability insurance coverages? Journal of Consumer Affairs 14:288-306.
FEMA (Federal Emergency Management Agency). 1998. Managing Floodplain Development Through the National Flood Insurance Program. Prepared by French & Associates, Ltd. Available at http://www.fema.gov/media-library/assets/documents/6029.
FEMA. 2003. National Flood Insurance Program Actuarial Information System, Report 2, Credibility and Weighting. Pp. A15-A22.
FEMA. 2004. Floodplain Management Bulletin: Elevation Certificate. FEMA 467-1. Available at http://www.fema.gov/media-library-data/20130726-1511-20490-9287/fema467-6-10-04.pdf.
82 Tying Flood Insurance to Flood Risk for Low-Lying Structures in the Floodplain
P R E P U B L I C A T I O N C O P Y
FEMA. 2006. Flood Insurance Study for Fayette County, Texas, and Incorporated Areas. Study number 48149CV000A. Available at https://msc.fema.gov/portal.
FEMA. 2009. Flood Insurance Study for Suffolk County, New York (all Jurisdictions). Study number 36103CV000A. Available at https://msc.fema.gov/portal.
FEMA. 2011. Carrying Out Floodplain Management in Your Locality. Available from http://www.ncfloodmaps.com/pubdocs/cfm_home_study/cfm_home_study_course.pdf.
FEMA. 2012. Flood Insurance Study for Boulder County, Colorado, and Incorporated Areas. Study number 08013CV001B. Available at https://msc.fema.gov/portal.
FEMA. 2013a. Analysis and Mapping Procedures for Non-Accredited Levee Systems: New Approach. Available at http://www.fema.gov/media-library/assets/documents/33587?id=7841.
FEMA. 2013b. National Flood Insurance Program: Flood Insurance Manual. Available at http://www.fema.gov/media-library/assets/documents/34745.
FEMA. 2013c. National Flood Insurance Program: Specific Rating Guidelines. Available at http://www.fema.gov/media-library/assets/documents/34620.
FEMA. 2013d. Technical Documentation of NFIP Actuarial Assumptions and Methods Supporting Rates Effective October 1, 2013. Available at http://www.fema.gov/media-library/assets/documents/34620.
FEMA. 2014. Guidance for Flood Risk Analysis and Mapping: Flood Depth and Analysis Grids. Available at http://www.fema.gov/media-library-data/1406747117357-744b6bd203c18ada4806ad4e90c18b81/Flood_Depth_and_Analysis_Grids_Guidance_May_2014.pdf.
FEMA. 2015. Reducing Losses through Higher Regulatory Standards: Best Practices and Cost-Effective Strategies Report. FEMA-DR-4145-CO. Available at http://www.fema.gov/media-library-data/1429759809776-2d0be16f764d0e704aff1f7664334ba0/FEMA_CO_BestPractices_Strategies.pdf.
Fritz, H.M., C. Blount, R. Sokoloski, J. Singleton, A. Fuggle, B.G. McAdoo, A. Moore, C. Grass, and B. Tate. 2007. Hurricane Katrina storm surge distribution and field observations on the Mississippi Barrier Islands. Estuarine, Coastal and Shelf Science 74(1-2):12-20.
Galloway, G.E., G.B. Baecher, D. Plasencia, K.G. Coulton, J. Louthain, M. Bagha, and A.R. Levy. 2006. Assessing the Adequacy of the National Flood Insurance Program’s 1 Percent Flood Standard. College Park, Md: American Institutes for Research, 197 pp. Available at http://www.fema.gov/media-library/assets/documents/9594.
GAO (Government Accountability Office). 2008. Flood Insurance. FEMA’s Rate-Setting Process Warrants Attention. GAO-09-12. Washington, DC: GAO, 49 pp.
GAO. 2014. Overview of GAO’s Past Work on the National Flood Insurance Program. GAO-14-297R. Washington, DC: GAO, 59 pp.
GFDRR (Global Facility for Disaster Reduction and Recovery). 2009. Economic Vulnerability and Disaster Risk Assessment in Malawi and Mozambique: Measuring Economic Risks of Droughts and Floods, 12 pp. Available at https://www.gfdrr.org/sites/gfdrr/files/publication/GFDRR_Econ._Vulnerability_DRR_Malawi-Mozambique.pdf.
Grossi, P., and H. Kunreuther, eds. 2005. Catastrophe Modeling: A New Approach to Managing Risk. Huebner International Series on Risk, Insurance and Economic Security, Vol. 25. Springer, 252 pp.
Hayes, T.L., and D.A. Neal. 2011. Actuarial Rate Review, in Support of the Recommended October 1, 2011, Rate and Rule Changes. Washington, DC: FEMA, 39 pp. Available at http://www.fema.gov/media-library/assets/documents/23143.
HUD (U.S. Department of Housing and Urban Development). 1966. Insurance and Other Programs for Financial Assistance to Flood Victims. A Report from the Secretary of the Department of Housing

References 83
P R E P U B L I C A T I O N C O P Y
and Urban Development, as Required by the Southeast Hurricane Disaster Relief Act of 1965 (Public Law 89-339, 89th Congress, H.R. 11539, November 8, 1965), August 1966, 134 pp.
IPCC (Intergovernmental Panel on Climate Change). 2012. Managing the Risks of Extreme Events and Disasters to Advance Climate Change Adaptation. A Special Report of Working Groups I and II of the Intergovernmental Panel on Climate Change, C.B. Field, V. Barros, T.F. Stocker, D. Qin, D.J. Dokken, K.L. Ebi, M.D. Mastrandrea, K.J. Mach, G.-K. Plattner, S.K. Allen, M. Tignor, and P.M. Midgley, eds. Cambridge, UK: Cambridge University Press, 582 pp.
IPET (Interagency Performance Evaluation Task Force). 2009. Performance Evaluation of the New Orleans and Southeast Louisiana Hurricane Protection System: Final Report of the Interagency Performance Evaluation Task Force. Available at https://ipet.wes.army.mil/.
Kunreuther, H. 1984. Causes of underinsurance against natural disasters. The Geneva Papers on Risk and Insurance 9(31):206-220.
MacFadyen, D.J. 1974. Flood insurance rate calculation computer program. Letter to Sam Brugger, Federal Insurance Administration. Washington, DC.
Mathewson, S.B., P. Causgrove, A. Kurtov, and S. Frankowiak. 2011. The National Flood Insurance Program: Past, Present . . . and Future?. Washington, DC: American Academy of Actuaries, 51 pp.
McBean, E., J. Gorrie, M. Fortin, J. Ding, and R. Moulton. 1988. Flood depth—damage curves by interview survey. Journal of Water Resources Planning and Management 114(6):613-634.
Melillo, J.M., T.C. Richmond, and G.W. Yohe, eds. 2014. Climate Change Impacts in the United States: The Third National Climate Assessment. Washington, DC. U.S. Global Change Research Program, 841 pp.
Michel-Kerjan, E. 2010. Catastrophe economics: The National Flood Insurance Program. Journal of Economic Perspectives 24(4):165-86.
Michel-Kerjan, E.O., and C. Kousky. 2010. Come rain or shine: Evidence on flood insurance purchases in Florida. Journal of Risk and Insurance 77(2):369–397.
Michel-Kerjan, E., S. Lemoyne de Forges, and H. Kunreuther. 2012. Policy tenure under the U.S. National Flood Insurance Program (NFIP). Risk Analysis 32(4):644-658.
Michel-Kerjan, E., J. Czajkowski, and H. Kunreuther. 2015. Can Flood Insurance Be Privatized in the United States? A Primer. The Geneva Papers on Risk and Insurance - Issues and Practice 40(2):179-208.
Miller, S., R. Muir-Wood, and A. Boissonnade. 2008. An exploration of trends in normalized weather-related catastrophe losses. Pp. 225-247 in Climate Extremes and Society, H.F. Diaz and R.J. Murnane, eds. Cambridge, UK, Cambridge University Press.
NRC (National Research Council). 2009. Mapping the Zone: Improving Flood Map Accuracy. Washington, DC: The National Academies Press, 122 pp.
NRC. 2012. Sea-Level Rise for the Coasts of California, Oregon, and Washington: Past, Present, and Future. Washington, DC: The National Academies Press, 201 pp.
NRC. 2013. Levees and the National Flood Insurance Program: Improving Policies and Practices. Washington, DC: The National Academies Press, 258 pp.
NRC. 2015. Affordability of National Flood Insurance Program Premiums—Report 1. Washington, DC: The National Academies Press, in press.
Pasterick, E. 1998. The National Flood Insurance Program. Chapter 6 in Paying the Price: The Status and Role of Insurance Against Natural Disasters in the United States, H. Kunreuther and R.J. Roth, eds. Washington, DC: Joseph Henry Press.
PWC (PriceWaterhouseCoopers). 1999. Study of the Economic Effects of Charging Actuarially Based Premium Rates for Pre-FIRM Structures. 310 pp.
84 Tying Flood Insurance to Flood Risk for Low-Lying Structures in the Floodplain
P R E P U B L I C A T I O N C O P Y
Scawthorn, C., P. Flores, N. Blais, H. Seligson, E. Tate, S. Chang, E. Mifflin, W. Thomas, J. Murphy, C. Jones, and M. Lawrence. 2006. HAZUS-MH flood loss estimation methodology. II. Damage and loss assessment. Natural Hazards Review May:72-81.
Stromberg, D. 2007. Natural disasters, economic development, and humanitarian aid. Journal of Economic Perspectives 21(5):199-222.
Sydnor, J. 2006. Abundant Aversion to Moderate Risk: Evidence from Homeowners Insurance (mimeo). Berkeley, CA: University of California.
Thieken, A.H., M. Müller, H. Kkreibich, B. Merz. 2005. Flood damage and influencing factors: New insights from the August 2002 flood in Germany. Water Resources Research 41, W12430, doi:10.1029/2005WR004177.
Traver, R., C. Andersen, B. Edge, D. Fowler, G. Calloway, Jr., R.B. Gilbert, C. Haddock, L.E. Link, J. Moyle, L. Roth, P.K. Whitlock, J. Ludy, J. Durrant, and B. Whitten. 2014. Flood risk management: The need for sound policies and practices. Civil Engineering 84(4):48-57.
URS/JBA (URS Corporation/Jack R. Benjamin & Associates, Inc.). 2008. Delta Risk Management Strategy (DRMS), Phase 1, Risk Analysis Report (Draft). Sacramento, CA: California Department of Water Resources.
USACE (U.S. Army Corps of Engineers). 1995. Procedural guidelines for estimating residential and business structure value for use in flood damage estimations. IWR report 95-R-9. Alexandria, VA: USACE Institute for Water Resources.
USACE. 1996. Risk-Based Analysis for Flood Damage Reduction Studies. EM 1110-2-1619. Washington, DC: USACE.
USACE. 2000. Economic Guidance Memorandum (EGM) 01-03, Generic Depth-Damage Relationships. Washington, DC: USACE, 11 pp.
USACE. 2003. Economic Guidance Memorandum (EGM) 04-01, Generic Depth-Damage Relationships for Residential Structures with Basements. Washington, DC: USACE, 17 pp.
USACE. 2015. North Atlantic Coast Comprehensive Study: Resilient Adaptation to Increasing Risk. Final Report. Available at http://www.nad.usace.army.mil/compstudy.
USACE and FEMA. 2013. Flood Protection Structure Accreditation Task Force: Final Report. 62 pp. Available at http://www.usace.army.mil/Portals/2/docs/civilworks/levee/FINAL_FPSATaskForceReport.pdf.
85 P R E P U B L I C A T I O N C O P Y
Appendix A
Biographical Sketches of Committee Members David T. Ford, chair, is president of David Ford Consulting Engineers in Sacramento, California. Dr. Ford is an internationally recognized expert in hydrologic, hydraulic, and water resources engineering, and flood and floodplain management. He has more than 35 years of project management experience, including 23 as owner and president of David Ford Consulting Engineers, Inc., and 12 as a senior hy-draulic engineer at the U.S. Army Corps of Engineers’ (USACE’s) Hydrologic Engineering Center. He has served as a consultant to the USACE, the National Weather Service, U.S. Agency for International Development, state government agencies, the United Nations, the World Bank, and engineering firms worldwide. He has prior NRC committee experience, most recently with the Committee on Levees and the National Flood Insurance Program. He has served on the faculty of the University of California and California State University. Dr. Ford received his B.S., M.S., and Ph.D. degrees in civil engineering from the University of Texas. He is a registered professional engineer in 12 states. Ross B. Corotis is the Denver Business Challenge Professor of Engineering at the University of Colo-rado, and former dean of the College of Engineering and Applied Science. With a background in struc-tural mechanics, Dr. Corotis’ primary research interests are in the application of probabilistic concepts to civil engineering problems, where he has expanded traditional studies of structural reliability into risk and decision modeling for the built environment. He has expanded reliability approaches to esti-mate seismic risk loss and prioritize mitigation, developed generalized methods of uncertainty to evalu-ate risk and reliability, and created regional decision models based on disaster data. Recent completed projects include a comparison of the differing damages in Haiti, Chile, and New Zealand after similar earthquakes; risk communication for seismic retrofit; and the development of a risk-based decision methodology for transportation facility design. Dr. Corotis is a member of the National Academy of Engineering. He received his B.S., M.S., and Ph.D., all in civil engineering, from the Massachusetts Institute of Technology, and is a registered professional engineer and structural engineer. Wei Du is principal scientist and chief hydrologist at CoreLogic Spatial Solutions, where he has led research on flood risk and hazards and development of methods and analytic tools. He has more than 25 years of experience in hydrologic engineering, hazard risk assessment, and geospatial technology. During the past decade, he led a consulting team to work with the Federal Emergency Management Agency (FEMA) on many flood hazard-related projects (including FEMA Map Modernization and
86 Tying Flood Insurance to Flood Risk for Low-Lying Structures in the Floodplain
P R E P U B L I C A T I O N C O P Y
RiskMap) and on the production of Flood Insurance Rate Maps. He has developed analytical tools on classifying hazard risk and conducted research on flood risk associated with riverine flooding, coastal storm surge, flash flooding, and basement and sewer backup flooding. Under his leadership, CoreLogic has created the most detailed national hydrologic datasets available, including the national multiple di-rection flow accumulation dataset, the national catchment slope dataset, and the national flood elevation surface dataset. Working closely with Swiss Re, Dr. Du has provided catastrophic flood loss analyses for many insurance clients. He has a B.S. in hydrologic engineering, an M.S. in hydrologic and envi-ronmental science, and a Ph.D. in geography from Clark University. Clive Q. Goodwin is assistant vice president and manager for natural hazard peril underwriting at FM Global Insurance Company. In this position, he manages worldwide underwriting of wind, flood, and collapse perils. The work capitalizes on FM Global’s engineering knowledge of these hazards to im-prove clients’ knowledge of risk and their insurance terms and conditions. Recently, Mr. Goodwin rep-resented FM Global in a collaboration with the USACE, FEMA, and other agencies to highlight con-cerns about the aging inventory of levees and the importance of changing U.S. policy on levee risk. He is a chartered engineer, a member of the Institution of Mechanical Engineers, and a former member of the Industry Leaders Council of the American Society of Civil Engineers. Mr. Goodwin holds a B.S. in mechanical engineering and metallurgy from the University of Manchester, U.K., and a Certified Di-ploma in accounting and finance. Larry Larson is director emeritus and senior policy advisor for the Association of State Floodplain Managers (ASFPM), where he coordinates national flood and water resources policy development with state and federal agencies, the Administration, and other policy groups and organizations. His 50+ year career has been devoted to flood hazard and water resources management. He is the co-developer of ASFPM’s No Adverse Impact approach to community development and has authored numerous white papers and articles. For decades, Mr. Larson has been a leader in developing national policy on the wise and sustainable use of floodplains. Prior to joining ASFPM, he spent 30 years with the Wisconsin De-partment of Natural Resources managing flood loss reduction, dam safety, wetlands, and other pro-grams, and 5 years with the California Department of Water Resources on the design and construction of large dams, aqueducts, and other water projects. Mr. Larson holds a B.S. in civil engineering from the University of Wisconsin and is a registered professional engineer in Wisconsin and California. Howard Leikin is retired after decades with the Federal Insurance Administration and FEMA. He served as chief actuary at FEMA beginning in 1994. In 1999, he was appointed deputy federal insur-ance administrator, providing executive leadership and direction for the insurance and floodplain man-agement aspects of the National Flood Insurance Program (NFIP). He also coordinated insurance mar-keting, communication, and outreach strategies to reduce losses from flooding and other perils. In 2003, Mr. Leikin transferred to the Department of the Treasury, where he served as the deputy director for the newly enacted Terrorism Risk Insurance Program. His responsibilities included establishing a frame-work for the program, developing policies and procedures for administering claims and for sharing losses among the federal and private sectors, and developing program regulations. He was detailed back to FEMA for 5 months in 2005 to assist with policy and implementation of the NFIP in the after-math of Hurricane Katrina. Mr. Leikin holds a B.S. in applied mathematics from SUNY Stony Brook,
Appendix A 87
P R E P U B L I C A T I O N C O P Y
and an M.S. in operations research from George Washington University, and he was designated an as-sociate in risk management by the Insurance Institute of America. Martin W. McCann is president of Jack R. Benjamin and Associates, Inc., and is also a consulting professor of civil and environmental engineering at Stanford University. At Stanford, he is a former chair of the National Performance of Dams Program, which created a national network to report dam safety incidents and to archive this information for use by the geotechnical and seismic engineering communities. Dr. McCann’s professional background and research have focused on probabilistic haz-ards analysis, including hydrologic events, risk assessment, reliability and uncertainty analysis, and sys-tems analysis. He has been a consultant to several government and private sector groups in the United States and abroad, and he has served on three NRC committees, including the Committee on Integrat-ing Dam and Levee Safety and Community Resilience. Dr. McCann received a B.S. from Villanova University and an M.S. and Ph.D. from Stanford University. Laura A. McLay is an associate professor of industrial and systems engineering at the University of Wisconsin, Madison. Her research interests are in the field of operations research, with a particular fo-cus on discrete optimization with application to homeland security and emergency response problems. She has authored or co-authored more than 40 publications in archival journals and refereed proceed-ings. Her research has been awarded several honors, including a National Science Foundation CA-REER Award, a Young Investigator Award from the Army Research Office, and four best paper awards. Dr. McLay has recently served as president of Women in Operations Research and the Man-agement Sciences, a forum of the Institute for Operations Research and the Management Sciences (IN-FORMS), and president of the INFORMS Section on Public Sector Operations Research. She is a de-partment editor for IIE Transactions, and an associate editor for Risk Analysis and International Trans-actions on Operational Research. She received a B.S. and M.S. in general engineering, and a Ph.D. in industrial engineering, all from the University of Illinois at Urbana-Champaign. Erwann Michel-Kerjan is the executive director of the Wharton Risk Management and Decision Pro-cesses Center at the Wharton School of the University of Pennsylvania. His research focuses on natural and manmade catastrophe risk management and disaster financing to strengthen resilience through business and policy innovation. Dr. Michel-Kerjan has published more than 100 journal articles on these topics and has (co)authored several books, including Treatise on New Risks (Gallimard), Seeds of Disaster, Roots of Response: How Private Action Can Reduce Public Vulnerability (Cambridge Uni-versity Press), The Irrational Economist: Making Decisions in a Dangerous World (Public Affairs), Leadership Dispatches (Stanford University Press), and At War with the Weather (MIT Press), which received the prestigious Kulp-Wright award for the most influential book on risk management. He ad-vises several heads of state and government agencies, businesses, and international organizations on risk management and has testified on several occasions before the U.S. Congress. He also serves on the board of the World Economic Forum initiative, which publishes the Global Risks Report every year, and chairs the Organisation for Economic Cooperation and Development Secretary-General Board on Financial Management of Catastrophes, which advises the 34 member countries on these issues. Dr. Michel-Kerjan studied mathematics, physics and finance at Ecole Polytechnique (France), McGill (Canada), and Harvard.
88 Tying Flood Insurance to Flood Risk for Low-Lying Structures in the Floodplain
P R E P U B L I C A T I O N C O P Y
Lindene Patton is Global Head of Hazard Product Development at CoreLogic. Previously, she was chief climate product officer for Zurich Insurance Group, where she was responsible for policy and risk management related to climate change. Her research focuses on how risk management systems are af-fected by natural catastrophes, and on alternative financing models that reflect actual exposure as well as future climate change. She is a member of the World Economic Forum’s Global Advisory Council on Measuring Sustainability and Advisory Board on Sustainability and Competitiveness. Ms. Patton serves on numerous government and non-governmental advisory boards, including the Executive Sec-retariat of the U.S. National Climate Assessment Development and Advisory Committee. She recently coauthored the book Climate Change and Insurance (2012). She is an attorney licensed in California and the District of Columbia and an American Board of Industrial Hygiene Certified Industrial Hygien-ist. She holds a B.S. in biochemistry from the University of California, Davis, a master’s of public health from the University of California, Berkeley, and a J.D. from Santa Clara University School of Law. Patricia Templeton-Jones is chief operating officer of Wright National Flood Insurance Company, the largest provider of flood insurance in Florida and the United States. She is the current president of the Flood Insurance Servicing Companies Association of America and a member of the Write Your Own (WYO) Coalition. The Write Your Own Program of the NFIP allows participating property and casual-ty insurance companies to write and service the standard flood insurance policy in their own names. Ms. Templeton-Jones recently served as NFIP flood coordinator for Wright Flood, and chaired the In-stitute for Business and Home Safety and The WYO Marketing Committee. With more than 25 years of experience in the insurance industry, she is an outspoken advocate of the flood insurance program and of education about flood insurance. Susan E. Voss is vice president/general counsel for American Enterprise Group, Inc. an insurance company specializing in health care insurance products and services. Prior to beginning her work at American Enterprise Group in November 2013, she was a consultant in the areas of life insurance and annuity regulation. From 2005 to 2013, she was the Iowa Insurance Commissioner, where she led ef-forts to coordinate work with state and federal emergency management teams to assist Iowans with flood-related property issues, including mitigation of homeowner damage and flood insurance issues. An integral member of the Iowa Insurance Division, she assisted on an “after action plan” committee formed by Governor Branstadin 1993, which made recommendations on risk mitigation, insurance ed-ucation and outreach, and state emergency management plans. She provided similar leadership services following the Iowa floods of 2008. She was a representative of the state of Iowa as well as president of the National Association of Insurance Commissioners. Ms. Voss has also represented the United States and Iowa in meetings with foreign regulators and officials regarding insurance operations in China, South Korea, Chile, Ecuador, and Germany. She received her B.A. from Simpson College and her J.D. from the Gonzaga University School of Law.
89 P R E P U B L I C A T I O N C O P Y
Appendix B
Glossary 1 percent annual chance [exceedance] flood—A flood that has a 1 percent chance of being equaled or exceeded in any given year; also known as the “100-year flood” or “base flood” (http://www.fema.gov/national-flood-insurance-program/definitions) Average annual loss—Expected long-term loss, which is obtained by multiplying the probabil-ity of an event by its expected loss and summing over all possible events (GFDRR, 2009) Base flood elevation (BFE)—The elevation of surface water resulting from a flood that has a 1 percent chance of being equaled or exceeded in any given year (http://www.fema.gov/national-flood-insurance-program/definitions) Catastrophe model—A computer-based model that estimates losses from natural or manmade hazards, such as earthquakes, floods, hurricanes, and acts of terrorism (Grossi and Kunreuther, 2005) Credibility weighting—A statistical analysis that combines theoretical damage with observed damage results. When sufficient claims exist to provide statistical confidence in observed results, the depth–damage relationship is based on the claims data. When claims data are insufficient, the claims data and theoretical damage are combined using a weighting process (http://www.fema.gov/media-library-data/20130726-1748-25045-4777/hazusmr5_fl_tm.pdf) DED—A term in the NFIP actuarial rate formula to eliminate that portion of the loss that will be borne by the policyholder through his or her deductible (FEMA, 2013d) DELV—A term in the NFIP actuarial rate formula that estimates damage to the property, ex-pressed as a percentage of the total property (replacement) value, resulting from a specified depth of water (FEMA, 2013d) Depth grid—A grid is a digital raster dataset that defines geographic space as an array of equal-ly sized square cells arranged in rows and columns. The value in each cell represents the magni-
90 Tying Flood Insurance to Flood Risk for Low-Lying Structures in the Floodplain
P R E P U B L I C A T I O N C O P Y
tude in that location of the flood depth represented by that particular grid (http://www.fema.gov/media-library-data/1406747117357-744b6bd203c18ada4806ad4e90c18b81/Flood_Depth_and_Analysis_Grids_Guidance_May_2014.pdf) Detailed studies—Flood hazard mapping studies that are done use hydrologic and hydraulic methods that produce base flood elevations, floodways, and other pertinent flood data (https://www.fema.gov/pdf/floodplain/nfip_sg_appendix_d.pdf) Elevation Certificate—A certificate that verifies the elevation data of a structure on a given property relative to the ground level. It is used by local communities and builders to ensure com-pliance with local floodplain management ordinances and is also used by insurance agents and companies in the rating of flood insurance policies (https://www.floodsmart.gov/floodsmart/pages/glossary_A-I.jsp) Exceedance probability—Probability that a random event will exceed a specified magnitude in a given time period, usually 1 year unless otherwise indicated (http://www.fema.gov/media-library-data/20130726-1553-20490-8579/dl_flow_app2.pdf) EXLOSS (expected loss ratio)—A term in the NFIP actuarial rate formula, which serves as a loading factor for underwriting expenses, a contingency factor, and other factors (FEMA, 2013d) Exposure—The number of people and value of property that might be harmed by inundation (CDWR and USACE, 2013) Flood depth—Height of flood waters above the surface of the ground at a given point (http://www.fema.gov/pdf/fima/pbuffd_appendix_b.pdf) Flood duration—Amount of time between the initial rise of flood waters and their recession (http://www.fema.gov/pdf/fima/pbuffd_appendix_b.pdf) Flood elevation—Height of flood waters above an elevation datum plane (also called water sur-face elevation; http://www.fema.gov/pdf/fima/pbuffd_appendix_b.pdf) Flood hazard—Frequency of occurrence of excess water (large flow rates, high stages, or both) at a location. Commonly, this is represented with flow- or stage-frequency relationships (how severe and how often floods occur) at specific locations (CDWR and USACE, 2013) Flood Insurance Rate Map (FIRM)—The official map of a community prepared by FEMA that shows the Special Flood Hazard Areas, the base flood elevations, and the flood risk zones applicable to the community. The following designations are made for insurance rating purposes:
Appendix B 91
P R E P U B L I C A T I O N C O P Y
Post-FIRM building—A building constructed or substantially improved after December 31, 1974, or after the effective date of the initial Flood Insurance Rate Map of a community, whichever is later
Pre-FIRM building—A building constructed or substantially improved on or before De-cember 31, 1974, or before the effective date of the initial Flood Insurance Rate Map of the community, whichever is later (http://www.fema.gov/national-flood-insurance-program/definitions) Flood protection measure—Those physical works for which funds have been authorized, ap-propriated, and expended and which have been constructed specifically to modify flooding in order to reduce the extent of the area subject to a “special flood hazard” and the extent of the depths of the associated flooding. These systems typically include hurricane tidal barriers, dams, reservoirs, levees, or dikes (http://www.fema.gov/media-library-data/20130726-1922-25045-4455/20130703_approachdocument_508.pdf) Flood risk—Risk is the potential for an unwanted outcome. The flood risk to economic activity is the chance that individuals will lose property due to flooding. The risk is measured by eco-nomic metrics, such as direct and indirect costs (Traver et al., 2014) Floodplain—Any land area susceptible to being inundated by flood waters from any source (http://www.fema.gov/national-flood-insurance-program/definitions) Fragility curve (or function)—Describes the likelihood of flooding due to a levee breach, given the loading on the water side of the levee (CDWR and USACE, 2013) Full-risk premium rate—A rate charged to a group of policies that results in aggregate premi-ums sufficient to pay anticipated losses and expenses for that group; also referred to as an actuar-ial rate (http://www.fema.gov/national-flood-insurance-program/definitions) LADJ—A factor in the NFIP actuarial rate formula to account for loss adjustment expenses (FEMA, 2013d) Lidar (light detection and ranging)—A remote sensing method that uses light in the form of a pulsed laser to measure ranges (variable distances) to Earth. These light pulses—combined with other data recorded by the airborne system—generate precise, three-dimensional information about the shape of Earth and its surface characteristics. Lidar terrain data are used in hydraulic models of the floodplain (http://oceanservice.noaa.gov/facts/lidar.html) Lowest floor—The lowest floor of the lowest enclosed area (including basement) of a building (http://www.fema.gov/national-flood-insurance-program/definitions#L) Negatively elevated structure—A structure in the Special Flood Hazard Area with the lowest floor elevation below the base flood elevation
92 Tying Flood Insurance to Flood Risk for Low-Lying Structures in the Floodplain
P R E P U B L I C A T I O N C O P Y
PELV—A term in the NFIP actuarial rate formula that estimates the annual probability that flood waters will reach or exceed a given depth relative to the base flood elevation (FEMA, 2013d) Performance—The effectiveness of flood or floodplain management measures (CDWR and USACE, 2013) Replacement value—The current cost of a similar new item having the closest usage to the item being replaced. The item does not need to be replaced with an exact replica including all the item’s deficiencies, superadequacies, or obsolescence (USACE, 1995) Special Flood Hazard Area—Portion of the floodplain subject to inundation by a 1 percent an-nual chance [exceedance] flood (http://www.fema.gov/pdf/fima/pbuffd_appendix_b.pdf) Subsidized premium rate—A rate charged to a group of policies that results in aggregate pre-miums insufficient to pay anticipated losses and expenses for that group (http://www.fema.gov/national-flood-insurance-program/definitions) UNIS—A term in the NFIP actuarial rate formula to adjust for how much policyholders have underinsured their property (FEMA, 2013d) Vulnerability—The susceptibility of people and property to be harmed from the hazard (i.e., how flooding adversely affects people and property; CDWR and USACE, 2013) Zone—A geographical area shown on a Flood Hazard Boundary Map or a Flood Insurance Rate Map that reflects the severity or type of flooding in the area (http://www.fema.gov/national-flood-insurance-program/definitions)
93 P R E P U B L I C A T I O N C O P Y
Appendix C
Acronyms and Abbreviations BFE base flood elevation FEMA Federal Emergency Management Agency FIRM Flood Insurance Rate Map LAMP Levee Analysis and Mapping Procedure NFIP National Flood Insurance Program USACE U.S. Army Corps of Engineers