preparing for the health and long- term care costs of an...
TRANSCRIPT
Financing the retirement needs of an ageing population. The 19th Annual Colloquium of Superannuation Researchers
Centre for Pensions and Superannuation
UNSW on 14-15th July 2011.
Susan St John and Claire Dale
Preparing for the health and long-
term care costs of an ageing
population in New Zealand
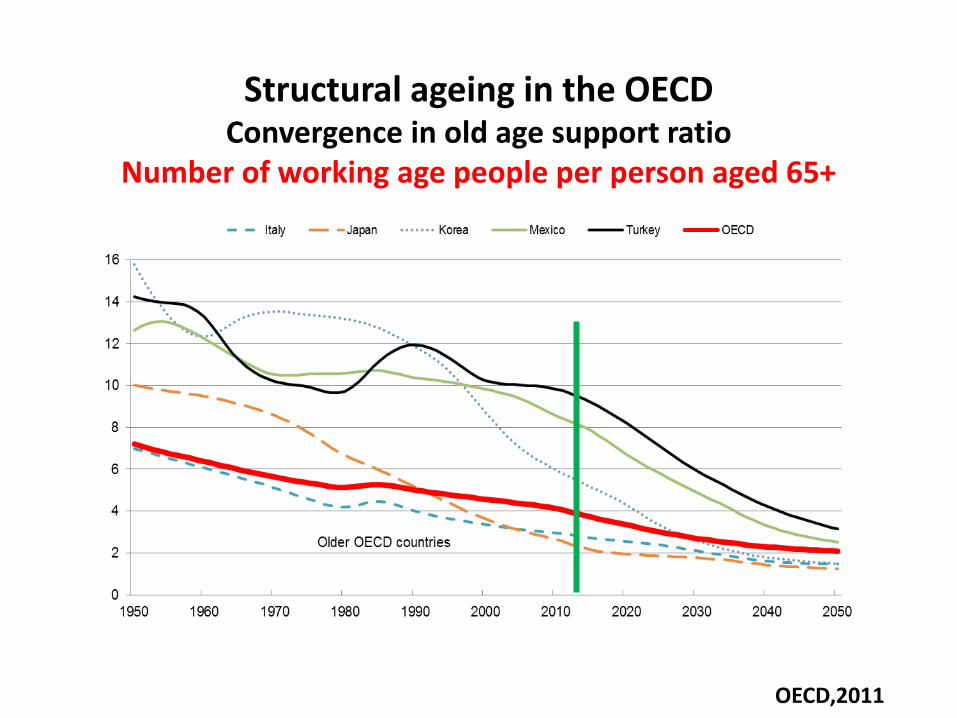
Structural ageing in the OECD Convergence in old age support ratio
Number of working age people per person aged 65+
OECD,2011
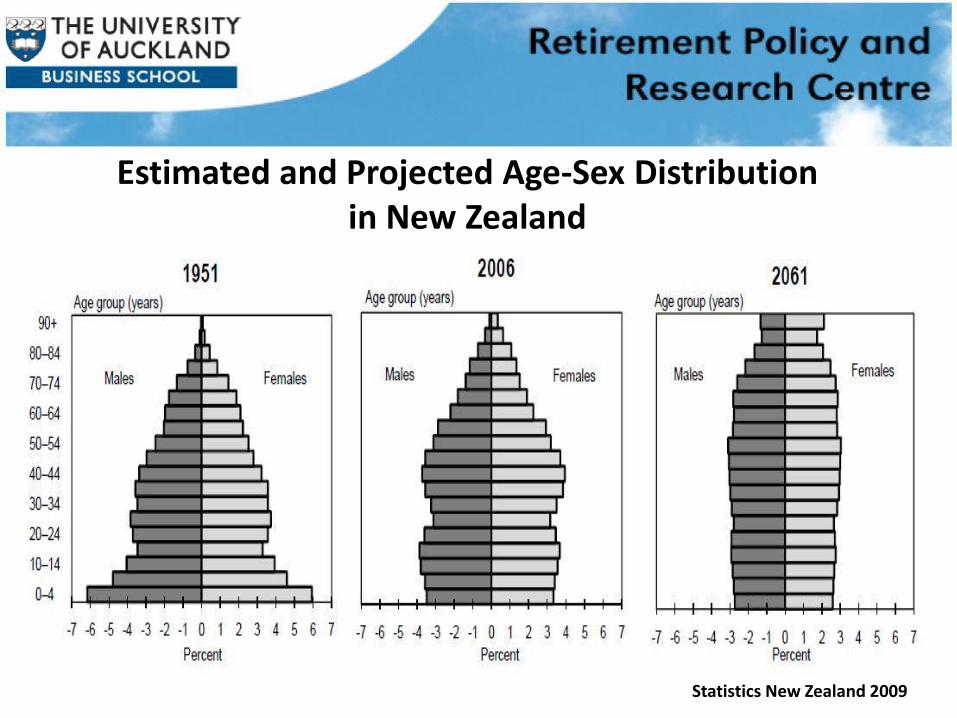
Estimated and Projected Age-Sex Distribution in New Zealand
Statistics New Zealand 2009

“New Zealand’s ageing is not the conventional kind: migration is contributing to it, not mitigating it; baby-boomers may live longer than the ‘average’ estimates Treasury and the Department of Statistics currently use for their projections; and a consequence of having the longest and deepest ‘baby-boom’ will be the most profound numerical ageing of the OECD” (Jackson, 2011).
5
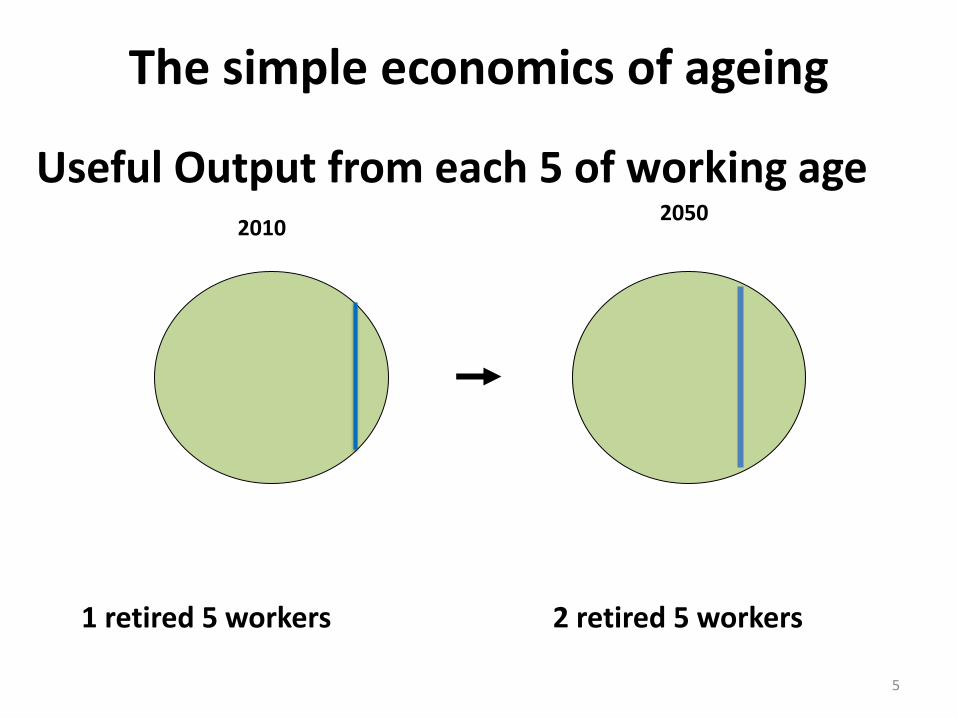
The simple economics of ageing
Useful Output from each 5 of working age 2010
2050
1 retired 5 workers 2 retired 5 workers
Intergenerational tussles over resources
Especially as the older population itself ‘ages’
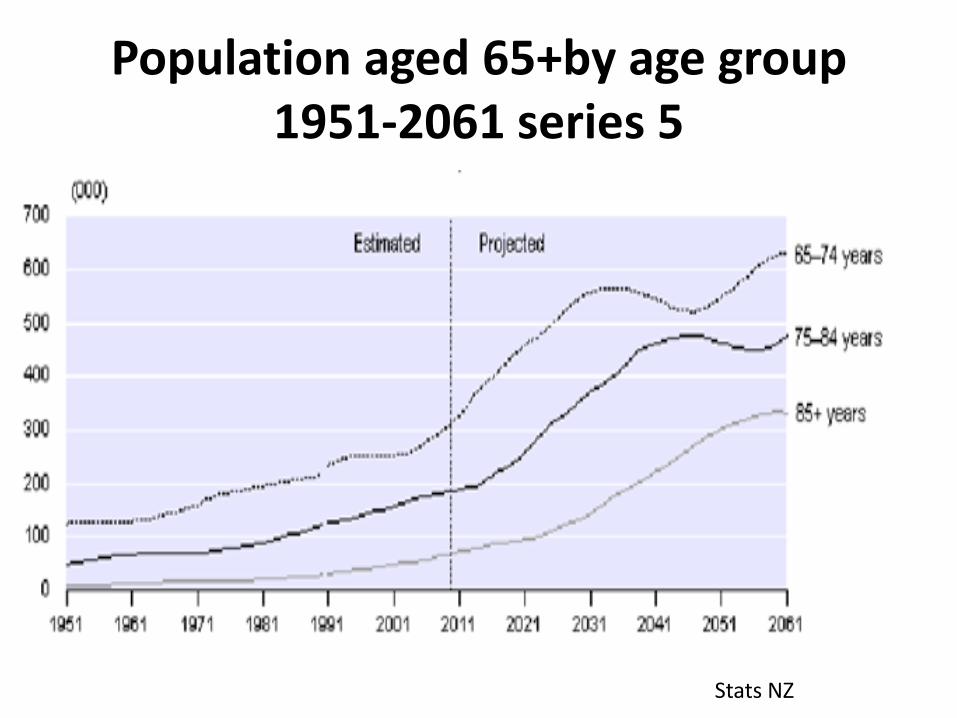
Population aged 65+by age group 1951-2061 series 5
Stats NZ

Probability of being in long-term care
0
0.1
0.2
0.3
0.4
0.5
0.6
70 75 80 85 90 95 100
Census 1996
New Zealand Life Tables: 2005–07
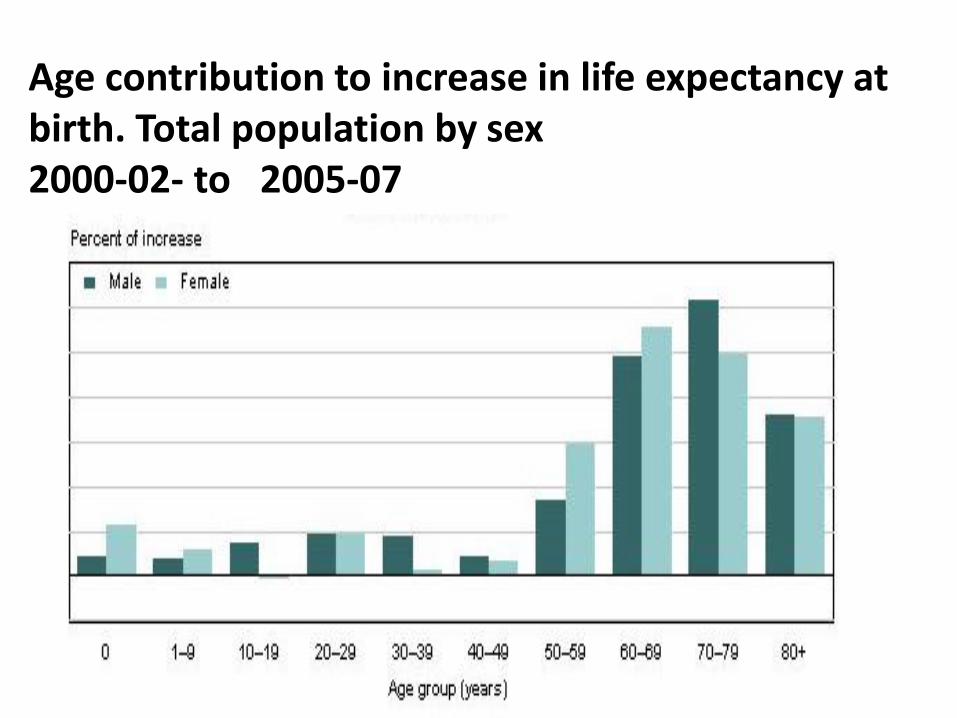
Age contribution to increase in life expectancy at birth. Total population by sex 2000-02- to 2005-07

Projected % change in population over 85 2006-2061
Statistics NZ 2007
Challenges to provision of long-term health care
• Delivery at home or in an institution?
• Embrace technological change or resist it
• Sickness model or wellness model
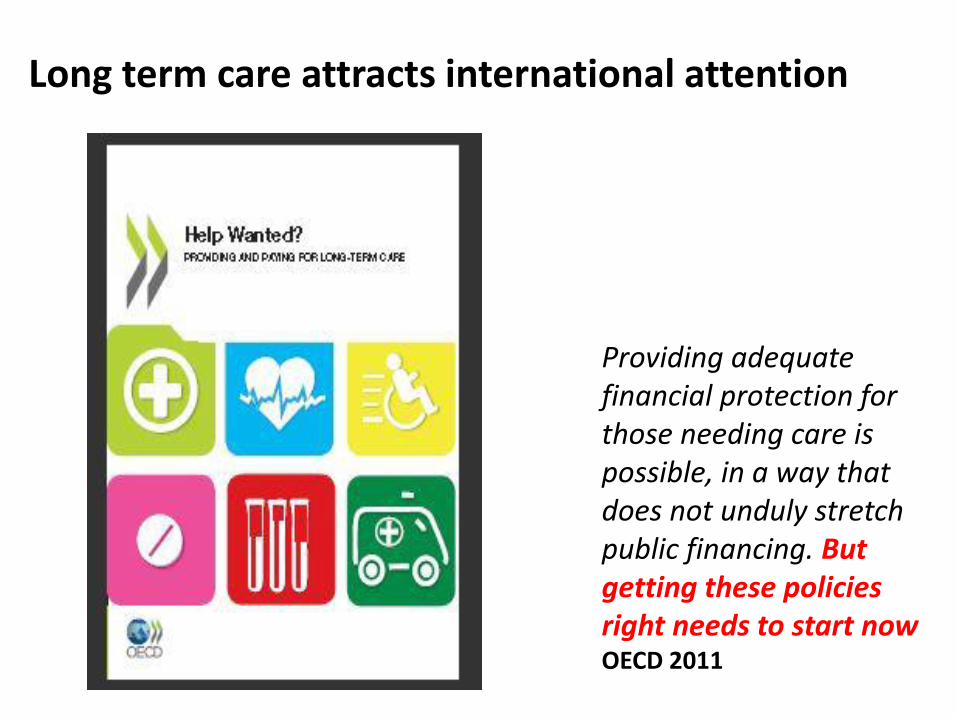
Providing adequate financial protection for those needing care is possible, in a way that does not unduly stretch public financing. But getting these policies right needs to start now OECD 2011
Long term care attracts international attention

Share of public and private funding for long-term care
OECD 2011

Top-up subsidy
State pension
Subsidy
Other Income
and assets
State pension only
State pension
State pension
Other Income
Subsidy
Some other income
Paying for old age care in New Zealand
Maximum personal contribution
Failing means test
Contract price

What is fair?
“It is unfair that people aged 65 and over are required to use up their assets to contribute to the cost of their care, whereas younger people are not. The gradual removal of asset testing will balance these important human rights considerations against the very substantial costs involved. Around 5,600 additional people are expected to receive the subsidy from 1 July 2005, taking to 70 per cent the proportion in care who receive the subsidy.” (Dyson, 2003).

The 2011 Dilnot
Commission report on the
funding of care and support for
older and disabled people
• Cap individual liability for residential social care at £35,000 • Raise the means-testing threshold to £100,000 • add £2 billion to the £27 billion cost of adult social care and disability benefits, rising to
£3.6 billion by 2025 • Cap needed if financial services companies are to offer products helping families and
individuals to budget for such care
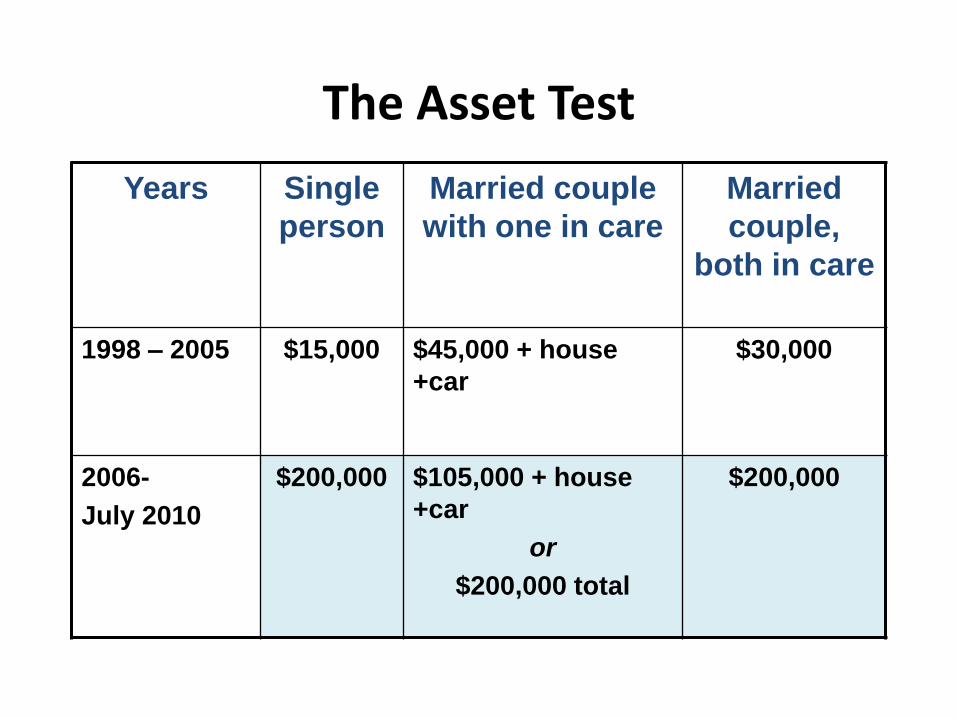
The Asset Test
Years Single
person
Married couple
with one in care
Married
couple,
both in care
1998 – 2005 $15,000 $45,000 + house
+car
$30,000
2006-
July 2010
$200,000 $105,000 + house
+car
or
$200,000 total
$200,000

The Income Test Fail the asset test- expect to contribute $786-$864 per week
High need users may cost over $1500 per week
Once asset test met
Subsidy applies to shortfall of income
(earned income of spouse at home now excluded and some investment income exempt)

Intragenerational sharing • Whose standard of living should be reduced?
• Currently burden falls on – Working age population- subsidies, NZ super, asset
test avoidance
– Unlucky families, through means test
• Intragenerational sharing would impose more of the costs on the generation aged 65+ – Spread from those who die early or live longer
without needing care, to those who live longest and need care.
– Improve intergenerational perceptions

Currently, on retirement
• New Zealand Superannuation provides basic longevity insurance
• Middle income groups are on their own – Lump sums may be used up too quickly
• KiwiSaver-
– Home equity illiquid • Equity release products inappropriate
– Longevity risk not insured
– Long-term care costs not insured
Some options to improve Intragenerational equity
• Long-term care insurance?
• Expand use of annuities
• Life insurance and long-term care
• Life annuities and long term care

OECD 2011
The private long-term care insurance market is small
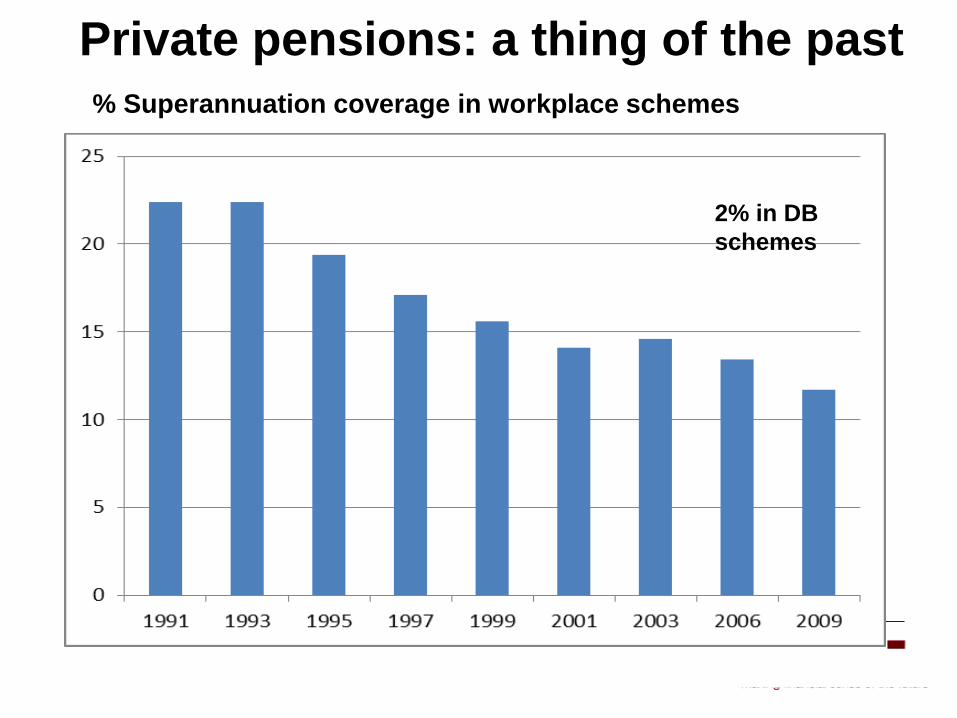
Private pensions: a thing of the past
% Superannuation coverage in workplace schemes
2% in DB
schemes

Current annuities market almost non-
existent
Life annuities
Appear expensive
Poor value for women
Timing is a lottery
No protection from inflation
No protection from growth in living
standards
Institutional risks and no guarantees.

A new product for New Zealand?
Inflation-adjusted gender-neutral Life annuity
of value of up to $10,000 pa
Increased on the determination of the need for
long term care- say annuity trebles
Paid for at age 65 with cash and if suitable,
equity share in housing
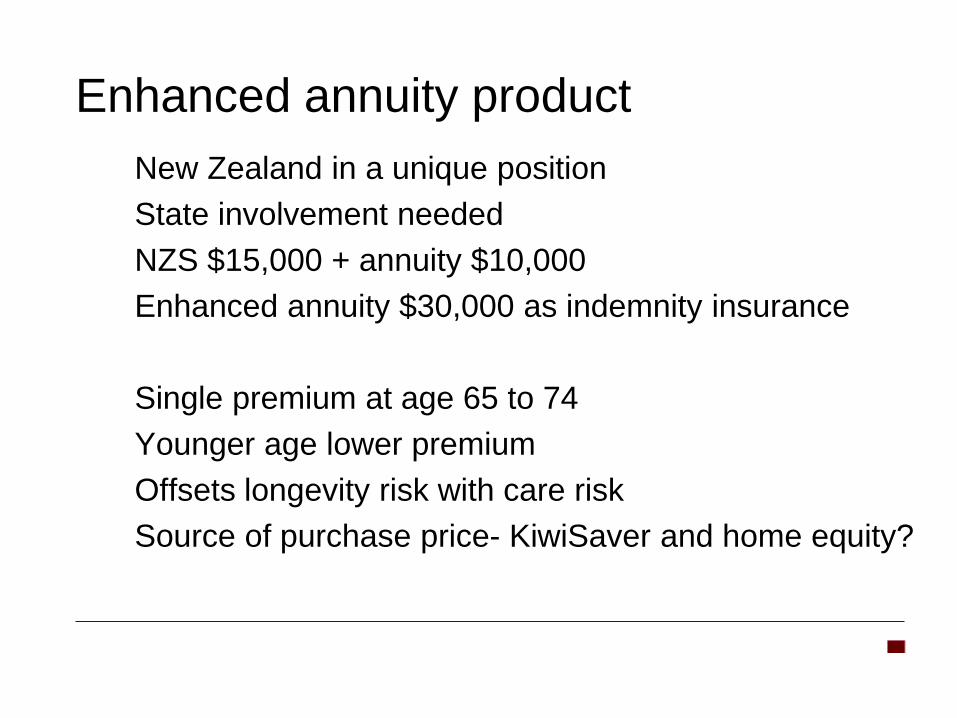
Enhanced annuity product
New Zealand in a unique position
State involvement needed
NZS $15,000 + annuity $10,000
Enhanced annuity $30,000 as indemnity insurance
Single premium at age 65 to 74
Younger age lower premium
Offsets longevity risk with care risk
Source of purchase price- KiwiSaver and home equity?
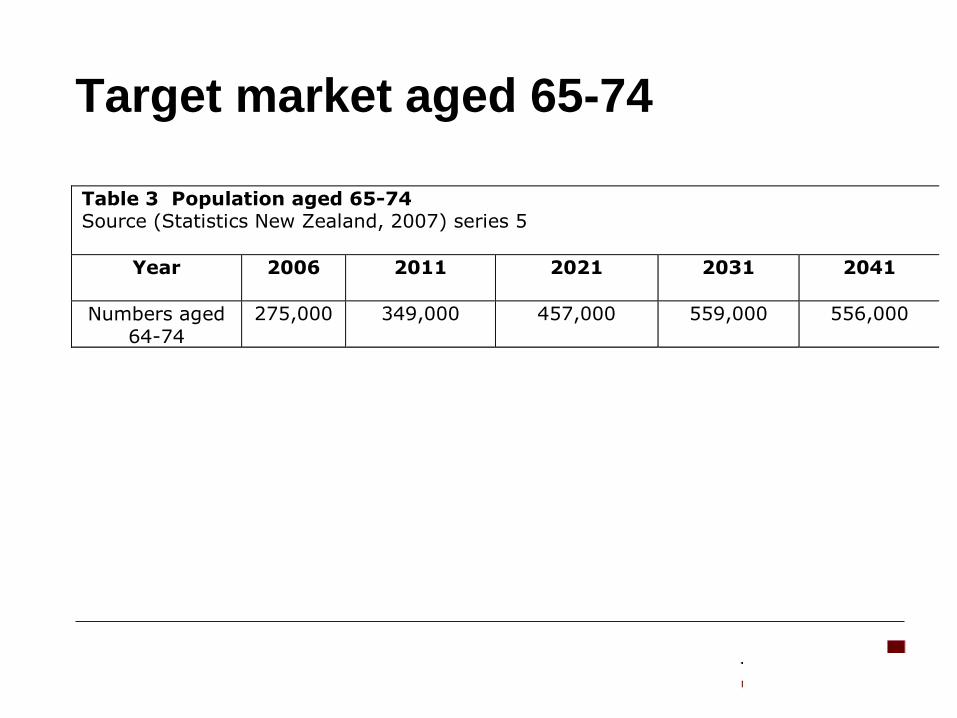
Target market aged 65-74
Table 3 Population aged 65-74 Source (Statistics New Zealand, 2007) series 5
Year 2006 2011 2021 2031 2041
Numbers aged
64-74
275,000 349,000 457,000 559,000 556,000
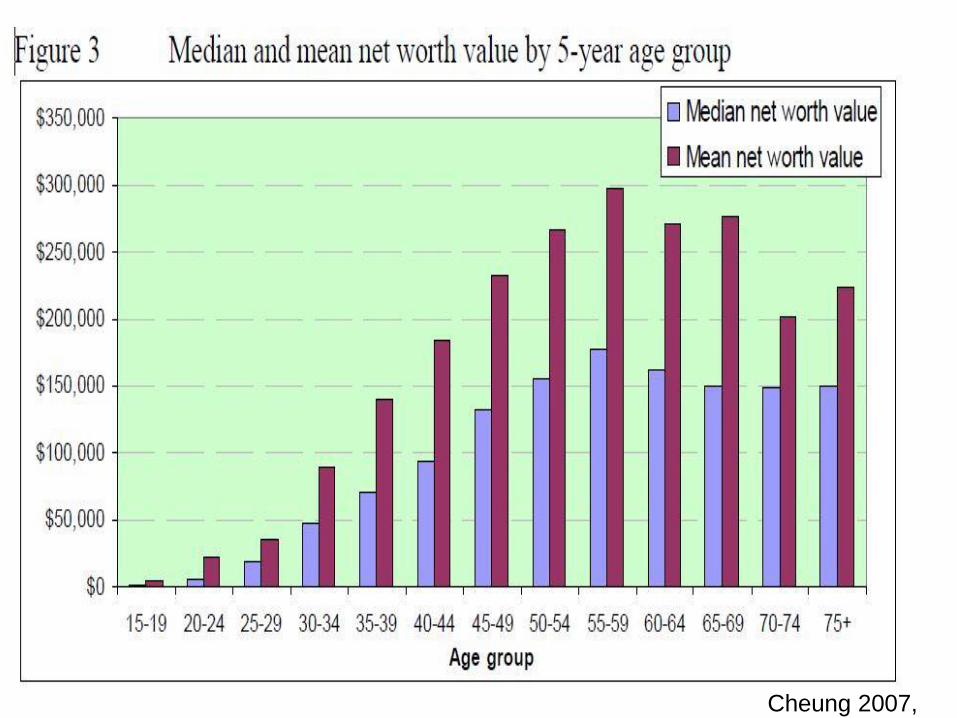
Cheung 2007,

What could the government do?
Identify the social advantages that might flow from annuities
Explore integration of life annuities with long term care insurance
Possible options
a reduced state pension
purchased top-up to NZS with LTC rider
Subsidise, support and regulate the market, or act as provider

Conclusion • Today’s funding for long-term care unlikely
to be sustainable
• If the older group buy insurance in young old age the risks are spread
• Tentative costings suggest that this product is feasible
• Might look attractive to both men and women
FOR NEW ZEALAND Subsidy to the decumulation phase justifiable if little subsidisation of accumulation phase