preparing for school and college readiness for a birth-16
TRANSCRIPT
Preparing for School and College Readiness
for a Birth-16 Educational Pipeline

ELRA program hosted at Rutgers-Camden since 2001; Infant/Toddler program begins in 2011; both within a Birth-16 school and college
pipeline of LEAP Academy University Charter School in Downtown Camden

The mission of the Early Learning Research Academy (ELRA) is to enhance the future school success of Camden City children from birth through age five by providing high-quality, research-based education and comprehensive wellness services while also improving research and best practices in early childhood development and education.

Camden Context • Population is roughly 77,000
• 37% of Camden’s population is under 18
• More than 50% of children live below the poverty line
• The median family income in Camden City is $24,612, compared with $65,370 in New Jersey
• 22% of Camden’s families earn less than $10,000 per year
• 5.5% of Camden’s adults have a bachelor’s or professional degree. Only about half of Camden’s adult residents have completed high school.
• Almost 40% of Camden residents speak a language other than English at home; almost all those who do not speak English at home speak Spanish.
• 10% of Camden’s families have a grandparent as the primary caretaker.
http://hopeworks.org/about/camden-facts/

Challenges of Early Learning in Low Income Environment like Camden
• Millions of children in low-income families are being left at home alone, left in informal child care or brought to work and exposed to unsafe working conditions
• Young children exposed to social and biological risk factors are at a greater risk for not developing foundational competencies, placing them at future risk of poor school performance
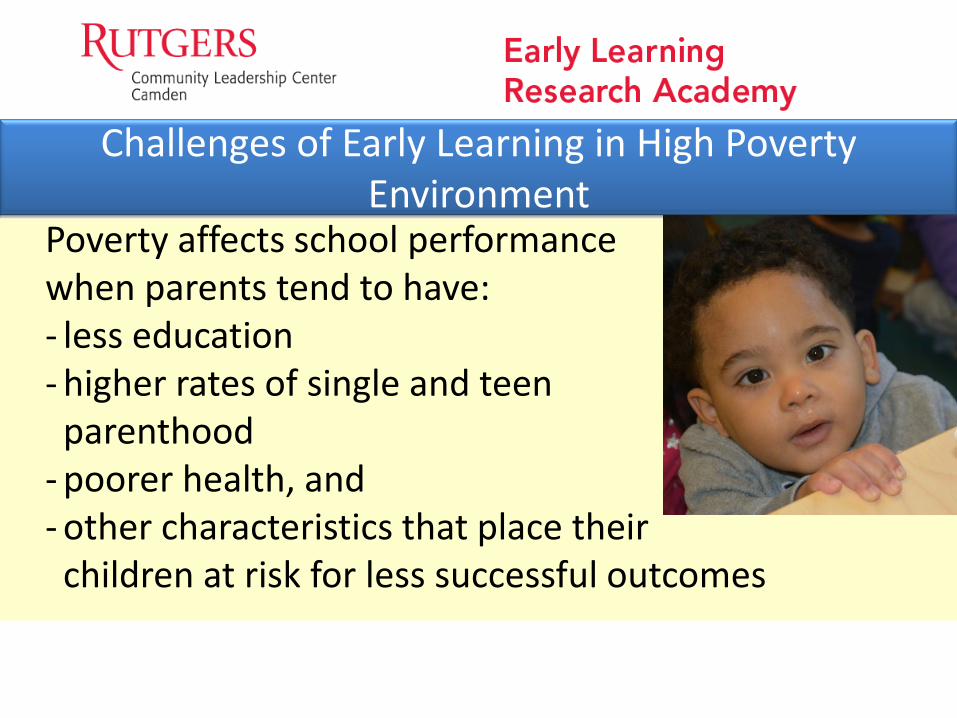
Challenges of Early Learning in High Poverty Environment
Poverty affects school performance when parents tend to have: - less education - higher rates of single and teen parenthood - poorer health, and - other characteristics that place their children at risk for less successful outcomes

Lessons Learned from Research
On average, Black, Hispanic, and American Indian children demonstrate significantly lower reading, math, and vocabulary skills at school entry than white and Asian American children
(Sadowski, 2006)

Lessons Learned from Research
3-year-olds whose parents are professionals have vocabularies that are 50% larger than those of children from working-class families, and twice as large as children whose families receive welfare
(Hart and Risley, 1995)

Lessons Learned from Research
At kindergarten entry, cognitive scores of children in the highest socioeconomic group were 60% higher than those of the lowest group (Lee and Burkam, 2002)
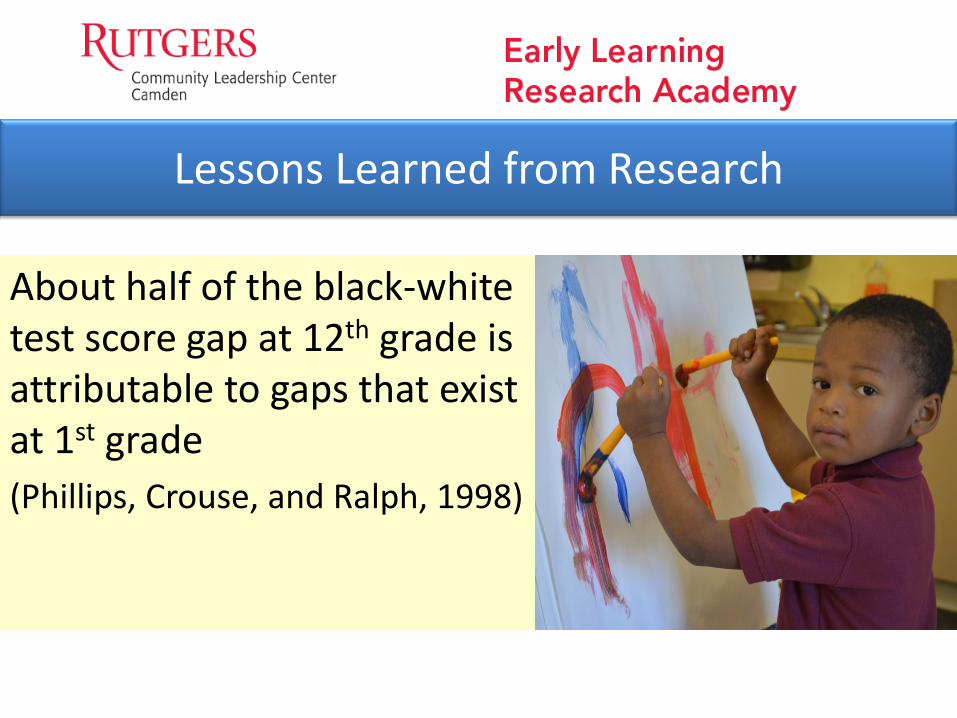
Lessons Learned from Research
About half of the black-white test score gap at 12th grade is attributable to gaps that exist at 1st grade
(Phillips, Crouse, and Ralph, 1998)

Foundation Support for Rutgers/ELRA Early Childhood Development Initiative
• Beginning in 2006, William Penn Foundation grant ($700,000) for Parent Training
• Knight Foundation ($2 million) collaborated with ELRA to train Teachers and Instructional Assistants
• Knight gave $7 million capital grant to construct current ELRA building at 501 Cooper Street

ELRA Pipeline into LEAP Academy
Change expectation from a cradle to prison to a cradle to college pipeline that enables children and parents to be lifted from both isolation and poverty.
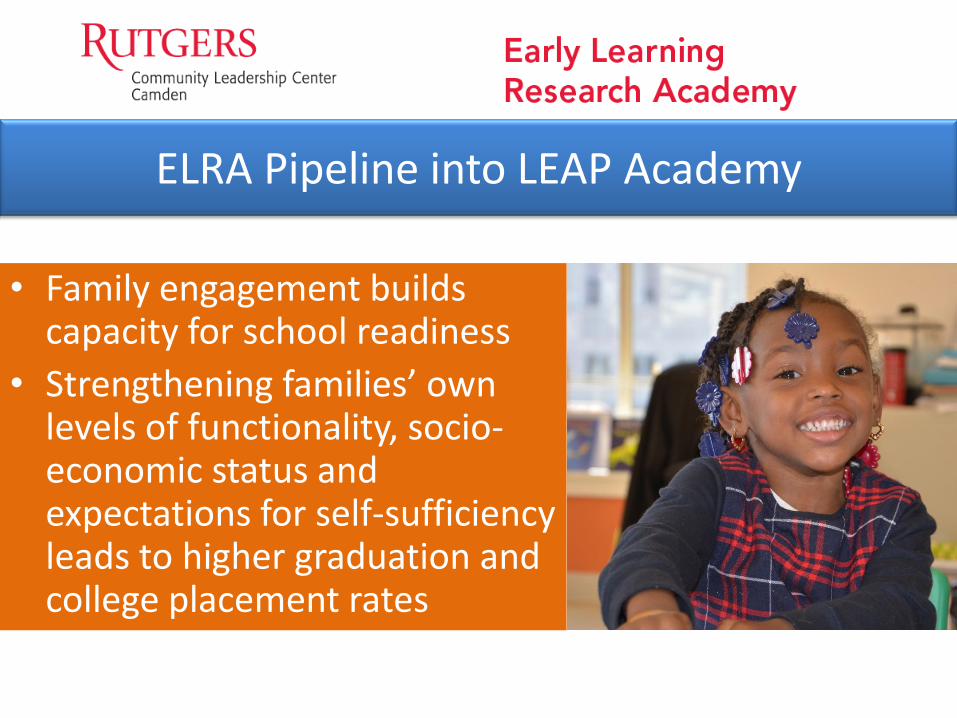
ELRA Pipeline into LEAP Academy
• Family engagement builds capacity for school readiness
• Strengthening families’ own levels of functionality, socio-economic status and expectations for self-sufficiency leads to higher graduation and college placement rates
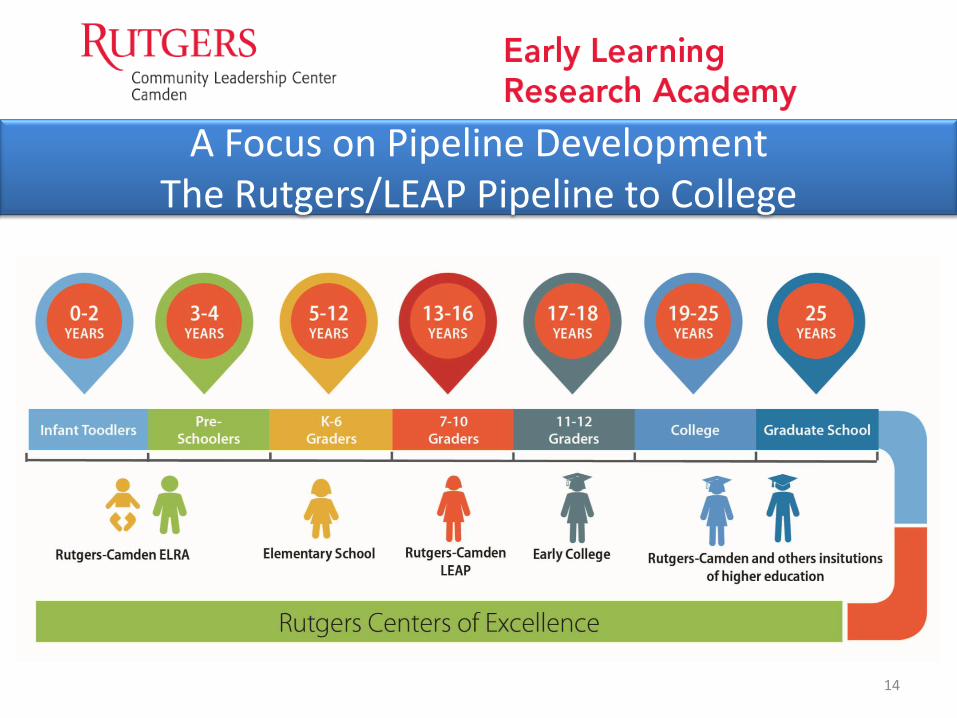
A Focus on Pipeline Development The Rutgers/LEAP Pipeline to College
14

• 100% in 2005
• 100% in 2006
• 100% in 2007
• 100% in 2008
• 100% in 2009
• 100% in 2010
• 100% in 2011
• 100% in 2012
• 100% in 2013
• 100% in 2014
• 100% in 2015
High School Graduation and College Placement Success Rate

ELRA Best Practices
• Love drives learning • Dual Language Curriculum improves
language acquisition • STEM/STEAM begins in the early learning • High-quality learning experiences • Practice family-child relationships • Children are global citizens of the world • Positive environment based on
trust and respect

• Promote growth, development and individual differences of each child
• Respect the individuality, culture and language of each child and family
• Value and preserve teacher-child, parent-teacher relationships
• Partnership with families, sharing decision making and enhancing communications at all levels

• Healthy, safe and a culturally diverse environment
• Active learning and play drive cognition and social competence
• Responsive curriculum that respects children’s initiative and abilities
• Assessment tools to understand and document children’s developmental growth

• Ongoing research and documentation through internal and external evaluation
• Zone of Practice, innovation and excellence
• Observation labs for learning, research, documentation, evaluation and inquiry
• Data-driven instruction

Variety of Assessments to Measure Learning
• Teaching Strategies Performance and Growth Indicators
• New Jersey Preschool Teaching and Learning Standards
• ESI (Early Screening Inventory) – identifying student deficits
• Brigance – baseline for infants/toddlers

Variety of Assessments to Measure Learning
• Upon entering Kindergarten, transition to MAP (Measures of Academic Progress)
• From 3rd to 12th Grade, testing with PARCC (Partnership for Assessment of Readiness for College and Careers)

Variety of Assessments to Measure Learning
• By end of high school, obtaining 100% graduation and college placement of all LEAP students
• After college, ELRA students have returned to teach at LEAP

Research Objective
• We want to understand the importance of development of socio-emotional, language and motor skills in early childhood for school readiness, with particular focus on urban minority children.

Teaching Strategies Dimensions
• Social-Emotional
• Physical
• Language
• Spanish Language
• Cognitive
• Literacy
• Spanish Literacy
• Mathematics

Area of Development
Number of Children
Percentage of Children Below Growth Range
Percentage of Children Meeting or Above Growth Range
Social Emotional 64 28% 72%
Physical 64
14% 86%
Language 64
27% 73%
Cognitive 64
22% 78%
Literacy 64
23% 77%
Mathematics 64
20% 80%
TSG Current Pre-K Cohort Growth Summary

Social Emotional measures: - Manages feelings - Follows limits and
expectations - Takes care of own needs appropriately - Forms relationships with
adults - Responds to emotional cues - Interacts with peers - Makes friends - Balances needs and rights of
self and others - Solves social problems
Social Emotional Dimension Longitudinal Chart

Physical measures: - Demonstrates traveling
skills - Demonstrates balancing
skills - Demonstrates gross motor
manipulative skills - Uses fingers and hands - Uses writing and drawing
tools
Physical Dimension Longitudinal Chart
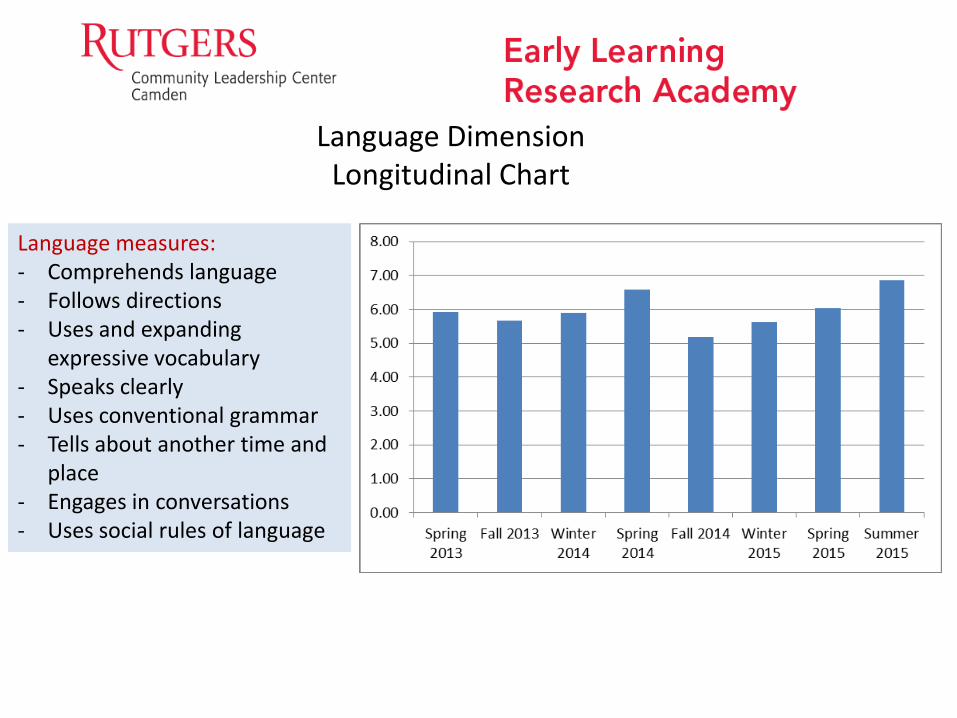
Language measures: - Comprehends language - Follows directions - Uses and expanding
expressive vocabulary - Speaks clearly - Uses conventional grammar - Tells about another time and
place - Engages in conversations - Uses social rules of language
Language Dimension Longitudinal Chart
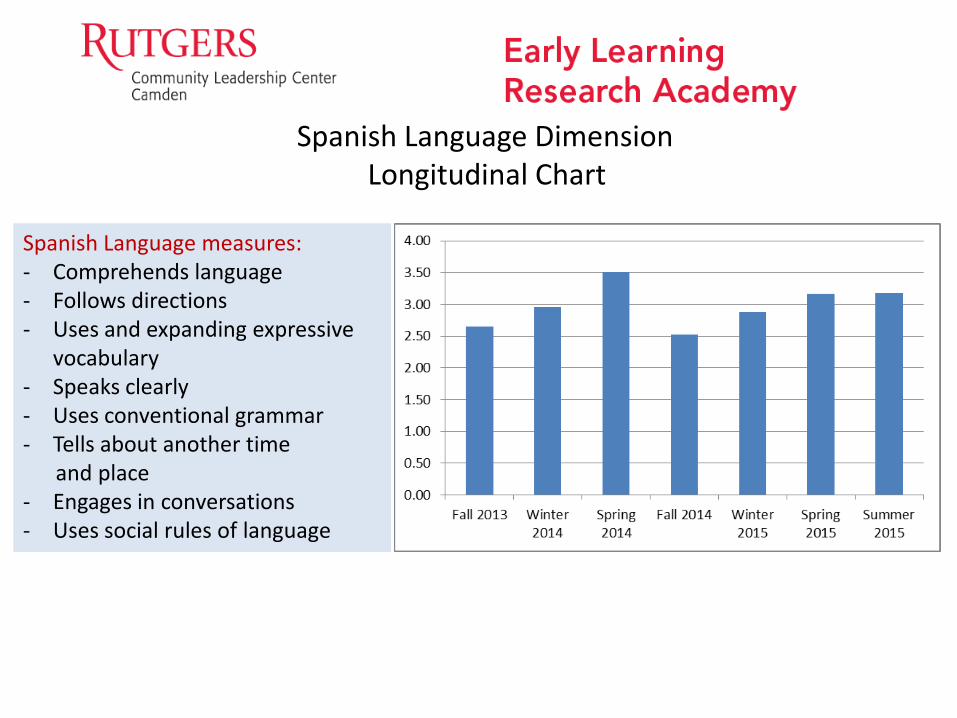
Spanish Language measures: - Comprehends language - Follows directions - Uses and expanding expressive
vocabulary - Speaks clearly - Uses conventional grammar - Tells about another time and place - Engages in conversations - Uses social rules of language
Spanish Language Dimension Longitudinal Chart

Cognitive measures: - Attends and engages - Persists - Solves problems - Shows curiosity and motivation - Shows flexibility and
inventiveness in thinking - Recognizes and recalls - Makes connections - Uses classification skills - Thinks symbolically - Engages in socio dramatic play
Cognitive Dimension Longitudinal Chart

Literacy measures: - Notices and discriminates rhyme - Notices and discriminates
alliteration - Notices and discriminates smaller
and smaller units of sound - Identifies and names letters - Uses letter-sound knowledge - Uses and appreciates books - Uses print concepts - Interacts during read-alouds and
book conversations - Uses emergent reading skills - Retells stories - Writes name - Writes to convey meaning
Literacy Dimension Longitudinal Chart
0.00
1.00
2.00
3.00
4.00
5.00
6.00
7.00
Spring 2013
Fall 2013 Winter 2014
Spring 2014
Fall 2014 Winter 2015
Spring 2015
Summer 2015

Spanish Literacy measures: - Notices and discriminates rhyme - Notices and discriminates
alliteration - Notices and discriminates smaller
and smaller units of sound - Identifies and names letters - Uses letter-sound knowledge - Uses and appreciates books - Uses print concepts - Interacts during read-alouds and
book conversations - Uses emergent reading skills - Retells stories - Writes name - Writes to convey meaning
Spanish Literacy Dimension Longitudinal Chart
0.00
0.50
1.00
1.50
2.00
2.50
3.00
3.50
Fall 2013 Winter 2014 Spring 2014 Fall 2014 Winter 2015 Spring 2015 Summer 2015

Mathematics measures: - Counts - Quantifies - Connects numerals with
their quantities - Understands spatial
relationships - Understands shapes - Compares and measures - Demonstrates knowledge
of patterns
Mathematics Dimension Longitudinal Chart
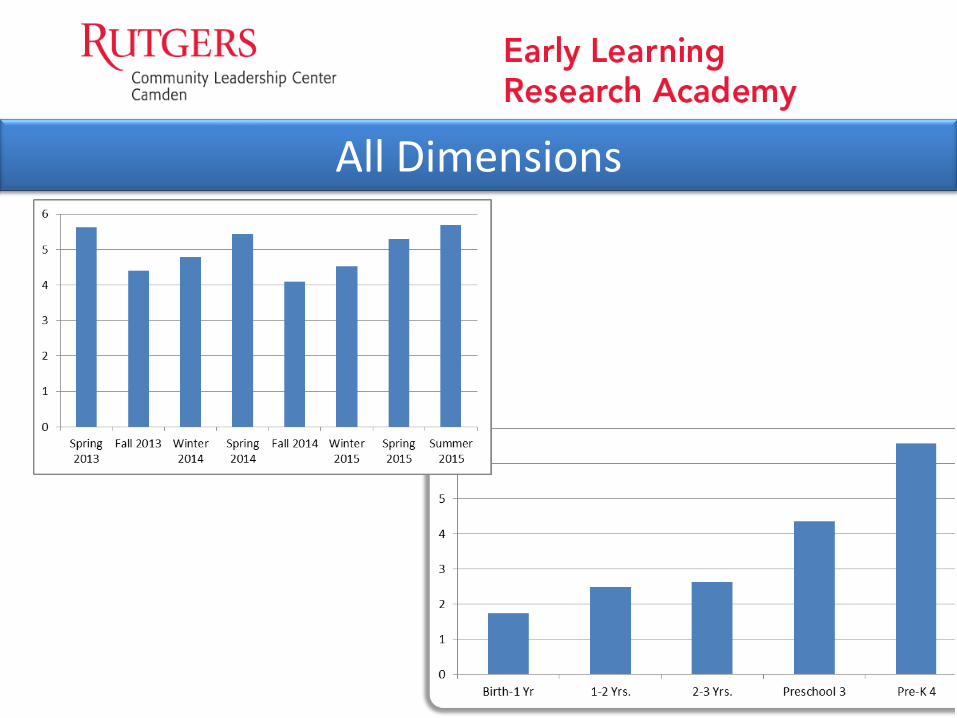
All Dimensions
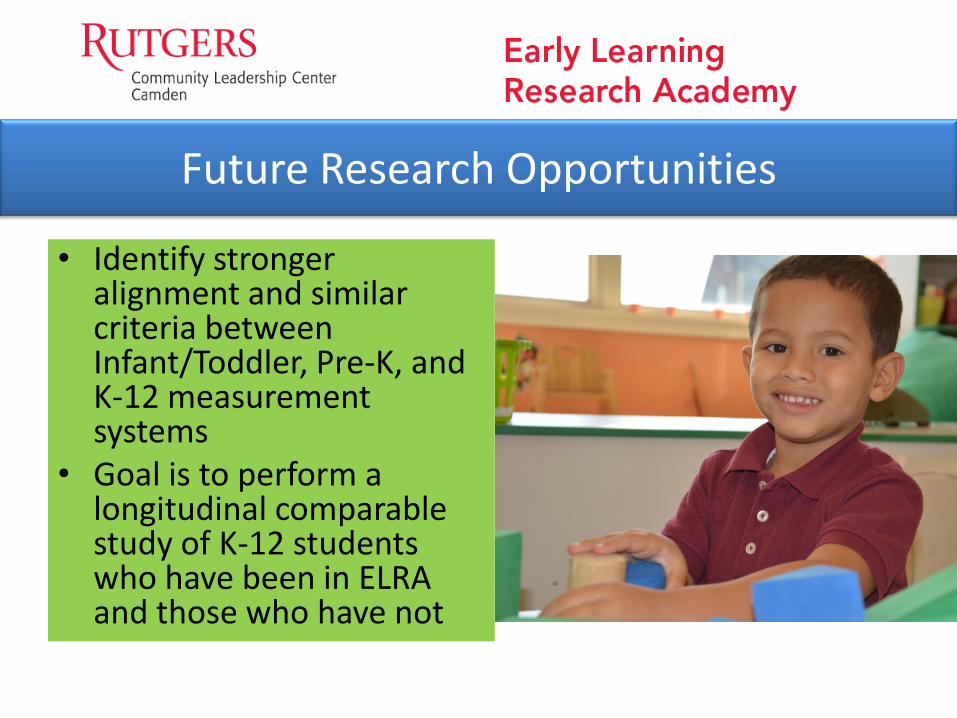
Future Research Opportunities
• Identify stronger alignment and similar criteria between Infant/Toddler, Pre-K, and K-12 measurement systems
• Goal is to perform a longitudinal comparable study of K-12 students who have been in ELRA and those who have not

Research shows that preschool programs – if they’re of high quality – can provide an enormous boost that
changes children’s lives forever