prepared for the committee for health care for massachusetts december 14, 2005 action costs less the...
TRANSCRIPT

Prepared for the Committee for Health Care for Massachusetts December 14, 2005
ACTION COSTS LESSThe Health Care Amendment
Standards and Options for Reform
Kenneth E. Thorpe, Ph.D.Robert W. Woodruff Professor and Chair
Department of Health Policy and ManagementRollins School of Public Health
Emory University
Prepared for the Committee for Health Care for Massachusetts December 14, 2005
Executive Summary
Prepared for the Committee for Health Care for Massachusetts December 14, 2005
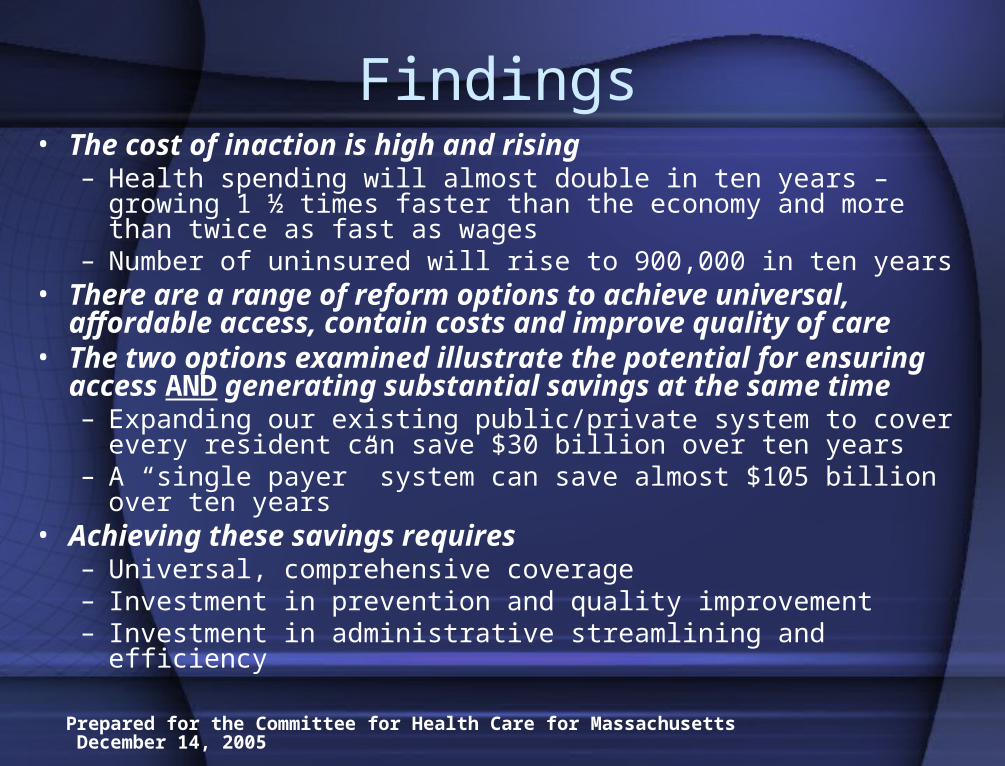
Findings• The cost of inaction is high and rising
– Health spending will almost double in ten years – growing 1 ½ times faster than the economy and more than twice as fast as wages
– Number of uninsured will rise to 900,000 in ten years• There are a range of reform options to achieve universal,
affordable access, contain costs and improve quality of care• The two options examined illustrate the potential for
ensuring access AND generating substantial savings at the same time– Expanding our existing public/private system to cover every resident
can save $30 billion over ten years– A “single payer” system can save almost $105 billion over ten years
• Achieving these savings requires– Universal, comprehensive coverage– Investment in prevention and quality improvement– Investment in administrative streamlining and efficiency

Prepared for the Committee for Health Care for Massachusetts December 14, 2005
The Health Care AmendmentStandards for Reform
• Universal: all Massachusetts residents • Affordable: all individuals, families,
providers, businesses and taxpayers• Equitable:
– Costs and savings fairly distributed among all who benefit from affordable coverage for all
– Fair reimbursement for all services provided• Comprehensive: all medically necessary
preventive, acute and chronic health care and mental health care services, prescription drugs and devices

Prepared for the Committee for Health Care for Massachusetts December 14, 2005
Options Analyzed
• Option 1: Inaction
• Option 2: Universal coverage; expanded public/private system; cost containment and quality improvement
• Option 3: Universal coverage; expanded public system; cost containment and quality improvement

Prepared for the Committee for Health Care for Massachusetts December 14, 2005
Exhibit 1: Comparative Cost Projections all Options
2006 2007 2008 2009 2010 2011 2012 2013 2014 2015
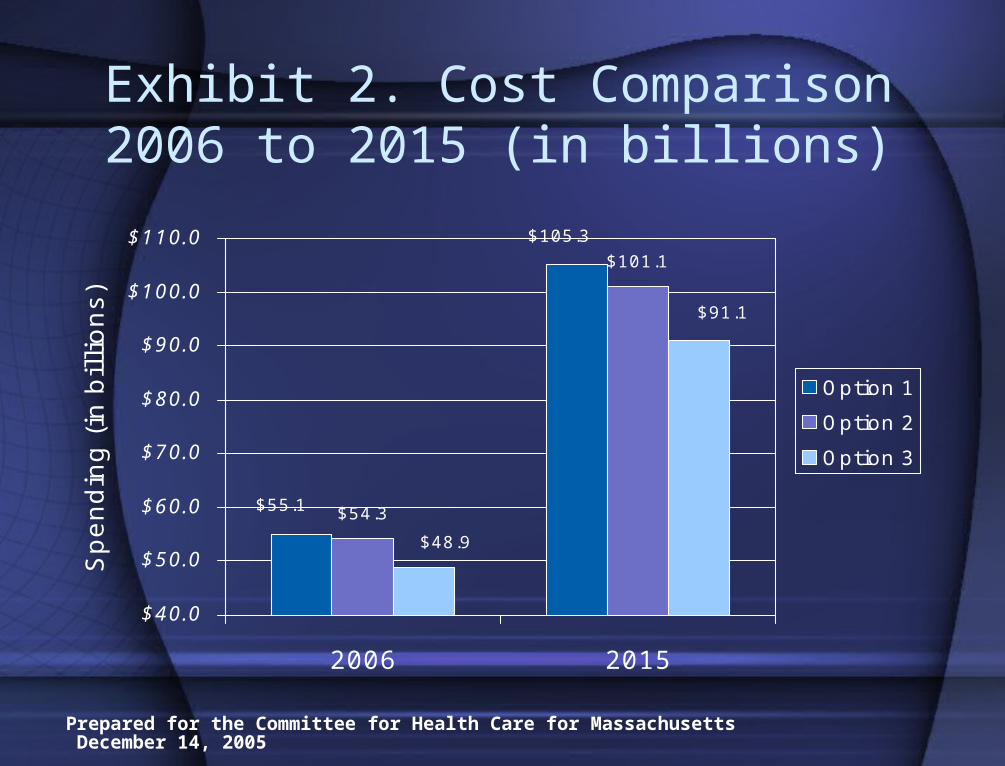
Option 1 $55.1 $59.6 $64.1 $68.9 $73.8 $79.7 $85.0 $91.4 $97.9 $105.3
Option 2 $54.3 $57.9 $61.4 $66.0 $70.9 $76.4 $81.4 $87.6 $93.9 $101.1
Option 3 $48.9 $52.1 $55.3 $59.4 $63.8 $68.8 $73.3 $78.9 $84.6 $91.1
Prepared for the Committee for Health Care for Massachusetts December 14, 2005
Exhibit 2. Cost Comparison 2006 to 2015 (in billions)
$54.3
$101.1
$55.1
$105.3
$48.9
$91.1
$40.0
$50.0
$60.0
$70.0
$80.0
$90.0
$100.0
$110.0
2006 2015
Sp
en
din
g (
in b
illi
on
s)
Option 1
Option 2
Option 3

$50.0
$60.0
$70.0
$80.0
$90.0
$100.0
$110.0
2006 2007 2008 2009 2010 2011 2012 2013 2014 2015
$50.0
$60.0
$70.0
$80.0
$90.0
$100.0
$110.0
2006 2007 2008 2009 2010 2011 2012 2013 2014 2015
Total Savings Projections
Inaction vs. Option 2
By 2010Savings = $11.0 Billion
By 2010Savings = $11.0 Billion
$29.9
$11.0
Inaction Option 2
By 2015Savings = $29.9 Billion
By 2015Savings = $29.9 Billion
Billion
s o
f D
ollars
Exhibit 3A.

$50.0
$60.0
$70.0
$80.0
$90.0
$100.0
$110.0
2006 2007 2008 2009 2010 2011 2012 2013 2014 2015
$50.0
$60.0
$70.0
$80.0
$90.0
$100.0
$110.0
2006 2007 2008 2009 2010 2011 2012 2013 2014 2015
Total Savings Projections
Inaction vs. Option 3
By 2010Savings = $42.0 Billion
By 2010Savings = $42.0 Billion
Inaction Option 3
By 2015Savings = $104.6 Billion
By 2015Savings = $104.6 Billion
$104.6
$42.0Billion
s o
f D
ollars
Exhibit 3B.

Prepared for the Committee for Health Care for Massachusetts December 14, 2005
The Baseline
Overview of Current Massachusetts Health Coverage and Spending

Prepared for the Committee for Health Care for Massachusetts December 14, 2005
Current Coverage and Spending
• $51 billion – the 2005 price tag for health care in Massachusetts
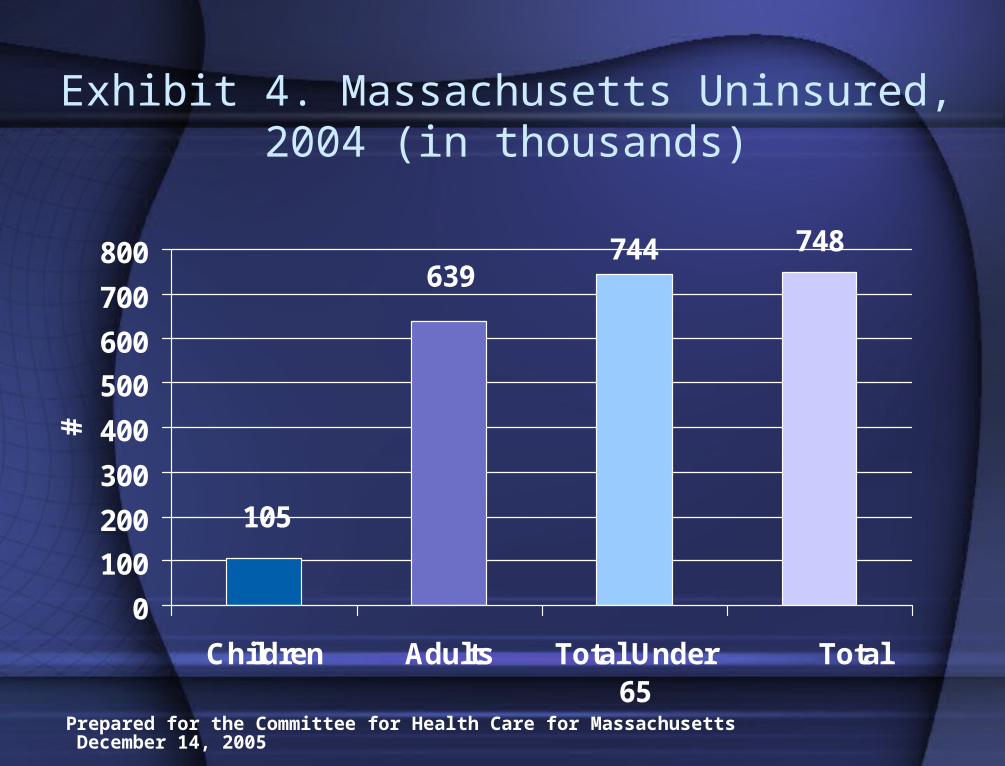
• 748,000 uninsured in 2004 – about 12% of the non-elderly population
• $1 billion – 2005 price tag for care for the uninsured and underinsured
• Health spending consumes almost 15% of gross state product
Prepared for the Committee for Health Care for Massachusetts December 14, 2005
Exhibit 4. Massachusetts Uninsured, 2004 (in thousands)
744
105
639748
0
100
200
300
400
500
600
700
800
Children Adults Total Under65
Total
#
Prepared for the Committee for Health Care for Massachusetts December 14, 2005
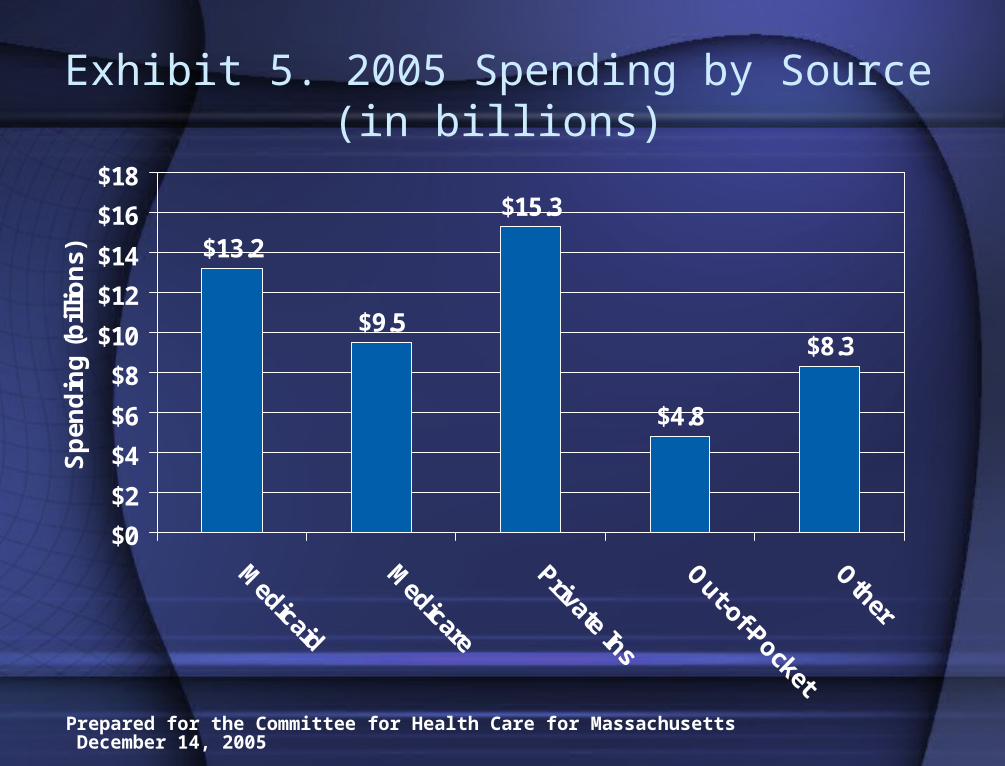
Exhibit 5. 2005 Spending by Source (in billions)
$13.2
$9.5
$15.3
$4.8
$8.3
$0
$2
$4
$6
$8
$10
$12
$14
$16
$18
Sp
end
ing
(b
illio
ns)

Prepared for the Committee for Health Care for Massachusetts December 14, 2005
Exhibit 6. Funding Available to Finance Expanded Coverage (in millions)
Uses Financing Sources
Subsidies to Individuals and/or Employers to Purchase Health Insurance or Reduce Contribution Levels for Publicly Financed Coverage, $1,100-$1,500
•Disproportionate Share (other than IMD) $470
•Other current state/local Federal spending on the uninsured $477
•Other $83
TOTAL* $1,030
* Source: Urban Institute

Prepared for the Committee for Health Care for Massachusetts December 14, 2005
Option 1
Inaction

Prepared for the Committee for Health Care for Massachusetts December 14, 2005
What Happens?
• Health care spending nearly doubles by 2015
• The number of uninsured rises 20% to 900,000 by 2015
• By 2015 health care spending grows from
– 15% to over 19% of gross state product
– 22% to almost 31% of total payroll

Prepared for the Committee for Health Care for Massachusetts December 14, 2005
Exhibit 7. Spending by Source (in billions)
2006 2007 2008 2009 2010 2011 2012 2013 2014 2015
Medicaid Spending
$14.1 $15.0 $16.3 $17.7 $19.2 $20.9 $22.5 $24.4 $26.4 $28.7
Medicare Spending
$10.1 $11.4 $12.1 $12.9 $13.7 $14.9 $15.7 $17.2 $18.6 $20.1
Private Insurance
$16.3 $17.5 $18.8 $20.2 $21.5 $23.1 $24.6 $26.1 $27.7 $29.5
OOP $5.8 $6.2 $6.7 $7.1 $7.6 $8.1 $8.7 $9.2 $9.7 $10.3
Other $8.8 $9.5 $10.2 $11.0 $11.8 $12.7 $13.5 $14.5 $15.5 $16.7
Total $55.1 $59.6 $64.1 $68.9 $73.8 $79.7 $85.0 $91.4 $97.9 $105.3

Prepared for the Committee for Health Care for Massachusetts December 14, 2005
Exhibit 8. Spending Comparison by Source 2005 to 2015 (in billions)
$20.1
$29.5
$10.3$13.2 $15.3
$4.8
$8.3$9.5
$26.7
$16.7
$0
$5
$10
$15
$20
$25
$30
$35
Medicaid
Medicare
Private Ins
Out-of-Pocket
Other
Spe
ndin
g (b
illio
ns)

Prepared for the Committee for Health Care for Massachusetts December 14, 2005
Exhibit 9. Projected Number of Uninsured in Massachusetts Without Reform, 2005-2015
700,000
750,000
800,000
850,000
900,000
950,000
2005 2010
# U
nin
su
red
2015
748,000
900,000
850,000

Prepared for the Committee for Health Care for Massachusetts December 14, 2005
Exhibit 10. Projected Average Annual Growth in Massachusetts Health Care Spending, Gross State
Product and Wages 2005 - 2015
7.50%
4.80%
3.20%
0%
2%
4%
6%
8%
Wages Gross StateProduct
Health Care
Av
era
ge
An
nu
al G
row
th 2
00
5-2
01
5

Prepared for the Committee for Health Care for Massachusetts December 14, 2005
YearPrivate
Insurance
Out of
Pocket HI Tax 2 Payroll
Total as % of Payroll 3
2006 $16.4 1 5.2 3.2 111.4 22.3%
2015 $ 31.5 9.9 4.3 147.8 30.9%
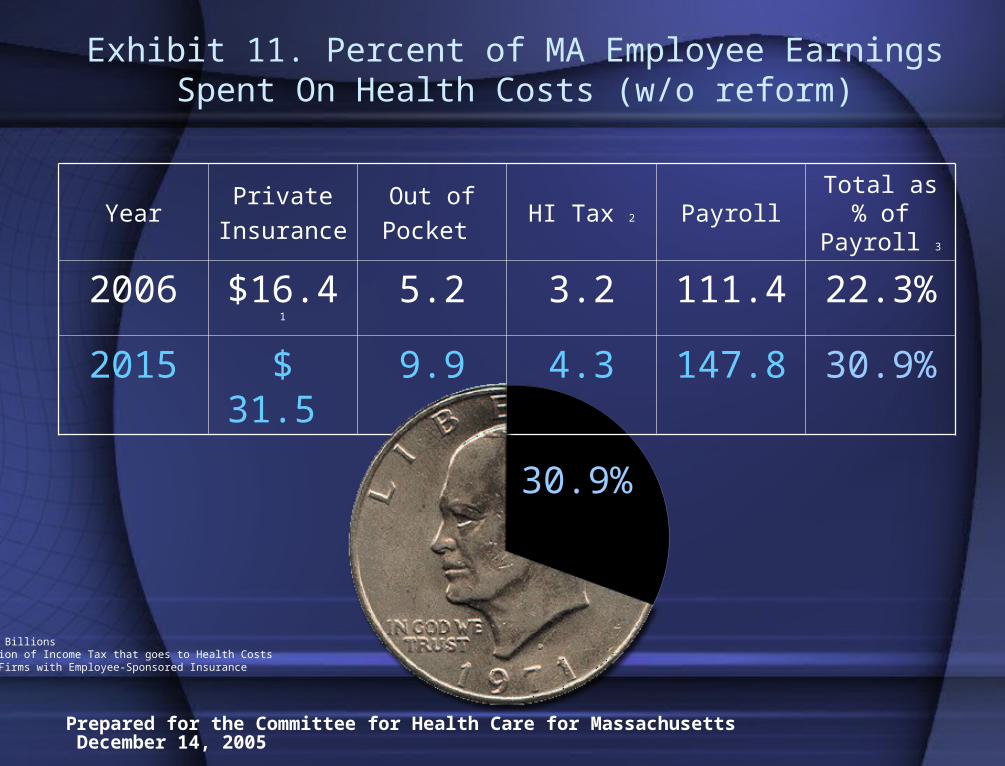
Exhibit 11. Percent of MA Employee EarningsSpent On Health Costs (w/o reform)
1. $ in Billions2. Portion of Income Tax that goes to Health Costs3. For Firms with Employee-Sponsored Insurance
22.3%
Prepared for the Committee for Health Care for Massachusetts December 14, 2005
YearPrivate
Insurance
Out of
Pocket HI Tax 2 Payroll
Total as % of Payroll 3
2006 $16.4 1 5.2 3.2 111.4 22.3%
2015 $ 31.5 9.9 4.3 147.8 30.9%
Exhibit 11. Percent of MA Employee EarningsSpent On Health Costs (w/o reform)
1. $ in Billions2. Portion of Income Tax that goes to Health Costs3. For Firms with Employee-Sponsored Insurance
30.9%

Prepared for the Committee for Health Care for Massachusetts December 14, 2005
Health Care Spending
Gross State Product
Health as % of GSP
2006 $55.1 $360.1 15.3%
2015 $105.3 $539.8 19.5%
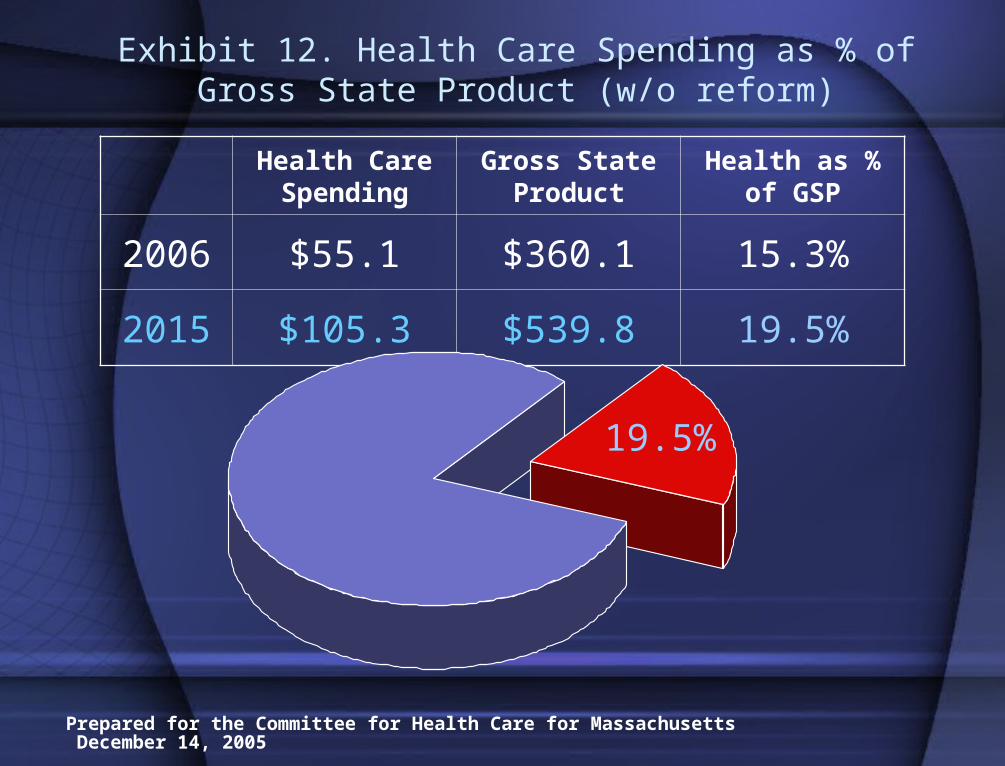
Exhibit 12. Health Care Spending as % ofGross State Product (w/o reform)
15.3%
Prepared for the Committee for Health Care for Massachusetts December 14, 2005
Health Care Spending
Gross State Product
Health as % of GSP
2006 $55.1 $360.1 15.3%
2015 $105.3 $539.8 19.5%
Exhibit 12. Health Care Spending as % ofGross State Product (w/o reform)
19.5%

Prepared for the Committee for Health Care for Massachusetts December 14, 2005
Option 2
Universal Coverage Through Expansion of Current
Public/Private System with Reforms to Contain Costs and
Improve Quality

Prepared for the Committee for Health Care for Massachusetts December 14, 2005
What Happens?
• Reform generates savings of $800 million in first year of full implementation
• Health care spending is 4% lower by 2015 than it would have been without reform
• The number of uninsured and underinsured drops to virtually zero
• Health care spending consumes less household income and gross state product than without reform

Prepared for the Committee for Health Care for Massachusetts December 14, 2005
Modeling Assumptions• All eligible children automatically enrolled in
Medicaid/SCHIP• Adults in families under 150% poverty enrolled in
“SCHIP-like” plan• Workers pay 25% of premium. Sliding scale
subsidies for workers earning between 150% and 300% of poverty
• Employers pay 75% of premiums for full-time workers pro-rated for part-time workers. Sliding scale subsidies for small and low-margin employers
• Self-employed pay 100% of premiums with sliding scale subsidies based on income
• Cost and quality initiatives implemented in 2006

Prepared for the Committee for Health Care for Massachusetts December 14, 2005
Exhibit 13. Option 2 Costs and Savings, 2006 (in billions)
2006 Spending without reform $ 55.1
Change in Health Care Spending In Massachusetts—New Spending to Cover the Uninsured
$ 1.4
Subtotal $ 56.5
Savings from Quality and Administrative Initiatives ($ 2.2)
Total 2006 Spending Option 2 $ 54.3
2006 Savings for Option 2 with Initiatives ($ 0.8)
Prepared for the Committee for Health Care for Massachusetts December 14, 2005
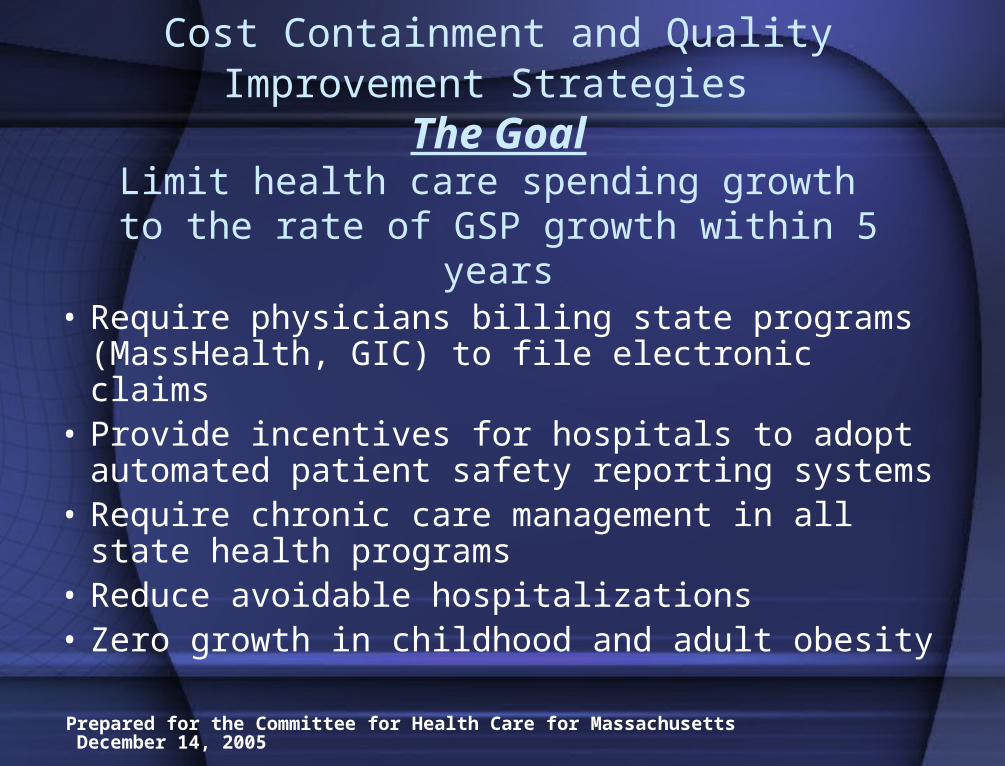
Cost Containment and Quality Improvement Strategies
The GoalLimit health care spending growth
to the rate of GSP growth within 5 years
• Require physicians billing state programs (MassHealth, GIC) to file electronic claims
• Provide incentives for hospitals to adopt automated patient safety reporting systems
• Require chronic care management in all state health programs
• Reduce avoidable hospitalizations• Zero growth in childhood and adult obesity

Prepared for the Committee for Health Care for Massachusetts December 14, 2005
Potential Savings from Cost Containment and Quality Improvement Strategies
Strategies Savings inBillions
1. 100% electronic physician claims $0.22. Automated hospital patient safety reporting $0.8 systems with peer protected information3. Chronic care management – all state programs $1.04. Reduce avoidable hospitalizations $0.15. Zero growth in childhood/adult obesity $0.1TOTAL $2.2% of current spending 4.0%

Prepared for the Committee for Health Care for Massachusetts December 14, 2005
Costs and Savings
• Cost of care for the newly insured depends on key policy choices, particularly the extent and structure of subsidies
• Total federal/state costs to expand coverage is from $1.1 to $1.5 billion after reallocating existing spending for the uninsured and underinsured
• Full implementation of quality and efficiency initiatives saves $2.2 billion
• Net savings of $700 million to $1.1 billion in the first year

Prepared for the Committee for Health Care for Massachusetts December 14, 2005
Option 3
Universal Coverage through Public System Expansion with Reforms to Contain
Costs and Improve Quality

Prepared for the Committee for Health Care for Massachusetts December 14, 2005
What Happens?
• Health care spending drops by $6 billion in 2006
• Health care spending is 13% lower by 2015 than it would be without reform
• The number of uninsured and underinsured drops to virtually zero
• Health care spending consumes even less household income and gross state product than under Option 2

Prepared for the Committee for Health Care for Massachusetts December 14, 2005
Modeling Assumptions• All residents of Massachusetts receive coverage
similar to the Blue Cross Blue Shield standard option plan
• MassHealth remains unchanged• Commonwealth creates publicly financed plan for
all Massachusetts residents• Workers pay 25% and employers pay 75% of cost
of coverage• Sliding scale contribution rates for workers earning
between 150% and 300% of poverty and for small and low-margin employers
• Individuals and families under 150% of poverty would not contribute towards the cost of coverage

Prepared for the Committee for Health Care for Massachusetts December 14, 2005
Exhibit 14. Option 3 Costs and Savings, 2006 (in billions)
2006 Spending on Personal Health Care & Administration
Change in Spending under Single Payer Plan
Spending with Single Payer Coverage
Total Spending $55.1 ($6.2) $48.9
Increased Utilization Among Uninsured
Change in Administrative Costs, Total
$12.3
$1.4
($5.4)
Insurer Administration
Hospital Administration
Physician Administration
$3.8
$3.0
$5.5
($2.8)
($0.6)
($2.0)
Cost Containment and Quality Improvement Strategies
- ($2.2)
Total Savings ($6.2)
Prepared for the Committee for Health Care for Massachusetts December 14, 2005
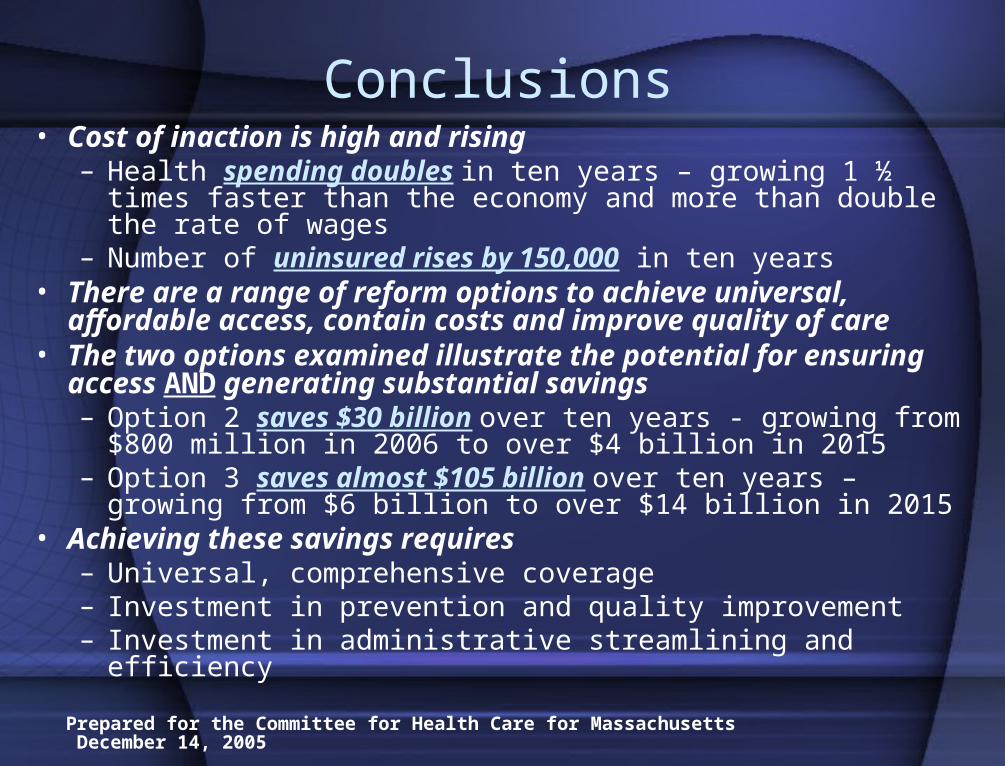
Conclusions• Cost of inaction is high and rising
– Health spending doubles in ten years – growing 1 ½ times faster than the economy and more than double the rate of wages
– Number of uninsured rises by 150,000 in ten years• There are a range of reform options to achieve universal,
affordable access, contain costs and improve quality of care• The two options examined illustrate the potential for ensuring
access AND generating substantial savings– Option 2 saves $30 billion over ten years - growing from $800
million in 2006 to over $4 billion in 2015 – Option 3 saves almost $105 billion over ten years – growing
from $6 billion to over $14 billion in 2015• Achieving these savings requires
– Universal, comprehensive coverage– Investment in prevention and quality improvement– Investment in administrative streamlining and efficiency