prepared for isilon systems june 30, 2008 the total...
TRANSCRIPT

Prepared for Isilon Systems June 30, 2008
The Total Economic Impact Of Isilon’s Clustered Storage System
Project Director: Shaheen Parks
The Total Economic Impact Of Isilon’s Clustered Storage System
TABLE OF CONTENTS Executive Summary ...............................................................................................................................4
Purpose ..............................................................................................................................................4
Methodology.......................................................................................................................................4
Approach............................................................................................................................................5
Key Findings ......................................................................................................................................5
Disclosures.........................................................................................................................................6
Isilon Systems Clustered Storage: Overview ........................................................................................7
Introduction to Clustered Storage......................................................................................................7
The Isilon Solution .............................................................................................................................7
Analysis...................................................................................................................................................8
Interview Highlights............................................................................................................................8
TEI Framework ................................................................................................................................10
Costs ................................................................................................................................................11
Benefits ............................................................................................................................................16
Risk...................................................................................................................................................21
Flexibility...........................................................................................................................................22
TEI Framework: Summary...............................................................................................................22
Study Conclusions................................................................................................................................25
Appendix A: Total Economic Impact™ Overview ...............................................................................26
Benefits ............................................................................................................................................26
Costs ................................................................................................................................................26
Risk...................................................................................................................................................26
Flexibility...........................................................................................................................................26
- 2 -

The Total Economic Impact Of Isilon’s Clustered Storage System
Appendix B: Glossary...........................................................................................................................27
Appendix C: About The Project Manager............................................................................................28
© 2008, Forrester Research, Inc. All rights reserved. Forrester, Forrester Wave, RoleView, Technographics, TechRadar, and Total Economic Impact are trademarks of Forrester Research, Inc. All other trademarks are the property of their respective companies. Forrester clients may make one attributed copy or slide of each figure contained herein. Additional reproduction is strictly prohibited. For additional reproduction rights and usage information, go to www.forrester.com. Information is based on best available resources. Opinions reflect judgment at the time and are subject to change.
- 3 -

The Total Economic Impact Of Isilon’s Clustered Storage System
Executive Summary In March 2008, Isilon Systems commissioned Forrester Consulting to examine the total economic impact and return on investment (ROI) that enterprises may realize by deploying clustered storage. Clustered file storage allows organizations to easily and effectively scale their storage capacity for unstructured data and is an alternative to traditional file storage. This study illustrates the financial impact of implementing clustered storage in a sample organization’s environment.
In conducting in-depth interviews with four Isilon customers, Forrester found that these companies achieved benefits including lower upfront costs, fewer administrative resources, less training and professional services, and cost avoidance of traditional storage media. Due to advantages associated with Isilon’s architecture, organizations were able to reduce the overall volume of storage required. Additionally, organizations were able to leverage Isilon’s architecture to support their business in ways which, in some cases, were not possible with traditional storage, allowing them to accomplish new business imperatives.
The study concluded that on average, the interviewed Isilon customers achieved the following benefits over traditional storage solutions:
• 97% reduction in management resources (from six full-time resources to 15% of one resource).
• 22% increase in storage utilization (Isilon’s average utilization is 82%, as compared with traditional storage at 60%); this results, for an environment of the size used in this study, in a 37% decrease in the volume of storage capacity required (300 Terabyes with Isilon, as compared with 410 with traditional storage).
The overall result of these advantages was a risk-adjusted ROI of 125% and a payback period within five months.
Purpose The purpose of this study is to provide readers with a framework to evaluate the potential financial impact of clustered storage on their organizations. Forrester’s aim is to clearly show all calculations and assumptions used in the analysis. Readers should use this study to better understand and communicate a business case for investing in Isilon Systems’ clustered storage.
Methodology Isilon Systems selected Forrester for this project because of its industry expertise in storage technology and Forrester’s Total Economic Impact™ (TEI) methodology. TEI not only measures costs and cost reduction (areas that are typically accounted for within IT) but also weighs the enabling value of a technology in increasing the effectiveness of overall business processes.
For this study, Forrester employed four fundamental elements of TEI in modeling clustered storage:
1. Costs and cost reduction.
2. Benefits to the entire organization.
3. Risk.
- 4 -

The Total Economic Impact Of Isilon’s Clustered Storage System
4. Flexibility.
Given the increasing sophistication that enterprises have regarding cost analyses related to IT investments, Forrester’s TEI methodology serves an extremely useful purpose by providing a complete picture of the total economic impact of purchase decisions. Please see Appendix A for additional information on the TEI methodology.
Approach Forrester used a five-step approach for this study:
1. Forrester gathered data from existing Forrester research relative to Isilon’s clustered storage and the storage market in general.
2. Forrester interviewed Isilon marketing and sales personnel to fully understand the potential (or intended) value proposition of the Isilon clustered storage solutions.
3. Forrester conducted a series of in-depth interviews with four organizations currently using Isilon Systems’ clustered storage solutions.
4. Forrester constructed a financial model representative of the interviews. This model can be found in the TEI Framework section below.
5. Forrester created a composite organization based on the interviews and populated the framework using data from the interviews as applied to the composite organization.
Key Findings Forrester’s study yielded several key findings:
• ROI. Based on the interviews with the four Isilon customers, Forrester constructed a TEI framework for a composite organization and the associated ROI analysis illustrating the financial impact areas. As seen in Table 1, the risk-adjusted ROI for our composite company is 125% with a breakeven point (payback period) of approximately five months after deployment.
• Benefits. The net present value of the risk-adjusted benefits included in the financial analysis is approximately $4.1 million. This includes benefits associated with the size of the storage environment, reduced cost of administration, and the cost avoidance of professional services and training often associated with alternate solutions.
• Costs. The net present value of the risk-adjusted costs included in the financial model is approximately $1.8 million; this includes the cost of the Isilon solution, planning, administration, training, and the cost of the network upgrade required.
Table 1 illustrates the risk-adjusted cash flow for the composite organization, based on data and characteristics obtained during the interview process. Forrester risk-adjusts these values to take into account the potential uncertainty that exists in estimating the costs and benefits of a technology investment. The risk-adjusted value is meant to provide a conservative estimation, incorporating any potential risk factors that may later impact the original cost and benefit estimates. For a more in-depth explanation of risk and risk adjustments used in this study, please see the Risk section.
- 5 -

The Total Economic Impact Of Isilon’s Clustered Storage System
Table 1: Composite Company ROI, Risk-Adjusted
Summary financial results Original estimate Risk-
adjusted ROI 142% 125% Payback period (years) 0.4 0.4 Total costs (PV) ($1,839,599) ($1,841,731) Total benefits (PV) $4,450,684 $4,147,796 Total (NPV) $2,611,085 $2,306,065
Source: Forrester Research, Inc.
A major driver of the return on investment experienced by the organization was the volume of storage required. As the environments became larger, the benefit accrued from Isilon’s higher utilization rate grew as well.
Disclosures The reader should be aware of the following:
• The study was commissioned by Isilon Systems and delivered by the Forrester Consulting group.
• Isilon Systems reviewed and provided feedback to Forrester, but Forrester maintained editorial control over the study and its findings and did not accept changes to the study that contradicted Forrester’s findings or obscured the meaning of the study.
• The customer names for the interviews were provided by Isilon Systems.
• Forrester makes no assumptions as to the potential return on investment that other organizations will receive. Forrester strongly advises that readers should use their own estimates within the framework provided in the report to determine the appropriateness of an investment in Isilon Systems’ clustered storage.
• This study is not meant to be used as a competitive product analysis.
- 6 -

The Total Economic Impact Of Isilon’s Clustered Storage System
Isilon Systems Clustered Storage: Overview Introduction To Clustered Storage Clustered storage refers to storage systems that are based on a “scale-out” as opposed to “scale-up” architecture. Scale-up storage is the traditional architecture that is dominant in the enterprise space, characterized by extremely high performance, high availability single systems that have a fixed capacity ceiling. Scale-out architecture goes in a different direction, using many nodes with moderate availability and performance characteristics to produce a total system with very good aggregate performance and availability characteristics, high ease of use, low cost, and theoretically unlimited scalability. While many commercially available and proprietary clustered storage options are in use today with a variety of configurations, most rely on industry standard server nodes with a clustered storage operating system that manages the cluster as a unified whole.
The Isilon Solution The Isilon storage product is a clustered architecture, file-based system used in environments that require high levels of scalability and ease of use for the storage of large volumes of files. File-based storage refers to storage devices that natively support standard file access protocols, like CIFS or NFS. As opposed to block-based storage systems that require an application or server to interpret blocks on disk, a file-based storage system allows users and applications to access files directly, without the use of a gateway server. A clustered architecture means that multiple independent hardware nodes are joined together with clustering software that allows them to be treated as a consistent whole. In the case of Isilon, industry standard X86 servers are connected via an Inifiniband switch. A proprietary operating system, OneFS, manages the operation of the cluster. To scale the system, new nodes are added, and the operating system software re-optimizes the data layout to take advantage of the new nodes. Cache is shared globally among the nodes, and input/output requests can be handled by any of the nodes and then served from multiple nodes; so as the system scales, aggregate performance is improved. Nodes of different ages and sizes can be intermixed, allowing a cluster to be scaled over time without the replacement of previously installed nodes. Accelerator nodes that do not contain hard drives can be added to the system, which increase cache, CPU, and I/O capabilities for the existing storage nodes in the cluster. In addition to the scalability features of the Isilon system, the OneFS operating system also provided a graphical user interface for system management, reporting capabilities, replication, thin provisioning, and other core storage management capabilities.
Traditional file storage systems that are not clustered have a fixed scalability limit. Once the files have filled the maximum capacity of the system, a new system must be added that is not consistent with the previous user access path. As a result, there is significant administrative effort required to migrate data and user behavior change associated with large scale growth of data in a non-clustered file storage system. Such systems are also less automated in general, requiring more intervention by an administrator for activities such as provisioning and capacity optimization. The main value propositions of a clustered file storage system compared to a traditional file storage system include:
1. High level of scalability.
2. Ease of use enabling effective scaling and management without excessive resource commitment.
3. Linear scalability allowing for any element of storage performance to be scaled independently of other elements, such as disk capacity, cache, I/O bandwidth and CPU.
- 7 -

The Total Economic Impact Of Isilon’s Clustered Storage System
Analysis As stated in the Executive Summary, Forrester took a multistep approach to evaluate the impact that implementing clustered storage can have on an organization:
• Interviews with Isilon marketing and sales personnel.
• In-depth interviews of four organizations currently using clustered storage.
• Construction of a common financial framework for the implementation of clustered storage.
• Construction of a composite organization based on characteristics of the interviewed organizations.
Interview Highlights A total of four interviews were conducted for this study, involving representatives from the following companies (Isilon customers based in the United States):
1. A research facility engaging in proteomics-based cancer research that combines data from many sources, including clinical mass spectroscopy and genomic data. The data is used to target and develop drug therapies for prostate cancer. The combination of advanced clinical research and blood and gene analysis all stored on an intelligent clustered storage system allows researchers at the facility to correlate clinical observations with data from endeavors such as the Human Genome Project to develop highly effective and targeted therapies for patients.
2. A leading global provider of business information solutions to professionals in a variety of areas, including: legal, corporate, government, law enforcement, tax, accounting, academic, and risk and compliance assessment. Across the world, the organization provides customers with access to five billion searchable documents from more than 40,000 legal, news, and business sources.
3. An online digital photo sharing service. The company Web site provides consumers with a secure and easy way to view, store, and share their photos with friends and family, as well as providing an opportunity to order real prints of their pictures. The site also provides free editing, creative tools, and specialty photo products.
4. A global producer of large and small jet engines for commercial and military aircrafts. The organization also supplies aircraft-derived engines for marine applications and provides aviation services. Isilon is used in conjunction with an HPC Computing application for jet engine testing, which stores jet engine testing data files on Isilon systems.
The composite organization had an extensive storage environment with approximately 300 Terabytes of capacity. This volume was divided over several types of Isilon nodes, which were assumed to be purchased over a three-year period.
The four in-depth interviews uncovered that:
• Isilon’s structure allowed for growth and flexibility in a way that traditional storage did not. One interviewed customer revealed that a single business event can generate more than
- 8 -

The Total Economic Impact Of Isilon’s Clustered Storage System
60 gigabytes of file data; and that tens of thousands of these events have already generated such files. This customer said, “It would have killed us to maintain that data on our older storage system. We wouldn’t have been able to use it.”
• All of the interviewed customers found the Isilon implementation to be extremely simple and fast. One customer described the Isilon implementation as “a very pleasurable experience. It took more time to cable the system than to configure it.”
• All of the interviewed customers reported using fewer people to manage their storage systems than what they had used previously, or what they estimate they could have used instead of the Isilon product. The additional resources required if using traditional storage ranged from four to eight people, depending on the specific environment.
- 9 -
The Total Economic Impact Of Isilon’s Clustered Storage System
TEI Framework
Introduction From the information provided in the in-depth interviews, Forrester has constructed a TEI framework for those organizations considering implementation of clustered storage. The objective of the framework is to identify the cost, benefit, flexibility, and risk factors that impact the investment decision.
Composite Organization Based on the interviews with the four customers provided by Isilon Systems, Forrester constructed a TEI framework, a composite company, and an associated ROI analysis that illustrates the areas impacted financially. The composite organization that Forrester synthesized from these results represents an organization with a storage environment of approximately 300 TB. This is divided over several types of Isilon nodes, with the acquisition of these nodes happening over a period of three years.
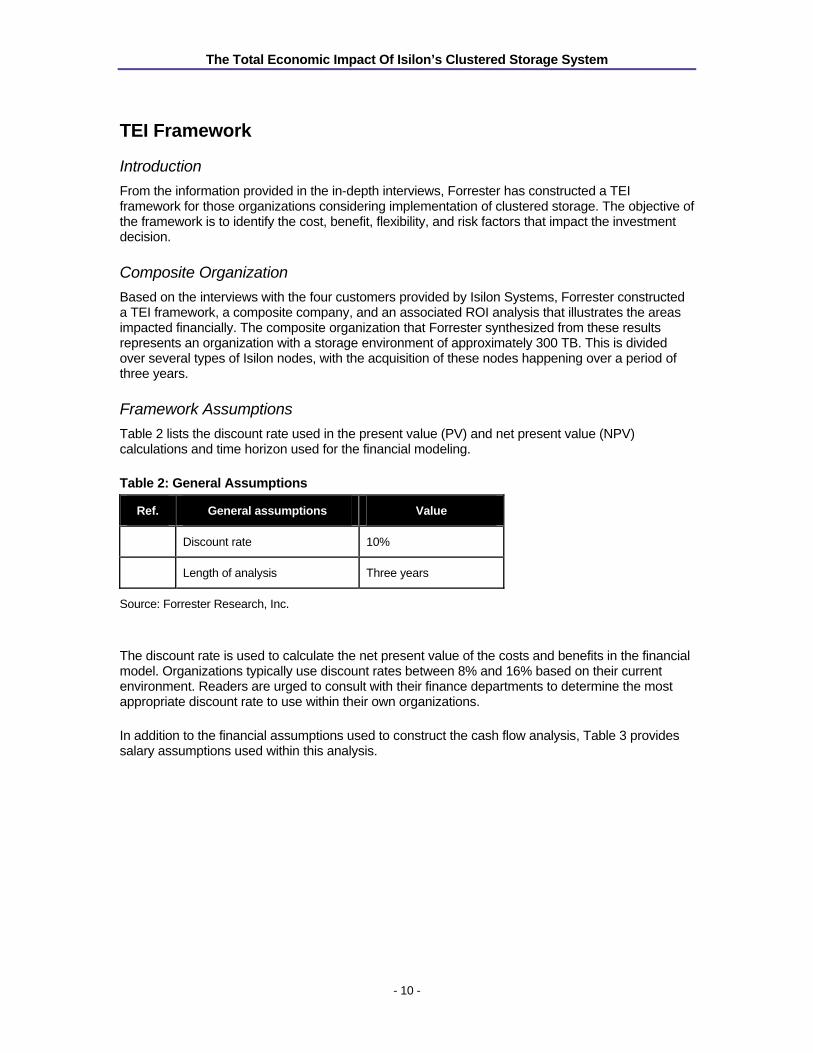
Framework Assumptions Table 2 lists the discount rate used in the present value (PV) and net present value (NPV) calculations and time horizon used for the financial modeling.
Table 2: General Assumptions
Ref. General assumptions Value
Discount rate 10%
Length of analysis Three years
Source: Forrester Research, Inc.
The discount rate is used to calculate the net present value of the costs and benefits in the financial model. Organizations typically use discount rates between 8% and 16% based on their current environment. Readers are urged to consult with their finance departments to determine the most appropriate discount rate to use within their own organizations.
In addition to the financial assumptions used to construct the cash flow analysis, Table 3 provides salary assumptions used within this analysis.
- 10 -

The Total Economic Impact Of Isilon’s Clustered Storage System
Table 3: Salary Assumptions
Ref. Metric Calculation Value
A1 Hours per week 40
A2 Weeks per year 52
A3 Hours per year (M-F, 9-5) 2,080
A4 Hours per year (24x7) 8,736
A5 Administrator $100,000
A6 Hourly (A5/A3) $48
Source: Forrester Research, Inc.
Costs As mentioned previously, the costs included in this financial analysis are the costs of the Isilon system itself, the planning, administration, and training costs, and the cost of network upgrades, which were associated with the Isilon implementation. Each of these costs is detailed in the sections below.
Isilon Costs The costs below are of the complete Isilon system, including the following storage node models: 1920, 3000, 6000, and 9000. The naming of the nodes references the disk capacity of each node type in Terabytes; the 1920 node holds 1.9 TB, the 3000 3.0 TB, the 6000 6.0 TB and the 9000 9.0 TB. The costs are “all in” cost per node for each node type; the per node cost listed includes the cost of the hardware, software, and support for each type of node (Table 3) as well as the cost of the InfiniBand interconnect network used to pass data traffic among the nodes (Table 4). It should be noted that the distribution over the three years of the analysis represents the organization’s ability to add capacity when it needs it. Additionally, the move towards the larger capacity nodes models the organization’s ability to add newer offerings while continuing to use the older ones, combining both into the same environment. The costs listed below are list prices with a discount of 20% applied to the total. The total cost of the system is $1,814, 924; the InfiniBand adds an additional $159,300.
- 11 -

The Total Economic Impact Of Isilon’s Clustered Storage System
Table 3: Isilon Costs
Ref. Metric Calculation Initial Year 1 Year 2 Year 3 Total
B1 Number of 1920 16
B2 Cost per 1920 $25,696
B3 Number of 3000 12 12
B4 Cost per 3000 $29,794
B5 Number of 6000 6 12 6
B6 Cost per 6000 $36,453
B7 Number of 9000 6
B8 Cost per 9000 $44,600
B9 Discount 20%
Bt Isilon license cost
(1-B9)*(B1*B2+
B3*B4+B5*B6
+B7*B8)
$789,898 $635,970 $389,056
Bto Total (original) ($789,898) $0 ($635,970) ($389,056) ($1,814,924)
Source: Forrester Research
Table 4: InfiniBand Costs
Ref. Metric Calculation Per period
C1 72 Port IB switch cost $79,650
C2 Number of switches 2
Ct InfiniBand switch cost C1*C2 $159,300
Source: Forrester Research
- 12 -
The Total Economic Impact Of Isilon’s Clustered Storage System
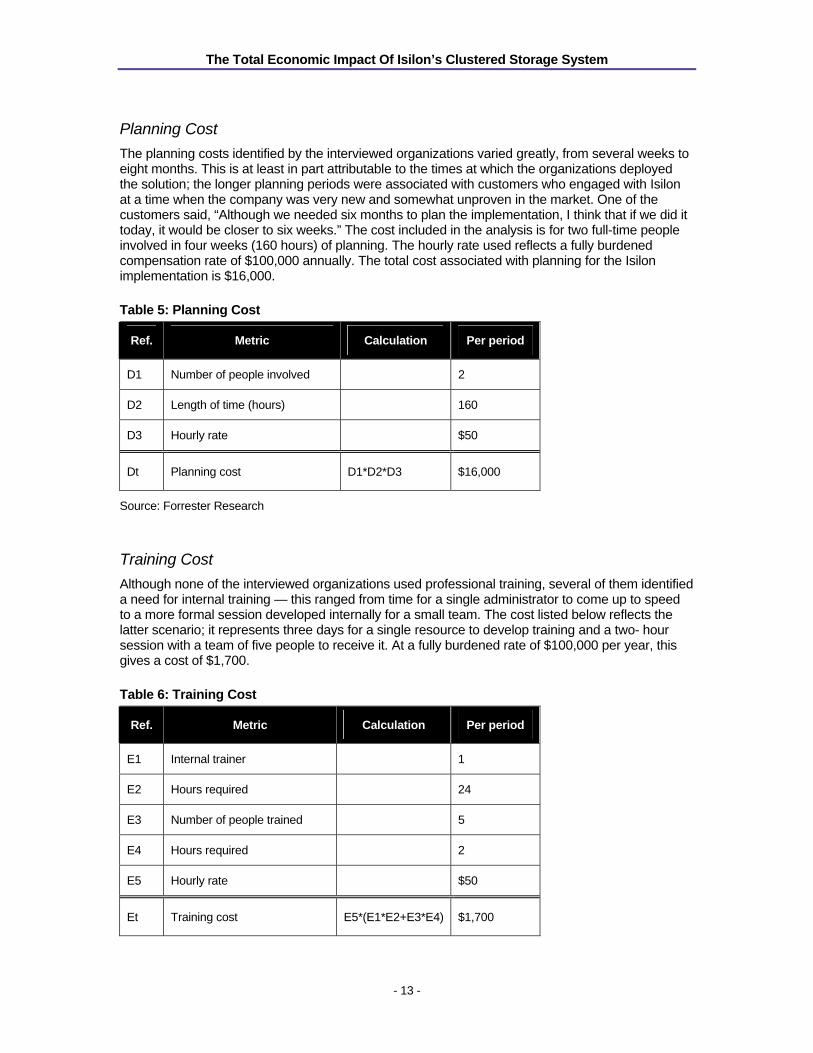
Planning Cost The planning costs identified by the interviewed organizations varied greatly, from several weeks to eight months. This is at least in part attributable to the times at which the organizations deployed the solution; the longer planning periods were associated with customers who engaged with Isilon at a time when the company was very new and somewhat unproven in the market. One of the customers said, “Although we needed six months to plan the implementation, I think that if we did it today, it would be closer to six weeks.” The cost included in the analysis is for two full-time people involved in four weeks (160 hours) of planning. The hourly rate used reflects a fully burdened compensation rate of $100,000 annually. The total cost associated with planning for the Isilon implementation is $16,000.
Table 5: Planning Cost
Ref. Metric Calculation Per period
D1 Number of people involved 2
D2 Length of time (hours) 160
D3 Hourly rate $50
Dt Planning cost D1*D2*D3 $16,000
Source: Forrester Research
Training Cost Although none of the interviewed organizations used professional training, several of them identified a need for internal training — this ranged from time for a single administrator to come up to speed to a more formal session developed internally for a small team. The cost listed below reflects the latter scenario; it represents three days for a single resource to develop training and a two- hour session with a team of five people to receive it. At a fully burdened rate of $100,000 per year, this gives a cost of $1,700.
Table 6: Training Cost
Ref. Metric Calculation Per period
E1 Internal trainer 1
E2 Hours required 24
E3 Number of people trained 5
E4 Hours required 2
E5 Hourly rate $50
Et Training cost E5*(E1*E2+E3*E4) $1,700
- 13 -

The Total Economic Impact Of Isilon’s Clustered Storage System
Source: Forrester Research
Administration Cost The administration cost of the Isilon systems was minimal for all of the interviewees, and varied from several hours a week to approximately 50% of a resource’s time for the largest organization. For an environment of the size of the composite organization, Forrester estimates that Isilon administration would require approximately 15% of a full-time resource; this gives an annual cost of $15,000.
- 14 -

The Total Economic Impact Of Isilon’s Clustered Storage System
Table 7: Administration Cost
Ref. Metric Calculation Per period
F1 Number of FTEs 1
F2 Percentage of time required 15%
F3 Annual rate $100,000
Ft Administration cost F1*F2*F3 $15,000
Source: Forrester Research
Network Upgrade Cost In order to implement the Isilon system, a number of additional ports must be added to the network. This is estimated to be an average of one port per node. In this analysis, the composite organization has a total of 70 nodes, requiring 70 ports. At a cost of $250 per port, this gives a total cost of $17,500.
Table 8: Network Upgrade Cost
Ref. Metric Calculation Per period
G1 Number of nodes 70
G2 Number of ports per node 1
G3 Cost per port $250
Gt Network upgrade cost G1*G2*G3 $17,500
Source: Forrester Research
Total Costs The following table lists a summary of the costs included in this analysis.
- 15 -

The Total Economic Impact Of Isilon’s Clustered Storage System
Table 9: Total Costs
Cash Flow Analysis (Original Estimates)
Costs Initial Year 1 Year 2 Year 3 Total Present value
Isilon license cost (789,898) (635,970) (389,056) (1,814,924) (1,607,797)
InfiniBand switch cost (159,300) (159,300) (159,300)
Planning cost (16,000) (16,000) (16,000)
Training cost (1,700) (1,700) (1,700)
Administration cost (15,000) (15,000) (15,000) (45,000) (37,303)
Network upgrade cost (17,500) (17,500) (17,500)
Total ($984,398) ($15,000) ($650,970) ($404,056) ($2,054,424) ($1,839,599)
Source: Forrester Research
Benefits The benefits included in the financial analysis are detailed in the sections below. All of these benefits are cost avoidance benefits, which represent costs that would have been incurred with an alternate solution. These benefit areas were all identified during the customer interviews; in some cases, Forrester used estimates based on overall market rates to quantify the benefits.
Comparable Cost Of Alternate Solution As storage is a requirement for almost any business, this study includes a comparable cost of storage for an alternate solution. Based on Forrester’s knowledge of the overall market, this is estimated at a cost of $10 per GB, or $10,000 per TB. As this analysis includes a 20% discount on the Isilon pricing, a comparable 20% discount on the market pricing gives a comparable cost of $8,000 per TB. For the composite organization’s environment of 300 TB, the total cost avoidance is $2,400,000.
This cost has been spread evenly across the three years of the analysis so that it appears as $800,000 in each year.
- 16 -

The Total Economic Impact Of Isilon’s Clustered Storage System
Table 10: Comparable Cost Of Alternate Solution
Ref. Metric Calculation Year 1
H1 Cost per TB $8,000
H2 Number of TB 300
Ht Comparable cost of alternative solution H1*H2 $2,400,000
Hto Total (original) $2,400,000
Source: Forrester Research
Cost Avoidance Of Additional Resources All of the customers interviewed for this study projected that with a traditional storage solution, they would need additional resources to manage the storage environment. The actual number of additional staff required varied based on the volume of storage that each organization possessed. For the composite organization, Forrester estimates an increase in staff of six resources, using a rate of one full-time resource per 50 TB managed. At a fully burdened rate of $100,000, this gives an annual savings of $600,000.
Table 11: Additional Resources Not Required
Ref. Metric Calculation Per period
I1 Number of staff 6
I2 Annual rate $100,000
IIt Resources not required I1*I2 $600,000
Source: Forrester Research
Cost Avoidance Of Professional Services Several of the interviewees identified, either from past experience or projected situations, that with alternate solutions, a significant investment in professional services would be required; this investment in professional services was unnecessary for users of the Isilon system. Based on Forrester’s market expertise, the amount of professional services required for an environment of this size would total approximately $150,000.
- 17 -

The Total Economic Impact Of Isilon’s Clustered Storage System
Table 12: Cost Avoidance Of Professional Services
Ref. Metric Calculation Year 1
J1 Professional services cost avoidance $150,000
Source: Forrester Research
Cost Avoidance Of Additional Storage Capacity All of the interviewees stated that with a traditional storage environment, they would have a lower utilization rate of the storage capacity, and therefore require a larger total capacity. This, in turn, has an associated cost, depending on the extra capacity required. The interviewed organizations estimated this extra capacity at anywhere from 10% to 100% of their current environment; this means that for one organization, it estimated that it would require an environment with double its current storage capacity!
In order to calculate the volume of additional storage which would be required by the composite organization, two key factors were used: the Isilon utilization rate and the utilization rate of traditional storage. The Isilon rate used is 82% while the rate for traditional storage is 60%. The discrepancy between the two is related directly to the difference in Isilon’s architecture.
- 18 -

The Total Economic Impact Of Isilon’s Clustered Storage System
Table 13: Cost Avoidance Of Additional Storage Capacity
Ref. Metric Calculation Per period
K1 Total present capacity 300
K2 Average Isilon utilization 82%
K3 Total capacity utilized K1*K2 246
K4 Average traditional utilization 60%
K5 Total traditional required K3/K4 410
K6 Total additional capacity required K5-K1 110
K7 Cost per TB 8,000
Kt Additional storage capacity not required K6*K7 $880,000
Source: Forrester Research
Cost Avoidance Of Training None of the interviewed organizations required formal training from Isilon in order to use the systems, although a few organized some internal training for their staff. Comparable storage systems almost always require formal training, which has an associated cost. The training cost benefit included in the analysis represents the cost of three people receiving a week of training at a daily rate of $2,000. This gives a total cost of $30,000.
Table 14: Cost Avoidance Of Training
Ref. Metric Calculation Per period
L1 Number of people 3
L2 Number of days 5
L3 Cost per day $2,000
Lt Training cost avoidance L1*L2*L3 $30,000
Source: Forrester Research
Cost Avoidance Of Additional Ports In order to compare the Isilon implementation to a reasonable alternative, the cost of traditional storage was included in the benefits analysis as cost avoidance. This also encompasses the cost of the ports required with traditional storage, which is detailed in the table below. This cost is
- 19 -

The Total Economic Impact Of Isilon’s Clustered Storage System
structured differently from the Isilon port cost; for traditional storage, Forrester estimates a capacity of 50 TB/node, with four ports per node. This gives a total of 24 ports. At a cost of $250 per port, the total cost for the ports with a traditional storage solution is $6,000.
Table 15: Cost Avoidance Of Additional Ports
Ref. Metric Calculation Per period
M1 Number of TBs 300
M2 Number of nodes 6
M3 Ports per node 4
M4 Cost per port $250
Mt Cost avoidance of ports with alternate solution M2*M3*M4 $6,000
Source: Forrester Research
Power And Cooling Benefits While customers were not able to point to quantifiable improvements in the area of power and cooling, Forrester does recognize that these do exist. By increasing storage utilization, fewer disks are spinning, and therefore less power is consumed for the same amount of business data being stored. While most organizations today don’t measure the direct consumption of power to specific infrastructure components, this is becoming a more pressing issue with the rising cost of power resources in the data center, and Forrester believes that the next several years will see more attention paid to specific consumption of IT resources.
Total Benefits A summary of the benefits included in this analysis is contained in the table below.
- 20 -

The Total Economic Impact Of Isilon’s Clustered Storage System
Table 16: Total Benefits
Cash Flow Analysis (Original Estimates)
Benefits Initial Year 1 Year 2 Year 3 Total Present value
Comparable cost of alternative solution 800,000 800,000 800,000 2,400,000 1,989,482
Resources not required 600,000 600,000 600,000 1,800,000 1,492,111
Professional services cost avoidance 150,000 150,000 136,364
Additional storage capacity not required 880,000 880,000 800,000
Training cost avoidance 30,000 30,000 27,273
Cost avoidance of ports with alternate solution 6,000 6,000 5,455
Total $2,466,000 $1,400,000 $1,400,000 $5,266,000 $4,450,684
Source: Forrester Research
Risk Risk is the third component within the TEI model; it is used as a filter to capture the uncertainty surrounding different cost and benefit estimates. If a risk-adjusted ROI still demonstrates a compelling business case, it raises confidence that the investment is likely to succeed because the risks that threaten the project have been taken into consideration and quantified. The risk-adjusted numbers should be taken as “realistic” expectations, since they represent the expected values considering risk. In general, risks affect costs by raising the original estimates, and they affect benefits by reducing the original estimates.
For the purpose of this analysis, Forrester risk-adjusts cost and benefit estimates to better reflect the level of uncertainty that exists for each estimate. The TEI model uses a triangular distribution method to calculate risk-adjusted values. To construct the distribution, it is necessary to first estimate the low, most likely, and high values that could occur within the current environment. The risk-adjusted value is the mean of the distribution of those points.
For example, take the case of benefit attributable to reduced need for storage capacity. The $880,000 value, used in this analysis can be considered the “most likely” or expected value. However, this benefit will obviously vary based on specific utilization rates of each organization. This variability represents a risk that must be captured as part of this study. Forrester uses a risk factor of 105% on the high end, 100% as the most likely, and 85% on the low end. This has the effect of decreasing the benefit estimate to take into account the fact that original benefit estimates are more likely to be revised downward than upward. Forrester then creates a triangular distribution to reflect the range of expected costs, with 96.7% as the mean (96.7% is equal to the sum of 105%, 100%, and 85% divided by three). Forrester applies this mean to the most likely estimate, $880,000, to arrive at a risk-adjusted value of $850,960.
- 21 -

The Total Economic Impact Of Isilon’s Clustered Storage System
Different cost and benefits estimates have different levels of risk adjustments. For example, Forrester applied a higher risk weighting to the capacity benefit based on utilization rate as compared with licensing costs, in part due to the assumption that there is more variability in the capacity benefit estimate. Readers are urged to apply their own risk ranges based on their own degree of confidence in the cost and benefit estimates.
Risk adjustments for costs increase the original cost estimates. For example, Forrester applies a risk range of 110% on the high end of the estimate and 100% on the most likely and high end for the planning costs. This has the effect of reducing the benefit estimate by 3%, equal to 97% of the original value.
Flexibility Flexibility, as defined by TEI, represents an investment in additional capacity or capability that could be turned into business benefit for some future additional investment. Flexibility would also be quantified when evaluated as part of a specific project (described in more detail in Appendix A).
All of the organizations interviewed for this study stated that using Isilon made their businesses more flexible in that they could easily expand their storage to accommodate larger files of unstructured data. Although extremely valuable, this benefit is not quantified in the financial analysis. However, it is an important one to consider.
TEI Framework: Summary Considering the financial framework constructed above, the results of the costs, benefits, risk, and flexibility sections using the representative numbers can be used to determine a return on investment, net present value, and payback period. Table 17 shows the consolidation of the numbers for the composite organization.
Table 17: Composite Company ROI, Risk-Adjusted
Summary financial results Original estimate Risk-
adjusted
ROI 142% 125%
Payback period (years) 0.4 0.4
Total costs (PV) ($1,839,599) ($1,841,731)
Total benefits (PV) $4,450,684 $4,147,796
Total (NPV) $2,611,085 $2,306,065
Source: Forrester Research, Inc.
Tables 18 and 19 below show the risk-adjusted values, applying the risk adjustment method indicated in the Risks section above and the values from Tables 9 and 16 to the numbers in Tables 18 and 19.
- 22 -

The Total Economic Impact Of Isilon’s Clustered Storage System
Table 18: Risk-Adjusted Costs
Cash Flow Analysis (Risk-Adjusted Estimates)
Costs Initial Year 1 Year 2 Year 3 Total Present value
Isilon license cost (789,898) (635,970) (389,056) (1,814,924) (1,607,797)
InfiniBand switch cost (159,300) (159,300) (159,300)
Planning cost (16,267) (16,267) (16,267)
Training cost (1,700) (1,700) (1,700)
Administration cost (15,750) (15,750) (15,750) (47,250) (39,168)
Network upgrade cost (17,500) (17,500) (17,500)
Total ($984,665) ($15,750) ($651,720) ($404,806) ($2,056,941) ($1,841,731)
Source: Forrester Research
Table 19: Risk-Adjusted Benefits
Cash Flow Analysis (Risk Adjusted Estimates)
Benefits Initial Year 1 Year 2 Year 3 Total Present value
Comparable cost of alternative solution 786,667 786,667 786,667 2,360,000 1,956,324
Resources not required 533,333 533,333 533,333 1,600,000 1,326,321
Professional services cost avoidance 145,000 145,000 131,818
Additional storage capacity not required 770,667 770,667 700,606
Training cost avoidance 30,000 30,000 27,273
Cost avoidance of ports with alternate solution 6,000 6,000 5,455
Total $2,271,667 $1,320,000 $1,320,000 $4,911,667 $4,147,796
Source: Forrester Research
It is important to note that values used throughout the TEI Framework are based on in-depth interviews with four organizations and the resulting composite organization built by Forrester. Forrester makes no assumptions as to the potential return that other organizations will receive within their own environment. Forrester strongly advises that readers use their own estimates within
- 23 -

The Total Economic Impact Of Isilon’s Clustered Storage System
the framework provided in this study to determine the expected financial impact of implementing clustered storage.
- 24 -

The Total Economic Impact Of Isilon’s Clustered Storage System
Study Conclusions Forrester’s in-depth interviews with Isilon’s customers yielded several important observations:
• Based on information collected in interviews with current clustered storage customers, Forrester found that organizations can realize benefits in the form of lower hardware and software costs, lower administration costs, reduced training, and eliminated need for professional services.
• Of the customers interviewed, several factors contributed to the difference in ROIs. These factors included the volume of storage required and the nature of the storage requirements, based on the business needs of each organization.
The financial analysis provided in this study illustrates the potential way an organization can evaluate the value proposition of Isilon clustered storage systems. Based on information collected in four in-depth customer interviews, Forrester calculated a three-year risk-adjusted ROI of 125% for the composite organization with a payback period of approximately five months. All final estimates are risk-adjusted to incorporate potential uncertainty in the calculation of costs and benefits.
Based on these findings, companies looking to implement clustered storage can see cost savings and productivity benefits. Using the TEI framework, many companies may find the potential for a compelling business case to make such an investment.
- 25 -

The Total Economic Impact Of Isilon’s Clustered Storage System
Appendix A: Total Economic Impact™ Overview Total Economic Impact is a methodology developed by Forrester Research that enhances a company’s technology decision-making processes and assists vendors in communicating the value proposition of their products and services to clients. The TEI methodology helps companies demonstrate, justify, and realize the tangible value of IT initiatives to both senior management and other key business stakeholders.
The TEI methodology consists of four components to evaluate investment value: benefits, costs, risks, and flexibility. For the purpose of this analysis, the impact of flexibility was not quantified.
Benefits Benefits represent the value delivered to the user organization — IT and/or business units — by the proposed product or project. Often product or project justification exercises focus just on IT cost and cost reduction, leaving little room to analyze the effect of the technology on the entire organization. The TEI methodology and the resulting financial model place equal weight on the measure of benefits and the measure of costs, allowing for a full examination of the effect of the technology on the entire organization. Calculation of benefit estimates involves a clear dialogue with the user organization to understand the specific value that is created. In addition, Forrester also requires that there be a clear line of accountability established between the measurement and justification of benefit estimates after the project has been completed. This ensures that benefit estimates tie back directly to the bottom line.
Costs Costs represent the investment necessary to capture the value, or benefits, of the proposed project. IT or the business units may incur costs in the forms of fully burdened labor, subcontractors, or materials. Costs consider all the investments and expenses necessary to deliver the proposed value. In addition, the cost category within TEI captures any incremental costs over the existing environment for ongoing costs associated with the solution. All costs must be tied to the benefits that are created.
Risk Risk measures the uncertainty of benefit and cost estimates contained within the investment. Uncertainty is measured in two ways: the likelihood that the cost and benefit estimates will meet the original projections and the likelihood that the estimates will be measured and tracked over time. TEI applies a probability density function known as “triangular distribution” to the values entered. At a minimum, three values are calculated to estimate the underlying range around each cost and benefit.
Flexibility Within the TEI methodology, direct benefits represent one part of the investment value. While direct benefits can typically be the primary way to justify a project, Forrester believes that organizations should be able to measure the strategic value of an investment. Flexibility represents the value that can be obtained for some future additional investment building on top of the initial investment already made. For instance, an investment in an enterprisewide upgrade of an office productivity suite can potentially increase standardization (to increase efficiency) and reduce licensing costs. However, an embedded collaboration feature may translate to greater worker productivity if activated. The collaboration can only be used with additional investment in training at some future point in time. However, having the ability to capture that benefit has a present value that can be estimated. The flexibility component of TEI captures that value.
- 26 -

The Total Economic Impact Of Isilon’s Clustered Storage System
Appendix B: Glossary Discount rate: The interest rate used in cash flow analysis to take into account the time value of money. Although the Federal Reserve Bank sets a discount rate, companies often set a discount rate based on their business and investment environment. Forrester assumes a yearly discount rate of 10% for this analysis. Organizations typically use discount rates between 8% and 16% based on their current environment. Readers are urged to consult their organization to determine the most appropriate discount rate to use in their own environment.
Net present value (NPV): The present or current value of (discounted) future net cash flows given an interest rate (the discount rate). A positive project NPV normally indicates that the investment should be made, unless other projects have higher NPVs.
Present value (PV): The present or current value of (discounted) cost and benefit estimates given at an interest rate (the discount rate). The PV of costs and benefits feed into the total net present value of cash flows.
Payback period: The breakeven point for an investment, or the point in time at which net benefits (benefits minus costs) equal initial investment or cost.
Return on investment (ROI): A measure of a project’s expected return in percentage terms. ROI is calculated by dividing net benefits (benefits minus costs) by costs.
A Note On Cash Flow Tables The following is a note on the cash flow tables used in this study (see the Example Table below). The initial investment column contains costs incurred at “time 0” or at the beginning of Year 1. Those costs are not discounted. All other cash flows in Years 1 through 3 are discounted using the discount rate shown in Table 2 at the end of the year. Present value (PV) calculations are calculated for each total cost and benefit estimate. Net present value (NPV) calculations are not calculated until the summary tables and are the sum of the initial investment and the discounted cash flows in each year.
Example Table
Ref. Category Calculation Initial cost Year 1 Year 2 Year 3 Total
Source: Forrester Research, Inc.
- 27 -

The Total Economic Impact Of Isilon’s Clustered Storage System
Appendix C: About The Project Manager Shaheen Zojwalla Parks Senior Consultant
Shaheen is a consultant for Forrester’s Total Economic Impact products and services. The TEI methodology focuses on measuring and communicating the value of IT and business decisions and solutions and providing a return on investment (ROI) business case based on the costs, benefits, flexibility, and risk of investments.
Shaheen came to Forrester with experience in consulting, marketing, and sales. As a product manager in strategic marketing at Teradyne, Shaheen managed several new products and helped to develop the corporate strategy in the five-year company plan. She also worked on sales analytics and set the quota levels for the North American sales force. Prior to joining Teradyne, she worked as a software consultant for Lucent Technologies, in the Kenan Systems group, where she implemented billing and customer care software for large telecommunications firms.
Shaheen holds a B.A. in mechanical engineering and materials science from Harvard University, an M.S. in materials science engineering from the Massachusetts Institute of Technology, and an M.B.A. from the MIT Sloan School of Management.
- 28 -