prepared by david s. anderson, ph.d. professor of education and human development george mason...
TRANSCRIPT

DRUG AND ALCOHOL TRENDS IN THE UNITED STATES
2011
VIRGINIA YOUTH ALCOHOL AND DRUG ABUSE PREVENTION PROJECT
Prepared byDavid S. Anderson, Ph.D.
Professor of Education and Human DevelopmentGeorge Mason University
Fairfax, Virginia
703-993-3698 [email protected] caph.gmu.edu

General Adult Population
General Usage Patterns

0
2500
5000
7500
10000
12500
15000
17500
20000
22500
25000
27500 Alcohol-Related Fatalities
National Highway Traffic Safety Administration

Alcohol-Related Traffic Fatalities, Rate per 100,000, Ages 18-20 vs. 21-24, United States, 1982-2007
0
5
10
15
20
25
30
35
1982 1984 1986 1988 1990 1992 1994 1996 1998 2000 2002 2004 2006
Source: U.S. Fatality Analysis Reporting System, 2009; U.S. Census Bureau, 2009
U.S. MLDA Age 21 law
MLDA 21 in all 50 states
Ages 18-20
↓60%
Ages 21-24
↓44%27.35 (n=4,733) 15.33
(n=2,583)
11.97 (n=1,520)
30.25 (n=3,867)
Data in initial NIAAA college report

"Although statistics on drug use in the United States are not fully reliable, the numbers available indicate that US consumption of cocaine and marijuana has been essentially stable for many years—although considerably reduced from its peak in the 1970s and 1980s. The data also show that, today, the United States consumes illegal substances at a rate some three times that of Europe—although the use of drugs in the EU continues to grow rapidly and a few countries actually consume more per capita than the United States. In both the United States and Europe, the wholesale and street prices of cannabis and cocaine have declined in the past several years, although reportedly their potency has increased and demand remains steady. Across the world, illicit drugs appear to be available at stable or declining prices. A recent EU Commission study concluded that global drug production and use remained largely unchanged during the period from 1998 through 2007.“Source:
Hakim, Peter, "Rethinking US Drug Policy," Inter-American Dialogue (Washington, DC: The Beckley Foundation, February, 2010), p. 4.http://www.thedialogue.org/uploads/Documents_and_PDFs/Documents_and_PDFs...

Percentage Change in Lifetime and Monthly Substance Use (ages 12 and older)
Percent Change
Lifetime Eight-Year
%chg 2002-2009
Lifetime Five-Year %chg 2002-2006
Monthly Eight-Year %chg 2002-2009
Monthly Five-Year %chg 2002-2006
ILLICIT DRUGS - ALL +9.7% +3.3% +11.7% +4.3%
Marijuana +10.0% +3.0% +14.6% +1.6%
Cocaine +7.9% +4.1% -19.0% +19.9%
Crack -0.5% +1.8% -13.2% +23.8%
Heroin +0.4% +3.2% +17.5% +103.6%
Hallucinogens +8.6% +2.8% +5.2% -15.9%
Ecstasy +40.2% +20.8% +12.4% -21.9%
Psychotherapeutics +8.0% +6.3% +10.6% +12.9%
Pain Relievers +18.4% +13.0% +20.1% +19.3%
Methamphetamine -16.5% -7.5% -26.5% +7.0%
Illicit-other-than-marijuana
+7.8% +3.7% +4.3% +9.5%
Alcohol +6.7% +4.1% +9.0% +4.6%
Alcohol – Heavy -- -- +8.0% +6.8%
Tobacco +1.3% +1.2% -2.5% +1.9%

Percentage Change in Monthly Substance Use(ages 12 and older)
Percent ChangeMonthly Eight-Year %chg
2002-2009 Monthly Five-Year %chg
2002-2006
ILLICIT DRUGS - ALL +11.7% +4.3%Marijuana +14.6% +1.6%Cocaine -19.0% +19.9%Crack -13.2% +23.8%
Heroin +17.5% +103.6%Hallucinogens +5.2% -15.9%
Ecstasy +12.4% -21.9%Psychotherapeutics +10.6% +12.9%
Pain Relievers +20.1% +19.3%Methamphetamine -26.5% +7.0%
Illicit-other-than-marijuana +4.3% +9.5%
Alcohol +9.0% +4.6%Alcohol – Heavy +8.0% +6.8%
Tobacco -2.5% +1.9%
http://www.drugwarfacts.org/cms/Drug_Usage#Change

Treatment Episode Data Set - Admissions (TEDS-A), 2008
http://www.icpsr.umich.edu/quicktables/quickoptions.do

Treatment Episode Data Set - Admissions (TEDS-A), 2008
http://www.icpsr.umich.edu/quicktables/quickoptions.do

High School and Middle School Youth
Patterns Linked to Start of Use Use Linked to Homework Checked by
Parents Use Linked to Involvement in Activities

0
5
10
15
20
25
30
35
40
45
50
8th 10th 12th
Grade
Pe
rce
nt
Us
ing
in P
as
t M
on
th
Alcohol
Cigarettes
Marijuana
Alcohol is the Substance of Choice Among Adolescents
Source: Monitoring the Future

Youth drink less frequently than adults, but drink more per occasion
Source: SAMHSA National Survey on Drug Use and Health, 2002
2.67
4.79
8.91
4.87
0
2
4
6
8
10
Youth Adults
Drinks per Occasion Drinking Days per Month
(12-17) (26 and older)

A number of information sources are used to quantify America’s drug problem and to monitor drug abuse trends. Foremost among these sources are the Monitoring the Future (MTF) survey* and the National Survey on Drug Use and Health** (NSDUH). Since 1975, the MTF survey has measured drug, alcohol, and cigarette use as well as related attitudes among adolescent students nationwide. For the 2010 survey, 46,482 students in 8th, 10th, and 12th grades from 396 public and private schools participated. Funded by NIDA, the MTF survey is conducted by investigators at the University of Michigan. The NSDUH is an annual survey on the nationwide prevalence and incidence of illicit drug, alcohol, and tobacco use, abuse, and dependence among Americans aged 12 years and older, conducted by the Substance Abuse and Mental Health Services Administration. Approximately 67,500 people are included in this survey. Because of differences in the timing of administration of the surveys, reported NSDUH data are 1 year behind those of MTF.In MTF and NSDUH, there are three primary prevalence periods for which data are reported: lifetime, past year, and past month (also referred to as “current”). It is generally believed that past year and past month are the better indicators of actual use. However, some analyses are done for only one specific prevalence period.
http://www.nida.nih.gov/infofacts/nationtrends.html
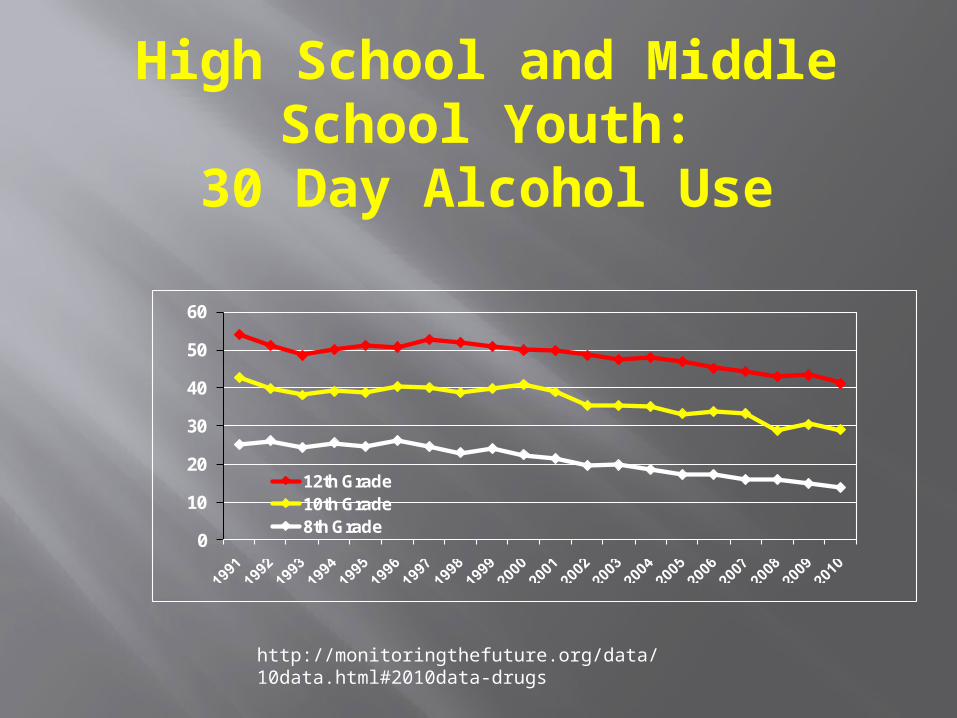
High School and Middle School Youth:
30 Day Alcohol Use
0
10
20
30
40
50
60
12th Grade10th Grade8th Grade
http://monitoringthefuture.org/data/10data.html#2010data-drugs

05
10152025303540 12th Grade
10th Grade8th Grade
High School and Middle School Youth:
Drunk in Last 30 Days
http://monitoringthefuture.org/data/10data.html#2010data-drugs

High School and Middle School Youth:
5 or more drinks in a row in last 2 weeks
0
5
10
15
20
25
30
35
12th Grade
10th Grade
8th Grade
http://monitoringthefuture.org/data/10data.html#2010data-drugs

High School and Middle School Youth: 30 Day Tobacco Use
0
5
10
15
20
25
30
35
40
12th Grade
10th Grade
8th Grade
http://monitoringthefuture.org/data/10data.html#2010data-drugs

High School and Middle School Youth:
Any illicit drug in last 30 days
0
5
10
15
20
25
30
12th Grade
10th Grade
8th Grade
http://monitoringthefuture.org/data/10data.html#2010data-drugs

High School and Middle School Youth:
Any illicit drug other than marijuana in last 30 days
0
5
10
15
20
2512th Grade
10th Grade
8th Grade
http://monitoringthefuture.org/data/10data.html#2010data-drugs

High School and Middle School Youth: 30 Day Marijuana Use
0
5
10
15
20
25
12th Grade
10th Grade
8th Grade
http://monitoringthefuture.org/data/10data.html#2010data-drugs

High School and Middle School Youth: 30 Day Ecstasy Use
-1
1
3
5
7
9
11
13
1512th Grade10th Grade8th Grade
http://monitoringthefuture.org/data/10data.html#2010data-drugs

High School and Middle School Youth: 30 Day Narcotics Use
-1
1
3
5
7
9
11
13
1512th Grade
10th Grade
8th Grade
http://monitoringthefuture.org/data/10data.html#2010data-drugs

High School and Middle School Youth: 30 Day Cocaine Use
-1
1
3
5
7
9
11
13
1512th Grade10th Grade8th Grade
http://monitoringthefuture.org/data/10data.html#2010data-drugs

High School and Middle School Youth: 30 Day Inhalant Use
-1
1
3
5
7
9
11
13
1512th Grade10th Grade8th Grade
http://monitoringthefuture.org/data/10data.html#2010data-drugs

High School and Middle School Youth: 30 Day LSD Use
-1
1
3
5
7
9
11
13
1512th Grade
10th Grade
8th Grade
http://monitoringthefuture.org/data/10data.html#2010data-drugs

High School and Middle School Youth: 30 Day Amphetamine Use
-1
1
3
5
7
9
11
13
15 12th Grade
10th Grade
8th Grade
http://monitoringthefuture.org/data/10data.html#2010data-drugs

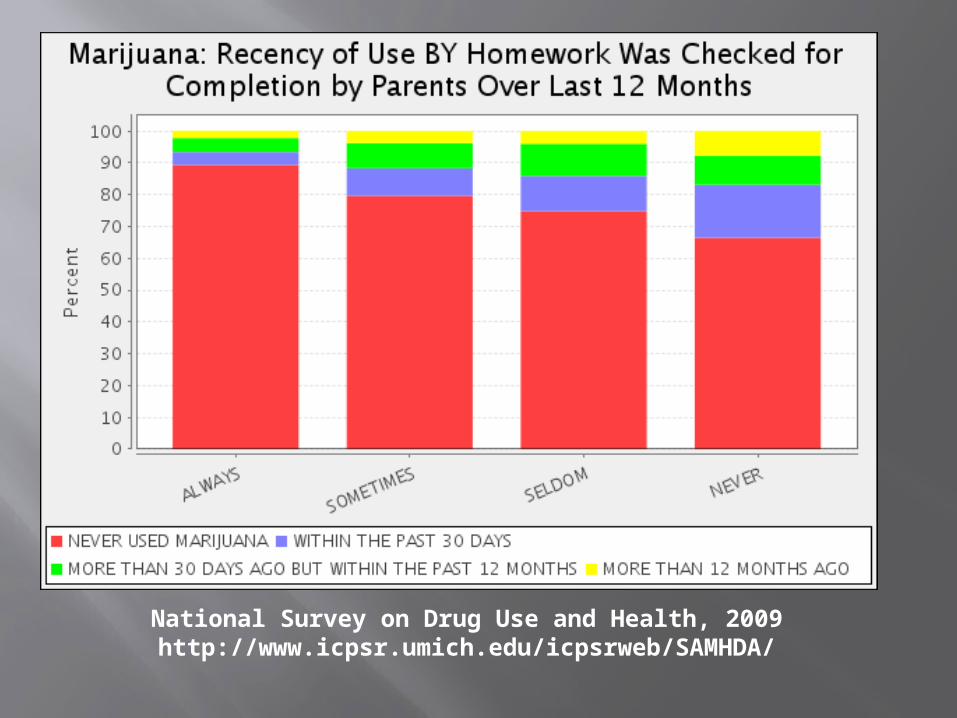
National Survey on Drug Use and Health, 2009http://www.icpsr.umich.edu/icpsrweb/SAMHDA/

National Survey on Drug Use and Health, 2009http://www.icpsr.umich.edu/icpsrweb/SAMHDA/

National Survey on Drug Use and Health, 2009http://www.icpsr.umich.edu/icpsrweb/SAMHDA/

National Survey on Drug Use and Health, 2009http://www.icpsr.umich.edu/icpsrweb/SAMHDA/

National Survey on Drug Use and Health, 2009http://www.icpsr.umich.edu/icpsrweb/SAMHDA/

National Survey on Drug Use and Health, 2009http://www.icpsr.umich.edu/icpsrweb/SAMHDA/

National Survey on Drug Use and Health, 2009http://www.icpsr.umich.edu/icpsrweb/SAMHDA/
National Survey on Drug Use and Health, 2009http://www.icpsr.umich.edu/icpsrweb/SAMHDA/

National Survey on Drug Use and Health, 2009http://www.icpsr.umich.edu/icpsrweb/SAMHDA/

National Survey on Drug Use and Health, 2009http://www.icpsr.umich.edu/icpsrweb/SAMHDA/

National Survey on Drug Use and Health, 2009http://www.icpsr.umich.edu/icpsrweb/SAMHDA/

According to NSDUH, overall prevalence of underage (ages 12–20) alcohol use and binge drinking has shown a gradual decline across all prevalence periods.In 2009, an estimated 30.2 million people (12.0 percent) aged 12 or older reported driving under the influence of alcohol at least once in the past year. Although this reflects a downward trend from 14.2 percent in 2002, it remains a cause for concern.
http://www.nida.nih.gov/infofacts/nationtrends.html
The decline in illicit drug use by the Nation’s adolescents since the mid- to late-1990s has leveled off. Among 8th, 10th, and 12th graders, most measures of illicit drug use remained unchanged from 2009 to 2010. Marijuana use rose this year—a sharp contrast to the considerable decline of the preceding decade. The downward trend in ecstasy use has been reversed as well, with significant increases this year following a considerable and recent decline in the belief that its use is dangerous.

Prescription and over-the-counter (OTC) medications accounted for most of the top drugs abused by 12th graders in the past year. Among 12th graders, past-year nonmedical use of Vicodin decreased from 9.7 percent to 8.0 percent. However, past-year nonmedical use of Oxycontin remained unchanged across the three grades and has increased among 10th graders over the past 5 years. Moreover, past-year nonmedical use of Adderall and OTC cough and cold medicines among 12th graders remained high at 6.5 percent and 6.6 percent, respectively.
Complete NSDUH findings are available at www.oas.samhsa.gov/NSDUHLatest.htm.

The Partnership at Drugfree.orghttp://www.drugfree.org/newsroom/new-research-teen-
drug-and-alcohol-use-headed-in-wrong-direction

Underage Drinking in EuropeAustria
BelgiumBulgariaCroatiaCyprus
Czech RepublicDenmark
EstoniaFarce Islands
FinlandFrance
GermanyGreece
GreenlandHungary
IcelandIreland
Isle of ManItaly
LatviaLithuania
MaltaNetherlands
NorwayPoland
PortugalRomania
RussiaSlovak Republic
SloveniaSweden
SwitzerlandTurkey
UkraineUK
USA
AustriaBelgiumBulgariaCroatiaCyprus
Czech RepublicDenmark
Estonia
FranceGermany
GreeceGreenland
IcelandIreland
Isle of ManItaly
LatviaLithuania
MaltaNetherlands
NorwayPoland
PortugalRomania
RussiaSlovak Republic
SwedenSwitzerland
TurkeyUkraine
UKSpainUSA
Slovenia
Percent of 15-Year Olds Who Drank to Intoxication in the Past 12 Months
Percent of 15-Year Olds Who Consumed an Alcoholic Beverage in
the Past 12 Months
ESPAD 2003
Farce IslandsFinland
Hungary
0 10 20 30 40 50 60 70 80 90 100 0 10 20 30 40 50 60 70 80 90 100

57
29
4645
18
47
73
424245
36
51
25
4348
62
28
4542
37 3635
40
32
25 26
40
50
4246
3740
32
58
35
0
10
20
30
40
50
60
70
80
Aus
tria
Bel
gium
Bul
garia
Cro
atia
Cyp
rus
Cze
ch R
epub
licD
enm
ark
Esto
nia
Faro
e Is
land
sFi
nlan
dFr
ance
Ger
man
yG
reec
eH
unga
ryIre
land
Isle
of M
anIta
lyLa
tvia
Lith
uani
aM
alta
Mon
aco
Net
herla
nds
Nor
way
Pola
ndPo
rtuga
lR
oman
iaR
ussi
aSl
ovak
Rep
ublic
Slov
enia
Spai
nSw
eden
Switz
erla
ndU
krai
neU
.K.
Uni
ted
Stat
es
Percent Drunk in Past Year, Students Ages 15-16, ESPAD 2007

Source: Grant and Dawson (1997) J. Substance Abuse

College Youth
General Usage Patterns Student-Athletes

TRADITIONAL-AGE COLLEGE STUDENTS:
ALCOHOL USE IN LAST 30 DAYS
0102030405060708090
100
http://monitoringthefuture.org/pubs/monographs/vol2_2009.pdf

TRADITIONAL-AGE COLLEGE STUDENTS:
DRUNK IN LAST 30 DAYS
05
101520253035404550
http://monitoringthefuture.org/data/10data.html#2010data-drugs

USE OF ALCOHOL BY TRADITIONAL-AGE COLLEGE STUDENTS:
5+ Drinks at a Setting in the Last Two Weeks
http://monitoringthefuture.org/pubs/monographs/vol2_2009.pdf
0
20
40
60
80
100

TRADITIONAL-AGE COLLEGE STUDENTS:
30 DAY USE OF MARIJUANA
0
5
10
15
20
25
http://monitoringthefuture.org/pubs/monographs/vol2_2009.pdf

TRADITIONAL-AGE COLLEGE STUDENTS:
30 DAY USE OF ECSTASY
0
5
10
15
20
25
http://monitoringthefuture.org/pubs/monographs/vol2_2009.pdf

TRADITIONAL-AGE COLLEGE STUDENTS:30 DAY USE OF NARCOTICS OTHER THAN
HEROIN
0
5
10
15
20
25
http://monitoringthefuture.org/pubs/monographs/vol2_2009.pdf

TRADITIONAL-AGE COLLEGE STUDENTS:
30 DAY USE OF COCAINE
0
5
10
15
20
25
http://monitoringthefuture.org/pubs/monographs/vol2_2009.pdf

TRADITIONAL-AGE COLLEGE STUDENTS:
30 DAY USE OF INHALANTS
0
5
10
15
20
25
http://monitoringthefuture.org/pubs/monographs/vol2_2009.pdf

TRADITIONAL-AGE COLLEGE STUDENTS:30 DAY USE OF LSD
0
5
10
15
20
25
http://monitoringthefuture.org/pubs/monographs/vol2_2009.pdf

TRADITIONAL-AGE COLLEGE STUDENTS:
30 DAY USE OF AMPHETAMINES
0
5
10
15
20
25
http://monitoringthefuture.org/pubs/monographs/vol2_2009.pdf

Student-Athlete / GreekAlcohol Use
Drinks per Week, 1999
0
2
4
6
8
10
12
14
16
non-Greek,nonathlete
non-Greek,athlete
Greek, non-athlete
Greek,athlete
femalemaletotal
Source: Core Institute http://www.siu.edu/departments/coreinst/public_html/

Student-Athletes:Negative Consequences of Drinking
Athlete Non-Athlete
Regretted behavior
46.4% 37.2%
Missed a class 39.4% 31.6%
Blackout 36.0% 27.6%
Had unplanned sexual activity
31.0% 22.7%
5 or more neg. consequences
29.5% 20.1%Harvard College Alcohol Study, 2001

Student-AthletesReasons for Alcohol Use
“What is the one main reason you use alcoholic beverages?”
82.6% Recreational or social purposes13.6% Because it makes me feel good3.3% Helps me deal with the
stresses of college life and college athletics
0.0% Improves my athletic performance
Source: NCAA Study of Substance Use Habits of College Student-Athletes, 2005

74.7 74.581.5
17.3 17.8
25.8
16.2 16.6 16.412.3 14.1
16.6
0
10
20
30
40
50
60
70
80
90
Division I Division II Division III
Pe
rc
en
t
alcohol marijuana spit tobacco cigarettes
Student Athletes: Social Drug Use by NCAA Division
Source: NCAA Study of Substance Use Habits of College Student-Athletes, 2005

77.2 76.8
22.616.9
25.8
1.7
12.815.9
0
10
20
30
40
50
60
70
80
90
Male Female
Percen
t
alcohol marijuana spit tobacco cigarettes
Student-Athletes:Social Drug Use by Gender
Source: NCAA Study of Substance Use Habits of College Student-Athletes, 2005

82
52.8
70.1
21.3
1419.718.6
5.3
1215.36
15.1
0
10
20
30
40
50
60
70
80
90
White Black Other
Pe
rce
nt
alcohol marijuana spit tobacco cigarettes
Student-Athletes:Social Drug Use by Ethnicity
Source: NCAA Study of Substance Use Habits of College Student-Athletes, 2005

0
10
20
30
40
50
60
70
80
90
1989 1993 1997 2001 2005
Perc
en
t
alcohol marijuana spit tobacco cigarettes
Student-Athletes: Social Drug Use over Time
Source: NCAA Study of Substance Use Habits of College Student-Athletes, 2005

55.5 56.5 61.9
20.7 22.6
26.9
0
10
20
30
40
50
60
70
1997 2001 2005
Pe
rce
nt
Male Female
Student-Athletes:Consumption of 6+ Drinks per Sitting, Among
Drinkers
Source: NCAA Study of Substance Use Habits of College Student-Athletes, 2005

20.5 20.7
27.8
2.3 2.43.4
0
5
10
15
20
25
30
1997 2001 2005
Perc
en
t
Male Female
Student-Athletes:Consumption of 10+ Drinks per Sitting, Among Drinkers
Source: NCAA Study of Substance Use Habits of College Student-Athletes, 2005

Student-Athletes:Reasons Drinkers Choose to Limit Drinking
Athlete NonathleteDriving 90.9% 91.7%
Studying 78.4% 74.5%
Interferes with athletics
61.2% 18.3%
On a date 46.4% 40.8%
Fattening 30.2% 26.3%
Afraid of getting caught
22.7% 18.5%
Source: Harvard College Alcohol Study, 2001

Campus Property Damage
Campus Policy Violation
Residence Hall Damage
Violent Behavior
0 20 40 60 80 100
50
57
57
58
Mean Averages
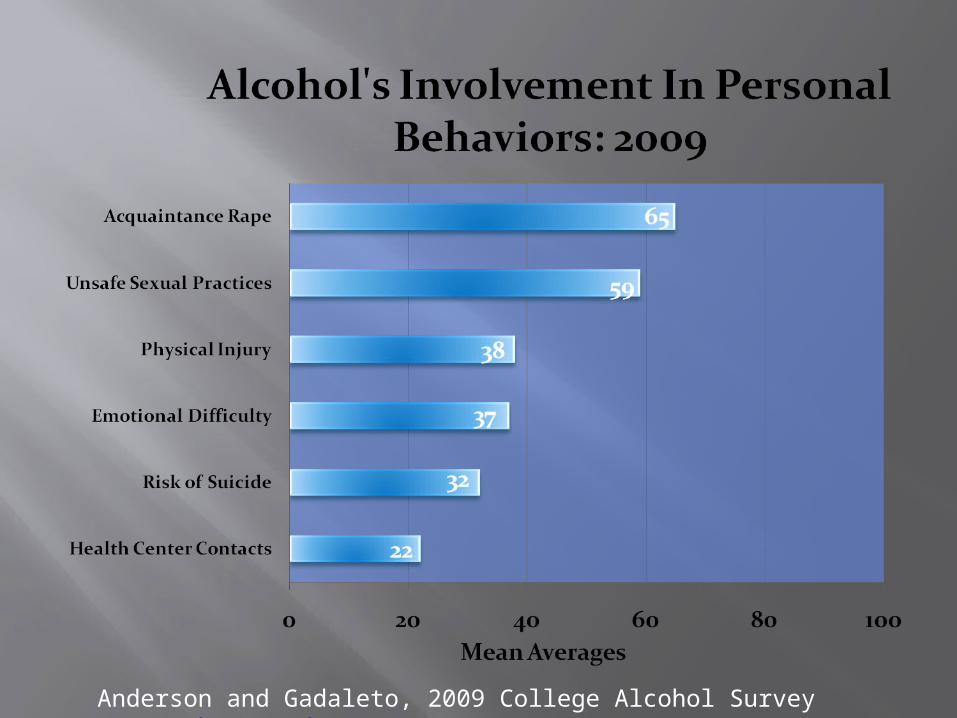
Alcohol's Involvement with Campus Behavior: 2009
Anderson and Gadaleto, 2009 College Alcohol Survey www.caph.gmu.edu

Student Attrition
Lack of Academic Success
Diminished Performance on Test or Project
Missed Classes
0 20 40 60 80 100
26
30
30
35
Mean Averages
Alcohol’s Involvement in Academic Issues: 2009
Anderson and Gadaleto, 2009 College Alcohol Survey www.caph.gmu.edu

Teen Drinking:Qualitative Research
High School Youth Parents Community Leaders

http.teenalcoholcultures.gmu.edu
Understanding Teen Drinking Cultures in America

RESEARCH STRATEGIES
Literature Review 250 articles, 59 dissertations/theses, 34
government/non-profit reports, 19 books, 19 data sets
Telephone Polling 1623 interviews [1014 parents and 609 teens] 522 are matched pairs [parent and teen]
Key Informant and Individual Interviews 58 completed [blend of community , school,
law, and health] Expert Interviews
28 completed [includes university, research, government, medical, and authors]
The methodology incorporated a blend of approaches, and involves the use of a national Advisory Panel.
http://teenalcoholcultures.gmu.edu

RESEARCH STRATEGIES (continued)
Focus Groups [N=71] 59 with youth [47 high school, 6 middle school, 6 college] 8 with parents 4 with community leaders 513 youth were involved in focus groups
396 high school and 35 middle school youth High school youth were balanced with boys/girls and white/non-
white No notable differences were found based on race/ethnicity Few differences were found based on gender
Sites included Northern Virginia, Bucks County (PA), Orange County (FL), Minneapolis, Santa Fe (NM), Northern New Jersey, and rural Georgia. No notable differences were found based on setting
(urban/rural/suburban)
http://teenalcoholcultures.gmu.edu

META FINDINGS
Inadequacy of Current KnowledgeMuch current knowledge is based on survey research.Limited conversational research is found with teens, parents or other front line personnel. Current expert knowledge is often limited.
Disjunction Between Formal and Informal RulesTeens and parents have their own practices and beliefs about what is practical and appropriate.These practices and beliefs often diverge sharply from legal codes.
http://teenalcoholcultures.gmu.edu

META FINDINGS (cont’d)
Differences Between Parent and Teen ViewsTeens cite academic challenges more often than parents.Teens are more likely to cite emotional or social reasons for drinking and for getting drunk.Parents attach more importance to family relationships as motivators for teens’ drinking or not drinking.
Extreme Teen BehaviorTeens engage in high risk drinking behaviors on a frequent basis. Teens who drink do so for emotional and social reasons.
http://teenalcoholcultures.gmu.edu

META FINDINGS (cont’d)
Lack of Helpful InformationTeens have minimal knowledge of alcohol’s effects (beyond drinking and driving consequences).Teens and parents are unaware of helpful resources.Teens and parents lack skills for meaningful dialogue on alcohol.
Not Sure What to DoParents and community leaders are unsure how to address teen drinking.Parents and community leaders focus primarily on policy or law enforcement approaches.
http://teenalcoholcultures.gmu.edu

TELEPHONE POLLING: Challenges Facing Teens
Acade
mics
/Sch
ool
Socia
l
Leisu
re A
ctivi
ties
Fam
ily
Health
Emot
iona
l
Wor
k/Mon
ey
Balan
ce
DK/NR
0%
10%
20%
30%
40%
50%
60%
70%
TeensParents
http://teenalcoholcultures.gmu.edu

TELEPHONE POLLING: Reasons Teens Drink Alcohol
Socia
l
Emot
iona
l
Effec
t/High/
Curious
Fam
ily
Other
Acces
sibilit
y
Cultu
re/M
edia In
fluen
ece
DK/NR
0%
10%
20%
30%
40%
50%
60%
TeenParents
http://teenalcoholcultures.gmu.edu

TELEPHONE POLLING: Reasons Teens Do Not Drink Alcohol
0%
5%
10%
15%
20%
25%
30%
35%
40%
45%
50%
TeenParents
http://teenalcoholcultures.gmu.edu

TELEPHONE POLLING: Reasons Teens Get Drunk
Social Emotional Curiosity/Effects Other Family DK/NR0%
10%
20%
30%
40%
50%
60%
70%
TeenParents
http://teenalcoholcultures.gmu.edu

TELEPHONE POLLING: Messages Heard From Parents
Don't
Drink
Know
ledg
e Bas
ed In
form
ation
Respo
nsible D
ecisi
on-M
aking
Drinkin
g an
d Driv
ing
Polic
ies/L
aws
Don't
Talk
About
it
Fam
ily R
ole
Mod
els
Other
DK/NR
0%
10%
20%
30%
40%
50%
60%
TeenParents
http://teenalcoholcultures.gmu.edu

TELEPHONE POLLING: Messages Heard From Teachers/Counselors
Know
ledg
e Bas
ed In
form
ation
Don't
Drink
Respo
nsible D
ecisi
on-M
aking
Drinkin
g an
d Driv
ing
Don't
Talk
abou
t it a
t Sch
ool
Polic
ies/L
aws
Prog
ram
s/Class
es
Other
DK/NR
0%
5%
10%
15%
20%
25%
30%
35%
40%
45%
50%
TeenParent
http://teenalcoholcultures.gmu.edu

TELEPHONE POLLING: Messages Heard From Peers
Posit
ive M
essa
ges (
Pro
Alcoho
l)
Negat
ive M
essa
ges (
Against A
lcoho
l)
Don't
Talk
About
it
Drinkin
g St
atus
of P
eers
Other
DK/NR
0%
10%
20%
30%
40%
50%
60%
TeenParents
http://teenalcoholcultures.gmu.edu

TELEPHONE POLLING: Messages Heard From Others
Don't
Drink
Know
ledg
e Bas
ed In
form
ation
Posit
ive M
essa
ges A
bout
Alco
hol
Mod
eling
Behav
iors
/Sto
ries
Drinkin
g an
d Driv
ing
Laws/P
unish
men
ts
Other
Religious
Mes
sage
DK/NR
0%
10%
20%
30%
40%
50%
60%
70%
TeenParents
http://teenalcoholcultures.gmu.edu

TEEN DRINKING BEHAVIORS
Teens report that obtaining alcohol is quite easy, through relationships (older siblings, friends, co-workers), places of purchase, theft or party settings.
Unlike other studies, our middle school teens report having few to no experiences with alcohol.
Boys are typically expected to provide alcohol for girls.
http://teenalcoholcultures.gmu.edu

TEEN DRINKING BEHAVIORS
Teens drink primarily to get drunk; drinking for taste or mild effects is rare.
Teens drink to deal with stress, to facilitate group membership, and to feel better.
Teens’ transition to high school is a high-risk time.
http://teenalcoholcultures.gmu.edu

TEEN DRINKING BEHAVIORS
Early drinking experiences are frequently dangerous “trials by fire” where teens learn by experimentation.
While youth are aware of family and legal consequences, they are often confident that they will not get caught.
http://teenalcoholcultures.gmu.edu

Categories of Teen Drinking
http://teenalcoholcultures.gmu.edu

PARENTS
Parents are often unsure how to talk to their teens and to other parents about teen alcohol consumption.
Parents feel a lack of information and guidance.
Parents are aware of the divergence between legal codes and informal practices.
Public moralism and zero tolerance laws make frank conversation with their teen(s) and other parents difficult.

PARENTS
Parents are four times as likely as teens to think that alcohol education programs, such as those at school, are effective.
Parents believe that schools emphasize informational and legal messages, including
don’t drink alcohol affects your health don’t drink and drive alcohol use is illegal under 21
Teens report limited to no conversations on alcohol with parents during teen years.

TEENS
Teens want more information about alcohol.
Teens want judgment-free information about alcohol from sources they can trust; they do not trust school-based education programs.
Most teens report that alcohol is talked about by school authorities, and report informational, legal and proscriptive messages.
Whatever their actual behavior, teens report hearing and respecting messages about not drinking and driving.

TEENS
Teens typically don’t see drinking as a problem, unless they get in trouble with those in authority.
Teens see other teens’ drinking as more of a problem than their own, even if the behavior is essentially the same.
Teens overwhelmingly deny the importance of peer pressure in decisions to consume or not consume alcohol.
However, teens have a poorly developed concept of peer pressure.
Teens see drinking as pleasurable and often essential to socializing with other teens.
For many teens, drinking is a primary extracurricular activity.

FRAMEWORK FOR YOUTH POSITIVE ALCOHOL DECISIONS
Underlying or Core Factors
Intrinsic or Vital Factors Extrinsic Factors Contextual Factors
*Strong core values*Feel connected to past and future*Has a sense of purpose
*Family bonds*Feeling loved and listened to*Feeling capable (confidence)*Aware of areas of concern *Knows where to turn for assistance*Feels supported*Has balance in life*Good coping skills to deal with anxiety, stress, high expectations*Friends provide support*Friends encourage behavior change as needed
*Spend family time together*Healthy family*Has open communication / conversation with parents *Has meals with families *Has good sense of personal boundaries *Feels affirmation*Has clear and reasonable expectations*Skills to interact with others*Sees parents as partners and guides*Reflect on self *Has positive role models
*Engaged in activities, clubs*Has opportunity to learn by doing, experiment, make mistakes*Is encouraged to stretch and extend comfort zone
The Teen’s World The Role of Alcohol
http://teenalcoholcultures.gmu.edu

FRAMEWORK FOR YOUTH RISKY ALCOHOL DECISIONS
Underlying Causes
Intrinsic Factors Extrinsic Factors Contextual Factors
*Stress*Feel pressure*Discouragement*Disenfranchised*Lonely*Seeking own identity*Insecure*Hopelessness
*Lack coping skills*Boredom (nothing to do)*Not comfortable being alone*Lack of goals or mission *Escape*To experience things themselves*No reflection*To fit in*To be older*To rebel*Unrealistic expectations (life, situations)
*Lack knowledge and information*Lack meaningful conversation with parents*Lack of role models*Allure (TV, songs, ads)*No substantive, consistent legal consequences*Conflicting messages (adults drink)* Educational dishonesty, inadequacy, mistrust
*Peer acceptability*Peers’ encouragement*Ease of access*Party availability*Alcohol is readily available*Societal acceptability
The Teen’s World The Role of Alcohol
http://teenalcoholcultures.gmu.edu

FRAMEWORK FOR YOUTH RISKY ALCOHOL DECISIONS
Underlying Causes
Intrinsic Factors
Extrinsic Factors
Contextual Factors

Role of AlcoholThe Teen’s World
FRAMEWORK FOR YOUTH RISKY ALCOHOL DECISIONS
Underlying Causes
Intrinsic Factors
Extrinsic Factors
Contextual Factors

Role of AlcoholThe Teen’s World
FRAMEWORK FOR YOUTH RISKY ALCOHOL DECISIONS
Underlying Causes
Intrinsic Factors
Extrinsic Factors
Contextual Factors

Role of AlcoholThe Teen’s World
FRAMEWORK FOR YOUTH RISKY ALCOHOL DECISIONS
Underlying Causes
Intrinsic Factors
Extrinsic Factors
Contextual Factors

Role of AlcoholThe Teen’s World
FRAMEWORK FOR YOUTH RISKY ALCOHOL DECISIONS
Underlying Causes
Intrinsic Factors
Extrinsic Factors
Contextual Factors

Role of AlcoholThe Teen’s World
FRAMEWORK FOR YOUTH RISKY ALCOHOL DECISIONS
Underlying Causes
Intrinsic Factors
Extrinsic Factors
Contextual Factors

FRAMEWORK FOR COMMUNITY ACTIONTYPE OF EFFORT
Policy Program Training Environment
GROUP OR
ORGANIZATION
Schools Consistently implemented rules and regulationsStandards for school employees and visitors
Curriculum that is meaningfulClubs and organizationsAfter school activities
Personnel preparation with identification and referral
School bonding and community-building activitiesRecognition for positive contributions
Law Enforcement
Laws and policies throughout the communityEnforcement of laws
Sponsor local eventsParticipate in community activities
Mentoring youth Community resource officers in school and community settings
Health Services Services available for teens
Public awareness materialsCommunity forum and dialog
How to identify problematic useHow to be supportive
Promote as trusted sourceSpokespersons
Community Standards and guidelines
Community forum and dialog
Prepare adults and community leaders to understand today’s youth needsGroup meeting behavior
Volunteering for community eventsPublic awareness activities
Youth-Serving Organizations
Engage in establishing community policies
Community-wide activities
Mentoring opportunities for older teens
Provide awards for positive contributions

Understanding Teen Drinking Cultures CHALLENGES
• Focus groups: Difficulty identifying site coordinators to provide leadership and handle logistics with coordinating multiple focus groups and interviews.
• Access to Youth: Reaching youth faces roadblocks from gatekeepers.
• Human Subjects Review Board: Requests for protocols require reworking design (e.g., Initial refusal to allow recruitment through schools, need for approval from each school for focus groups, concern about use of incentives, need for approval of each referring organization for on-line polling, limits on certain open-ended questions with telephone polling, initial requirement for written consent from parent for telephone polling)
• Timelines: Changing standards and delayed reviews from HSRB affects schedules and plans.
• Multiple approaches: More sequential scheduling of strategies would assist ongoing refinement of research questions; difficult within limited time frame.
http://teenalcoholcultures.gmu.edu

RECOMMENDATIONS
Recommendations are prepared within each of the following areas of emphasis: Youth Parents and Families Communities and Schools Future Research Overall
http://teenalcoholcultures.gmu.edu

RECOMMENDATIONS: YOUTH
Engage youth in a meaningful way in planning extracurricular activities, information needs, learning experiences.
Address the core needs of youth, with attention to underlying causes and intrinsic factors.
Provide opportunities for youth to discuss their needs, concerns, and other issues.
Provide teens with factual information about alcohol and its interaction with the body.
Enroll older siblings as part of the solution.
http://teenalcoholcultures.gmu.edu

RECOMMENDATIONS: PARENTS and FAMILIES
Provide opportunities for parent-to-parent discussion of dilemmas and challenges.
Promote trust and ongoing dialog with teens about their lives.
Provide parents and older siblings with current, accurate information and resource assistance.
Enhance parents’ skills and confidence for having ongoing conversations with teens about alcohol, consequences, and underlying causes.
Encourage parents’ and older siblings’ skills and responsibilities.
http://teenalcoholcultures.gmu.edu

RECOMMENDATIONS: COMMUNITIES and SCHOOLS
Community leaders should prepare a community-wide strategy that engages all partners through a systems approach, and incorporates appropriate benchmarks to monitor progress.
Community leaders should seek heightened priority of teen alcohol issues and underlying causes, with increased visibility and attention.
Communities and schools should provide a range of positive outlets for youth involvement and engagement.
Community leaders should identify modes of access to alcohol used by youth and implement consistent standards and consequences.
http://teenalcoholcultures.gmu.edu
RECOMMENDATIONS: COMMUNITIES and SCHOOLS (continued)
Engage various individuals and groups as communicators or sponsors of teen alcohol abuse prevention messages.
Establish opportunities for dialog about teen drinking. Schools should provide curriculum material or extra-
curricular programming on alcohol that is honest, provocative, engaging.
Incorporate content on alcohol and related issues in a range of courses offered in school.
Host life skills development sessions for youth and parents.
Identify partnership opportunities.
http://teenalcoholcultures.gmu.edu

RECOMMENDATIONS: RESEARCH
Facilitate additional qualitative research on teen alcohol cultures by a range of individuals/groups.
Review community-based efforts, organizing strategies, monitoring approaches.
Examine curricular materials and methods. Examine messages youth hear on drinking alcohol. Explore the role of athletics, service activities, and
other extracurricular activities in youth decisions about alcohol.
http://teenalcoholcultures.gmu.edu

RECOMMENDATIONS: RESEARCH (continued)
Research in more detail the four categories of teen alcohol behavior.
Better understand the role of and opportunities with older siblings in youth decisions.
Conduct a detailed systems analysis of one or more communities regarding alcohol culture.
Gain more detailed understanding of youth knowledge about alcohol, its effects, and decision-making factors.
http://teenalcoholcultures.gmu.edu

RECOMMENDATIONS: RESEARCH (continued)
Investigate the relationship between teen drinking and religious affiliation.
Further investigate social hosting practices. Examine consistency regarding alcohol issues
within households. Better understand teens’ use of alcohol with
prescription drugs.
http://teenalcoholcultures.gmu.edu

RECOMMENDATIONS: OVERALL
Maintain a perspective that understanding youth alcohol decisions is very complex, based on both the Youth Alcohol Decision Frameworks.
Engage key influencers of youth, particularly those who could be mentors.
Embrace affirming and fact-based approaches.
Maintain a perspective that changing teen drinking cultures is attainable and appropriate.
http://teenalcoholcultures.gmu.edu