preparatory contract ewg11-13 n°1: estimation of time
TRANSCRIPT
1
Preparatory contract EWG11-13 n°1: Estimation of time series of ecosystem indicators. Preliminary Report - Samuel Shephard Introduction
This Ad Hoc contract comprised calculation of ecosystem indicator time series for three
marine eco-regions (Table 1). Indicators were calculated from survey data downloaded
from ICES DATRAS. Indicators were (a) Conservation status of fish species (CSF), (b)
Proportion of large fish (PLF) or Large Fish Indicator (LFI), (c) Mean maximum length of
fishes (MML), and (d) Mean trophic level (MTL). The current document provides numerical and
graphical time series for each indicator. Indicator series are provided by marine eco-region.
Table 1. Marine eco-regions for which indicator series were calculated
Ecosystem FAO subdivisions RAC ICES Eco-regions 1 Baltic sea ICES IIIb, 22-32 Baltic sea Baltic sea2 North sea ICES IVa-c, IIIa, VIId North sea (except VIId) North sea 3a West Scotland/Ireland ICES VIa-b, VIIb-c North western waters Celtic Sea and West of Scotland
Methods
Data formatting
Indicators were calculated from DATRAS data formatted according to the protocol of
Greenstreet et al. (2011). This protocol allows for removal of species unlikely to be
representatively sampled by a GOV trawl and standardises catches by observed swept area
(ship speed x haul duration x gear wingspread) where possible. In this analysis, this
standardisation was possible for the Baltic and North Sea regions, where haul numbers
were consistent in DATRAS files for both haul metadata (Exchange) and catch data
(CPUE_numbers_per_haul) and could thus be directly merged. Haul duration was
standardised to one hour as per DATRAS CPUE_numbers_per_haul. Where there were
major discrepancies between these files (Scottish Q1 and Q4 surveys), a mean annual swept
area was applied to all hauls in a given year. A diagnostic analysis (using the North Sea

2
data) suggested that using this mean swept area produced very similar results for the Large
Fish Indicator (LFI) to results from the fully standardised dataset.
In order to ground-truth the data formatting protocol, final results for the North Sea LFI
series were compared to those in two published analyses (Greenstreet et al., 2011; Fung et
al., 2012). There was close similarity in results, suggested that the protocol was functioning
well.
Indicators
For those indicators represented by a simple equation (MML, LFI and MTL), calculation
was straightforward. However, some ‘interpretation’ of the CSF indicators was necessary.
In all cases, a five-year species list was used. In addition, a five-year reference period was
used where the three-year period generated too many zero values for species CPUE
(Scottish Q4 and Baltic Q4 surveys).
In all cases, annual CSFb was calculated as a direct proportion by species of the reference
CPUE. The ‘standard’ mean was used as the geometric mean could not handle zero values
and this seemed to introduce some bias. If required, calculating the geometric mean of
CSFb for each eco-region should be simple from the CSFb excel files attached. In all cases,
CPUE was defined as number of individuals by species by year per km2 swept area.
References
Fung, T, Farnsworth, K. D., Reid, D. G., and Rossberg, A. G. 2012. Recent data suggest no
further recovery in North Sea Large Fish Indicator. ICES Journal of Marine Science.
Greenstreet, S. P. R., Rogers, S. I., Rice, J. C., Piet, G. J., Guirey, E. J., Fraser, H. M., and
Fryer, R. J. 2011. Development of the EcoQO for the North Sea fish community. ICES
Journal of Marine Science, 68: 1-11.
3
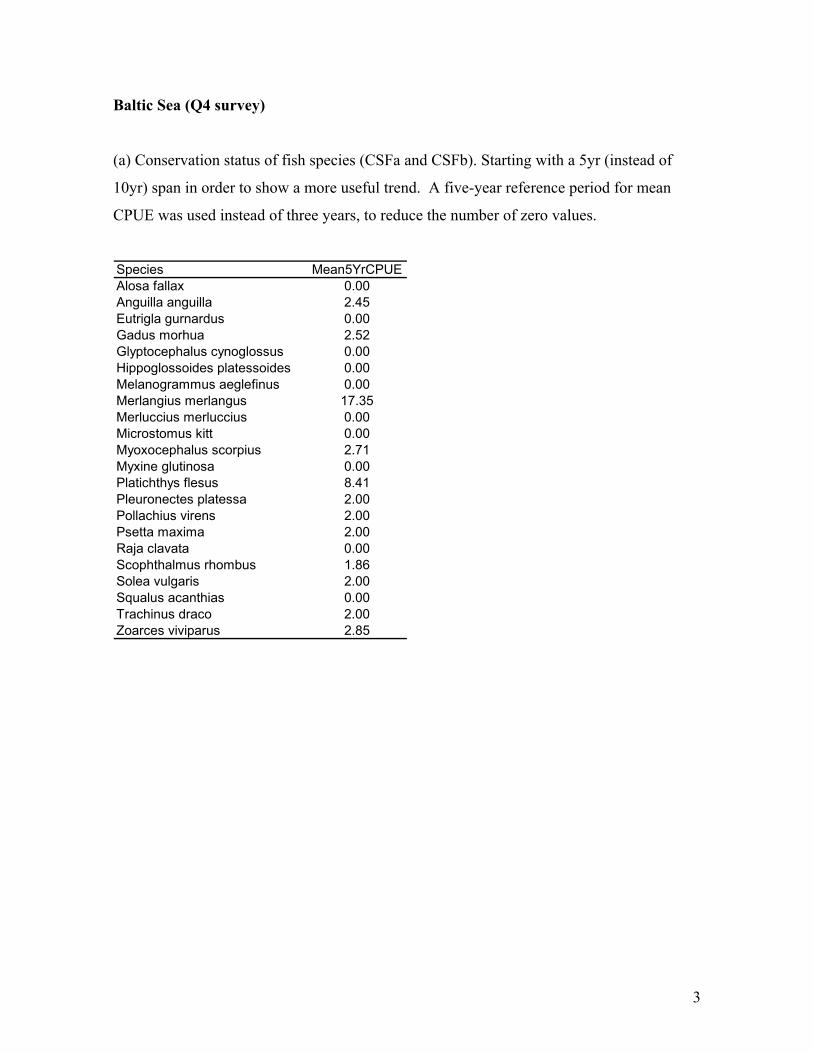
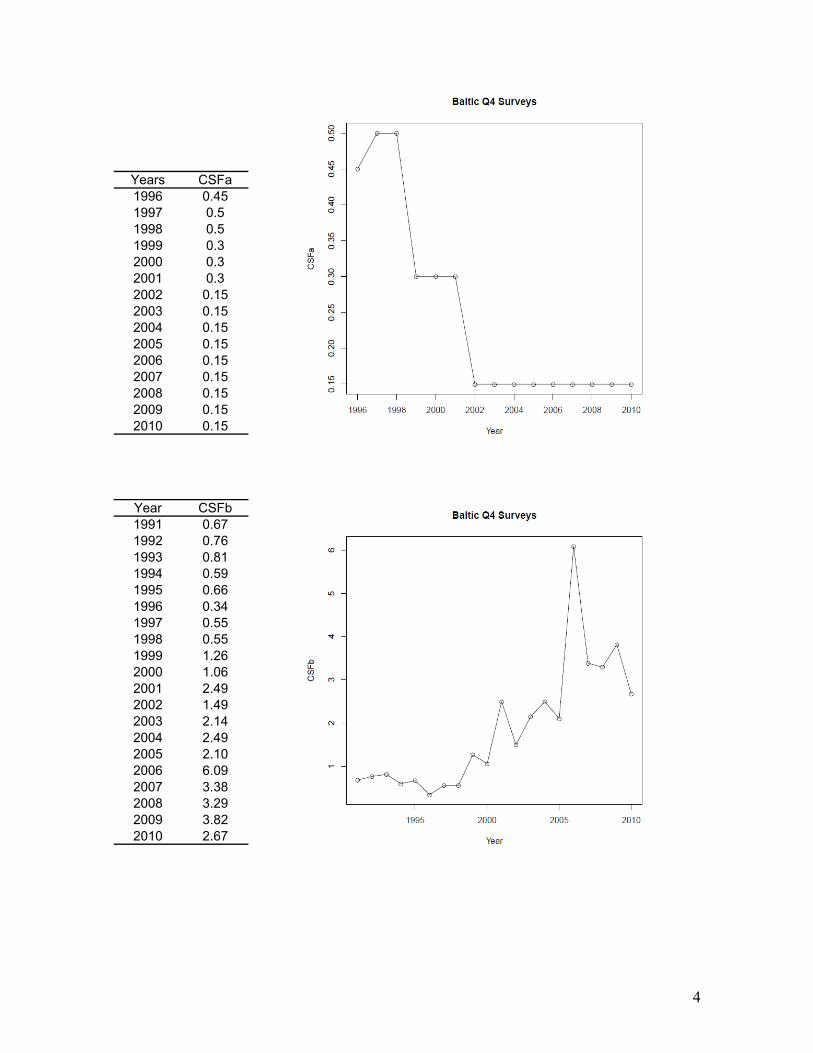
Baltic Sea (Q4 survey)
(a) Conservation status of fish species (CSFa and CSFb). Starting with a 5yr (instead of
10yr) span in order to show a more useful trend. A five-year reference period for mean
CPUE was used instead of three years, to reduce the number of zero values.
Species Mean5YrCPUEAlosa fallax 0.00Anguilla anguilla 2.45Eutrigla gurnardus 0.00Gadus morhua 2.52Glyptocephalus cynoglossus 0.00Hippoglossoides platessoides 0.00Melanogrammus aeglefinus 0.00Merlangius merlangus 17.35Merluccius merluccius 0.00Microstomus kitt 0.00Myoxocephalus scorpius 2.71Myxine glutinosa 0.00Platichthys flesus 8.41Pleuronectes platessa 2.00Pollachius virens 2.00Psetta maxima 2.00Raja clavata 0.00Scophthalmus rhombus 1.86Solea vulgaris 2.00Squalus acanthias 0.00Trachinus draco 2.00Zoarces viviparus 2.85
4
Years CSFa1996 0.451997 0.51998 0.51999 0.32000 0.32001 0.32002 0.152003 0.152004 0.152005 0.152006 0.152007 0.152008 0.152009 0.152010 0.15
Year CSFb1991 0.671992 0.761993 0.811994 0.591995 0.661996 0.341997 0.551998 0.551999 1.262000 1.062001 2.492002 1.492003 2.142004 2.492005 2.102006 6.092007 3.382008 3.292009 3.822010 2.67

5
(b) Proportion of large fish (PLF) or Large Fish Indicator (LFI)
Year LFI1991 0.2161992 0.1781993 0.2811994 0.3451995 0.3011996 0.5441997 0.2041998 0.1801999 0.2202000 0.2362001 0.1042002 0.2032003 0.2562004 0.1822005 0.2022006 0.2122007 0.2632008 0.2722009 0.2852010 0.318
6
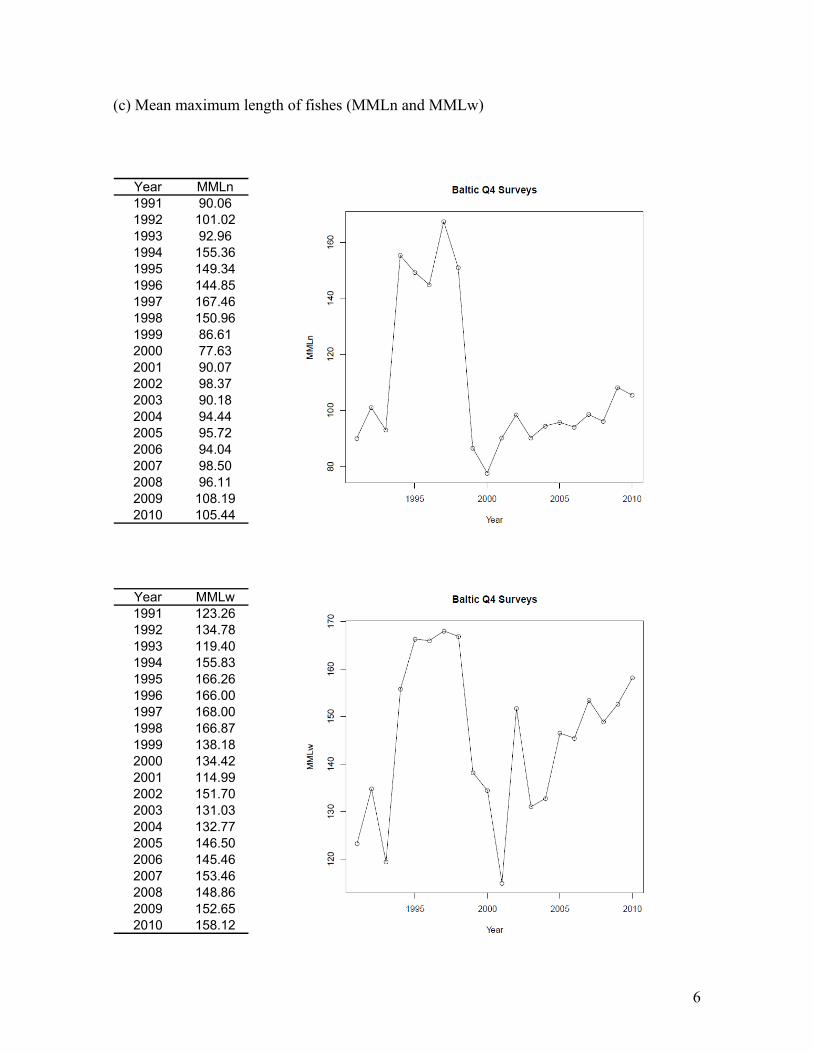
(c) Mean maximum length of fishes (MMLn and MMLw)
Year MMLn1991 90.061992 101.021993 92.961994 155.361995 149.341996 144.851997 167.461998 150.961999 86.612000 77.632001 90.072002 98.372003 90.182004 94.442005 95.722006 94.042007 98.502008 96.112009 108.192010 105.44
Year MMLw1991 123.261992 134.781993 119.401994 155.831995 166.261996 166.001997 168.001998 166.871999 138.182000 134.422001 114.992002 151.702003 131.032004 132.772005 146.502006 145.462007 153.462008 148.862009 152.652010 158.12

7
(d) Mean trophic level (MTL)
Year MTL1991 3.971992 4.061993 4.171994 4.241995 4.271996 4.191997 4.241998 4.291999 4.062000 4.052001 3.822002 4.092003 4.042004 3.982005 4.062006 4.102007 4.132008 4.092009 4.112010 4.14
8
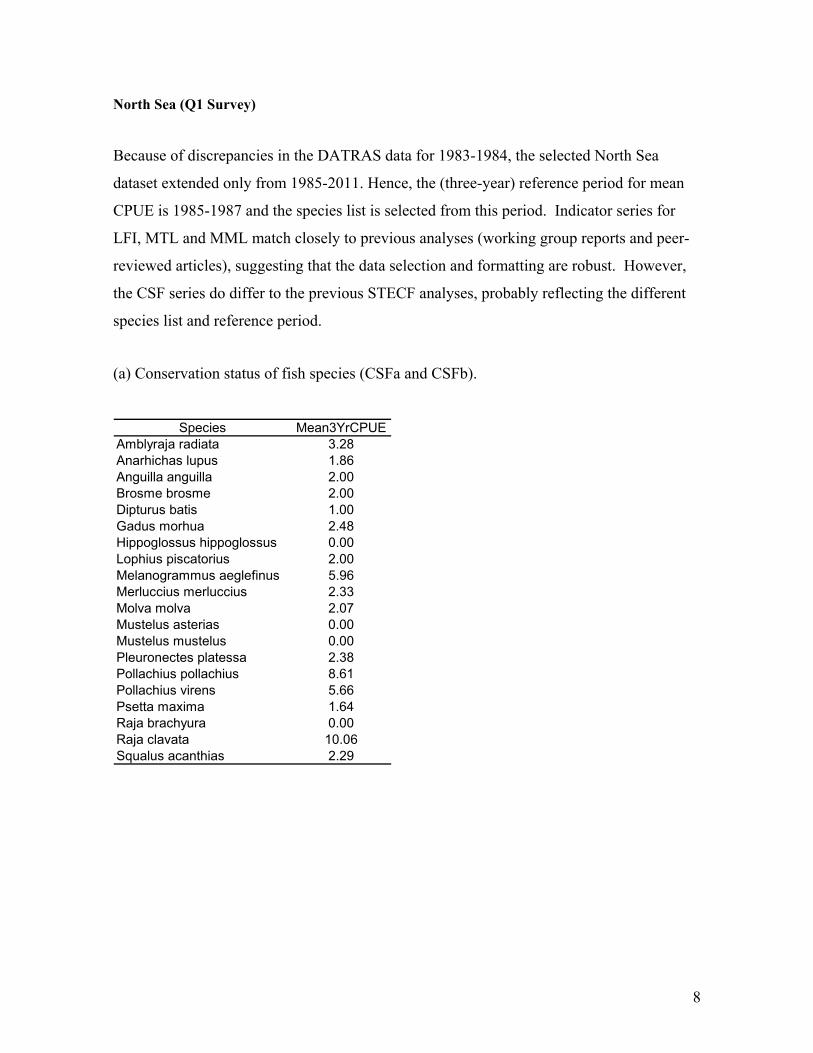
North Sea (Q1 Survey)
Because of discrepancies in the DATRAS data for 1983-1984, the selected North Sea
dataset extended only from 1985-2011. Hence, the (three-year) reference period for mean
CPUE is 1985-1987 and the species list is selected from this period. Indicator series for
LFI, MTL and MML match closely to previous analyses (working group reports and peer-
reviewed articles), suggesting that the data selection and formatting are robust. However,
the CSF series do differ to the previous STECF analyses, probably reflecting the different
species list and reference period.
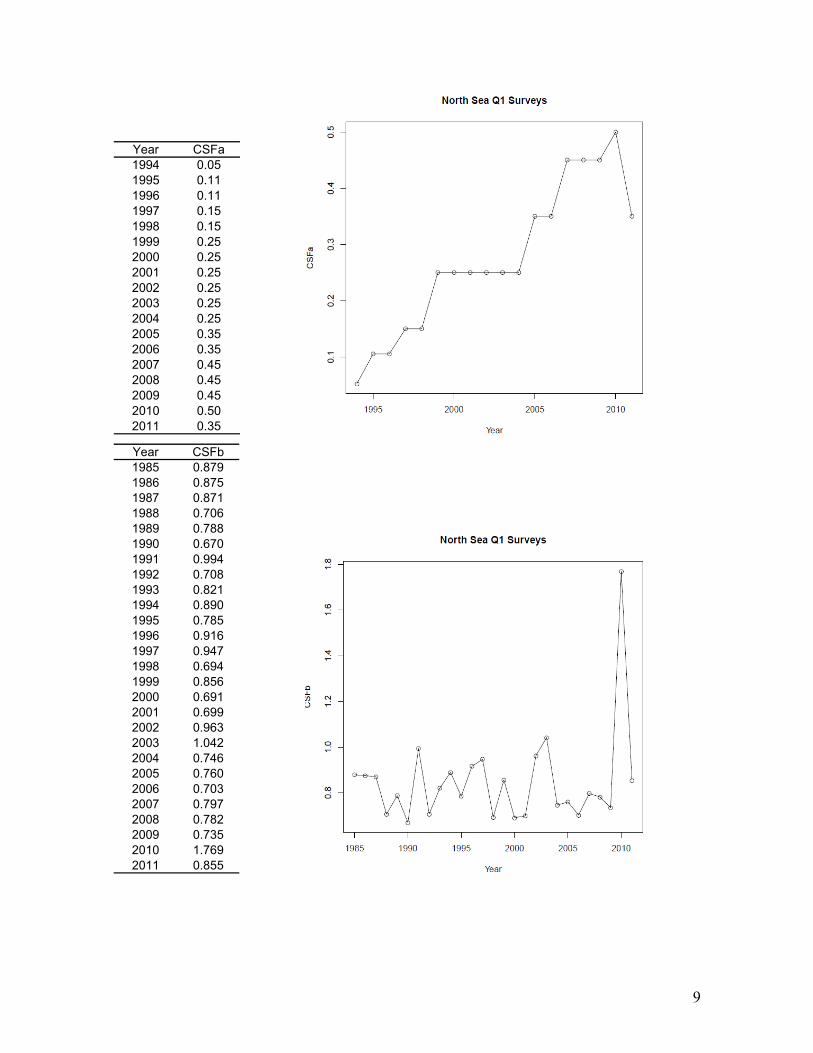
(a) Conservation status of fish species (CSFa and CSFb).
Species Mean3YrCPUE
Amblyraja radiata 3.28Anarhichas lupus 1.86Anguilla anguilla 2.00Brosme brosme 2.00Dipturus batis 1.00Gadus morhua 2.48Hippoglossus hippoglossus 0.00Lophius piscatorius 2.00Melanogrammus aeglefinus 5.96Merluccius merluccius 2.33Molva molva 2.07Mustelus asterias 0.00Mustelus mustelus 0.00Pleuronectes platessa 2.38Pollachius pollachius 8.61Pollachius virens 5.66Psetta maxima 1.64Raja brachyura 0.00Raja clavata 10.06Squalus acanthias 2.29
9
Year CSFa1994 0.051995 0.111996 0.111997 0.151998 0.151999 0.252000 0.252001 0.252002 0.252003 0.252004 0.252005 0.352006 0.352007 0.452008 0.452009 0.452010 0.502011 0.35 Year CSFb1985 0.8791986 0.8751987 0.8711988 0.7061989 0.7881990 0.6701991 0.9941992 0.7081993 0.8211994 0.8901995 0.7851996 0.9161997 0.9471998 0.6941999 0.8562000 0.6912001 0.6992002 0.9632003 1.0422004 0.7462005 0.7602006 0.7032007 0.7972008 0.7822009 0.7352010 1.7692011 0.855

10
(b) Proportion of large fish (PLF) or Large Fish Indicator (LFI). Note that this series
matches very closely to the updated series of Greenstreet et al. (2011) and Fung et al.
(2012).
Year LFI1985 0.2701986 0.1701987 0.1481988 0.1441989 0.1611990 0.1401991 0.1511992 0.0851993 0.1051994 0.1371995 0.1141996 0.1211997 0.0981998 0.1051999 0.1212000 0.1052001 0.0472002 0.0892003 0.1202004 0.1302005 0.1372006 0.1312007 0.1182008 0.1642009 0.1322010 0.1292011 0.095
11
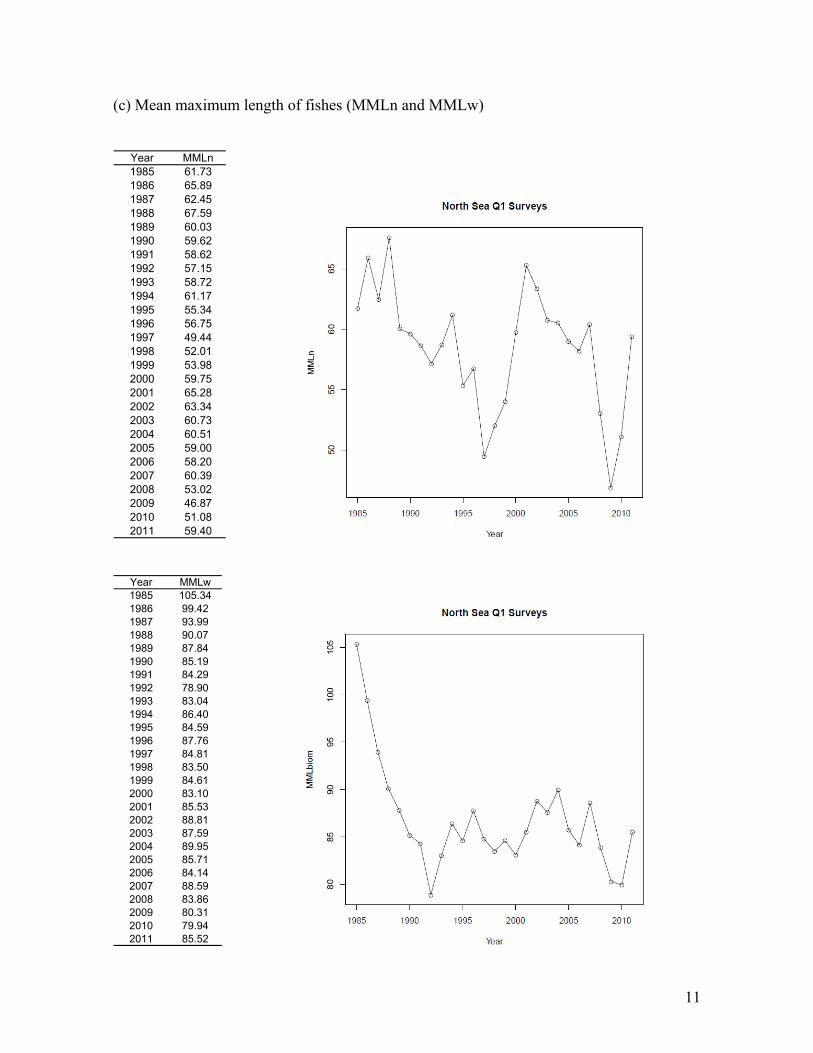
(c) Mean maximum length of fishes (MMLn and MMLw)
Year MMLn1985 61.731986 65.891987 62.451988 67.591989 60.031990 59.621991 58.621992 57.151993 58.721994 61.171995 55.341996 56.751997 49.441998 52.011999 53.982000 59.752001 65.282002 63.342003 60.732004 60.512005 59.002006 58.202007 60.392008 53.022009 46.872010 51.082011 59.40
Year MMLw1985 105.341986 99.421987 93.991988 90.071989 87.841990 85.191991 84.291992 78.901993 83.041994 86.401995 84.591996 87.761997 84.811998 83.501999 84.612000 83.102001 85.532002 88.812003 87.592004 89.952005 85.712006 84.142007 88.592008 83.862009 80.312010 79.942011 85.52
12
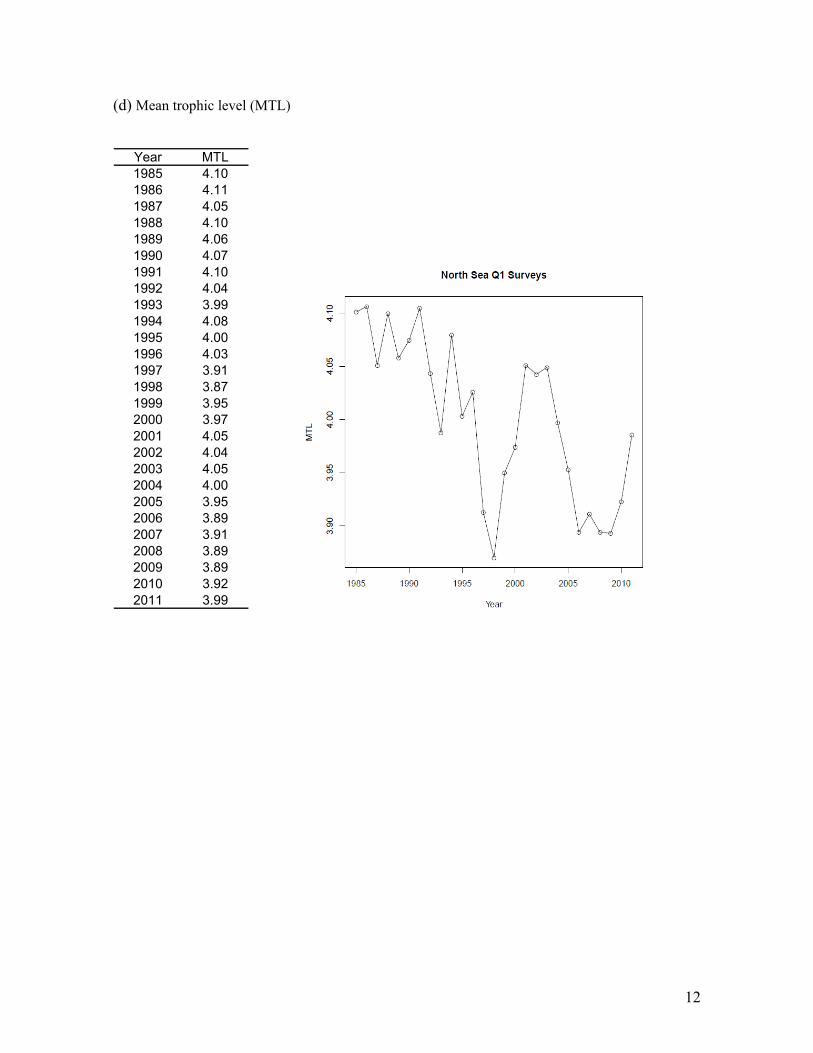
(d) Mean trophic level (MTL)
Year MTL1985 4.101986 4.111987 4.051988 4.101989 4.061990 4.071991 4.101992 4.041993 3.991994 4.081995 4.001996 4.031997 3.911998 3.871999 3.952000 3.972001 4.052002 4.042003 4.052004 4.002005 3.952006 3.892007 3.912008 3.892009 3.892010 3.922011 3.99
13
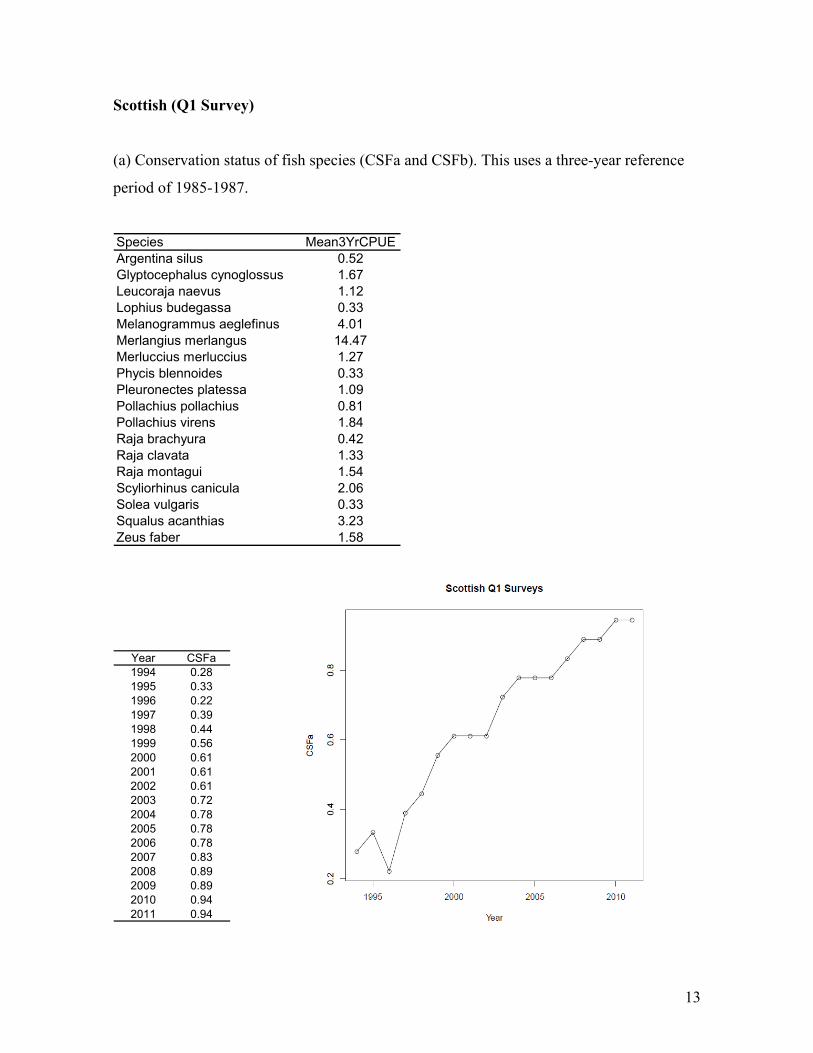
Scottish (Q1 Survey)
(a) Conservation status of fish species (CSFa and CSFb). This uses a three-year reference
period of 1985-1987.
Species Mean3YrCPUEArgentina silus 0.52Glyptocephalus cynoglossus 1.67Leucoraja naevus 1.12Lophius budegassa 0.33Melanogrammus aeglefinus 4.01Merlangius merlangus 14.47Merluccius merluccius 1.27Phycis blennoides 0.33Pleuronectes platessa 1.09Pollachius pollachius 0.81Pollachius virens 1.84Raja brachyura 0.42Raja clavata 1.33Raja montagui 1.54Scyliorhinus canicula 2.06Solea vulgaris 0.33Squalus acanthias 3.23Zeus faber 1.58
Year CSFa1994 0.281995 0.331996 0.221997 0.391998 0.441999 0.562000 0.612001 0.612002 0.612003 0.722004 0.782005 0.782006 0.782007 0.832008 0.892009 0.892010 0.942011 0.94
14
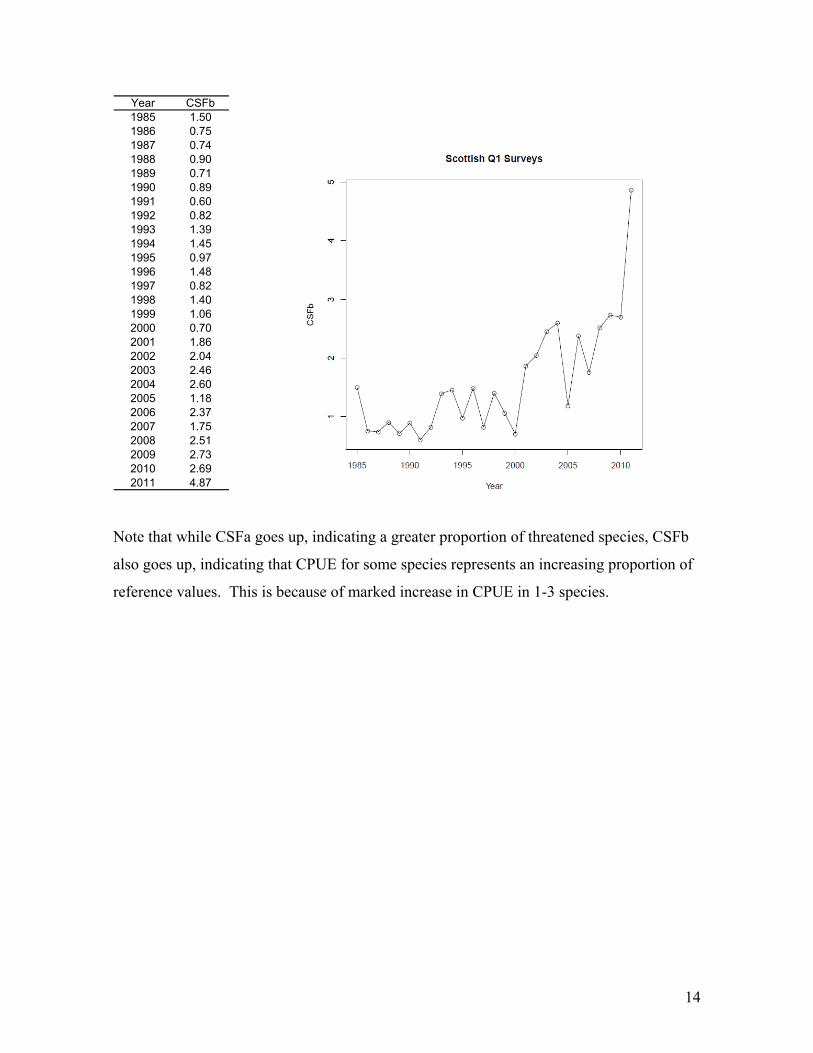
Year CSFb1985 1.501986 0.751987 0.741988 0.901989 0.711990 0.891991 0.601992 0.821993 1.391994 1.451995 0.971996 1.481997 0.821998 1.401999 1.062000 0.702001 1.862002 2.042003 2.462004 2.602005 1.182006 2.372007 1.752008 2.512009 2.732010 2.692011 4.87
Note that while CSFa goes up, indicating a greater proportion of threatened species, CSFb
also goes up, indicating that CPUE for some species represents an increasing proportion of
reference values. This is because of marked increase in CPUE in 1-3 species.
15
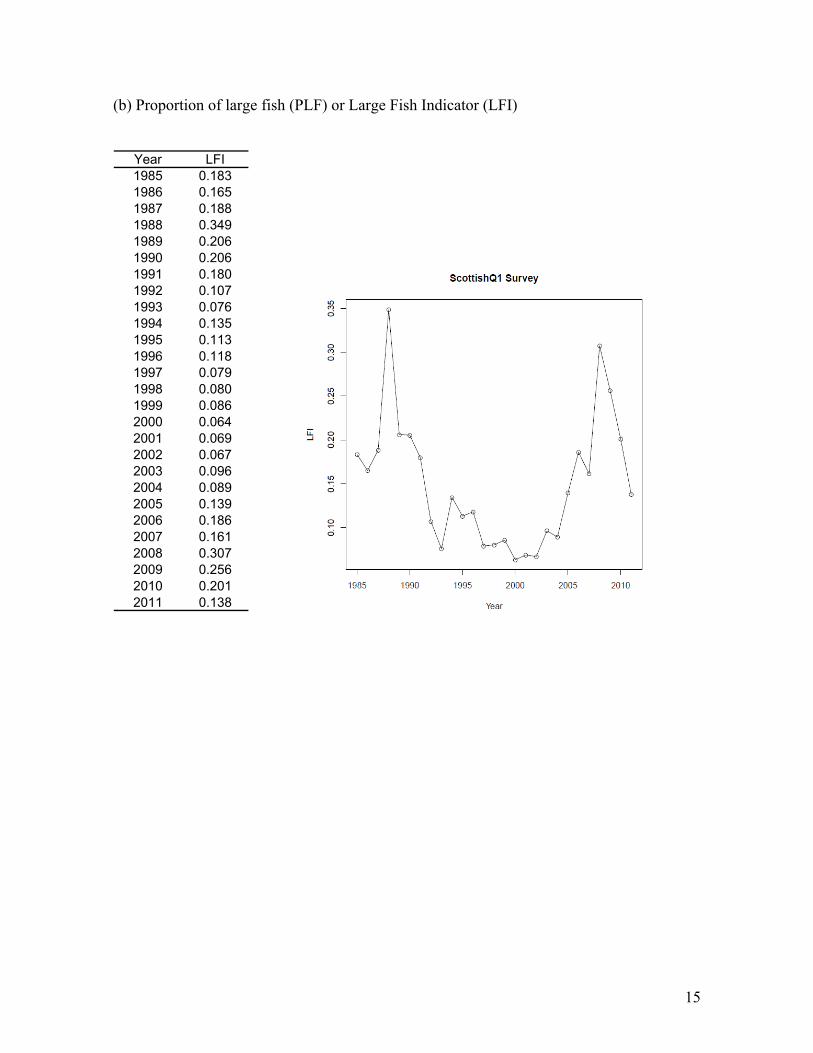
(b) Proportion of large fish (PLF) or Large Fish Indicator (LFI)
Year LFI1985 0.1831986 0.1651987 0.1881988 0.3491989 0.2061990 0.2061991 0.1801992 0.1071993 0.0761994 0.1351995 0.1131996 0.1181997 0.0791998 0.0801999 0.0862000 0.0642001 0.0692002 0.0672003 0.0962004 0.0892005 0.1392006 0.1862007 0.1612008 0.3072009 0.2562010 0.2012011 0.138

16
(c) Mean maximum length of fishes (MMLn and MMLw)
Year MMLn1985 54.491986 58.581987 54.571988 66.131989 54.861990 49.501991 46.981992 46.181993 58.231994 48.051995 62.221996 55.991997 47.351998 46.261999 51.272000 49.562001 51.002002 53.172003 61.302004 62.572005 67.252006 62.082007 43.902008 31.132009 42.882010 39.972011 35.85
Year MMLw1985 86.671986 91.251987 85.291988 106.081989 94.951990 78.611991 84.501992 70.491993 83.151994 80.521995 86.081996 84.021997 75.661998 70.701999 77.342000 71.762001 72.442002 79.032003 86.052004 87.652005 88.012006 81.712007 71.492008 71.632009 78.052010 66.712011 61.97
17
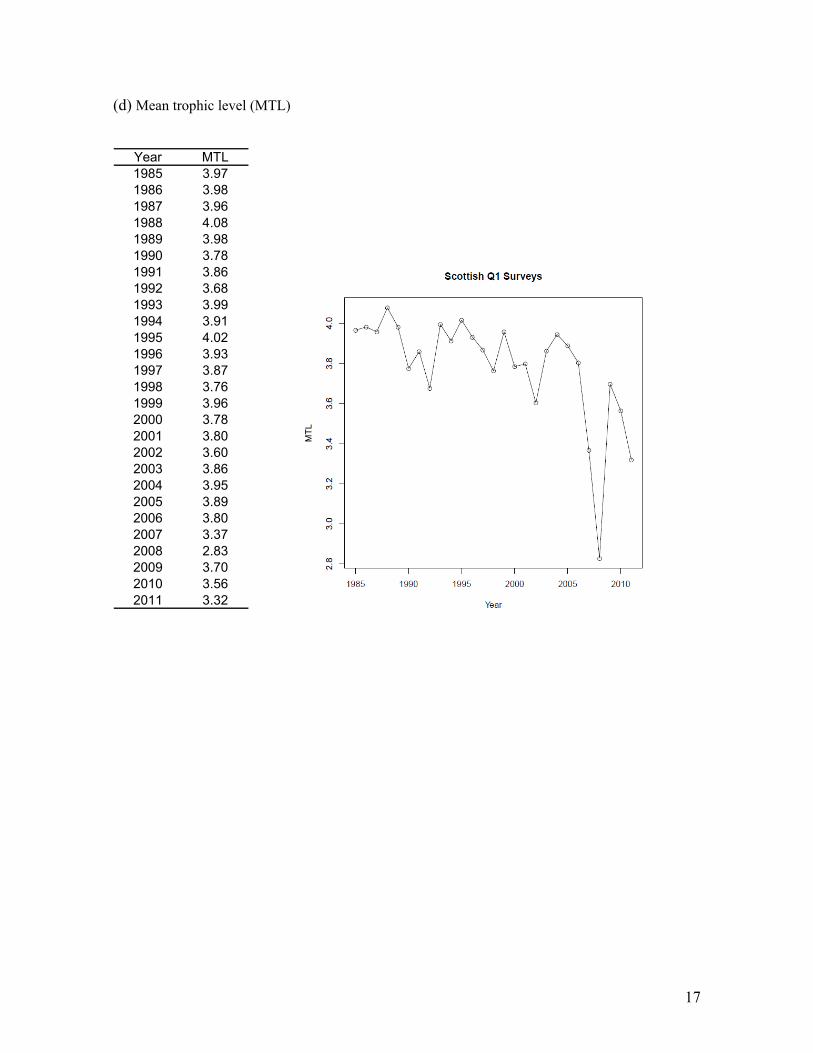
(d) Mean trophic level (MTL)
Year MTL1985 3.971986 3.981987 3.961988 4.081989 3.981990 3.781991 3.861992 3.681993 3.991994 3.911995 4.021996 3.931997 3.871998 3.761999 3.962000 3.782001 3.802002 3.602003 3.862004 3.952005 3.892006 3.802007 3.372008 2.832009 3.702010 3.562011 3.32
18
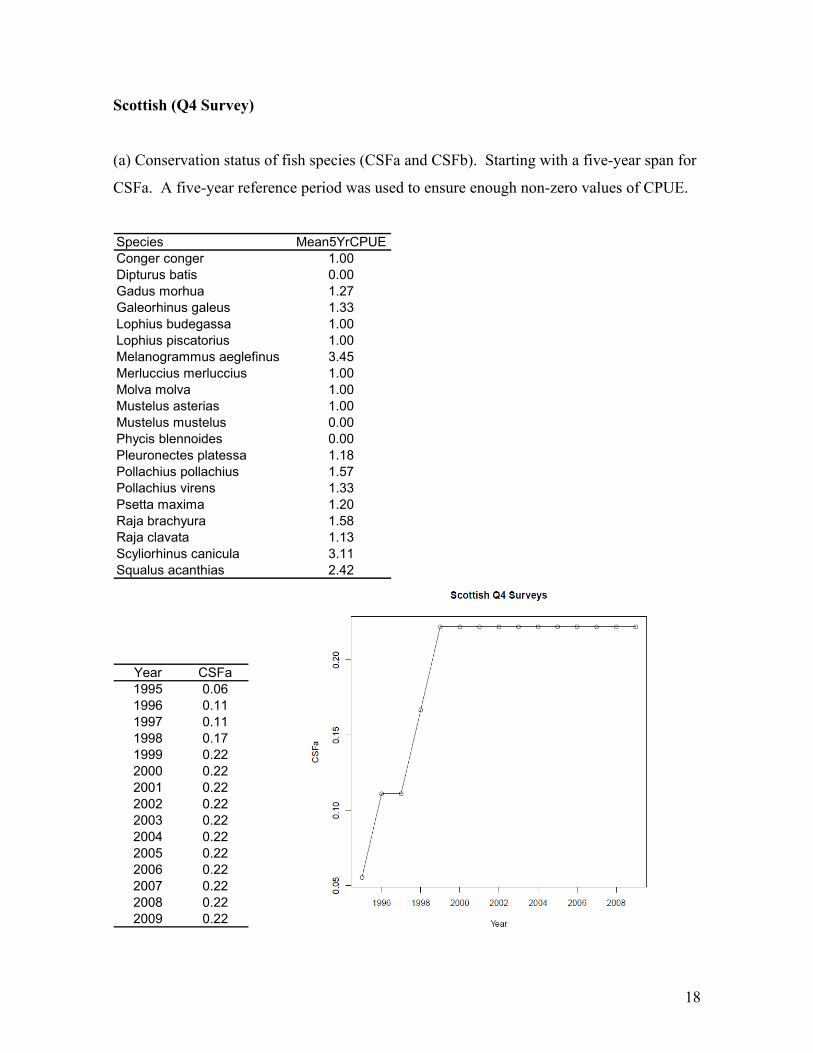
Scottish (Q4 Survey)
(a) Conservation status of fish species (CSFa and CSFb). Starting with a five-year span for
CSFa. A five-year reference period was used to ensure enough non-zero values of CPUE.
Species Mean5YrCPUEConger conger 1.00Dipturus batis 0.00Gadus morhua 1.27Galeorhinus galeus 1.33Lophius budegassa 1.00Lophius piscatorius 1.00Melanogrammus aeglefinus 3.45Merluccius merluccius 1.00Molva molva 1.00Mustelus asterias 1.00Mustelus mustelus 0.00Phycis blennoides 0.00Pleuronectes platessa 1.18Pollachius pollachius 1.57Pollachius virens 1.33Psetta maxima 1.20Raja brachyura 1.58Raja clavata 1.13Scyliorhinus canicula 3.11Squalus acanthias 2.42
Year CSFa1995 0.061996 0.111997 0.111998 0.171999 0.222000 0.222001 0.222002 0.222003 0.222004 0.222005 0.222006 0.222007 0.222008 0.222009 0.22

19
Year CSFb1990 0.681991 0.521992 0.661993 0.751994 0.851995 0.861996 0.841997 0.711998 1.301999 1.232000 1.152001 1.302002 1.542003 1.562004 1.332005 1.462006 1.422007 1.432008 1.122009 1.16
(b) Proportion of large fish (PLF) or Large Fish Indicator (LFI)
Year LFI1990 0.3361991 0.3111992 0.2091993 0.2731994 0.2041995 0.2401996 0.1911997 0.1131998 0.1611999 0.1432000 0.1092001 0.1302002 0.1212003 0.1582004 0.1622005 0.3092006 0.2682007 0.2732008 0.2392009 0.254
20
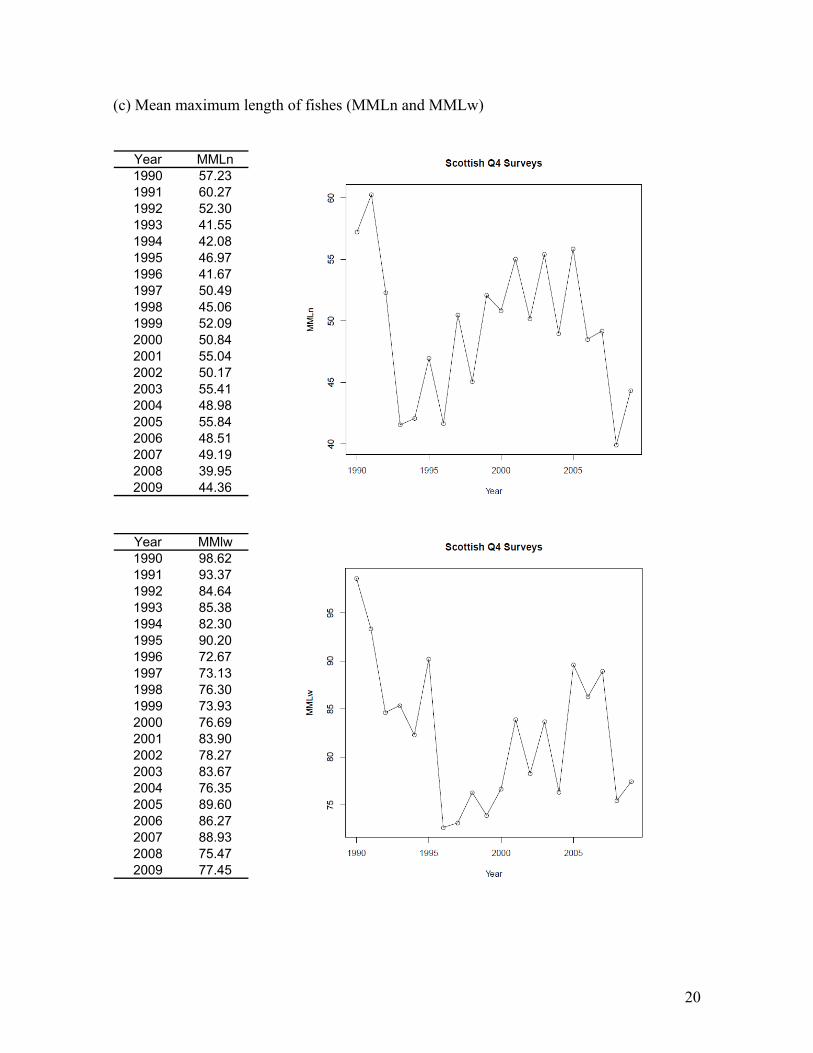
(c) Mean maximum length of fishes (MMLn and MMLw)
Year MMLn1990 57.231991 60.271992 52.301993 41.551994 42.081995 46.971996 41.671997 50.491998 45.061999 52.092000 50.842001 55.042002 50.172003 55.412004 48.982005 55.842006 48.512007 49.192008 39.952009 44.36
Year MMlw1990 98.621991 93.371992 84.641993 85.381994 82.301995 90.201996 72.671997 73.131998 76.301999 73.932000 76.692001 83.902002 78.272003 83.672004 76.352005 89.602006 86.272007 88.932008 75.472009 77.45
21
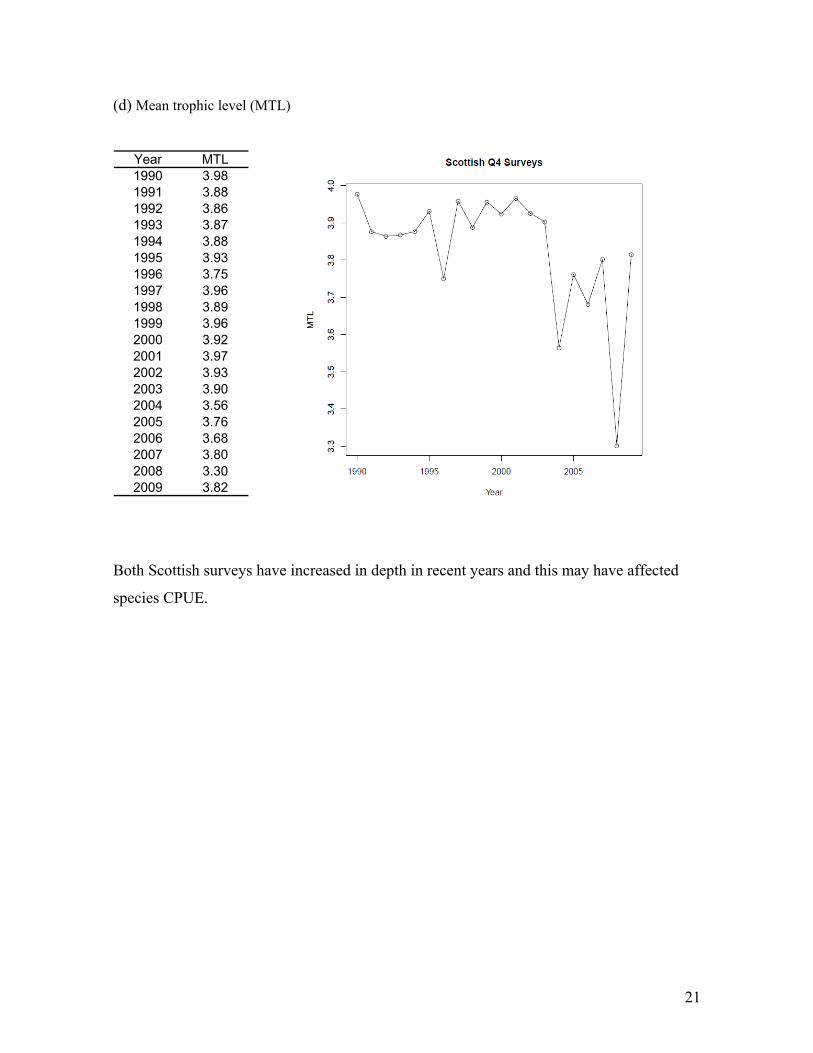
(d) Mean trophic level (MTL)
Year MTL1990 3.981991 3.881992 3.861993 3.871994 3.881995 3.931996 3.751997 3.961998 3.891999 3.962000 3.922001 3.972002 3.932003 3.902004 3.562005 3.762006 3.682007 3.802008 3.302009 3.82
Both Scottish surveys have increased in depth in recent years and this may have affected
species CPUE.