preparation of ultra thin polystyrene, polypropylene and … · 2011-05-14 · preparation of ultra...
TRANSCRIPT

Naval Research LaboratoryWashington, DC 20375-5320
NRL/MR/6750--08-9092
Preparation of Ultra Thin Polystyrene, Polypropylene and Polyethylene Films on Si Substrate Using Spin Coating Technology
January 4, 2008
Approved for public release; distribution is unlimited.
Scott Walton RichaRd FeRnSleR
Charged Particle Physics BranchPlasma Physics Division
evgeniya lock
NRL/NRC Postdoctoral Research AssociatePlasma Physics Division

i
REPORT DOCUMENTATION PAGE Form ApprovedOMB No. 0704-0188
3. DATES COVERED (From - To)
Standard Form 298 (Rev. 8-98)Prescribed by ANSI Std. Z39.18
Public reporting burden for this collection of information is estimated to average 1 hour per response, including the time for reviewing instructions, searching existing data sources, gathering and maintaining the data needed, and completing and reviewing this collection of information. Send comments regarding this burden estimate or any other aspect of this collection of information, including suggestions for reducing this burden to Department of Defense, Washington Headquarters Services, Directorate for Information Operations and Reports (0704-0188), 1215 Jefferson Davis Highway, Suite 1204, Arlington, VA 22202-4302. Respondents should be aware that notwithstanding any other provision of law, no person shall be subject to any penalty for failing to comply with a collection of information if it does not display a currently valid OMB control number. PLEASE DO NOT RETURN YOUR FORM TO THE ABOVE ADDRESS.
5a. CONTRACT NUMBER
5b. GRANT NUMBER
5c. PROGRAM ELEMENT NUMBER
5d. PROJECT NUMBER
5e. TASK NUMBER
5f. WORK UNIT NUMBER
2. REPORT TYPE1. REPORT DATE (DD-MM-YYYY)
4. TITLE AND SUBTITLE
6. AUTHOR(S)
8. PERFORMING ORGANIZATION REPORT NUMBER
7. PERFORMING ORGANIZATION NAME(S) AND ADDRESS(ES)
10. SPONSOR / MONITOR’S ACRONYM(S)9. SPONSORING / MONITORING AGENCY NAME(S) AND ADDRESS(ES)
11. SPONSOR / MONITOR’S REPORT NUMBER(S)
12. DISTRIBUTION / AVAILABILITY STATEMENT
13. SUPPLEMENTARY NOTES
14. ABSTRACT
15. SUBJECT TERMS
16. SECURITY CLASSIFICATION OF:
a. REPORT
19a. NAME OF RESPONSIBLE PERSON
19b. TELEPHONE NUMBER (include areacode)
b. ABSTRACT c. THIS PAGE
18. NUMBEROF PAGES
17. LIMITATIONOF ABSTRACT
Preparation of Ultra Thin Polystyrene, Polypropylene and Polyethylene Films on Si Substrate Using Spin Coating Technology
Evgeniya Lock,* Scott Walton, and Richard Fernsler
Naval Research Laboratory4555 Overlook Avenue, SWWashington, DC 20375-5320
NRL/MR/6750--08-9092
Approved for public release; distribution is unlimited.
Unclassified Unclassified UnclassifiedUL 26
Scott Walton
(202) 767-7531
Spin coating Polystyrene
Preparation of ultra thin polystyrene, polypropylene and polyethylene films on silicon substrate using the spin coating technique is discussed in this report. The influence of various process parameters on the obtained film quality including Si wafer preparation, choice of solvent, influence of the solution concentration on the coating and sample positioning on the spin coater are shown. The polymer film surface morphology, thickness and chemical composition were analyzed by atomic force microscopy, profilometery, n&k spectrometry, ellipsometry and X-ray photoelectron spectrometry. Contact angle measurements were performed to characterize the polymer surface energy.
04-01-2008 Memorandum Report
Office of Naval ResearchOne Liberty Center875 North Randolph StreetArlington, VA 22203
67-7641-08
ONR
*NRL/NRC Postdoctoral Research Associate
Polypropylene


CONTENTS
iii
1. Introduction ................................................................................................................................................1
2. Experimental design ...................................................................................................................................1
a) Spin coating ....................................................................................................................................1 Spin coater description ................................................................................................................1 Spin coating program ..................................................................................................................2
b) Data analysis techniques .................................................................................................................3 Goniometer ..................................................................................................................................3 Film thickness measurements ......................................................................................................3 Atomic force microscope ............................................................................................................4 X-ray photoelectron spectroscope ...............................................................................................4
3. Results and discussion ...............................................................................................................................5
Si wafer cleaning .................................................................................................................................5 Si wafer drying ....................................................................................................................................6 Additional considerations: substrate positioning and the use of buffers ............................................6 Polymerthinfilmsolutionpreparation ...............................................................................................7 Influenceoftheinitialpolymerconcentrationinthestartingsolution ...............................................9 Aftertreatment ...................................................................................................................................10 Analysisoftheproducedfilms..........................................................................................................10
4. Conclusions ..............................................................................................................................................16
5. Acknowledgements ..................................................................................................................................17
6. References ................................................................................................................................................17
7. Appendix A...............................................................................................................................................18


Preparation of ultra thin polystyrene, polypropylene and polyethylene films on Si
substrate using spin coating technique
Abstract
Preparation of ultra thin polystyrene, polypropylene and polyethylene films on silicon substrate using the spin coating technique is discussed in this report. The influence of various process parameters on the obtained film quality including Si wafer preparation, choice of solvent, influence of the solution concentration on the coating and sample positioning on the spin coater are shown. The polymer film surface morphology, thickness and chemical composition were analyzed by atomic force microscopy, profilometery, n&k spectrometry, ellipsometry and X-ray photoelectron spectrometry. Contact angle measurements were performed to characterize the polymer surface energy.
1. Introduction
Preparation of ultra thin films with uniform surface properties in the nanometer scale is essential for wide range of applications including sensors, MEMS and IC circuits. The procedure described in this report is spin coating from dilute solutions. In the spin coating process, solution is first deposited on the substrate, and then the substrate is accelerated rapidly to the desired rotation rate [1-3]. Liquid flows radially, owing to the action of centrifugal force, and the excess is ejected off the edge of the substrate. The film continues to thin slowly until disjoining pressure effects cause the film to reach an equilibrium thickness or until it hardens due to a dramatic rise in viscosity from solvent evaporation. The final thinning of the film is then solely due to solvent evaporation. This study shows that the final polymer film uniformity is a function of spin rate and spinning process steps, substrate temperature, positioning and polymer properties (i.e. solubility, molecular weight and structure) proper choice of solvent and solution concentration.
2. Experimental design
a) Spin coating
− Spin coater description
The spin coater (WS-400E-6NPP-LITE, Laurell Technologies Corp.) used in this study is shown in Figure 1. The spin processor housing is machined from solid natural polypropylene which does not degrade or generate particles. The bowl-shaped interior forces fluid downward where it is routed directly to the rear drain. The upper plenum
1
_______________Manuscript approved November 28, 2007.

closes inside the base providing an overlapping seal. A proprietary motor seal protects the motor and control electronics from chemical contamination. This unique seal has proven to be sub-micron particle-free during field testing. A nitrogen-purged process chamber (60 psi) is standard. After a substrate is loaded on to the chuck, vacuum hold-down is engaged from the side mounted control panel. The vacuum requirements were 25-28” Hg with flow volume of 4.5 scfm (McMaster Carr oil free vacuum pump). With the lid closed, a preprogrammed spin process is selected and then initiated. The program may contain several steps. In each of them, the time and the rotation speed were specified.
Figure 1. Spin coater
− Spin coating program
As a rule of thumb, an increase of the spin rate will cause a decrease of the film thickness. However, this does not necessarily mean that it will keep the ultra-thin film uniform. Spin rates of 3000 rpm are accepted to be well suited for polymer applications. Typically, the spin coating procedure includes an acceleration step, usually at lower speed of 500 rpm for 5 s, followed by the main step of 3000 rpm for 1 min and then the third step would be low spin rate at 100 rpm for 5 s. The first few seconds of the spinning are very important and it was found that the first step of 500 rpm should be omitted in order to increase the uniformity of the polymer thin film.
2

b) Data analysis techniques
− Goniometer
Contact angle measurements were performed with goniometer (rame′-hart, inc.). The goniometer has the capability of measuring the advancing and receding contact angles, although this feature was not used in this work. Drops of selected test liquid, in this case water, were positioned on the surface with micro-syringe. The droplet volume was 2 μl. The contact angles of three drops were measured for each sample.
− Film thickness measurements
Film thickness measurements were performed using three different techniques including a n&k spectrometer (n&k Technology, Inc.), an alpha step profilometer (KLA Tencor) and an ellipsometer (J.A. Woollan Co, Inc.). The n&k spectrometer measured the refractive (n) and the transmittance (k) index of the material and from this data, the film thickness was estimated. It should be pointed out that n&k spectrometer is better suited for measurements of oxides including SiO2, TiO2 and others. Measurements of polymer thickness were possible but the accuracy of the data needed verification. The procedure used in this study for polymer thickness estimation was as follows. First, the thickness of the native SiO2 of a clean Si wafer was estimated. Then in the model, SiO2 layer thickness was fixed and a second layer was added. Because the software did not include the polymers of interest, the layer was named “unknown” and the x-film fitting procedure was chosen to estimate the polymer layer thickness. The fits had accuracy better than 99.9995 %. However, in some cases the estimated index of refraction by the software did not agree with literature values. These were 1.5894, 1.54 and 1.4735 for polystyrene, high density polyethylene and isotactic polypropylene respectively.
The alpha-step profilometer was used to verify the obtained film thicknesses. A copper electrical tape and a high conductive aluminum tape were applied to produce the step needed for reference. The measurements of film thickness with a profilometer were straight forward. However, the preparation of a clear step to distinguish between the untreated substrate and the deposited layer on it was challenging for several reasons. These include the nanometer scale film thickness and the chosen procedure for film deposition. During spin coating there was always the possibility that some of the solvent would penetrate below the tape making the film thickness measurement more challenging because of the lack of clear thickness contrast. Even though these limitations were acknowledged attempts to measure film thickness using profilometer were undertaken.
A variable angle spectroscopic ellipsometry (J. A. Woollam Co., Inc) was used to check the estimated thicknesses determined from the n&k spectrometer and the alpha-step profilometer. At any particular angle of incidence and wavelength, two independent measurements can be made- the real and imaginary part of the complex reflectance ratio [4] and from this information (using the models incorporated in the software) the film thickness and optical constants of any material could be determined. In this study three different angles of incidence were employed including 55°, 60° and 65°. The data were fitted using a similar approach to the n&k spectrometer procedure discussed above. First,
3

the thickness of the SiO2 layer on clean Si wafer was estimated. Then, a multilayer Cauchy model was built, in which the SiO2 layer thickness was fixed and the thickness of the polymer layer was varied. For refractive indexes, the values mentioned above were used.
− Atomic force microscope The polymer surface morphology was studied over various scales using an atomic force microscope (Nanoscope III, Veeco Metrology, Santa Barbara, CA) operated in tapping mode. Surface images were obtained from 1 μm x 1 μm, 10 μm x 10 μm, 20 μm x 20 μm and 50 μm x 50 μm area scans using resolution of 256 x 256 pixels. The scan rate was adjusted depending on the scan size, the small areas of 1 μm x 1 μm were scanned with a rate of 2 Hz and the areas of 10 μm x 10 μm and 20 μm x 20 μm were scanned with a rate of 1 or 1.5 Hz. The largest area of 50 μm x 50 μm was scanned with a rate of 0.7 Hz. The height scale was adjusted to accommodate the surface features. For a quantitative evaluation of the topography changes root-mean square roughness was
calculated from the surface height data zi as follows 1/2
2
1
1 N
q ii
R z zN =
⎡ ⎤= −⎢ ⎥⎣ ⎦∑ , where z is
the mean height distance.
− X-ray photoelectron spectroscope
Quantitative and qualitative chemical state analyses were performed by X-ray photoelectron spectroscopy (XPS). In XPS, monoenergetic x-rays are used to irradiate a material in high vacuum, leading to the emission of electrons. These photoelectrons are collected and the energy analyzed. The resulting spectrum consists of peaks that correspond to chemical bonds. Spectra were taken with Escalab 220 spectrometer (without charge compensation) using Al Kα (1486.6 eV) x-ray source at 15 kV, 500 μ and 150 W. An electron takeoff angle of 45°, measured from the sample surface, was used in all XPS measurements. The surveys were taken at pass energy of 100 eV, dwell time of 100 ms, large area XL lens mode, energy step size (resolution) of 1 eV. Si 2p, C1s, O1s and N1s spectra were taken with pass energy of 20 eV, varying number of scans from 6 to 20, dwell time of 100 ms, large area XL lens mode and an energy step size (resolution) of 0.1 eV. Pressure in the main chamber during analyzes was 2 x 10⁻⁹ Torr.
Using Unifit software, the background was fitted using the polynomial + Shirley function, defined in the Appendix. Then the experimentally determined peak shape was compared with a theoretical model curve to perform the analysis of the measured core level spectra. The theoretical curve has to be assembled from contributions of several species as well as a background or base line curve. The peak shapes are typically given by a Lorentzian contribution due to the limited life time of the core state and a Gaussian broadening mostly due to the measurement accuracy of the analyzer. A more adequate description of the core level line shape was obtained by convoluting Gaussian and Lorentzian contributions rather than by simply multiplying them (Voigt profile).
4

3. Results and discussion
− Si wafer cleaning
Proper choice of substrate is important for thin film preparation. The substrate surface characteristics, including contaminations on the surface affect the uniformity of the polymer film. For this study, prime grade 2” Si wafers were chosen because the manufacturer guarantees that there are no particulates, scratches, pits, hazes, dimples, craters, grooves or saw marks. Exposure of Si wafers to air introduces agglomeration of dust particles on the surface even when the processing is done in clean room and therefore should be minimized. However if the Si wafer needs to be cleaned the following should be considered. The standard cleaning solvents (methanol, ethanol, iso-propanol, toluene and acetone) introduced damage to the Si surface and should not be used. Sonication of Si wafer with deionized water (DI) water for 10 minutes, which is common cleaning method, caused agglomeration of particulates on the Si wafer that were easily observed and should be used with caution.
Other published standard cleaning procedures in the semiconductor industry for removal of metal oxides and organic contaminations were applied in this study as well. These include RCA 2 (6 parts DI water, 1 part 27 % HCl and 1 part 30 % H2O2) and Piranha (3 parts H2SO4 and 1 part H2O2). The exact procedure of treatment of Si wafer with RCA 2 solution was as follows: Si wafer was cleaned with DI water by spin coating. Then it was immersed in RCA 2 solution for 10 minutes. RCA 2 solution was prepared by mixing DI water and HCl and then heating to solution to 70 °C on hot plate. Then the solution was removed from the heat and H2O2 was added in small increments. The solution bubbled vigorously and after 1-2 min was ready to use. When the soaking time is over, the wafer was removed from the solution, rinsed with DI water and then spin coated with DI water again. When the Piranha solution was used, the same procedure was followed except for the preparation of the Piranha solution itself, which was made by mixing H2SO4 with H2O2. The mixture is self-heating and H2O2 should be added in small increments to H2SO4. The best results were obtained when the Si wafer was cleaned only by spin coating it with DI water. That procedure was as follows: (1) the substrate was positioned on the chuck; (2) a few drops were placed on the wafer, so that the latter was covered; (3) the wafer was spun for 1 min at 3000 rpm.
Images of the cleaned Si wafers shown in Figure 2 were obtained using optical microscope dark field light. Three different methods were compared: spin coating of Si wafer with DI water (Figure 2a), treatment of Si wafer with RCA 2 solution (Figure 2b) and with Piranha solution (Figure 2c). The highest particle agglomeration was obtained with Piranha solution, followed by RCA 2 and spin coating of the wafer with DI water.
5

(a) (b) (c)
Figure 2. Si wafer cleaning: (a) DI water treatment; (b) RCA solution; (c) Piranha solution.
− Si wafer drying
The drying of Si wafer should also be taken into consideration. Using pressurized dry nitrogen changes the surface. If solvent is to be removed from the surface the best way is to heat the wafer on a hot plate up to 60-70 °C (the heating temperature should be lower than the glass transition temperature) so that the residual solvent evaporates.
− Additional considerations: substrate positioning and the use of buffers
Substrate positioning on the vacuum chuck is important because tilting even by 1 or 2 degrees affects the centrifugal force that guides the spin coating process, i.e. non-uniform films are produced. As an example, polystyrene films produced with 2% solution of polystyrene in toluene deposited on 1”by 1” Si wafer and on 2” Si wafer are compared on Figure 3. Polypropylene films show the same trend when pieces of Si wafer were coated compared to 2 ” Si wafer, as shown in Figure 4.
As additional considerations, Si wafers have an inherent SiO2 layer (10-20 nm thickness in our case). HF buffer (10:1 solution of DI water with 50 % HF acid) is usually used for SiO2 removal. There are improved HF buffers commercially available. The etch rate is usually 100 nm/min and the Si wafer must be rinsed thoroughly with DI water. This buffer has to be used cautiously because the treated surface attracts air particulates very fast.
6

(c)(a)
(b)
Figure 3. Polystyrene films on Si wafer (2% solution): (a) and (b) 1” Si wafer pieces; (b) 2” Si wafer.
(a) (b)
Figure 4. Polypropylene films on Si wafer (2% solution): (a) Si wafer pieces; (b) 2” Si wafer.
− Polymer thin film solution preparation
• Polystyrene
The polymers used in this study were polystyrene (PS) (MW 280,000), polyethylene (PE) (MW 125,000) and isotactic polypropylene (PP) (MW12,000) and were supplied in pellet form. Because of the amorphous structure of polystyrene, dissolving PS is relatively easy. Toluene anhydrous 99.8 % (Sigma Aldrich) was chosen
7

as a solvent for polystyrene. Heating of the PS solution in toluene to 50 °C for 2 hours was sufficient to completely dissolve the polymer.
• Polypropylene and Polyethylene
Polyethylene and polypropylene have high crystallinity degree structures, which
means
Figure 5. Polypropylene films on a cold (a) and on t (b) substrates.
that to ensure dissolving of polymer pellets in solvent, the solution should be heated above the polymer melting temperature. These are 120-130 °C for polyethylene and 160-165 °C for isotactic polypropylene. To ensure fast polymer dissolving, the solvent must have a boiling point that is higher or comparable with the above mentioned temperatures and so decaline, anhydrous 99 % purity (Sigma Aldrich, mixture of cis and trans) was used (boiling point range of 189-191 °C). It should be pointed out that solutions of polyethylene and polypropylene in tetrahydrofuran and toluene are possible but require more than 6 hours to be obtained. When decaline was used as a solvent and the temperature was above 160 °C, complete polymer dissolving in both PE and PP cases were obtained in less than 3 hours. After the solution has been obtained, great care must be taken with its handling. The droppers used to transport the solution to the wafer need to be heated to 120 °C. The spin coater chuck should be heated up to 60-80 °C as well. The Si wafers should also have temperatures above 160 °C to ensure uniform surface wetting. If the temperature is below this value, PP and PE solutions adhere non-uniformly due to the high solution viscosity, as shown in Figures 5 and 6 respectively.
(b)(a)
a ho
8

(a)
(b)
Figure 6. Polyethylene films on a cold (a) and on a hot (b) substrates.
Spin coating of high density polyethylene films was very challenging. The
obtained films had much higher surface roughness and worse uniformity compared to the polystyrene and polypropylene films, as will be shown later. These qualities should be improved using branched, low-density polyethylene because it will allow for more homogeneous solution and easier handling.
− Influence of the initial polymer concentration in the starting solution
The starting solution concentration also affects the spin coating process. Based on literature data [1] the dilute solutions used for spin coating should be less than 10 % in order to obtain good results. The concentration span of 0.5-10 % for polystyrene was studied. Above 4 %, the solutions were viscous and the obtained coatings were not uniform, as shown in Figure 7. For the processing experiments, 2 % solution (by weight) of polystyrene in toluene was chosen. Furthermore, coating 2“ wafer (Figure 3b) was found to give the best results, i.e. if smaller pieces for plasma processing are needed, the wafer should be broken after the polymer thin film preparation step.
(a) (b)
Figure 7. Polystyrene films produced from 8 % (a) and 10 % (b) solutions.
9

Due to the crystalline composition of polyethylene and polypropylene, a 0.5-6 % (by weight) solution span was investigated. Above 2 % the polymer solvent solutions were very viscous and therefore the obtained films were highly non uniform. The lower solution concentration range (0.5 and 1 %) also did not produce effective surface wetting. The best films were produced with 2 % solution (Figure 5b for polypropylene and Figure 6b for polyethylene).
− Aftertreatment
It should be pointed out the for additional solvent removal after spin coating, heating of the silicon wafer for 1 minute is also recommended by some researchers. In this study, additional substrate heating was not applied, because the majority of solvent evaporates in the first seconds of the spin coating process. Placing the coated Si wafer in an uncovered Petri dish in a dessicator for 24 hours proved to be sufficient for complete solvent removal.
− Analysis of the produced films
• Water contact angle measurements
Figure 8. Water contact angle measurements of polystyrene
The contact angle of polystyrene (Figure 8), measured using the goniometer, was
90° and was independent of the solution concentration. The contact angles for polypropylene and polyethylene were 100° and 126° respectively. These contact angles are indicative of the very low surface energies, characteristic of all polymers.
• Atomic force microscopy
The morphology of the polymers was studied using atomic force microscopy, as
discussed above. As shown in Figure 9, the RMS roughness in the produced film increased in the order polystyrene (0.5 nm), polypropylene (2 nm) and polyethylene (6 nm) for 1 x 1 μm scanned area. In the case of polystyrene, the roughness did not change when the scan area was increased by a factor of 10, as shown in Figure 10. This was not
10

the case with polypropylene where the roughness of 2 nm for 1 x 1 μm scanned area increased to 8 nm for scan areas of 40 x 40 μm, as shown in Figure 11. Thus an important consideration when performing atomic force microscopy, is that the choice of scan size should reflect the surface features and additional scans of areas 5 x 5 μm, 10 x 10 μm and 20 x 20 μm were included. It could be concluded that the minimum scan size that provides clear representation of the surface features was 20 x 20 μm; the RMS roughness did not change when scan size was increased beyond this area.
Figure 9. Polymer prepared by spin coating technique: (a) polystyrene; (b) polypropylene; (c) polyethylene. Scan area 1 x 1 μm, z=10 nm for polystyrene and polypropylene, z = 200 nm for polyethylene
Figure 10. Polystyrene film different scan areas (a) 1 x 1 μm and (b) 10 x 10 μm. The z range is the same 10 nm.
(b) (c)(a)
(a) (b)
11

(b)(a)
(d)(c)
Figure 11. Polypropylene film at different scan sizes; (a) 5 μm x 5 μm, (b) 10 μm x 10 μm; (c) 20 μm x 20 μm; (d) 40 μm x 40 μm.
• Film thickness analysis
Different techniques were employed to measure the film thickness. The results of each method agreed to within 10 %. The thickness of the polystyrene films was 100 nm and for the polypropylene case was 90 nm. The film thickness varied between substrates within 10 %. Polyethylene film thickness was difficult to measure. The profilometer measurements resulted in high thickness variations depending on the area, which was analyzed. This was related to the previously discussed difficulties in producing PE films.
• X-ray photoelectron spectroscopy analysis
In the case of polystyrene, as shown in the survey scan in Figures 12 only carbon
was detected. This means that the film was very uniform and pure. There was no water or oxygen incorporated in the polystyrene surface. The π-π shake up structure shown in Figure 13 indicated a well- organized surface.
12

Figure 12. Survey spectra of untreated polystyrene
Figure 13. C1s scan of untreated polystyrene
In the case of polypropylene, 0.3 at. % of oxygen and 0.5 at. % Si contamination was detected among the carbon peak, as shown in survey spectra in Figure 14. The oxygen incorporation is consistent with the literature data [5]. C1s scan shown in Figure 15 is different than the polystyrene case because polypropylene has only aliphatic chain.
13

Figure 14. Survey spectra of untreated polypropylene
Figure 15. C1s scan of untreated polypropylene
14

Figure 16. Survey scan of untreated polyethylene
Figure 17. C1s scan of untreated polyethylene
In the case of polyethylene, the composition of the surface as shown in Figure 16
was as follows 98 at. % carbon, 0.92 at. % oxygen and 0.95 % Si and 0.25 at % SiO2. This was again indicative of the fact that the uniformity of the film was poor. Individual scans of C1s (Figure 17), O1s (Figure 18a) and Si2p (Figure 18b) are provided for completeness of the investigation.
15

(a)
(b)
Figure 18. Area scans of untreated polyethylene: (a) O1s and (b) Si2p.
4. Conclusions
Ultra thin films were successfully produced by the spin coating technique. It was determined that there are numerous factors that can significantly impact the uniformity and the quality of the films. The produced films had thickness in the range of 100 nm and variable surface roughness ranging from 0.5 nm for polystyrene to 60 nm in the polyethylene case. The best results in terms of film thickness uniformity and chemical purity were obtained for polystyrene and polypropylene. The quality of the high density polyethylene film was not sufficient for use in plasma processing experiments.
16
5. Acknowledgements This work was funded by the Office of Naval Research. E. H. Lock was supported by NRC/NRL postdoctoral research fellowship. The authors would like to thank Bill Amatucci for the images of the polymer films, Dmitri Petrovykh and Paul Sheehan for their helpful discussions on XPS and ellipsometry.
6. References [1] D. B. Hall, P. Underhill, J. M. Torkelson, “Spin coating of thin and ultrathin polymer films”, Polymer Eng. Sci., vol. 38 (12), 2039 (1998) [2] O. Mellbring, S. K. Oiseth, A. Krozer, J. Lausmaa and T. Hjertberg, “Spin coating and characterization of thin high-density polyethylene films, Macromolecules, 34, 7496 (2001) [3] C. A. Wilson, R. K. Grubbs and S. M. George, “Nucleation and growth during Al2O3 atomic layer deposition on polymers, Chem. Mater., 17, 5625 (2005) [4] T. E. Jenkins, “Multiple-angle-of-incidence ellipsometry”, J. Phys. D: Appl. Phys. 32, R45 (1999) [5] G. Beamson, D. Briggs, “High resolution XPS of organic polymers. The Scienta ESCA 300 Database”, 1992, John Wiley&Sons, Chichester, pp. 57
17

7. Appendix A
− Contact angle measurements procedure (1) Focus on the top surface of the substrate at the edge nearest to the microscope. Adjust the substrate and the “base lien” to achieve coincidence (Figure A 1). (2) Deposit a small volume of liquid onto the substrate to form a sessile drop having a diameter of approximately 2.5 mm. The drop size may vary to suit certain studies. (Figure A 2) (3) Refocus the microscope and adjust the specimen platform to view the extreme left or right side of the sessile drop. Verify accuracy of focus by shifting the line of sight. If the drop profile appears to move relative to the “measuring cross line, proper focus is not attained. (Figure A 3) (4) Adjust the “measuring” cross line to tangency above the base of the drop to create a wedge of light bounded by the cross lines and the drop profile. (Figure A 4) (5) Slowly rotate the measuring cross line while adjusting the cross travel of the specimen stage assembly so that the wedge of light is gradually extinguished and the cross line attains tangency with the drop profile at the base of the drop. (Figure A 5)
(3) (5) (2) (4) (1)
Figure A. Schematics of contact angle measurements
− Principles of tapping mode AFM
Figure B (a) shows a cantilever oscillating in free air at its resonant frequency. A piezo stack excites the cantilever substrate vertically, causing the cantilever to move up and down. As the cantilever moves vertically, the reflected laser beam, or “return signal” deflects in a regular pattern over a photodiode array, generating a sinusoidal, electronic signal.
Figure B (b) represents the same cantilever at the sample surface. Although the piezo stack continues to excite the cantilever substrate with the same beam energy, the tip deflects in its encounter with the surface. The reflected laser beam reveals information about the vertical height of the sample surface and characteristics of the sample material itself. These material characteristics include elasticity, magnetism and presence of electrical forces.
18

(b) (a)
Figure B. Tapping cantilever in (a) free air and (b) on sample surface.
− Ellipsometry
Figure C. Geometry of an ellipsometric experiment, showing the p- and s- directions
Ellipsometry is a very sensitive technique that uses polarized light to characterize
thin films, surfaces and material microstructure. It derives its sensitivity from the determination of the relative phase change in a beam of reflected polarized light. The measured values are expressed as psi (Ψ) and delta (Δ). These values are related to the ratio of Fresnel reflection coefficients pR% and sR% for p- and s- polarized light (Figure C), respectively.
tan( )p i
s
Re
Rρ Λ= = Ψ
Because ellipsometry measures the ratio of the two values it can be highly accurate and very reproducible. Since the ratio is a complex number, it also contains “phase” information (Δ), which makes the measurement very sensitive.
19

− ESCA 300 spectrometer principle of operation
The main component parts of the spectrometer, as shown in Figure D are the rotating anode X-ray source, quartz crystal monochromator, high transmission/imaging lens, hemispherical analyzer and multichannel detector. All of these parts, together with the geometry of the sample analysis chamber and the charge compensation will be briefly described.
Hemispherical analyzer
CCD camera
Carousel
Sample
Electron gun
Monochromator
Ele
ctro
n le
ns
Rotating anode
Figure D. Outline of the ESCA 300 spectrometer
X-ray source
The rotating anode X-ray source is a 300 mm diameter titanium alloy disc , operating at pre-set speeds of either 4000 to 10 000 rpm. The electron beam from a two-stage Pierce-type gun is directed on to aluminum band to give Al Kα (1486.8 eV), after monochromation. The entire anode assembly is mounted on an X-Y table for ease of the alignment of the X-ray source with respect to the monochromator.
Monochromator X-rays from the rotating anode are collected by the monochromator and focused
on the sample. The average X-ray take off angle is 15°. The monochromator consists of seven toroidally bent crystals of α-quartz each 76 mm in diameter and arranged in three Rowland circles 650 mm in diameter. Each crystal is individually adjustable outside the vacuum system and the toroidal shape eliminates spherical aberration, thus ensuring a sharp focus at the sample. For Al Kα the energy spread of the monochromator output is predicted to be 0.26 eV.
20
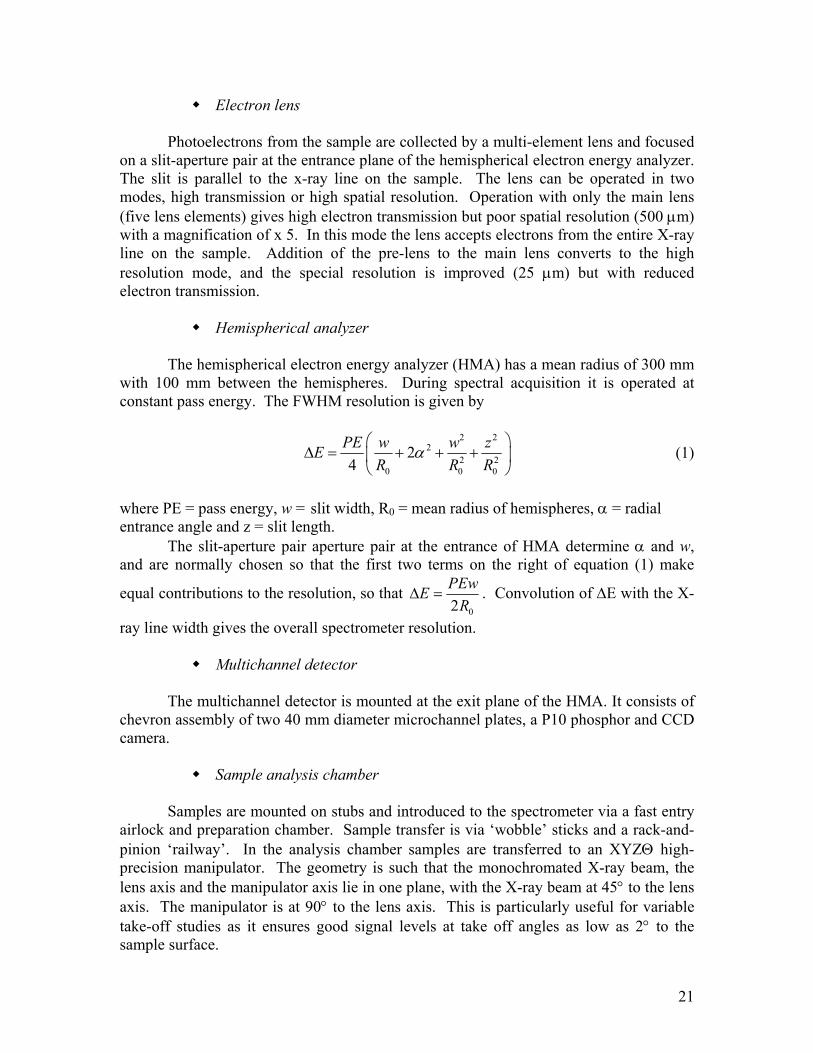
Electron lens
Photoelectrons from the sample are collected by a multi-element lens and focused on a slit-aperture pair at the entrance plane of the hemispherical electron energy analyzer. The slit is parallel to the x-ray line on the sample. The lens can be operated in two modes, high transmission or high spatial resolution. Operation with only the main lens (five lens elements) gives high electron transmission but poor spatial resolution (500 μm) with a magnification of x 5. In this mode the lens accepts electrons from the entire X-ray line on the sample. Addition of the pre-lens to the main lens converts to the high resolution mode, and the special resolution is improved (25 μm) but with reduced electron transmission.
Hemispherical analyzer
The hemispherical electron energy analyzer (HMA) has a mean radius of 300 mm
with 100 mm between the hemispheres. During spectral acquisition it is operated at constant pass energy. The FWHM resolution is given by
2 2
22 2
0 0
24
PE w w zE0R R R
α⎛ ⎞
Δ = + + +⎜⎝ ⎠
⎟ (1)
where PE = pass energy, w = slit width, R0 = mean radius of hemispheres, α = radial entrance angle and z = slit length.
The slit-aperture pair aperture pair at the entrance of HMA determine α and w, and are normally chosen so that the first two terms on the right of equation (1) make
equal contributions to the resolution, so that 02
PEwER
Δ = . Convolution of ΔE with the X-
ray line width gives the overall spectrometer resolution.
Multichannel detector
The multichannel detector is mounted at the exit plane of the HMA. It consists of chevron assembly of two 40 mm diameter microchannel plates, a P10 phosphor and CCD camera.
Sample analysis chamber
Samples are mounted on stubs and introduced to the spectrometer via a fast entry airlock and preparation chamber. Sample transfer is via ‘wobble’ sticks and a rack-and-pinion ‘railway’. In the analysis chamber samples are transferred to an XYZΘ high-precision manipulator. The geometry is such that the monochromated X-ray beam, the lens axis and the manipulator axis lie in one plane, with the X-ray beam at 45° to the lens axis. The manipulator is at 90° to the lens axis. This is particularly useful for variable take-off studies as it ensures good signal levels at take off angles as low as 2° to the sample surface.
21

Charge compensation
Polymers are insulators and by analyzing those in XPS, charges on the surface can build up and the analysis are disturbed. This is why a thermionic emission electron flood gun provides a flux of electrons and is mounted on the analysis chamber. Optimum charge compensation is achieved by varying the flood gun settings, sample positioning and sample orientation. Adjustments are made to maximize peak height and minimize peak width.
− Unifit data analysis
Background modeling and treatment
The shape of the spectrum background or baseline is affected by inelastic energy loss processes, secondary electrons and nearby peaks. A reasonable approximation is essential for a qualitative and quantitative analysis of XPS data especially if several components interfere in one spectrum. The choice of an adequate background model is determined by the physical and chemical conditions of the measurements and the significance of the background to the information obtained. The subtraction of the baseline before entering the fit iterations or the calculation of the peak area can be acceptable approximation for simple analytical problems. In order to obtain chemical and physical parameters in detail, however, it is absolutely necessary to include background function in the iterative peak fit procedure. The primary function F(E) results from the experimentally obtained M(E) and the background function U(E) as F(E) = M(E) – U(E). The kinetic energy E of the spectra can be described as E = SE+SW * (i-1), where SE is the start energy in eV, SW is the step width in eV and i is the channel number. It can very between 1 and N, where N is number of data points. In case of baseline calculation before initiating the fit procedure, the background is set to the averaged experimental function M in a sector around the chosen start and end channels. There are several ways to fit background including constant background, linear background, Shirley background, Tougaard background, polynomial + Shirley background. The constant background is obtained by substracting a constant from the measured spectrum. The linear background may be applied for spectra with small intensity differences between the low and high-energy side of the peak, i.e. surfaces that are hardly affected by inelastic losses. The Shirley model is a successful approximation for the inelastic background of core level peaks of buried species, which suffered significantly from inelastic losses of the emitted photoelectrons. The Tougaard background model was originally developed as an alternative to the Shirley background for transition metals and is therefore especially suited for asymmetrical signals like metal 4f lines. Polynomial + Shirely background was used in this study. The third order polynomial function allows the description of the contribution of the secondary electrons at low kinetic energies. The calculation is as follows with S(E) as the Shirely background. 2 3
2 2 2( ) ( ) ( ) ( ) (U E a b E E c E E d E E eS E= + − + − + − + )The parameter a is fixed at the minimum of the experimental function Min(M(E)), while b, c, d and e can be varied by the user.
22

Modeling of the peak shape
The theoretical curve has to be assembled from contributions of several species as well as a background or base line curve. Energy distribution curves in photoelectron spectroscopy may be theoretically characterized by spectral functions, which take into account all possible excitation processes in the sample. In most cases these spectral functions may be described by a set of peaks, e.g. main line and satellites, multiplets, doublets or even single lines. The peak shapes are typically given by a Lorentzian contribution due to the limited life time of the core state and a Gaussian broadening mostly due to the measurement accuracy of the analyzer. Gaussian contributions may also be related to thermal broadening, chemical, structural, and electronic inhomogeneties in the surrounding material.
Both the height-normalized Lorentzian function L(E)
12
0(( ) 1 E EL Eβ
−⎧ ⎫⎡ ⎤−⎪ ⎪= +⎨ ⎬⎢ ⎥
⎣ ⎦⎪ ⎪⎩ ⎭
and the Gaussian function G(E)
2
02
( )( ) exp ln 2 E EG Eβ
⎧ ⎫−= −⎨ ⎬
⎩ ⎭
are completely characterized by the peak parameters β, i.e. ½ of the full width at half maximum (FWHM) and E0, the peak position.
A frequently used approach to describe XPS core level lines has been the product or the sum of the Gaussian and Lorentzian functions of the same width. However a more adequate description of the core level line shape was obtained by convoluting Gaussian and Lorentzian contributions rather than by simply multiplying them (Voigt profile). This convolution is defined as follows:
( ) ( * ) ( ) ( )f E f L G L E G E E dE∞
−∞
′ ′ ′= = −∫
23
