preparation of the review relating to the large combustion...
TRANSCRIPT

Preparation of the review relating to the Large Combustion Plant Directive
A Report for European Commission,
Environment Directorate General
Final Report
July 2005
Entec UK Limited


Certificate No. FS 13881
Report for DG ENV-C.4 European Commission B-1049 Brussels Belgium
Main Contributors Alistair Ritchie Katherine Wilson Ben Grebot Robin Smale (OXERA) Wojciech Orzeszek (Energoprojekt) Sabrina Dann Layla Twigger Ian Spencer Andriana Stavrakaki
Issued by
…………………………………………………………
Alistair Ritchie
Approved by
………………………………………… Iain Johnston
Entec UK Limited Windsor House Gadbrook Business Centre Gadbrook Road Northwich Cheshire CW9 7TN England Tel: +44 (0) 1606 354800 Fax: +44 (0) 1606 354810
10819
h:\projects\em-260\10000 projects\10819 ec lcpd\final report\final report 05225.doc
Preparation of the review relating to the Large Combustion Plant Directive
A Report for European Commission, Environment Directorate General
Final Report
July 2005
Entec UK Limited
Certificate No. EMS 69090
In accordance with an environmentally responsible approach, this document is printed on recycled paper produced from 100% post-consumer waste, or on ECF (elemental chlorine free) paper

Final Report i
h:\projects\em-260\10000 projects\10819 ec lcpd\final report\final report 05225.doc
July 2005
10819
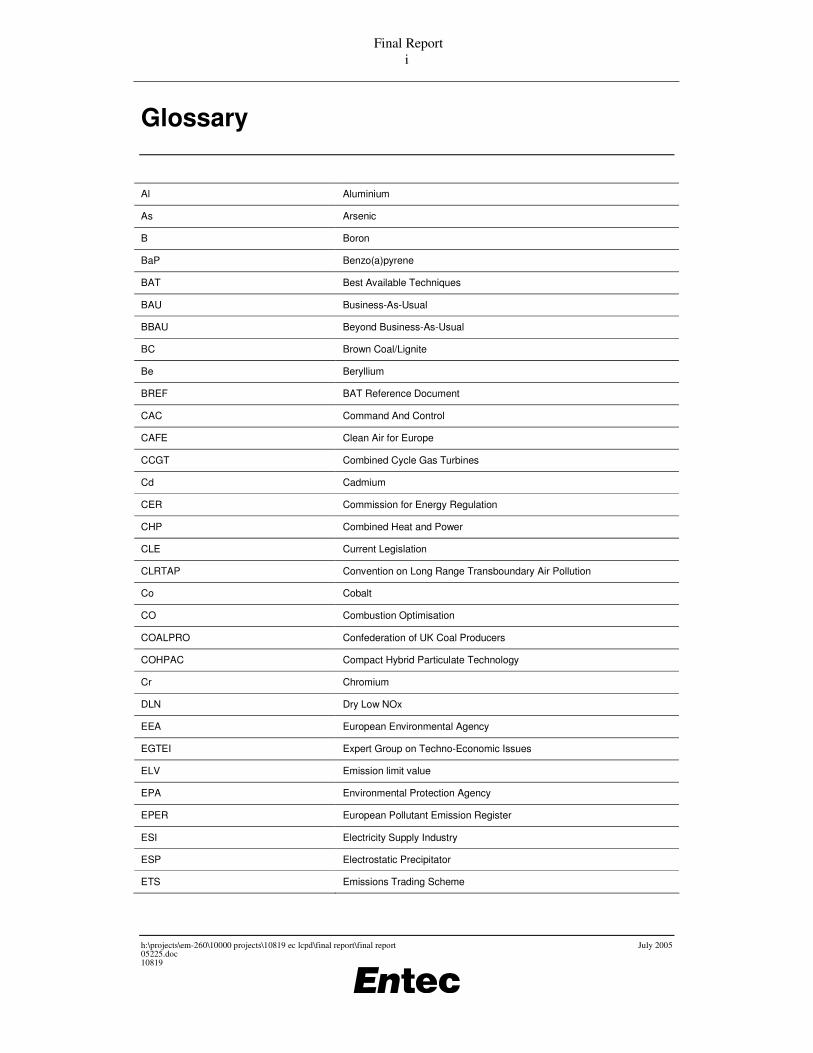
Glossary
Al Aluminium
As Arsenic
B Boron
BaP Benzo(a)pyrene
BAT Best Available Techniques
BAU Business-As-Usual
BBAU Beyond Business-As-Usual
BC Brown Coal/Lignite
Be Beryllium
BREF BAT Reference Document
CAC Command And Control
CAFE Clean Air for Europe
CCGT Combined Cycle Gas Turbines
Cd Cadmium
CER Commission for Energy Regulation
CHP Combined Heat and Power
CLE Current Legislation
CLRTAP Convention on Long Range Transboundary Air Pollution
Co Cobalt
CO Combustion Optimisation
COALPRO Confederation of UK Coal Producers
COHPAC Compact Hybrid Particulate Technology
Cr Chromium
DLN Dry Low NOx
EEA European Environmental Agency
EGTEI Expert Group on Techno-Economic Issues
ELV Emission limit value
EPA Environmental Protection Agency
EPER European Pollutant Emission Register
ESI Electricity Supply Industry
ESP Electrostatic Precipitator
ETS Emissions Trading Scheme

Final Report ii
h:\projects\em-260\10000 projects\10819 ec lcpd\final report\final report 05225.doc
July 2005
10819
EURELECTRIC Union of the Electricity Industry
FF Fabric Filter
FGD Flue Gas Desulphurisation
FGC Flue Gas Conditioning
FOE Friends of the Earth
HC Hard Coal
Hg Mercury
IEA International Energy Agency
IIASA International Institute for Applied Systems Analysis
IPPC Integrated pollution prevention and control
LCP large combustion plant
LCPD Large Combustion Plant Directive
LNB Low NOx Burner
LPG Liquefied Petroleum Gas
LTC Long Term Contract
MBI Market Based Instrument
Mn Manganese
Mo Molybdenum
NAAQS National Ambient Air Quality Standards
NECD National Emission Ceilings Directive
NERP National Emission Reduction Plan
Ni Nickel
NOx Nitrogen Oxide
NSPS New Source Performance Standards
OFA Overfire Air
OGP International Association of Oil and gas Producers
OTC Ozone Transport Commission
PAH Polycyclic Aromatic Hydrocarbons
Pb Lead
PCC Potential Combustion Concentration
PFC Progressive Flow Control
PM Particulate Matter
PM2.5 Particulate matter of less than 2.5 µm diameter
PM10 Particulate matter of less than 10 µm diameter
PP Public Power
RACT Reasonably Available Control Technology

Final Report iii
h:\projects\em-260\10000 projects\10819 ec lcpd\final report\final report 05225.doc
July 2005
10819
RAE Royal Academy of Engineering
RAINS Regional Air Pollution Information and Simulation
RECLAIM Regional Clean Air Incentives Market
RTC RECLAIM Trading Credits
Sb Antimony
SCR Selective Catalytic Reduction
SDA Spray Drier Adsorption
Se Selenium
Si Silicon
SIP State Implementation Plan
SNCR Selective Non Catalytic Reduction
SO2 Sulphur dioxide
TP Transition Period
TSO Transmission System Operators
UBA Umweltbundesamt (Germany’s Federal Environmental Agency)
UCTE Union for the Co-ordination of Transmission of Electricity
UKCS UK Continental Shelf
UKOOA UK Offshore Operators Association
UNECE United Nations Economic Commission for Europe
V Vanadium
VOC Volatile Organic Compound
Zn Zinc

Final Report iv
h:\projects\em-260\10000 projects\10819 ec lcpd\final report\final report 05225.doc
July 2005
10819

Final Report v
h:\projects\em-260\10000 projects\10819 ec lcpd\final report\final report 05225.doc
July 2005
10819
Executive Summary
Introduction Entec UK has undertaken a project for the European Commission to support the review of Directive 2001/80/EC, referred to as the Large Combustion Plant Directive (LCPD). This is the final report of the project, which presents the findings of the collection and analysis of information on a range of aspects related to large combustion plant emissions, in accordance with the overall project objectives.
This project is being undertaken in conjunction with the wider Clean Air for Europe (CAFE) Programme. In line with the project objectives, this project addresses a number of specific aspects related to the large combustion plant sector in the EU. It is understood that the conclusions on the need for further measures in relation to the LCPD, however, will be dependent not only on the findings of this project but also on the findings of other activities under the CAFE Programme.
A summary of some of the key findings of this study is presented below.
Key policies affecting air pollutant emissions from large combustion plants Brief details of some of the key policies affecting emissions of air pollutants from large combustion plants in the EU are presented in Section 2. Clearly the Large Combustion Plant Directive (LCPD) itself is of most direct relevance, and this is discussed, including information on national emission reduction plans submitted so far under the LCPD and details of implementation of this directive in the new Member States. This is followed by sections that identify whether and to what extent some Member States go beyond the LCPD ELVs in their own national legislation; the requirements of ‘best available techniques’ (BAT) under the IPPCD and key air quality directives. Key summary points include:
• Under the LCPD, Member States had the option of choosing a national emission reduction plan for existing plants instead of ELVs. For those Member States that have so far submitted a national emission reduction plan to the Commission (including Czech Republic, Finland, France, Greece, Ireland, Netherlands, Slovenia1 and UK), the targets of these plans are presented together with current emission levels for comparison. Compliance with the targets in these plans will be achieved through a mixture of abatement, fuel switching and reductions in load factors and will be decided by the operating companies themselves, closer to the LCPD compliance deadline for existing plants of 1 January 2008.
• Several new Member States have derogation allowances under the LCPD. Those with the most extensive derogation allowances, as well as the only countries with derogation allowances beyond 2008, include Estonia, Lithuania and Poland. Poland has, by far, the greatest number of plants with derogation allowances. However, Poland and Lithuania are also required to comply with conditions that set progressively tighter total emission ceilings for SO2 and NOx from the LCP sector.
1 Note that Slovenia withdrew its plan and opted for the ELV approach.
Final Report vi
h:\projects\em-260\10000 projects\10819 ec lcpd\final report\final report 05225.doc
July 2005
10819
As such, the true extent to which the derogation allowances are less stringent than the LCPD will be dependent on various factors, notably the projected fuel mixes for the electricity supply industry in these countries.
• Some Member States choose to set national ELVs for LCPs which go beyond those included in the LCPD. From a survey of Member States, it is clear that for existing plants many countries go further than the LCPD in terms of ELVs for at least one or more of the LCP pollutants of SO2, NOx or dust. In addition, a relatively small number of countries also impose ELVs for trace metals, with one country imposing ELVs for dioxins and PAHs. In contrast, for new plants most countries tend to set ELVs derived directly from the LCPD rather than going beyond it. For those countries that go beyond the LCPD for new plants, the additional stringency appears much less significant than for existing plants.
Large combustion plant emissions data Section 3 presents data on current and future emissions from LCPs across the EU25. The purpose of this section is to support conclusions on the quantity and profile of current emissions of key pollutants from LCPs, as well as an indication of the quantity and profile of future emissions of key pollutants expected under a ‘business as usual’ (BAU) scenario, incorporating the expected impact of agreed policies, including the current LCPD and IPPCD, to the extent that they have been taken into account in currently available modelling work.
By understanding the likely quantity and profile of future emissions from LCPs under a BAU scenario, it is then possible to give an indication of which types of LCPs and which pollutants may be of most interest in the event that any further reductions in emissions were required from the LCP sector. It is not within the scope of this study, however, to determine whether further reductions in LCP emissions would be required, in addition to those reductions expected under the BAU scenario.
Key summary points include:
Fuel types and trends
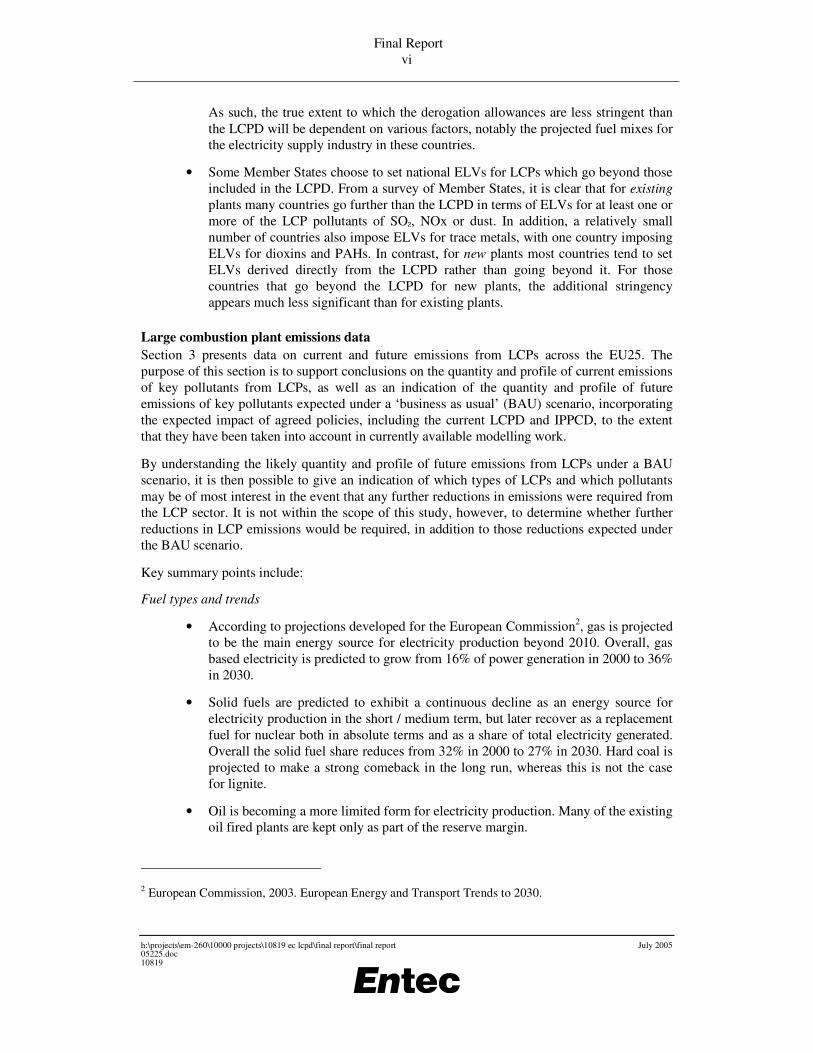
• According to projections developed for the European Commission2, gas is projected to be the main energy source for electricity production beyond 2010. Overall, gas based electricity is predicted to grow from 16% of power generation in 2000 to 36% in 2030.
• Solid fuels are predicted to exhibit a continuous decline as an energy source for electricity production in the short / medium term, but later recover as a replacement fuel for nuclear both in absolute terms and as a share of total electricity generated. Overall the solid fuel share reduces from 32% in 2000 to 27% in 2030. Hard coal is projected to make a strong comeback in the long run, whereas this is not the case for lignite.
• Oil is becoming a more limited form for electricity production. Many of the existing oil fired plants are kept only as part of the reserve margin.
2 European Commission, 2003. European Energy and Transport Trends to 2030.

Final Report vii
h:\projects\em-260\10000 projects\10819 ec lcpd\final report\final report 05225.doc
July 2005
10819
Emissions data sources
• A key source of current emissions data for LCPs is given in the emissions inventories submitted by Member States (so far only EU15) under the requirements of the LCPD.
• Future (2010) emissions projections by Member States are incorporated in their projections developed to meet the requirements of the National Emission Ceilings Directive (NECD), however the data is usually aggregated within national totals hence the specific contributions from LCPs are not clear.
• The RAINS web model, which is being used to support the Commission’s CAFE programme, provides an important source of data with which to investigate projections of emissions for the LCP sector at an EU25 level. The main RAINS scenario referred to in this study is the ‘CP_CLE’ scenario, as agreed with the Commission. It has been selected because it provides data for each EU25 Member State, it incorporates assumptions on current legislative controls3 and climate measures, and its use will enable consistency with other studies undertaken for the Commission.
• The CP_CLE scenario uses energy projections developed from the PRIMES model. An equivalent scenario (also accounting for current legislative controls and climate measures) has been developed which uses national energy projections submitted by Member States. This ‘NAT’ scenario is only currently available for 10 Member States, but a comparison with the ‘CP_CLE’ scenario reveals significantly higher emissions for the public power sector under the ‘NAT’ scenario compared to the ‘CP_CLE’ scenario for many countries. Due to the clear sensitivity of energy projections in overall emissions estimations, it is therefore recommended that national energy projections are also taken into account when informing future policy developments affecting the LCP sector.
• It should be noted that the RAINS model does not have a specific sector for LCPs, with the best match given by the ‘Public Power’ (PP) sector. Overall this is thought to potentially underestimate LCP emissions because it excludes industrial boilers and process heaters (that are incorporated within various other sectors in the model), although this will be counteracted to some extent by the inclusion of plants <50MWth (ie not LCPs) within the PP sector. The match between LCPs is further complicated by the different definitions of ‘existing’ and ‘new’ plants between RAINS (based on PRIMES inputs with a cut-off year of 1995) and the LCPD (cut-off date of 1 July 1987).
• The ‘capacity controlled’ data (data on the percentage uptake of specific abatement measures for specific sector / fuel combinations) within the RAINS model is a significant variable affecting overall emissions and consultations between IIASA and Member States have sought to review and, where necessary, correct this and other key data within the model. However, due to the significance of these assumptions on emissions estimates, it is recommended that if using the RAINS model to inform policy developments affecting the LCP sector, then positive
3 Including the Large Combustion Plant Directive.

Final Report viii
h:\projects\em-260\10000 projects\10819 ec lcpd\final report\final report 05225.doc
July 2005
10819
confirmation is gained from Member States that the assumptions within the model represent best available data. For example, some general observations on the data include higher than expected levels of future uptake of SCR for coal, lignite and gas plants, which may lead to an underestimation in NOx emission projections.
• The European Pollutant Emissions Register (EPER) provides an additional source of data on emissions from LCPs. However, this data is likely to represent an underestimation because emissions from LCPs at some sites (eg petroleum refineries) are reported under separate sectors and the data is dependent on the completeness of reporting for each site. As such, the EPER emissions data is only used in this study when more robust data is not available.
• To supplement the abovementioned sources, Entec has gathered data at a plant level on emissions, activity levels, fuel types and abatement techniques for LCPs. This covers a large number of EU25 member states and focuses on the dominant LCP sector, namely the electricity supply industry. For each Member State information was sought on a representative plant in each of a number of categories (based on size, age and abatement levels), with plants considered as representative within a category where the capacity, activity rate (load factor) and level of emission control was broadly typical of the category as a whole.
SO2 emissions
• According to the emission inventories submitted under the LCPD, total current SO2 emissions from LCPs in EU15 are in the region of 3600kt.
• Within this total, the majority is from plants >500MWth (71%), with 11% from 300-500MWth plants, 9% from 50-300MWth plants and 11% from petroleum refineries. However the proportionately tighter requirements in the LCPD on larger plants is expected to increase the relative contribution from smaller plants and petroleum refineries in the future.
• According to the RAINS CP_CLE scenario, SO2 emissions from public power plants in EU25 are estimated to decline between 2000 and 2020 both in absolute terms (5015kt to 606kt) and relative terms in comparison to emissions from all RAINS sources (57% to 22%).
• Within the public power sector, the fuel types contributing greatest SO2 emissions by 2020 are hard coal (39% of emissions from public power) and lignite (33%).
• The RAINS model estimates that the average level of sulphur in hard coal is 1.2% in EU25, and the average for lignite is 1.1%. However, the lower calorific value of lignite means that its sulphur content per unit energy is higher for lignite than hard coal. These sulphur levels are generally higher than levels for internationally traded coal.
• Based on data gathered for this study from a number of selected power stations across the EU25, SO2 emissions per MWh of electricity produced are shown below:

Final Report ix
h:\projects\em-260\10000 projects\10819 ec lcpd\final report\final report 05225.doc
July 2005
10819
Fuel General range in current emissions (kg per MWh), selected power stations in EU25
FGD No FGD currently
Coal 0.1 to 5, some values higher 1 to 20, some values higher
Lignite 0.1 to 2, some values higher 1 to 35, some values higher
Oil 0.1 to 0.3 (limited data points) 1 to 15
NOx emissions
• According to the emission inventories submitted under the LCPD, total current NOx emissions from LCPs in EU15 are in the region of 1500kt.
• Within this total, the majority is from plants >500MWth (72%), with 10% from 300-500MWth plants, 12% from 50-300MWth plants and 7% from petroleum refineries. As for SO2, the proportionately tighter requirements in the LCPD on larger plants is expected to increase the relative contribution from smaller plants and petroleum refineries in the future.
• According to the RAINS CP_CLE scenario, NOx emissions from public power plants in EU25 are estimated to decline between 2000 and 2020 both in absolute terms (2065kt to 801kt) and relative terms in comparison to emissions from all RAINS sources (18% to 14%).
• Within the public power sector, the fuel types contributing greatest NOx emissions by 2020 are gas (45% of emissions from public power) and hard coal (24%).
• Based on data gathered for this study from a number of selected power stations across the EU25, NOx emissions per MWh of electricity produced are shown below:
Fuel General range in current emissions (kg per MWh), selected power stations in EU25
SCR Primary measures only
Coal 0.4 to 1 1 to 4
Lignite No data (SCR not widely fitted to lignite plants)
0.5 to 3
Oil 0.3 to 0.4 (limited data points) 1 to 2
Dust and PM emissions
• Of the particle size fractions, PM2.5 is of most concern because it is associated with proportionately higher levels of trace metals and is more easily respirable than larger particle sizes.
• According to the RAINS CP_CLE scenario, PM emissions from public power plants in EU25 are estimated to decline between 2000 and 2020 both in absolute terms (249kt to 85kt for PM10 and 148kt to 55kt for PM2.5) and relative terms in

Final Report x
h:\projects\em-260\10000 projects\10819 ec lcpd\final report\final report 05225.doc
July 2005
10819
comparison to emissions from all RAINS sources (10% to 6% for PM10 and 9% to 6% for PM2.5).
• Within the public power sector, the fuel types contributing greatest PM10 and PM2.5
emissions by 2020 are hard coal (47% of PM10 emissions from public power and 44% of PM2.5 emissions) and lignite (40% of PM10 and PM2.5).
• Based on data gathered for this study from a number of selected power stations across the EU25, dust emissions per MWh of electricity produced are shown below:
Fuel General range in current emissions (kg per MWh), selected power stations in EU25
FGD No FGD currently
Coal 0.01 to 0.2 0.1 to 0.5
Lignite 0.01 to 0.2 0.1 to 2
Oil 0.02 (limited data) 0.01 to 1
• For dominant LCP sources of PM, namely large coal and lignite power stations, according to the RAINS model, a large proportion of plants are assumed to be fitted with more than 2 ESP fields which are assumed to achieve high levels of abatement of PM2.5 (99.0%), and 99.6% abatement of PM10.
• Of the PM that is emitted from these plants, the majority is expected to be PM2.5. As it is not generally possible to vary any ratio between fractional abatement efficiencies for coarse and fine PM in a practical way in ESPs (the dominant PM abatement technique by far in the power sector), lowering the amount of overall PM emissions will also lower the amount of PM2.5. Therefore, the requirement for any further reductions in PM2.5 emissions from such power stations could effectively be achieved through tighter overall dust emission standards.
Heavy metal emissions
• Heavy metals in coal and lignite are normally several orders of magnitude higher than in oil (except occasionally for nickel and vanadium in heavy fuel oil) or natural gas.
• There can be significant variations in the concentration of mercury and other heavy metals in coal and lignite between different countries and between different mines within the same country.
• Key heavy metals in LCP emissions, with the exception of mercury, are associated with particulate matter. As such, measures focussed on particulate matter abatement will also be the most appropriate measures for abating those types of metals, and can achieve high levels of abatement (generally over 99% abatement is possible with ESPs and FGD). For these metals, dust emission standards can represent an effective proxy for the control of such metal emissions from LCPs. The use of dust emission standards in this way would also avoid the potential difficulties associated with direct heavy metal emission limit values, namely that there can be very significant variations in the heavy metals content of the same type of fuel, but from different mines or crude types.
Final Report xi
h:\projects\em-260\10000 projects\10819 ec lcpd\final report\final report 05225.doc
July 2005
10819
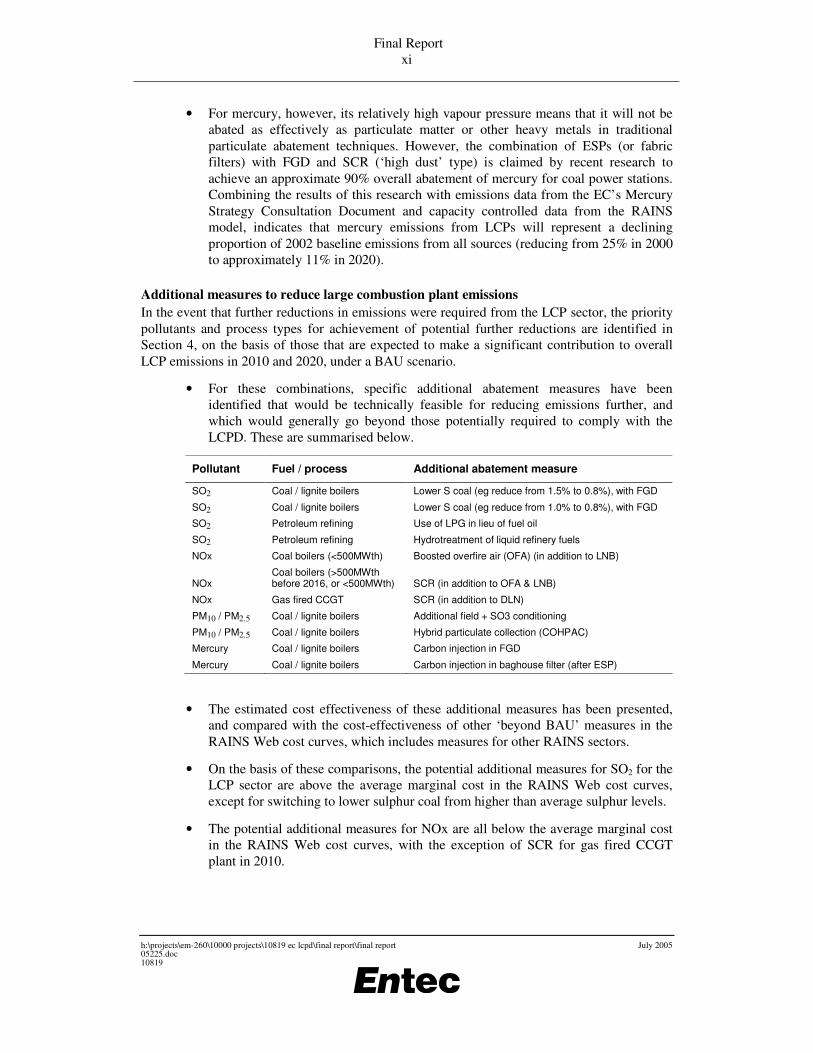
• For mercury, however, its relatively high vapour pressure means that it will not be abated as effectively as particulate matter or other heavy metals in traditional particulate abatement techniques. However, the combination of ESPs (or fabric filters) with FGD and SCR (‘high dust’ type) is claimed by recent research to achieve an approximate 90% overall abatement of mercury for coal power stations. Combining the results of this research with emissions data from the EC’s Mercury Strategy Consultation Document and capacity controlled data from the RAINS model, indicates that mercury emissions from LCPs will represent a declining proportion of 2002 baseline emissions from all sources (reducing from 25% in 2000 to approximately 11% in 2020).
Additional measures to reduce large combustion plant emissions In the event that further reductions in emissions were required from the LCP sector, the priority pollutants and process types for achievement of potential further reductions are identified in Section 4, on the basis of those that are expected to make a significant contribution to overall LCP emissions in 2010 and 2020, under a BAU scenario.
• For these combinations, specific additional abatement measures have been identified that would be technically feasible for reducing emissions further, and which would generally go beyond those potentially required to comply with the LCPD. These are summarised below.
Pollutant Fuel / process Additional abatement measure
SO2 Coal / lignite boilers Lower S coal (eg reduce from 1.5% to 0.8%), with FGD
SO2 Coal / lignite boilers Lower S coal (eg reduce from 1.0% to 0.8%), with FGD
SO2 Petroleum refining Use of LPG in lieu of fuel oil
SO2 Petroleum refining Hydrotreatment of liquid refinery fuels
NOx Coal boilers (<500MWth) Boosted overfire air (OFA) (in addition to LNB)
NOx Coal boilers (>500MWth before 2016, or <500MWth) SCR (in addition to OFA & LNB)
NOx Gas fired CCGT SCR (in addition to DLN)
PM10 / PM2.5 Coal / lignite boilers Additional field + SO3 conditioning
PM10 / PM2.5 Coal / lignite boilers Hybrid particulate collection (COHPAC)
Mercury Coal / lignite boilers Carbon injection in FGD
Mercury Coal / lignite boilers Carbon injection in baghouse filter (after ESP)
• The estimated cost effectiveness of these additional measures has been presented, and compared with the cost-effectiveness of other ‘beyond BAU’ measures in the RAINS Web cost curves, which includes measures for other RAINS sectors.
• On the basis of these comparisons, the potential additional measures for SO2 for the LCP sector are above the average marginal cost in the RAINS Web cost curves, except for switching to lower sulphur coal from higher than average sulphur levels.
• The potential additional measures for NOx are all below the average marginal cost in the RAINS Web cost curves, with the exception of SCR for gas fired CCGT plant in 2010.
Final Report xii
h:\projects\em-260\10000 projects\10819 ec lcpd\final report\final report 05225.doc
July 2005
10819
• Furthermore the potential additional measures for PM2.5 are also below the average marginal cost in the RAINS Web cost curves.
• It is emphasised that whilst the potential position of a measure in a single-pollutant cost curve is a useful gauge of its cost-effectiveness, other factors to be taken into account include the additional benefits due to potential abatement of other pollutants. This could be a significant issue for some of the measures for the LCP sector, including the PM2.5 and mercury measures and the SO2 measures for the petroleum refining sector.
• Furthermore, whilst the scope of this particular study does not extend to a cost-benefit analysis, it would clearly be necessary to consider the costs in more detail (including absolute costs and relevant wider economic impacts) and to quantify the health and environmental benefits of any potential emissions reductions in the event of further policy development related to potentially tighter standards in the LCP sector.
Assistance on possible end dates or of lower limit values for the NOx ELV derogation A brief section (Section 5.1) provides supporting information related to possible end dates or lower limit values for the derogation contained in footnote 2 to Annex VI A. This derogation allows operators of solid fuel LCPs >500MWth a less stringent NOX ELV if they do not operate for more than 2,000 hours per annum until 31/12/15 (ELV of 600 vs 500mg/Nm3) and 1,500 hours per annum after 01/01/16 (ELV of 450 vs 200mg/Nm3). Key summary points include:
• At the present time it is difficult to foresee a significant number of plants seeking to qualify for this low load factor derogation allowing less stringent NOx ELVs. This is due to economic constraints of operating at very low load factors combined with only a limited relaxation in emission standards (for the period to 2016). As such, plants covered by this derogation are expected to make only a relatively small contribution to overall NOx emissions from the LCP sector.
• Furthermore, until 2016, the slightly more relaxed ELV appears sensible in making provision for potential technical difficulties of older (and potentially low load factor) boilers fitting OFA. Beyond 2016, the less stringent ELVs should still trigger advanced primary NOx abatement measures, which would be an appropriate measure for very low load factor plants, rather than SCR.
• However, it would be recommended that a more accurate indication of the potential uptake of this derogation is sought in 2008, to assess how significant the derogation is in terms of emissions. Following this a further review could be undertaken of the potential need to tighten the ELVs from 2016 for low load factor plants, based on the information available at that time on achievable emission levels for advanced primary NOx measures (eg OFA, reburn, etc).
Potential inclusion of offshore gas turbines in the LCPD The current LCPD excludes from its scope gas turbines used on offshore platforms, although these are covered under the IPPC Directive. In contrast, onshore gas turbines licensed from 27 November 2002, and with a thermal input of at least 50MW, are included within the scope of the directive. A brief section (Section 5.2) provides supporting information related to the potential justification, if any, for inclusion of offshore gas turbines (of at least 50MWth) within
Final Report xiii
h:\projects\em-260\10000 projects\10819 ec lcpd\final report\final report 05225.doc
July 2005
10819
the scope of the directive. The focus is specifically concerned with NOx emissions, to be consistent with the pollutant of concern for gas turbines in the current LCPD, and to reflect the dominant LCPD pollutant from this type of plant. Key summary points include:
• According to industry estimates, projected NOx emissions from the offshore gas turbine sector are expected to represent a relatively small and decreasing share of overall NOx emissions from the EU25 LCP sector from 2010 to 2020, although there is greater uncertainty in the potential contribution to be made by new gas turbines.
• The available information indicates that the most applicable NOx abatement technology for offshore gas turbines is DLN.
• For dual fuel gas turbines, DLN does not appear to be proven at the current time for the offshore sector due to operational problems experienced in practice and by fuel constraints.
• For single fuel gas turbines, DLN does not appear to be proven where the field gas is of variable or inappropriate composition.
• Within the offshore sector, this technology is most applicable to new single fuel (gas fired) gas turbines using gas with a reasonably steady and acceptable composition. This technology is estimated to have a low range cost of approximately �310/t NOx abated. Whilst this is well below the average marginal cost for ‘beyond BAU’ NOx measures (according the RAINS Web cost curves described in Section 4), potential impacts of reduced reliability, higher maintenance and higher fuel consumption costs would increase this cost, although these elements are difficult to estimate, being very application specific.
• Furthermore, whilst retrofitting DLN technology has been undertaken in practice in a small number of offshore examples, experience shows it to be significantly more expensive than the application of this technology to new gas turbines (a low range estimate of the marginal cost is �1570/t) due to the potential requirement for modifications to other equipment and the potential impacts on production during the retrofitting period. Furthermore, it is possible that not all gas turbine types in operation will be upgradable to DLN technology.
Effects of differences between Community environmental standards for the LCP sector Section 6 investigates the effects of differences between the Community environmental standards for the LCP sector on competition in the energy market, focussing particularly on where there is expected to be a delay in meeting the LCPD requirements due to derogation allowances for new Member States. In addition, this section gives brief consideration to the effects of differences in standards on the environment. Key summary points include:
• The currently available capacity of European interconnection is reported to be insufficient to satisfy demand for exchange within a single market. However, ‘bottleneck’ congestion points have been identified and the Commission has put forward an action plan to address this issue. Further integration of administrative networks is also planned, with regionalised integration of markets expected to develop prior to full harmonisation within a single market.

Final Report xiv
h:\projects\em-260\10000 projects\10819 ec lcpd\final report\final report 05225.doc
July 2005
10819
• Domestic market conditions play an important role in allowing competition between domestic and import suppliers. These issues are addressed within the European Union by the implementation of Electricity Directive (2003/54/EC). Full supply market opening to non-household customers, allowing customers to choose their supplier is set for 2004.
• The Member States with the greatest capacity to generate electricity from coal and oil fired plants (the key fuel types affected by the LCPD ELVs) are Germany, Greece, Spain, Italy, the UK, Czech Republic and Poland. Of these Member States, Poland appears to have greatest potential for export from power stations without flue gas desulphurisation (FGD).
• Whilst Poland has a transition period of 8 years for the SO2 requirements (and 2 years for the 2016 NOx requirements), it is roughly estimated that the associated Accession Treaty emission ceilings will have the effect of reducing this transition period to about 4 years. Therefore the length of time for which lower emission standards will apply is expected to be shorter than implied in the Accession Treaty. Furthermore, during this time, the scope for Poland to export electricity to countries with tighter standards is likely to reduce from current levels due to increased domestic demand for electricity and reductions in power plant capacity. The picture is expected to be broadly similar for other new Member States with derogation allowances, although on a less substantial scale to that of Poland.
• On the basis of this brief investigation, the overall situation is that whilst there is the potential for countries with derogation allowances to take advantage of lower emission standards, in practice the scope for this is expected to be relatively limited and declining in the future.
• Due to the multitude of policies affecting the environmental impact of air emissions from LCPs (including LCPD, IPPCD, Air Quality Daughter Directives, National Emission Ceilings Directive, etc) and the different options that operating companies have got in response to these policies, it is not possible to draw any broad conclusions on the effects of differences between the Community environmental standards for the LCP sector on the environment. Notwithstanding this, it is clear that the differences in LCP standards themselves are becoming smaller in time, between the best and the worst performing ‘old’ Member States, and between the ‘old’ and ‘new’ Member States.
Screening level analysis of the feasibility and desirability of market based instruments for SO2 and NOx in the EU LCP sector Section 7 briefly identifies key aspects of EU and US approaches to reducing emissions of SO2 and NOx in the LCP sector, and incorporates a selection of case studies of market-based instruments (MBIs) that have been applied in practice to reducing SO2 and NOx emissions in the LCP sector, mainly in the USA, but with one example in the EU. By drawing on these case studies and other information, specific consideration is then given to the feasibility and desirability of market based instruments for reducing emissions of SO2 and NOx in the EU’s LCP sector. Within the scope of this project, this is a screening level analysis, and hence the discussions deal in outline terms only. Key summary points include:
Final Report xv
h:\projects\em-260\10000 projects\10819 ec lcpd\final report\final report 05225.doc
July 2005
10819
• While there are numerous options for the introduction of MBIs to control SO2 and NOx emissions in the EU, the most likely options are (a) a tax, (b) an emissions permit trading scheme and (c) some hybrid permit trading scheme with upper, or upper and lower, limits to permit prices set by a tax and subsidy.
• Relative to command and control (CAC) measures, MBIs offer the potential for compliance cost savings, both in a static (current) sense and dynamically through time due to the stimulus to technological innovation. Auctioned permits and taxes also generate government revenues which can be hypothecated to various uses, but notably to reducing other distortionary taxes and to encouraging further environmental improvement. The scale of the ‘double dividend’ associated with the former option is currently debated. Overall, while MBIs will not always secure cost efficiency gains over CAC, the general rule is that they will.
• While, in principle, optimally designed taxes and tradable permit schemes secure the same cost-efficient outcomes, various practical issues affect the choice between them: (a) where tradable permits are given freely, there is no government revenue effect; and (b) in the context of uncertainty about abatement costs, the choice between them depends on the relative steepness of the damage and abatement cost curves.
• As far as tradable permit schemes are concerned, it will be essential to ensure that:
• variations in abatement costs by emitters are sufficient to secure the cost reductions from trading;
• there are sufficient participants in the market to signal the right information about cost savings. On the broader scale, ensuring that there is adequate liquidity in the market;
• an emissions trading scheme does not generate ‘hot spots’ of unacceptable environmental quality. In practice, the potential for such ‘hot spots’ should be minimised by the effect of the Air Quality Daughter Directives, as well as the requirement to comply with BAT under the IPPCD. However, it may be necessary for any scheme to operate with side constraints on deposition effects or ‘exchange rates’;
• permits do not become concentrated in the hands of a few polluters;
• there is a provision for banking permits (reserving them for future use) in order to reduce risks associated with over-compliance;
• the schemes are not ‘over-designed’ by central authorities, leaving industry to promote trading rules within the overall environmental constraint;
• new entrants are not seriously disadvantaged, either by allocating free permits or enabling part of the cap to be auctioned;
• an effective monitoring and compliance system is in place—especially an effective penalty system for non-compliance or misreporting.
• As far as a tax solution is concerned, the following issues also need to be addressed: devising an effective system for the use of revenues, including analysis of the

Final Report xvi
h:\projects\em-260\10000 projects\10819 ec lcpd\final report\final report 05225.doc
July 2005
10819
relative merits of reducing other taxes and recycling of revenues to industry in proportion to environmental achievement; and, as with a trading scheme, ensuring that sectoral competitiveness is preserved.
• A hybrid trading/tax scheme can be more efficient than a tax or tradable permit scheme alone if it is carefully designed to have a tax rate setting an upper limit to the permit price and a subsidy setting a lower limit.
• Additional comments in the LCPD context include:
• while an emissions cap is consistent with the LCPD, as illustrated by the national emission reduction plan option for existing plants, the LCPD caps under these plans are annual and hence would not permit banking. This suggests setting a cap for any trading scheme lower than the total emissions cap - a ‘cap within a cap’;
• while it is well known that pure emissions trading secures potentially significant cost reductions, they have the potential to give rise to unacceptable locational pollution. In the context of LCPs, however, the likelihood for this should be minimised by the requirement to comply with pre-existing policies including the Air Quality Daughter Directives; BAT under the IPPC Directive; and the requirements of the current LCPD. Additional options to address this potential issue, however, appear limited. For example movement towards a theoretically desirable ambient-based trading scheme is limited because of high transaction costs; and one option is to adopt an ‘exchange rate’ approach, although some of the evidence suggests that this will severely limit cost savings;
• at the practical level, setting common tax rates may be more politically difficult than devising a trading scheme.

Final Report xvii
h:\projects\em-260\10000 projects\10819 ec lcpd\final report\final report 05225.doc
July 2005
10819
Contents
1. Introduction 1
1.1 This report 1 1.2 Background 1 1.3 Project Scope and Objectives 1 1.4 Structure of the report 3
2. Key Policies Affecting Air Pollutant Emissions from Large Combustion Plants 5
2.1 Introduction 5 2.2 Large Combustion Plant Directive 5 2.2.1 Introduction 5 2.2.2 Information on national emission reduction plans under the
LCPD 6 2.2.3 Information on implementation of the LCPD in New Member
States 7 2.3 National large combustion plant emission limit values 14 2.4 Best Available Techniques for large combustion plants 18 2.4.1 Introduction 18 2.4.2 Background to Best Available Techniques 18 2.4.3 Reference Documents on Best Available Techniques 19 2.5 Ambient air quality limit values 20 2.6 Summary 21
3. Large Combustion Plant Emissions Data 23
3.1 Introduction 23 3.2 Fuel types 24 3.2.1 Introduction 24 3.2.2 Current fuel mix 24 3.2.3 Future trends in fuel mix 27 3.2.4 Sulphur contents of fuels 28 3.2.5 Heavy metals content of fuels 32 3.3 LCPD emission inventory data 35 3.4 RAINS model data 38

Final Report xviii
h:\projects\em-260\10000 projects\10819 ec lcpd\final report\final report 05225.doc
July 2005
10819
3.4.1 RAINS scenarios 38 3.4.2 Applicability to LCP sector 39 3.4.3 Assumptions of uptake of abatement measures 40 3.4.4 Emissions data in CP_CLE_Aug04 scenario 48 3.4.5 Emissions data in NAT_Aug04 scenario 55 3.5 EPER data 55 3.6 NECD and UNECE/EMEP data 60 3.7 Plant level data 61 3.7.1 Survey of emissions and abatement data for selected plants in
the ESI 61 3.7.2 Survey of gas turbine manufacturers 68 3.7.3 Work by the Swedish NGO Secretariat on Acid Rain on the
performance range of existing power plants 69 3.8 Other data 70 3.8.1 Particle size distribution 70 3.8.2 Projections of heavy metal emissions 73 3.9 Summary of emissions data 76 3.9.1 Fuel types and trends 76 3.9.2 Emissions data sources 77 3.9.3 SO2 emissions 78 3.9.4 NOx emissions 79 3.9.5 Dust and PM emissions 80 3.9.6 Heavy metal emissions 80 3.10 References 81
4. Additional Measures to Reduce Large Combustion Plant Emissions 85
4.1 Introduction 85 4.2 Additional measures for SO2 86 4.2.1 Existing coal / lignite boilers 86 4.2.2 Existing oil fired boilers and process heaters in the petroleum
refining sector 89 4.3 Additional measures for NOx 91 4.3.1 Existing coal boilers 91 4.3.2 New gas fired gas turbines 93 4.4 Additional measures for dust, PM10, PM2.5 and particulate
bound heavy metals 94 4.4.1 Existing coal / lignite boilers 94 4.5 Additional measures for mercury 95 4.5.1 Existing coal and lignite boilers 95 4.6 Costs of additional measures 99

Final Report xix
h:\projects\em-260\10000 projects\10819 ec lcpd\final report\final report 05225.doc
July 2005
10819
4.6.1 Cost effectiveness of additional measures 99 4.6.2 Comparison of costs of additional measures for LCP sector with
RAINS model costs for all other sectors 101 4.7 Summary 109 4.8 References 110
5. Analysis of Other Specific Provisions of the LCPD 113
5.1 Assistance on possible end dates or of lower limit values for the NOx ELV derogation 113
5.1.1 Introduction 113 5.1.2 Potential significance of NOx emissions from plants covered by
this derogation 113 5.1.3 Cost-effectiveness of various NOx abatement measures 114 5.1.4 Summary 115 5.2 Potential inclusion of offshore gas turbines in the LCPD 115 5.2.1 Introduction 115 5.2.2 Relative significance of NOx emissions from offshore gas
turbines 115 5.2.3 Additional abatement measures for offshore gas turbines 117 5.2.4 Summary 121 5.2.5 References 122 5.3 Monitoring aspects 122 5.3.1 Comments on measurement requirements 122 5.3.2 Comparison of reporting requirements under the EPER and
LCPD 124 5.3.3 References 125
6. Effects of Differences between Community Environmental Standards for the LCP Sector 127
6.1 Introduction 127 6.2 Effects on competition in the energy market 127 6.2.1 Introduction 127 6.2.2 Interconnection 130 6.2.3 Administrative network developments 133 6.2.4 Internal market conditions 134 6.2.5 EU generation mix 136 6.2.6 Potential for electricity trade between countries with different
environmental standards 136 6.2.7 Power generation costs 138 6.2.8 Impact of differences in electricity generation costs on
competition in the energy market 141
Final Report xx
h:\projects\em-260\10000 projects\10819 ec lcpd\final report\final report 05225.doc
July 2005
10819
6.2.9 Summary 145 6.3 Effects on the environment 145 6.4 References 146
7. Screening Level Analysis of the Feasibility and Desirability of Market Based Instruments for SO2 and NOx in the EU LCP Sector 149
7.1 Introduction 149 7.2 EU and US approaches to reducing emissions of SO2 and
NOx in the LCP sector 150 7.2.1 Introduction 150 7.3 EU approaches for reducing emissions of SO2 and NOx in
the LCP sector 151 7.3.1 Overview of EU approaches 151 7.3.2 Market-based instrument case study 1: Swedish NOx charge 153 7.4 US approaches for reducing emissions of SO2 and NOx in
the LCP sector 157 7.4.1 Overview of US approaches 157 7.4.2 Market-based instrument case study 2: US Acid Rain
Programme 160 7.4.3 Market-based instrument case study 2: Ozone Transport
Commission (OTC) NOx Budget Program and NOx SIP Call Trading Program 166
7.4.4 Market-based instrument case study 3: Regional Clean Air Markets Initiative (RECLAIM) 169
7.4.5 Assessment of the relative stringency of the US emission trading schemes compared to the LCPD 173
7.5 Screening level analysis of feasibility and desirability of market based instruments for SO2 and NOx in the EU LCP sector 174
7.5.1 Rationale for introducing trading or taxation 174 7.5.2 Introducing trading or taxation in addition to existing CAC
regulation 178 7.5.3 Hybrid tax and permit trading schemes 180 7.5.4 The potential need for further reductions in EU SO2 and NOx
emissions beyond business as usual reductions 181 7.5.5 The technical feasibility of achieving further SO2 and NOx
emissions reductions in the EU LCP sector beyond business as usual reductions 181
7.5.6 Preliminary considerations of key design issues for trading schemes 182
7.5.7 Preliminary considerations of key design issues for tax schemes 187

Final Report xxi
h:\projects\em-260\10000 projects\10819 ec lcpd\final report\final report 05225.doc
July 2005
10819
7.5.8 Cost-effectiveness of MBIs for the EU LCP sector compared with tightening CAC legislation 188
7.5.9 Summary 189 7.6 References 191
Table 1.1 Project tasks 2 Table 2.1 Implementation of the LCPD in New Member States (EC, 2004) 8 Table 2.2 Comparison of national ELVs with those in the LCPD (existing plants) 14 Table 2.3 Comparison of national ELVs with those in the LCPD (new plants) 16 Table 2.4 EU ambient air quality limit values in First Daughter Directive (1999/30/EC) 20 Table 3.1 Sulphur content of fuels (%) burnt in existing and new power plants in EU25 29 Table 3.2 Sulphur content of fuels (%) per unit energy (GJ/tonne) burnt in new (PP_NEW) and
existing (PP_EX) power plants in Europe (EU-15, New Member States and EU-25) 30 Table 3.3 Sulphur content of coal used in Europe 31 Table 3.4 Sulphur content of coal used by two companies for power production 32 Table 3.5 Mercury content of coal and lignite 33 Table 3.6 Arsenic, cadmium, nickel and vanadium content of coal and lignite 34 Table 3.7 Information on Crude Oils 35 Table 3.8 Range of Ni Content in Heavy Fuel Oils 35 Table 3.9 SO2 emissions from all LCPs taken from Member States’ emissions inventories submitted
under the LCPD broken down by size band 36 Table 3.10 NOx emissions from all LCPs taken from Member States’ emissions inventories
submitted under the LCPD broken down by size band 36 Table 3.11 SO2 emissions from LCPs at petroleum refineries taken from Member States’ emissions
inventories expressed per unit of crude capacity 37 Table 3.12 Hard coal, existing plants, grade 1, all boiler types except wet bottom (figures are
percentages of capacity controlled by FGD) 42 Table 3.13 Hard coal, existing plants, grade 1, wet bottom boilers (figures are percentages of
capacity controlled by FGD) 43 Table 3.14 Brown coal/lignite, existing plants, grade 1, all boiler types except wet bottom (figures are
percentages of capacity controlled by FGD) 43 Table 3.15 Heavy fuel oil, existing plants, all boiler types except wet bottom (figures are percentages
of capacity controlled by FGD) 44 Table 3.16 Hard Coal, existing plants, grade 1, all boiler types except wet bottom (figures are
percentages of capacity controlled by SCR) 44 Table 3.17 Hard coal, existing plants, grade 1, wet bottom (figures are percentages of capacity
controlled by SCR) 45 Table 3.18 Brown coal/lignite, existing plants, grade 1, all boiler types except wet bottom (figures are
percentages of capacity controlled by SCR) (Note 1) 45 Table 3.19 Heavy fuel oil, existing plants, all boiler types except wet bottom (figures are percentages
of capacity controlled by SCR) 46 Table 3.20 Natural gas (incl. other gases), new plants (figures are percentages of capacity controlled
by SCR) 46 Table 3.21 Hard coal, existing plants, grade 1, pulverized fuel (figures are percentages of capacity
controlled by ESPs with more than 2 fields) 46 Table 3.22 Brown coal/lignite, existing plants, grade 1, pulverised fuel (figures are percentages of
capacity controlled by ESPs with more than 2 fields) 47 Table 3.23 SO2 emissions from existing and new power and district heat plants and all other RAINS
sources in EU25 broken down by fuel type (CP_CLE_Aug04) 51 Table 3.24 NOx emissions from existing and new power and district heat plants and all other RAINS
sources in EU25 broken down by fuel type (CP_CLE_Aug04) 52 Table 3.25 PM10 emissions from existing and new power and district heat plants and all other RAINS
sources in EU25 broken down by fuel type (CP_CLE_Aug04) 53 Table 3.26 PM2.5 emissions from existing and new power and district heat plants and all other RAINS
sources in EU25 broken down by fuel type (CP_CLE_Aug04) 54 Table 3.27 Emissions from power and district heat plants in ‘NAT’ scenario expressed as a
proportion of emissions in ‘CP_CLE’ scenario 55 Table 3.28 SO2, NOx and PM10 emissions from combustion installations (>50MWth) and all sources
as reported to the EPER for 2001 56 Table 3.29 Heavy metal emissions from combustion installations (>50MWth) and all sources as
reported to the EPER for 2001 and emissions data for mercury for 2000 presented in the EC Consultation Document - Development of an EU Mercury Strategy, (2004b) 58
Table 3.30 Emissions of mercury in Poland in 2001 (from national submission to UNECE) 60 Table 3.31 Summary of data sources for emissions and abatement data for selected plants in the
ESI 62

Final Report xxii
h:\projects\em-260\10000 projects\10819 ec lcpd\final report\final report 05225.doc
July 2005
10819
Table 3.32 Information for land based gas turbines >50MWth licensed before 27 November 2002 68 Table 3.33 Information for land based gas turbines >50MWth licensed after 27 November 2002 69 Table 3.34 Particulate abatement efficiency for existing hard coal and lignite power stations 71 Table 3.35 Impact of different levels of particulate abatement on residual concentrations and size
fractions 71 Table 3.36 Proportion (%) of PM2.5 and PM10 in emissions from LCPs with or without abatement
technology (members of EURELECTRIC and VGB) 72 Table 3.37 Abatement efficiency of metals by traditional abatement techniques for LCPs 74 Table 3.38 Mercury emission projections from combustion installations (>50MWth) (tonnes) 75 Table 4.1 Examples of pollutants, fuel types, and process types for potential consideration for
achievement of further emissions reductions within the LCP sector 85 Table 4.2 Weighted average combustion related emissions (mg/Nm3) of SO2 for different European
areas 89 Table 4.3 Costs of additional measures for LCP sector 100 Table 4.4 Comparison of cost-effectiveness of additional measures in the LCP sector with average
cost effectiveness of beyond BAU measures in the RAINS Web cost curves 108 Table 5.1 Differences in marginal abatement costs for NOx control for plants at different load factors
(Note 1) 114 Table 5.2 Estimated number of existing UK offshore gas turbines (of at least 50MWth) and their
corresponding NOx emissions according to UKOOA 117 Table 5.3 Indicative capital costs of DLN technology for offshore gas turbines 120 Table 5.4 Marginal abatement costs of DLN for the offshore gas turbine sector 121 Table 5.5 Comments on measurement requirements 123 Table 5.6 EPER source categories relevant to LCPs 124 Table 6.1 Market liberalisation, EU and neighbouring countries 135 Table 6.2 Import-export trade balances for electricity* (TWh) 137 Table 6.3 Summary of costs of generating electricity (� per MWh) (Note 1) 138 Table 6.4 Costs of additional measures for LCP sector 140 Table 6.5 The Accession Treaty emission ceilings for Polish LCP sector 142 Table 6.6 Privatisation in Polish public power sector 1997-2004, main ownership 143 Table 6.7 Privatisation in Polish public power sector 1997-2004, percentage share 144 Table 7.1 Selection of some policies in the European Union and United States addressing
emissions of SO2 and NOx from LCPs 150 Table 7.2 SO2 and NOx emission limits under Standards of Performance for New Stationary Source
(Note 1) 158 Table 7.3 NOx emission limit values under Phase II of the Acid Rain Program 162 Table 7.4 Emission reduction requirements for OTC NOx Budget Program 167 Table 7.5 OTC NOx Budget Program state allocations and emissions (tons) 168 Table 7.6 Comparison between stringency of US emission trading schemes and the LCPD, based
on existing coal fired power station >500MWth 173 Table 7.7 Examples of additional measures to achieve further reductions in SO2 and NOx emissions
from the LCP sector 182 Figure 3.1 Generation mix in EU25 in 2001 (also covers Bulgaria and Romania) 25 Figure 3.2 Oil and coal fired electricity generation in EU25 in 2001 (Also covers Bulgaria and
Romania) 26 Figure 3.3 SO2 emissions from existing and new power and district heat plants and all other RAINS
sources in EU25 broken down by fuel type (CP_CLE_Aug04) 49 Figure 3.4 NOx emissions from existing and new power and district heat plants and all other RAINS
sources in EU25 broken down by fuel type (CP_CLE_Aug04) 49 Figure 3.5 PM10 emissions from existing and new power and district heat plants and all other RAINS
sources in EU25 broken down by fuel type (CP_CLE_Aug04) 50 Figure 3.6 PM2.5 emissions from existing and new power and district heat plants and all other RAINS
sources in EU25 broken down by fuel type (CP_CLE_Aug04) 50 Figure 3.7 Current SO2 emissions per MWh for selected coal power stations in EU25 64 Figure 3.8 Current SO2 emissions per MWh for selected lignite power stations in EU25 64 Figure 3.9 Current SO2 emissions per MWh for selected oil power stations in EU25 65 Figure 3.10 Current NOx emissions per MWh for selected coal power stations in EU25 65 Figure 3.11 Current NOx emissions per MWh for selected lignite power stations in EU25 66 Figure 3.12 Current NOx emissions per MWh for selected oil power stations in EU25 66 Figure 3.13 Current dust emissions per MWh for selected coal power stations in EU25 67 Figure 3.14 Current dust emissions per MWh for selected lignite power stations in EU25 67 Figure 3.15 Current dust emissions per MWh for selected oil power stations in EU25 68 Figure 4.1 RAINS Web cost curve for SO2 for 2010 showing position in cost curve where additional
measures for the LCP sector would fit 102 Figure 4.2 RAINS Web cost curve for SO2 for 2020 showing position in cost curve where additional
measures for the LCP sector would fit 103

Final Report xxiii
h:\projects\em-260\10000 projects\10819 ec lcpd\final report\final report 05225.doc
July 2005
10819
Figure 4.3 RAINS Web cost curve for NOx for 2010 showing position in cost curve where additional measures for the LCP sector would fit 104
Figure 4.4 RAINS Web cost curve for NOx for 2020 showing position in cost curve where additional measures for the LCP sector would fit 105
Figure 4.5 RAINS Web cost curve for PM2.5 for 2010 showing position in cost curve where additional measures for the LCP sector would fit 106
Figure 4.6 RAINS Web cost curve for PM2.5 for 2020 showing position in cost curve where additional measures for the LCP sector would fit 107
Figure 5.1 Application of various parts of the directive 122 Figure 6.1 Differences in environmental standards - a context for assessing effects on competition 129 Figure 6.2 Current trading Partnerships - physical energy flows (GWh), April - September 2003 131 Figure 6.3 Production of coal and lignite (2001) 139 Figure 7.1 Total and specific NOx emissions from boilers subject to the NOx charge (estimated for
1990) 155 Figure 7.2 Emissions of nitrogen oxides, 1980-2002 156 Figure 7.3 SO2 allowances traded, 1994-2002 161 Figure 7.4 Cumulative SO2 allowances transferred to the end of 2002 162 Figure 7.5 Price of SO2 allowances ($/ton) 163 Figure 7.6 SO2 emissions from acid rain sources, 1980 to 2002 165 Figure 7.7 Emissions of NOx under the RECLAIM program 172 Figure 7.8 Emissions of SOx under the RECLAIM program 172
Appendix 1 LCPD Emission Limit Values
Appendix 2 Details of Best Available Techniques from BAT Reference Documents Appendix 3 Mercury Contents of Coals Appendix 4 Emissions Data from RAINS Model Appendix 5 Emissions Data from Selected Plants

Final Report xxiv
h:\projects\em-260\10000 projects\10819 ec lcpd\final report\final report 05225.doc
July 2005
10819
Final Report 1
h:\projects\em-260\10000 projects\10819 ec lcpd\final report\final report 05225.doc
July 2005
10819
1. Introduction
1.1 This report Entec UK has undertaken a project for the European Commission (Contract No B4-3040/2003/360121/MAR/C1) to support the review of Directive 2001/80/EC, referred to as the Large Combustion Plant Directive (LCPD). This is the final report of the project, which presents the findings of the information collection and analysis that has been undertaken in relation to the overall project objectives.
1.2 Background Adopted in October 2001, the LCPD requires Member States to reduce emissions of sulphur dioxide (SO2), nitrogen oxides (NOX) and dust from power plants and other industrial facilities containing large combustion plants (LCPs). Reductions in emissions of the three pollutants of concern will yield reductions in acidification, ground level ozone and particulate matter, with subsequent improvements to human health and the environment.
The Directive also places a requirement for a review of its implementation and the potential for extension of the Directive’s requirements. In particular, Article 4(7) of the Directive specifies that “the Commission shall submit a report to the European Parliament and the Council in which it shall assess:
(a) the need for further measures;
(b) the amounts of heavy metals emitted by large combustion plants;
(c) the cost-effectiveness and costs and advantages of further emission reductions in the combustion plants sector in Member States compared to other sectors;
(d) the technical and economic feasibility of such emission reductions;
(e) the effects of both the standards set for the large combustion plants sector including the provisions for indigenous solid fuels, and the competition situation in the energy market, on the environment and the internal market;
(f) any national emission reduction plans provided by Member States in accordance with paragraph 6.
The Commission shall include in its report an appropriate proposal of possible end dates or of lower limit values for the derogation contained in footnote 2 to Annex VI A.”
1.3 Project Scope and Objectives The overall objective of the study is to contribute to the preparation of the review of the LCPD. The tasks undertaken have required the collection and analysis of information on a range of
Final Report 2
h:\projects\em-260\10000 projects\10819 ec lcpd\final report\final report 05225.doc
July 2005
10819
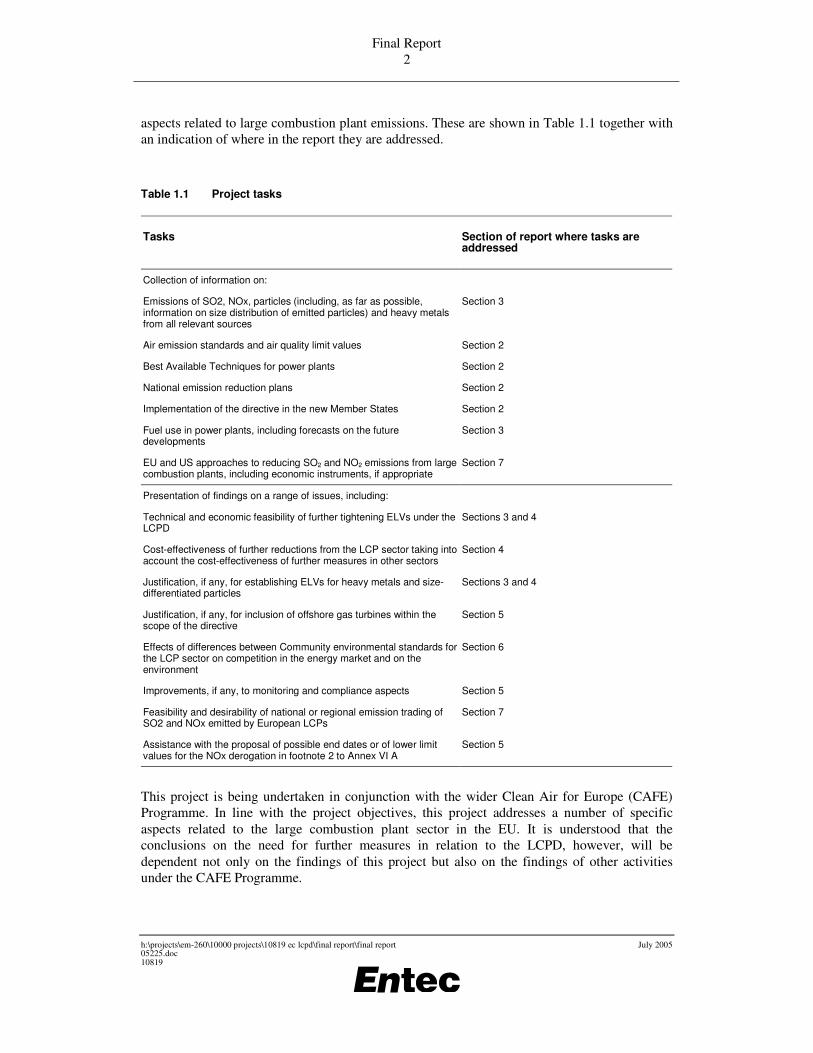
aspects related to large combustion plant emissions. These are shown in Table 1.1 together with an indication of where in the report they are addressed.
Table 1.1 Project tasks
Tasks Section of report where tasks are addressed
Collection of information on:
Emissions of SO2, NOx, particles (including, as far as possible, information on size distribution of emitted particles) and heavy metals from all relevant sources
Section 3
Air emission standards and air quality limit values Section 2
Best Available Techniques for power plants Section 2
National emission reduction plans Section 2
Implementation of the directive in the new Member States Section 2
Fuel use in power plants, including forecasts on the future developments
Section 3
EU and US approaches to reducing SO2 and NO2 emissions from large combustion plants, including economic instruments, if appropriate
Section 7
Presentation of findings on a range of issues, including:
Technical and economic feasibility of further tightening ELVs under the LCPD
Sections 3 and 4
Cost-effectiveness of further reductions from the LCP sector taking into account the cost-effectiveness of further measures in other sectors
Section 4
Justification, if any, for establishing ELVs for heavy metals and size-differentiated particles
Sections 3 and 4
Justification, if any, for inclusion of offshore gas turbines within the scope of the directive
Section 5
Effects of differences between Community environmental standards for the LCP sector on competition in the energy market and on the environment
Section 6
Improvements, if any, to monitoring and compliance aspects Section 5
Feasibility and desirability of national or regional emission trading of SO2 and NOx emitted by European LCPs
Section 7
Assistance with the proposal of possible end dates or of lower limit values for the NOx derogation in footnote 2 to Annex VI A
Section 5
This project is being undertaken in conjunction with the wider Clean Air for Europe (CAFE) Programme. In line with the project objectives, this project addresses a number of specific aspects related to the large combustion plant sector in the EU. It is understood that the conclusions on the need for further measures in relation to the LCPD, however, will be dependent not only on the findings of this project but also on the findings of other activities under the CAFE Programme.

Final Report 3
h:\projects\em-260\10000 projects\10819 ec lcpd\final report\final report 05225.doc
July 2005
10819
1.4 Structure of the report The structure of this report is as follows:
Section 2 presents brief details of some of the key policies affecting emissions of air pollutants from large combustion plants in the EU. Clearly the Large Combustion Plant Directive (LCPD) itself is of most direct relevance, and this is discussed, including information on national emission reduction plans submitted so far under the LCPD and details of implementation of this directive in the new Member States. This is followed by sections that identify whether and to what extent some Member States go beyond the LCPD ELVs in their own national legislation; the requirements of ‘best available techniques’ (BAT) under the IPPCD and key air quality directives.
Section 3 presents data on current and future emissions from LCPs across the EU25. The purpose of this section is to support conclusions on the quantity and profile of current emissions of key pollutants from LCPs, as well as an indication of the quantity and profile of future emissions of key pollutants expected under a ‘business as usual’ (BAU) scenario, incorporating the expected impact of agreed policies, including the current LCPD and IPPCD, to the extent that they have been taken into account in currently available modelling work.
In the event that further reductions in emissions were required from the LCP sector, the priority pollutants and process types for achievement of potential further reductions are identified in Section 4. This section goes on to present brief details of technically feasible additional abatement measures that could reduce emissions further. The cost effectiveness of these abatement measures is then presented and compared to the cost effectiveness of additional measures in other sectors.
Section 5 provides supporting information related to possible end dates or lower limit values for the NOx derogation contained in footnote 2 to Annex VI A; supporting information related to the potential inclusion of offshore gas turbines (of at least 50MWth) within the scope of the directive; and details on measurement and reporting aspects.
Section 6 investigates the effects of differences between the Community environmental standards for the LCP sector on competition in the energy market, focussing particularly on where there is expected to be a delay in meeting the LCPD requirements due to derogation allowances for new Member States. In addition, this section gives brief consideration to the effects of differences in standards on the environment.
Section 7 briefly identifies key aspects of EU and US approaches to reducing emissions of SO2 and NOx in the LCP sector, and incorporates a selection of case studies of market-based instruments (MBIs) that have been applied in practice to reducing SO2 and NOx emissions in the LCP sector, mainly in the USA, but with one example in the EU. By drawing on these case studies and other information, specific consideration is then given to the feasibility and desirability of market based instruments for reducing emissions of SO2 and NOx in the EU’s LCP sector. Within the scope of this project, this is a screening level analysis, and hence the discussions deal in outline terms only.
Summaries of the findings in each section are given at the end of the appropriate section, with an overall summary of key findings presented in the Executive Summary.
Final Report 4
h:\projects\em-260\10000 projects\10819 ec lcpd\final report\final report 05225.doc
July 2005
10819

Final Report 5
h:\projects\em-260\10000 projects\10819 ec lcpd\final report\final report 05225.doc
July 2005
10819
2. Key Policies Affecting Air Pollutant Emissions from Large Combustion Plants
2.1 Introduction The purpose of this section is to present brief details of the key policies affecting emissions of air pollutants from large combustion plants in the EU. This is not intended to represent an exhaustive coverage of key policies, but simply those that are required to be considered within the scope of this study.
Clearly the Large Combustion Plant Directive (LCPD) is of most direct relevance, and this directive is discussed in Section 2.2, including information on national emission reduction plans submitted so far under the LCPD and details of implementation of this directive in the new Member States. This is followed by sections that identify whether and to what extent some Member States go beyond the LCPD ELVs in their own national legislation; the requirements of ‘best available techniques’ (BAT) under the IPPCD and key air quality directives.
2.2 Large Combustion Plant Directive
2.2.1 Introduction Directive 2001/80/EC, referred to as the Large Combustion Plant Directive (LCPD), applies to combustion plants with a rated thermal input of 50MW or more. The LCPD is a complex directive that places requirements upon Member States to reduce emissions of sulphur dioxide (SO2), nitrogen oxides (NOx) and particulate matter (PM) from combustion plants within power plants, petroleum refineries, iron and steelworks and other industrial processes.
For existing plants (licensed before 1 July 1987), each Member State is able to choose between complying with emission limit values (ELVs) as set out in part A of Annexes III to VII or implementing a national emission reduction plan as defined in Article 4(6). The compliance date for existing plants is 1 January 2008.
In comparison to the ELV approach, the targets of the national emission reduction plan are defined as follows: “The national emission reduction plan shall reduce the total annual emissions of nitrogen oxides (NOx), sulphur dioxide (SO2) and dust from existing plants to the levels that would have been achieved by applying the emission limit values [in part A of Annexes III to VII]…to the existing plants in operation in the year 2000,.… on the basis of each plant’s actual annual operating time, fuel used and thermal input, averaged over the last five years of operation up to and including 2000”.
An operator of an existing plant may be exempted from compliance with the ELVs and from inclusion in a national emission reduction plan if a written undertaken was submitted to the competent authority by 30 June 2004, not to operate the plant for more than 20,000 operational hours starting from 1 January 2008 and ending no later than 31 December 2015.

Final Report 6
h:\projects\em-260\10000 projects\10819 ec lcpd\final report\final report 05225.doc
July 2005
10819
All new plants (those licensed from 1 July 1987) are required to comply with ELVs at the present time. Those licensed before 27 November 2002 are required to comply with those set out in part A of Annexes III to VII, whilst those licensed from 27 November 2002 are required to comply with the more stringent ELVs set out in part B of Annexes III to VII.
The ELVs are presented in Appendix 1 of this report. For plants with multi-firing units, the specific ELVs are set as described in Article 8.
The obligations of the LCPD are without prejudice to Directive 96/61/EC concerning integrated pollution prevention and control (IPPC Directive) as discussed in Section 2.4 and Directive 96/62/EC on ambient air quality assessment and management (Air Quality Framework Directive) as discussed in Section 2.5.
2.2.2 Information on national emission reduction plans under the LCPD As outlined in the above section, Member States have the option for existing plants to implement a national emission reduction plan, instead of implementing ELVs.
The requirements of a national emission reduction plan are set out in Article 4(6) of the LCPD. In particular, plans should “comprise objectives and related targets, measures and timetables for reaching these objectives and targets, and a monitoring mechanism”.
The Commission published a recommendation4 on the guidelines to assist a Member State in the preparation of a plan, together with the publication of a guidance document and associated summary.
According to the LCPD, EU15 Member States were to communicate their national emission reduction plans to the Commission no later than 27 November 2003. Following receipt of the plans, the Commission is to undertake an evaluation of the plans against the requirements of the directive, and communicate with the Member State as appropriate.
At the time of writing, 8 Member States have so far submitted national emission reduction plans to the Commission. These include:
• Czech Republic;
• Finland;
• France;
• Greece;
• Ireland;
• Netherlands;
• Slovenia; and
• UK.
Slovenia subsequently withdrew its plan and opted for the ELV approach.
4 Commission Recommendation of 15/01/2003.
Final Report 7
h:\projects\em-260\10000 projects\10819 ec lcpd\final report\final report 05225.doc
July 2005
10819
In addition, Spain is also known to be submitting a plan and some additional Member States may also be submitting plans.
At this stage, it is not possible to fully determine exactly which types of measures will be fitted to which specific plants in these countries. In general these will comprise a mixture of abatement, fuel switching and reductions in load factors and will be decided by the operating companies themselves, closer to the compliance deadline.
2.2.3 Information on implementation of the LCPD in New Member States The Commission has provided detailed information on the Transition Periods and Treaty Provisions (EC, 2004) associated with the implementation of the LCPD in New Member States. This information is summarised in Table 2.1 below, in addition to views and comments provided by the policy makers in these countries.

Final Report 8
h:\projects\em-260\10000 projects\10819 ec lcpd\final report\final report 05225.doc
July 2005
Table 2.1 Implementation of the LCPD in New Member States (EC, 2004)
Country Derogation from?
Derogation allowances Applies until Conditions Comments by Policy Makers
Cyprus Article 4(3)
Annex IV: Pt A
ELVs of 1 700 mg/Nm³ for SO2 shall apply to the boilers in operation in September 2002 at two combustion plants.
One of the following conditions materialises:
- there is an upgrade or a significant change to these boilers;
- natural gas becomes available on the island;
- Cyprus becomes an exporter of electricity; or
- the currently operating boilers are closed.
During the application of the ELVs, Cyprus shall report to the Commission, by 31 March each year after accession, on:
- the fuel quality used;
- annual total emissions of SO2 ; and
- the estimated contribution of these emissions to the emissions in neighbouring countries.
No comments to make on problems foreseen with LCPD implementation. They generally feel that Cyprus will be able to comply under the existing derogation conditions.
Czech Republic
Article 4(1)
Annex III: Pt A
ELVs for SO2 shall not apply to boilers at two sites
31 December 2007 No conditions As of yet the Czech Republic has not been expecting any trouble concerning the Directive implementation with the exemption of the two already negotiated and agreed transitional periods for two new sources.
Final Report 9
h:\projects\em-260\10000 projects\10819 ec lcpd\final report\final report 05225.doc
July 2005
Country Derogation from?
Derogation allowances Applies until Conditions Comments by Policy Makers
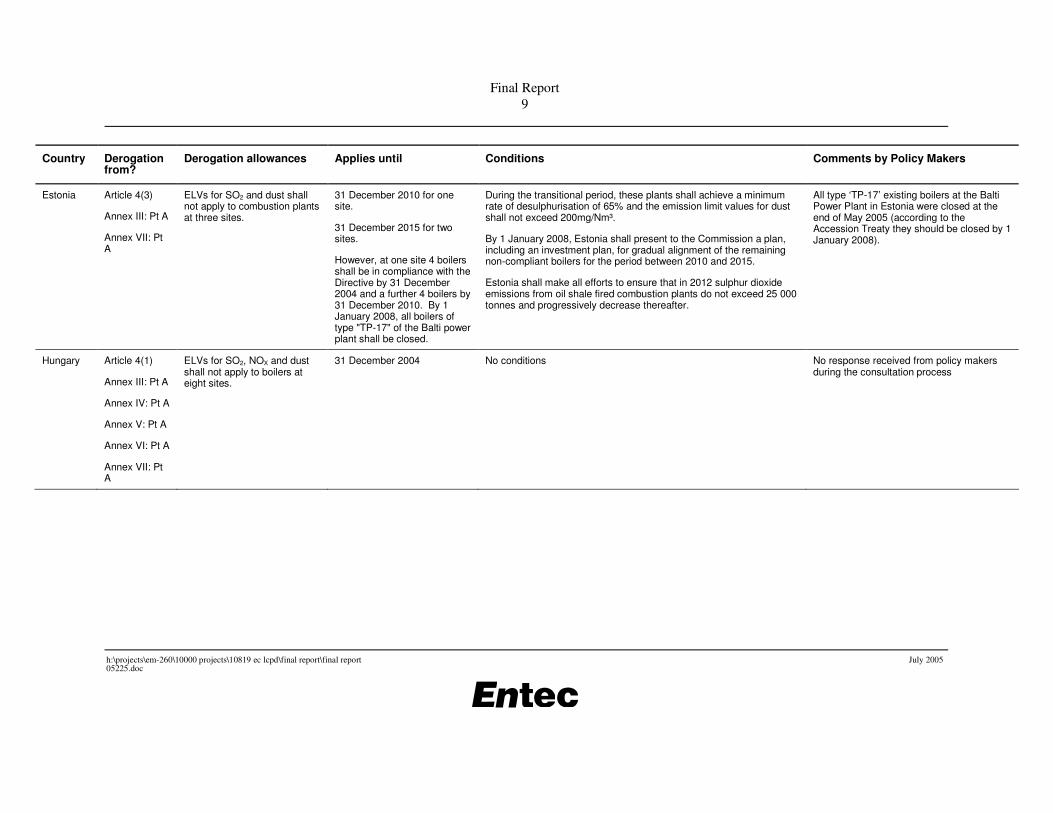
Estonia Article 4(3)
Annex III: Pt A
Annex VII: Pt A
ELVs for SO2 and dust shall not apply to combustion plants at three sites.
31 December 2010 for one site.
31 December 2015 for two sites.
However, at one site 4 boilers shall be in compliance with the Directive by 31 December 2004 and a further 4 boilers by 31 December 2010. By 1 January 2008, all boilers of type "TP-17" of the Balti power plant shall be closed.
During the transitional period, these plants shall achieve a minimum rate of desulphurisation of 65% and the emission limit values for dust shall not exceed 200mg/Nm³.
By 1 January 2008, Estonia shall present to the Commission a plan, including an investment plan, for gradual alignment of the remaining non-compliant boilers for the period between 2010 and 2015.
Estonia shall make all efforts to ensure that in 2012 sulphur dioxide emissions from oil shale fired combustion plants do not exceed 25 000 tonnes and progressively decrease thereafter.
All type ‘TP-17’ existing boilers at the Balti Power Plant in Estonia were closed at the end of May 2005 (according to the Accession Treaty they should be closed by 1 January 2008).
Hungary Article 4(1)
Annex III: Pt A
Annex IV: Pt A
Annex V: Pt A
Annex VI: Pt A
Annex VII: Pt A
ELVs for SO2, NOX and dust shall not apply to boilers at eight sites.
31 December 2004 No conditions No response received from policy makers during the consultation process

Final Report 10
h:\projects\em-260\10000 projects\10819 ec lcpd\final report\final report 05225.doc
July 2005
Country Derogation from?
Derogation allowances Applies until Conditions Comments by Policy Makers
Latvia No derogations
Difficulties highlighted include:
• the lack of BAT Reference documents and BAT documents about energy efficiency, as well it is not defined which measures are considered as BAT.
• how to identify and assess energy efficiency measures – indicators, benchmarks, methods for energy efficiency assessments, tools to measure, monitoring.
• economic reasons of the BAT implementation for existing plants.
• technical problems related to installation of monitoring equipment on the stacks of the existing plants, where several boilers are connected to one stack
Lithuania Article 4(3)
Annex IV: Pt A
Annex VI: Pt A
ELVs for SO2 and NOX shall not apply for the combustion plants at four sites
31 December 2015 During this transitional period, total SO2 and NOX emissions relating to electricity generation at these plants as well as the Lithuanian Thermal Power Plant, shall not exceed the following ceilings:
- 2005: 28 300 t SO2 / year; 4 600 t NOx / year
- 2008: 21 500 t SO2 / year; 5 000 t NOx / year
- 2010: 30 500 t SO2 / year; 10 500 t NOx / year
- 2012: 29 000 t SO2 / year; 10 800 t NOx / year
By 1 January 2007, and again by 1 January 2012, Lithuania shall present to the Commission an updated plan, including an investment plan, for the gradual alignment of remaining non-compliant plants with clearly defined stages for the application of the acquis.
No specific comments provided on implementation process

Final Report 11
h:\projects\em-260\10000 projects\10819 ec lcpd\final report\final report 05225.doc
July 2005
Country Derogation from?
Derogation allowances Applies until Conditions Comments by Policy Makers
The EU considers that the expected overall economic development in Lithuania, the resulting possibilities to finance further investments earlier than currently scheduled, and the foreseen changes in the energy sector should allow further emission reductions per unit of electricity produced. The EU therefore expects that these plans should ensure a further reduction of the emissions to a level significantly below the above intermediate targets, in particular for emissions in the period 2012 to 2015.
If the Commission, having regard in particular to the environmental effects and to the need to reduce distortions of competition in the internal market due to the transitional arrangement, considers that these plans are not sufficient to meet these objectives, it shall inform Lithuania. Within the following three months, Lithuania shall communicate the measures it has taken in order to meet these objectives. If subsequently the Commission, in consultation with the Member States, considers that these measures are not sufficient to meet these objectives, it shall commence infringement proceedings under Article 226 of the EC Treaty.
Malta Article 4(1)
Annex VII: Pt A
ELV for dust shall not apply to Phase One of one power plant.
31 December 2005 No conditions No comments on the directive conditions. Specific comments on potential issues for compliance provided for individual ESI plants (control of NOX and dust emissions).
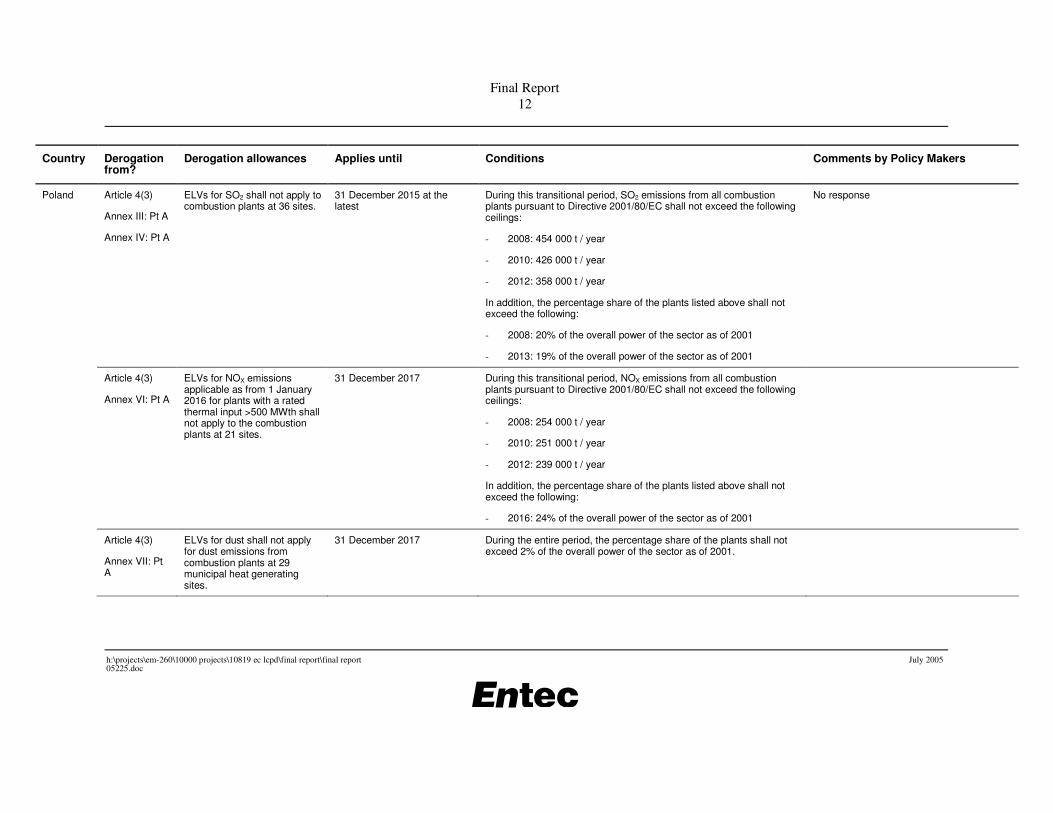
Final Report 12
h:\projects\em-260\10000 projects\10819 ec lcpd\final report\final report 05225.doc
July 2005
Country Derogation from?
Derogation allowances Applies until Conditions Comments by Policy Makers
Poland Article 4(3)
Annex III: Pt A
Annex IV: Pt A
ELVs for SO2 shall not apply to combustion plants at 36 sites.
31 December 2015 at the latest
During this transitional period, SO2 emissions from all combustion plants pursuant to Directive 2001/80/EC shall not exceed the following ceilings:
- 2008: 454 000 t / year
- 2010: 426 000 t / year
- 2012: 358 000 t / year
In addition, the percentage share of the plants listed above shall not exceed the following:
- 2008: 20% of the overall power of the sector as of 2001
- 2013: 19% of the overall power of the sector as of 2001
No response
Article 4(3)
Annex VI: Pt A
ELVs for NOX emissions applicable as from 1 January 2016 for plants with a rated thermal input >500 MWth shall not apply to the combustion plants at 21 sites.
31 December 2017 During this transitional period, NOX emissions from all combustion plants pursuant to Directive 2001/80/EC shall not exceed the following ceilings:
- 2008: 254 000 t / year
- 2010: 251 000 t / year
- 2012: 239 000 t / year
In addition, the percentage share of the plants listed above shall not exceed the following:
- 2016: 24% of the overall power of the sector as of 2001
Article 4(3)
Annex VII: Pt A
ELVs for dust shall not apply for dust emissions from combustion plants at 29 municipal heat generating sites.
31 December 2017 During the entire period, the percentage share of the plants shall not exceed 2% of the overall power of the sector as of 2001.
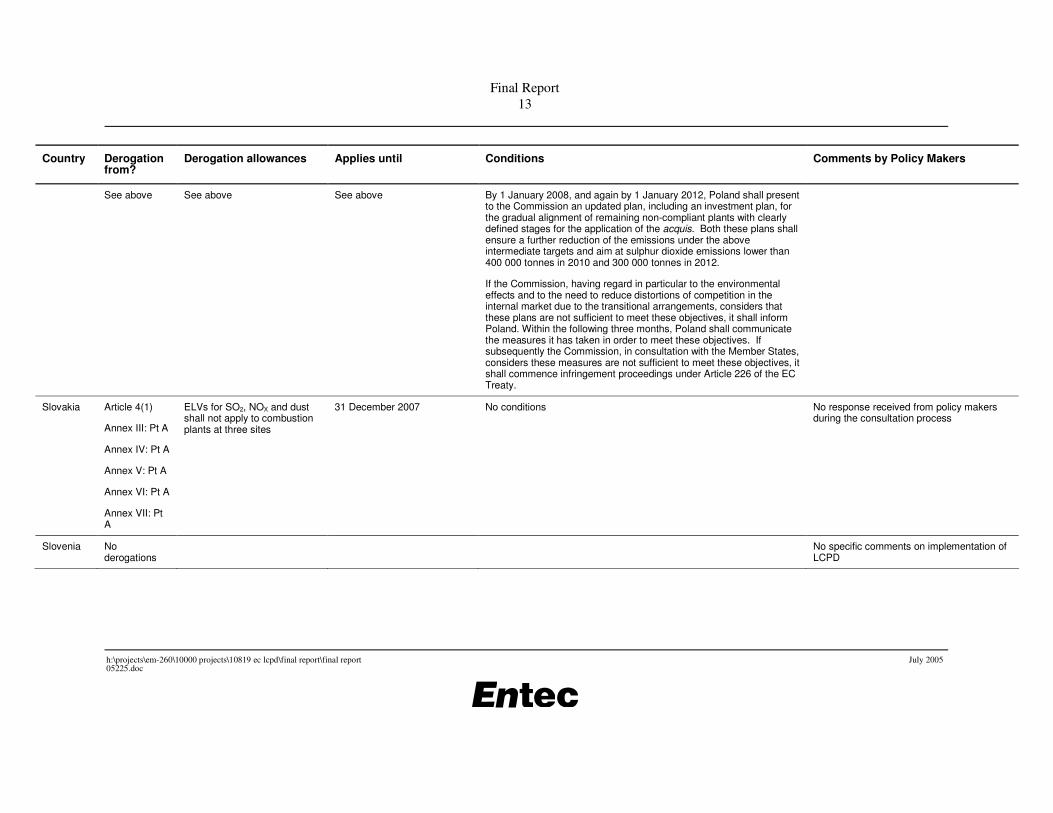
Final Report 13
h:\projects\em-260\10000 projects\10819 ec lcpd\final report\final report 05225.doc
July 2005
Country Derogation from?
Derogation allowances Applies until Conditions Comments by Policy Makers
See above See above See above By 1 January 2008, and again by 1 January 2012, Poland shall present to the Commission an updated plan, including an investment plan, for the gradual alignment of remaining non-compliant plants with clearly defined stages for the application of the acquis. Both these plans shall ensure a further reduction of the emissions under the above intermediate targets and aim at sulphur dioxide emissions lower than 400 000 tonnes in 2010 and 300 000 tonnes in 2012.
If the Commission, having regard in particular to the environmental effects and to the need to reduce distortions of competition in the internal market due to the transitional arrangements, considers that these plans are not sufficient to meet these objectives, it shall inform Poland. Within the following three months, Poland shall communicate the measures it has taken in order to meet these objectives. If subsequently the Commission, in consultation with the Member States, considers these measures are not sufficient to meet these objectives, it shall commence infringement proceedings under Article 226 of the EC Treaty.
Slovakia Article 4(1)
Annex III: Pt A
Annex IV: Pt A
Annex V: Pt A
Annex VI: Pt A
Annex VII: Pt A
ELVs for SO2, NOX and dust shall not apply to combustion plants at three sites
31 December 2007 No conditions No response received from policy makers during the consultation process
Slovenia No derogations
No specific comments on implementation of LCPD

Final Report 14
h:\projects\em-260\10000 projects\10819 ec lcpd\final report\final report 05225.doc July 2005
From the above table it can be seen that several New Member States have derogation allowances under the LCPD.
The countries with the most extensive derogation allowances, as well as the only countries with derogation allowances beyond 2008, include Estonia, Lithuania and Poland. Poland has, by far, the greatest number of plants with derogation allowances. However, in conjunction with the derogation allowances for ELVs, both Poland and Lithuania are also required to comply with conditions that set progressively tighter total emission ceilings for SO2 and NOx.
Therefore, due to the requirements to also comply with these emission ceilings, the true extent to which the derogation allowances are less stringent than the LCPD will be dependent on various factors, notably the projected fuel mixes for the electricity supply industry in these countries.
2.3 National large combustion plant emission limit values
Some Member States choose to set national emission limit values (ELVs) for LCPs which go beyond those included in the LCPD. A Member State may also go further and choose to regulate emissions of other pollutants from large combustion plants which are not currently included in the Directive eg. heavy metals (eg. arsenic, mercury, cadmium, lead etc.), PM10, PM2.5.
Tables 2.2 and 2.3 below contain information on Member States whose regulation of emissions from LCPs goes beyond that of the LCPD. Comparisons have only been undertaken for Member States who have supplied Entec with information regarding national regulation of LCPs.
Table 2.2 Comparison of national ELVs with those in the LCPD (existing plants)
Country
Are the national LCP ELVs tighter than those in the LCPD?
Details
Austria Yes – for dust, SO2 and NOx Dust: the national ELV for all solid fuelled plants (50 mg/Nm3) is more stringent than the LCPD ELV for solid fuelled plants <500MWth (100 mg/Nm3). The ELV for all sized plants utilising ‘extra-light’ fuel oil (30 mg/Nm3) is more stringent than the corresponding ELV in the LCPD (50 mg/Nm3). NOx: the national ELVs for solid (200-600 mg/Nm3), liquid (150-450 mg/Nm3) and gaseous fuelled plants (150-300 mg/Nm3) are more stringent than most of the corresponding ELVs in the LCPD (dependent upon sliding scale). SO2: the ELVs for lignite (400-1000 mg/Nm3) and coal (200-1000 mg/Nm3) fired plants are more stringent than the corresponding ELV for solid fuelled plants in the LCPD (dependent upon sliding scale, 400-2000 mg/Nm3). No information has been provided by Austria as to how the sliding scale is determined with respect to plant capacity. The ELVs for liquid fuelled plants (200-1100 mg/Nm3) are also stricter than those in the LCPD (400-1700 mg/Nm3).
Belgium Information supplied from Belgium is a proposal for modification of the Flemish Regulation regarding ELVs for LCP’s for the Flanders Region only.
EU-15
Denmark No information received.
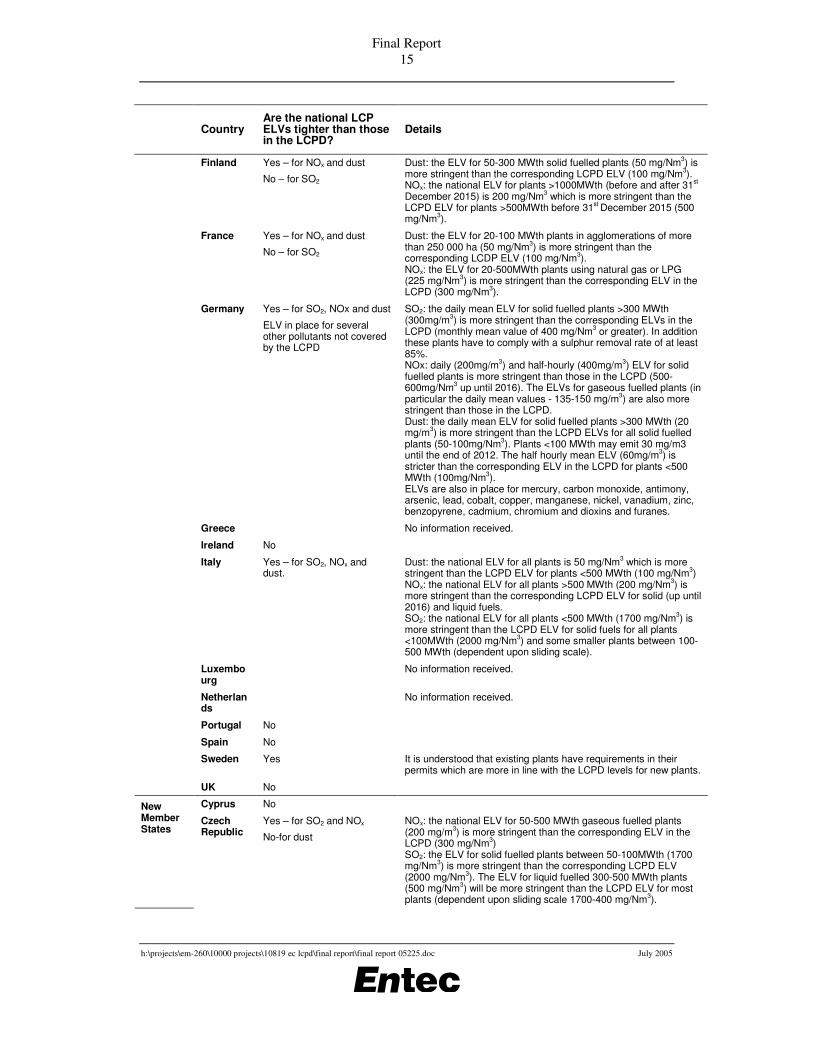
Final Report 15
h:\projects\em-260\10000 projects\10819 ec lcpd\final report\final report 05225.doc July 2005
Country
Are the national LCP ELVs tighter than those in the LCPD?
Details
Finland Yes – for NOx and dust
No – for SO2
Dust: the ELV for 50-300 MWth solid fuelled plants (50 mg/Nm3) is more stringent than the corresponding LCPD ELV (100 mg/Nm3). NOx: the national ELV for plants >1000MWth (before and after 31st December 2015) is 200 mg/Nm3 which is more stringent than the LCPD ELV for plants >500MWth before 31st December 2015 (500 mg/Nm3).
France Yes – for NOx and dust
No – for SO2
Dust: the ELV for 20-100 MWth plants in agglomerations of more than 250 000 ha (50 mg/Nm3) is more stringent than the corresponding LCDP ELV (100 mg/Nm3). NOx: the ELV for 20-500MWth plants using natural gas or LPG (225 mg/Nm3) is more stringent than the corresponding ELV in the LCPD (300 mg/Nm3).
Germany Yes – for SO2, NOx and dust
ELV in place for several other pollutants not covered by the LCPD
SO2: the daily mean ELV for solid fuelled plants >300 MWth (300mg/m3) is more stringent than the corresponding ELVs in the LCPD (monthly mean value of 400 mg/Nm3 or greater). In addition these plants have to comply with a sulphur removal rate of at least 85%. NOx: daily (200mg/m3) and half-hourly (400mg/m3) ELV for solid fuelled plants is more stringent than those in the LCPD (500-600mg/Nm3 up until 2016). The ELVs for gaseous fuelled plants (in particular the daily mean values - 135-150 mg/m3) are also more stringent than those in the LCPD. Dust: the daily mean ELV for solid fuelled plants >300 MWth (20 mg/m3) is more stringent than the LCPD ELVs for all solid fuelled plants (50-100mg/Nm3). Plants <100 MWth may emit 30 mg/m3 until the end of 2012. The half hourly mean ELV (60mg/m3) is stricter than the corresponding ELV in the LCPD for plants <500 MWth (100mg/Nm3). ELVs are also in place for mercury, carbon monoxide, antimony, arsenic, lead, cobalt, copper, manganese, nickel, vanadium, zinc, benzopyrene, cadmium, chromium and dioxins and furanes.
Greece No information received.
Ireland No
Italy Yes – for SO2, NOx and dust.
Dust: the national ELV for all plants is 50 mg/Nm3 which is more stringent than the LCPD ELV for plants <500 MWth (100 mg/Nm3) NOx: the national ELV for all plants >500 MWth (200 mg/Nm3) is more stringent than the corresponding LCPD ELV for solid (up until 2016) and liquid fuels. SO2: the national ELV for all plants <500 MWth (1700 mg/Nm3) is more stringent than the LCPD ELV for solid fuels for all plants <100MWth (2000 mg/Nm3) and some smaller plants between 100-500 MWth (dependent upon sliding scale).
Luxembourg
No information received.
Netherlands
No information received.
Portugal No
Spain No
Sweden Yes It is understood that existing plants have requirements in their permits which are more in line with the LCPD levels for new plants.
UK No
Cyprus No New Member States
Czech Republic
Yes – for SO2 and NOx
No-for dust
NOx: the national ELV for 50-500 MWth gaseous fuelled plants (200 mg/m3) is more stringent than the corresponding ELV in the LCPD (300 mg/Nm3) SO2: the ELV for solid fuelled plants between 50-100MWth (1700 mg/Nm3) is more stringent than the corresponding LCPD ELV (2000 mg/Nm3). The ELV for liquid fuelled 300-500 MWth plants (500 mg/Nm3) will be more stringent than the LCPD ELV for most plants (dependent upon sliding scale 1700-400 mg/Nm3).
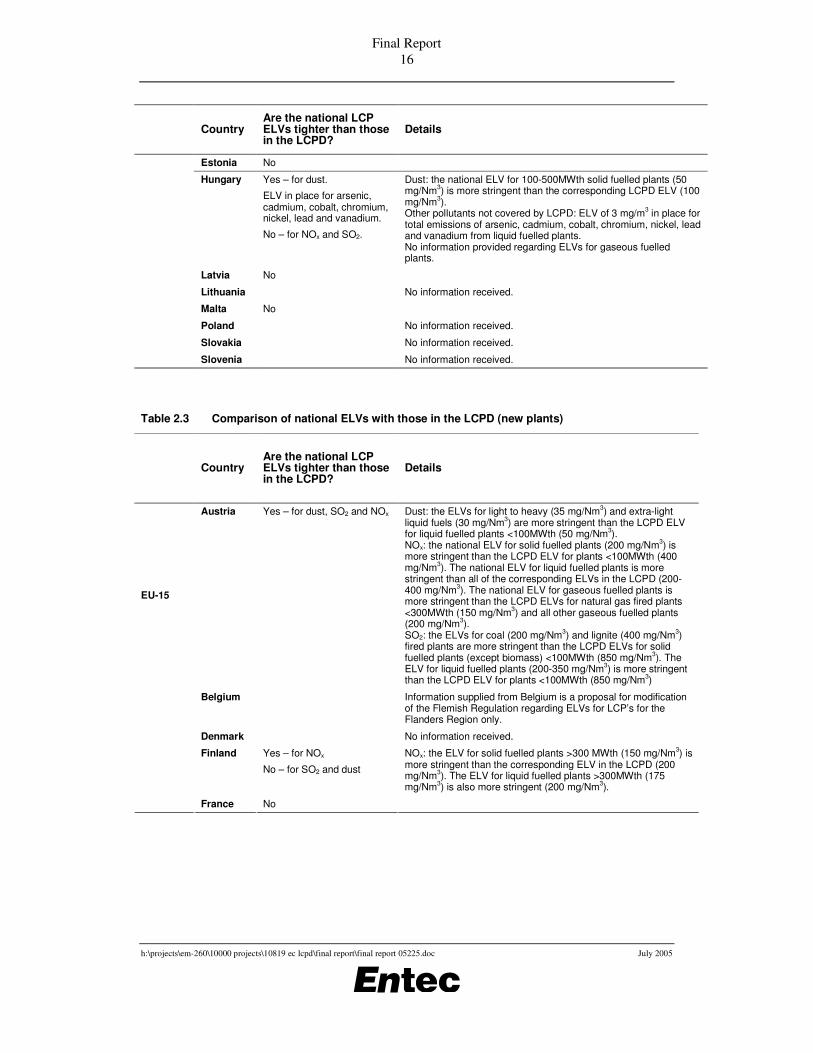
Final Report 16
h:\projects\em-260\10000 projects\10819 ec lcpd\final report\final report 05225.doc July 2005
Country
Are the national LCP ELVs tighter than those in the LCPD?
Details
Estonia No
Hungary Yes – for dust.
ELV in place for arsenic, cadmium, cobalt, chromium, nickel, lead and vanadium.
No – for NOx and SO2.
Dust: the national ELV for 100-500MWth solid fuelled plants (50 mg/Nm3) is more stringent than the corresponding LCPD ELV (100 mg/Nm3). Other pollutants not covered by LCPD: ELV of 3 mg/m3 in place for total emissions of arsenic, cadmium, cobalt, chromium, nickel, lead and vanadium from liquid fuelled plants. No information provided regarding ELVs for gaseous fuelled plants.
Latvia No
Lithuania No information received.
Malta No
Poland No information received.
Slovakia No information received.
Slovenia No information received.
Table 2.3 Comparison of national ELVs with those in the LCPD (new plants)
Country Are the national LCP ELVs tighter than those in the LCPD?
Details
Austria Yes – for dust, SO2 and NOx Dust: the ELVs for light to heavy (35 mg/Nm3) and extra-light liquid fuels (30 mg/Nm3) are more stringent than the LCPD ELV for liquid fuelled plants <100MWth (50 mg/Nm3). NOx: the national ELV for solid fuelled plants (200 mg/Nm3) is more stringent than the LCPD ELV for plants <100MWth (400 mg/Nm3). The national ELV for liquid fuelled plants is more stringent than all of the corresponding ELVs in the LCPD (200-400 mg/Nm3). The national ELV for gaseous fuelled plants is more stringent than the LCPD ELVs for natural gas fired plants <300MWth (150 mg/Nm3) and all other gaseous fuelled plants (200 mg/Nm3). SO2: the ELVs for coal (200 mg/Nm3) and lignite (400 mg/Nm3) fired plants are more stringent than the LCPD ELVs for solid fuelled plants (except biomass) <100MWth (850 mg/Nm3). The ELV for liquid fuelled plants (200-350 mg/Nm3) is more stringent than the LCPD ELV for plants <100MWth (850 mg/Nm3)
Belgium Information supplied from Belgium is a proposal for modification of the Flemish Regulation regarding ELVs for LCP’s for the Flanders Region only.
Denmark No information received.
Finland Yes – for NOx
No – for SO2 and dust
NOx: the ELV for solid fuelled plants >300 MWth (150 mg/Nm3) is more stringent than the corresponding ELV in the LCPD (200 mg/Nm3). The ELV for liquid fuelled plants >300MWth (175 mg/Nm3) is also more stringent (200 mg/Nm3).
EU-15
France No

Final Report 17
h:\projects\em-260\10000 projects\10819 ec lcpd\final report\final report 05225.doc July 2005
Country Are the national LCP ELVs tighter than those in the LCPD?
Details
Germany Yes – for SO2 and dust
ELV in place for several other pollutants not covered by the LCPD
No – for NOx
SO2: The daily (200 and 350mg/m3) mean ELV for blast furnace and coke oven gas fuelled plants >300 MWth is more stringent than the corresponding ELVs in the LCPD (200 and 400mg/Nm3, respectively). Solid and liquid fuelled plants (>100 MWth) have to comply with the ELVs as well as a sulphur removal rate of at least 85% (except biomass and light fuel oil). For solid fuels, these requirements refer to use of non-high sulphur content fuels, requirements for high sulphur content fuels are fixed according to the LCPD. Dust: The daily mean ELV for all solid and liquid (except light fuel oil) fuelled plants (20mg/m3) is more stringent than the corresponding ELV in the LCPD (30mg/Nm3). ELVs are also in place for mercury, carbon monoxide, antimony, arsenic, lead, cobalt, copper, manganese, nickel, vanadium, zinc, benzopyrene, cadmium, chromium and dioxins and furanes.
Greece No for dust No information received on SO2 and NOx. ELVs are also in place for lead, arsenic and cadmium.
Ireland No
Italy No
Luxembourg No information received.
Netherlands No information received.
Portugal No
Spain No
Sweden Possibly No specific comment available.
UK No
Cyprus No
Czech Republic
No
Estonia No
Hungary No No information received.
Latvia No
Lithuania No information received.
Malta No
Poland No information received.
Slovakia No information received.
New Member States
Slovenia No information received.
Overall, the survey reported in Tables 2.2 and 2.3 gained a reasonably good response, with information from 17 Member States (out of 24 with LCPs, as Luxembourg does not have LCPs). From the information provided, it is clear that for existing plants many countries actually go further than the LCPD in terms of ELVs for at least one or more of the LCP pollutants of SO2, NOx or dust. In addition, three countries also impose ELVs for trace metals, with one country imposing ELVs for dioxins and PAHs. Of those countries surveyed that impose more stringent ELVs for existing plants than the LCPD, those that appear to have the most substantially tighter ELVs for a potentially significant portion of their LCP sector include Austria, Finland, Germany, Italy and Sweden.
Final Report 18
h:\projects\em-260\10000 projects\10819 ec lcpd\final report\final report 05225.doc July 2005
In contrast, for new plants most countries tend to set ELVs derived directly from the LCPD rather than going beyond it. For those countries that go beyond the LCPD for new plants, the additional stringency appears much less significant than for existing plants.
2.4 Best Available Techniques for large combustion plants
2.4.1 Introduction As mentioned earlier, the requirements of the LCPD are without prejudice to Directive 96/61/EC concerning integrated pollution prevention and control (IPPC Directive). This section presents a general overview of the concept of best available techniques (BAT) under the IPPC Directive, and presents summaries of BAT as given in the European Commission BAT Reference Documents.
It should be stressed that the information referred to in this section does not represent any interpretation of what best available techniques (BAT) might mean in practice for individual LCPs under the IPPC Directive.
2.4.2 Background to Best Available Techniques The purpose of the IPPC Directive is to achieve a high level of protection for the environment as a whole. The central principle of IPPC is that operators should take all appropriate preventative measures against pollution, and in particular apply ‘best available techniques’ (BAT) to improve environmental performance.
The term ‘best available techniques’ is defined in Article 2(11) of the Directive as “the most effective and advanced stage in the development of activities and their methods of operation which indicate the practical suitability of particular techniques for providing in principle the basis for emission limit values designed to prevent and, where that is not practicable, generally to reduce emissions and the impact on the environment as a whole.”
• ‘techniques’ shall include both the technology used and the way in which the installation is designed, built, maintained, operated and decommissioned;
• ‘available’ techniques shall mean those developed on a scale which allows implementation in the relevant industrial sector, under economically and technically viable conditions, taking into consideration the costs and advantages, whether or not the techniques are used or produced inside the Member State in question, as long as they are reasonably accessible to the operator;
• ‘best’ shall mean most effective in achieving a high general level of protection of the environment as a whole.
The choice of technique should take into account the technical characteristics of the installation, its geographical location and local environmental conditions. In the case of existing installations, the economic and technical viability of upgrading them also needs to be taken into account.
Therefore, when interpreting BAT, it is important to understand that BAT is not a fixed concept. It must be implemented locally on a case-by-case basis. Furthermore, BAT for any process

Final Report 19
h:\projects\em-260\10000 projects\10819 ec lcpd\final report\final report 05225.doc July 2005
and/or pollutant does not involve imposing any specific technology or technique. Techniques should be selected as being the best for all environmental compartments, including minimising energy and raw material use.
Annex IV of the Directive contains a list of considerations to be taken into account when determining BAT. These include:
1. the use of low-waste technology;
2. the use of less hazardous substances;
3. the furthering of recovery and recycling of substances generated and used in the process and of waste, where appropriate;
4. comparable processes, facilities or methods of operation which have been tried with success on an industrial scale;
5. technological advances and changes in scientific knowledge and understanding;
6. the nature, effects and volume of the emissions concerned;
7. the commissioning dates for new or existing installations;
8. the length of time needed to introduce the best available technique;
9. the consumption and nature of raw materials (including water) used in the process and their energy efficiency;
10. the need to prevent or reduce to a minimum the overall impact of the emissions on the environment and the risks to it;
11. the need to prevent accidents and to minimise the consequences for the environment;
12. the information published by the Commission pursuant to Article 16 (2) or by international organisations.
2.4.3 Reference Documents on Best Available Techniques
Best Available Techniques for Large Combustion Plants in General The Reference Document on Best Available Techniques for Large Combustion Plants (Draft – November 2004) is the main BREF document of relevance to the LCP sector.
The scope of this BREF covers all kinds of conventional power plants used for mechanical power and heat generation. Industrial combustion installations using conventional fuels are also covered. However, other industrial combustion installations are excluded, including those using process-related residues or by-products as fuel (such as refineries using refinery fuel gas and residual liquid fuels), and those where the combustion process is an integral part of a specific production (such as a blast furnace or cement kiln).
At the time of writing, this BREF remains at the draft stage and has not yet been officially adopted by the Commission. As such, a summary of BAT as detailed in this document is not reproduced in this report. If necessary, details can be found in the report itself, accessible at http://eippcb.jrc.es/pages/FActivities.htm.

Final Report 20
h:\projects\em-260\10000 projects\10819 ec lcpd\final report\final report 05225.doc July 2005
Best Available Techniques for Large Combustion Plants at Petroleum Refineries Section 2 of Appendix 2 presents a summary of BAT as detailed in the Reference Document on Best Available Techniques for Mineral Oil and Gas Refineries (February 2003).
Best Available Techniques for Large Combustion Plants in the Iron and Steel Sector Section 3 of Appendix 2 presents a summary of BAT as detailed in the Best Available Techniques Reference Document on the Production of Iron and Steel (December 2001).
Best Available Techniques for Large Combustion Plants in the Paper Sector Section 4 of Appendix 2 presents a summary of BAT as detailed in the Reference Document on Best Available Techniques in the Pulp and Paper Industry (December 2001).
2.5 Ambient air quality limit values This section presents a brief overview ambient air quality limit values at an EU level, for the key pollutant emissions of interest to the LCP sector.
In 1996, the European Council adopted the Air Quality Framework Directive, which sets the principles for a common strategy to define and establish objectives for ambient air quality in the EU. The Directive provides for subsequent daughter directives to set ambient limit and/or target values for a range of pollutants. Member States are required to implement the requirements of the Directives by specified dates. Sulphur dioxide, nitrogen dioxide, particulate matter and lead are considered in the First Daughter Directive (Table 2.4).
Table 2.4 EU ambient air quality limit values in First Daughter Directive (1999/30/EC)
Pollutant Limit value (max number of exceedences per calendar year )
Date for attainment
Sulphur dioxide 350 µg/m3 (1 hour) (24) 125 µg/m3 (24 hours) (3)
1 January 2005 1 January 2005
Nitrogen dioxide
200 µg/m3 (1 hour) (18) 40 µg/m3 (year)
1 January 2010 1 January 2010
STAGE 1 Particulate matter (PM10)
STAGE 2 Particulate matter (PM10)
50 µg/m3 (24 hours) (35) 40 µg/m3 (year)
50 µg/m3 (24 hours) (7) 20 µg/m3 (year)
1 January 2005 1 January 2005
1 January 2010 1 January 2010
Lead 0.5 µg/m3 (year) 1 January 2005 (or 1 January 2010 in vicinity of specified contaminated industrial sites)
The Commission has prepared and finalised the Fourth Air Quality Daughter Directive (now published in OJ) that will cover the remaining air pollutants, excluding mercury, listed in Annex I of The Framework Directive (96/62/EC), i.e. arsenic, cadmium, nickel and polycyclic aromatic hydrocarbons (PAHs). ‘Target values’ have been agreed for the three heavy metals and benzo(a)pyrene (BaP) which is a marker for PAHs. These include 20 ng/m3 for nickel, 5ng/m3 for cadmium, 6ng/m3 for arsenic and 1 ng/m3 for BaP all to be achieved by 31 December 2012.
Final Report 21
h:\projects\em-260\10000 projects\10819 ec lcpd\final report\final report 05225.doc July 2005
Member States will have to meet these ambient air quality targets taking all necessary measures not entailing ‘disproportionate costs’. The Directive states that:
‘Regarding industrial installations it would not involve measures beyond the application of BAT as required by Directive 96/61/EC and in particular would not lead to the closure of installations. However, it would require Member States to take all cost effective abatement measures in the relevant sectors’.
The target values presented in the text are ‘not to be considered as environmental quality standards’ as set out under IPPC. The Directive text sets out specific monitoring and reporting requirements for those zones and agglomerations where the target concentrations are being exceeded including an estimation of the population exposed to the pollutants.
There is also a requirement for the Commission to review the legislation in 2010 when it should consider the potential regulation of the deposition of the pollutants. For mercury, there is no ‘target value’, but simply a requirement to monitor air concentrations. At a wider level, actions to reduce mercury emissions are incorporated within the Community Strategy Concerning Mercury5, supported by an Extended Impact Assessment.
2.6 Summary • This section presents brief details of some of the key policies affecting emissions of
air pollutants from large combustion plants in the EU. Clearly the Large Combustion Plant Directive (LCPD) is of most direct relevance, and this is briefly described, together with details of the ELVs. In addition, the IPPC Directive (and ‘best available techniques’, BAT) and Air Quality Framework Directive are also briefly described.
• Under the LCPD, Member States had the option of choosing a national emission reduction plan for existing plants instead of ELVs. For those Member States that have so far submitted a national emission reduction plan under the LCPD to the Commission (including Czech Republic, Finland, France, Greece, Ireland, Netherlands, Slovenia6 and UK), the targets of these plans are presented together with current emission levels for comparison. Compliance with the targets in these plans will be achieved through a mixture of abatement, fuel switching and reductions in load factors and will be decided by the operating companies themselves, closer to the compliance deadline.
• Several new Member States have derogation allowances under the LCPD. Those with the most extensive derogation allowances, as well as the only countries with derogation allowances beyond 2008, include Estonia, Lithuania and Poland.
• Poland has, by far, the greatest number of plants with derogation allowances. However, Poland and Lithuania are also required to comply with conditions that set progressively tighter total emission ceilings for SO2 and NOx from the LCP sector.
5 Communication from the Commission to the Council and the European Parliament. Community Strategy Concerning Mercury. 28/01/2005.
6 Slovenia withdrew its Plan and opted for the ELV approach.
Final Report 22
h:\projects\em-260\10000 projects\10819 ec lcpd\final report\final report 05225.doc July 2005
As such, the true extent to which the derogation allowances are less stringent than the LCPD will be dependent on various factors, notably the projected fuel mixes for the electricity supply industry in these countries.
• Some Member States choose to set national ELVs for LCPs which go beyond those included in the LCPD. From a survey of Member States, it is clear that for existing plants many countries go further than the LCPD in terms of ELVs for at least one or more of the LCP pollutants of SO2, NOx or dust. In addition, three countries surveyed also impose ELVs for trace metals, with one country imposing ELVs for dioxins and PAHs.
• In contrast, for new plants most countries tend to set ELVs derived directly from the LCPD rather than going beyond it. For those countries that go beyond the LCPD for new plants, the additional stringency appears much less significant than for existing plants.
Final Report 23
h:\projects\em-260\10000 projects\10819 ec lcpd\final report\final report 05225.doc July 2005
3. Large Combustion Plant Emissions Data
3.1 Introduction This section presents data on current and future emissions from LCPs across the EU25. The purpose of this section is to support conclusions on the quantity and profile of current emissions of key pollutants from LCPs, as well as an indication of the quantity and profile of future emissions of key pollutants expected under a ‘business as usual’ (BAU) scenario, incorporating the expected impact of agreed policies (including the current LCPD, Directive 2001/80/EC) that have been taken into account in currently available modelling work.
By understanding the likely quantity and profile of future emissions from LCPs under a BAU scenario, it is then possible to give an indication of which types of LCPs and which pollutants may be of most interest in the event that any further reductions in emissions were required from the LCP sector. It is not within the scope of this study to determine whether further reductions in LCP emissions would be required, in addition to those reductions expected under the BAU scenario.
A large quantity of data gathered from various sources has been presented in this section. This data is presented separately according to the different sources. Each source of data is described in the relevant sub-section, with the data including:
• Member State submissions to the EC of plant and national level data (under the LCPD reporting requirements) (see Section 3.3);
• Outputs from the RAINS model, which is the core emissions model within the CAFÉ Programme, and which has been subject to checking by Member States (see Section 3.4);
• Member State submissions to the European Pollutant Emission Register (EPER) (see Section 3.5);
• Findings from a survey of specific plants across the EU25 undertaken by Entec for this study (see Section 3.7); and
• Findings from analysis of emissions data by the Swedish Secretariat on Acid Rain (see Section 3.7.3).
The key pollutants considered in this section include:
• SO2,
• NOx,
• Dust, PM10, PM2.5, and
• Heavy metals (arsenic, cadmium, mercury and nickel).
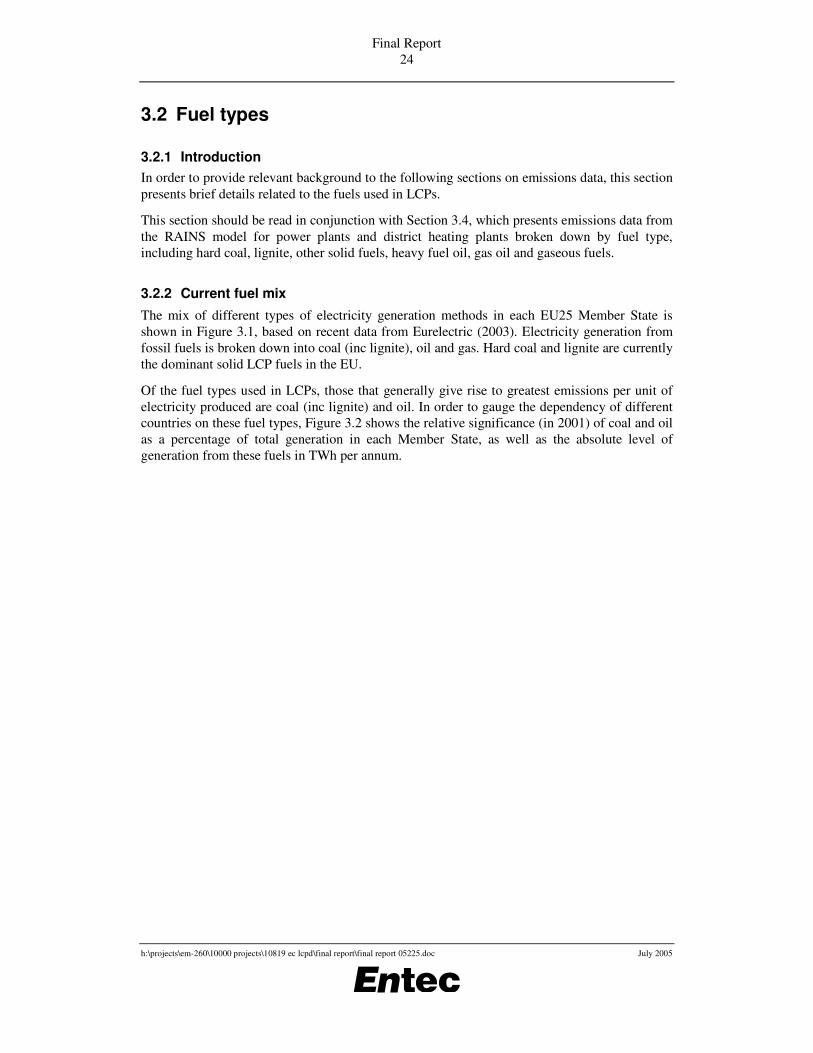
Final Report 24
h:\projects\em-260\10000 projects\10819 ec lcpd\final report\final report 05225.doc July 2005
3.2 Fuel types
3.2.1 Introduction In order to provide relevant background to the following sections on emissions data, this section presents brief details related to the fuels used in LCPs.
This section should be read in conjunction with Section 3.4, which presents emissions data from the RAINS model for power plants and district heating plants broken down by fuel type, including hard coal, lignite, other solid fuels, heavy fuel oil, gas oil and gaseous fuels.
3.2.2 Current fuel mix
The mix of different types of electricity generation methods in each EU25 Member State is shown in Figure 3.1, based on recent data from Eurelectric (2003). Electricity generation from fossil fuels is broken down into coal (inc lignite), oil and gas. Hard coal and lignite are currently the dominant solid LCP fuels in the EU.
Of the fuel types used in LCPs, those that generally give rise to greatest emissions per unit of electricity produced are coal (inc lignite) and oil. In order to gauge the dependency of different countries on these fuel types, Figure 3.2 shows the relative significance (in 2001) of coal and oil as a percentage of total generation in each Member State, as well as the absolute level of generation from these fuels in TWh per annum.
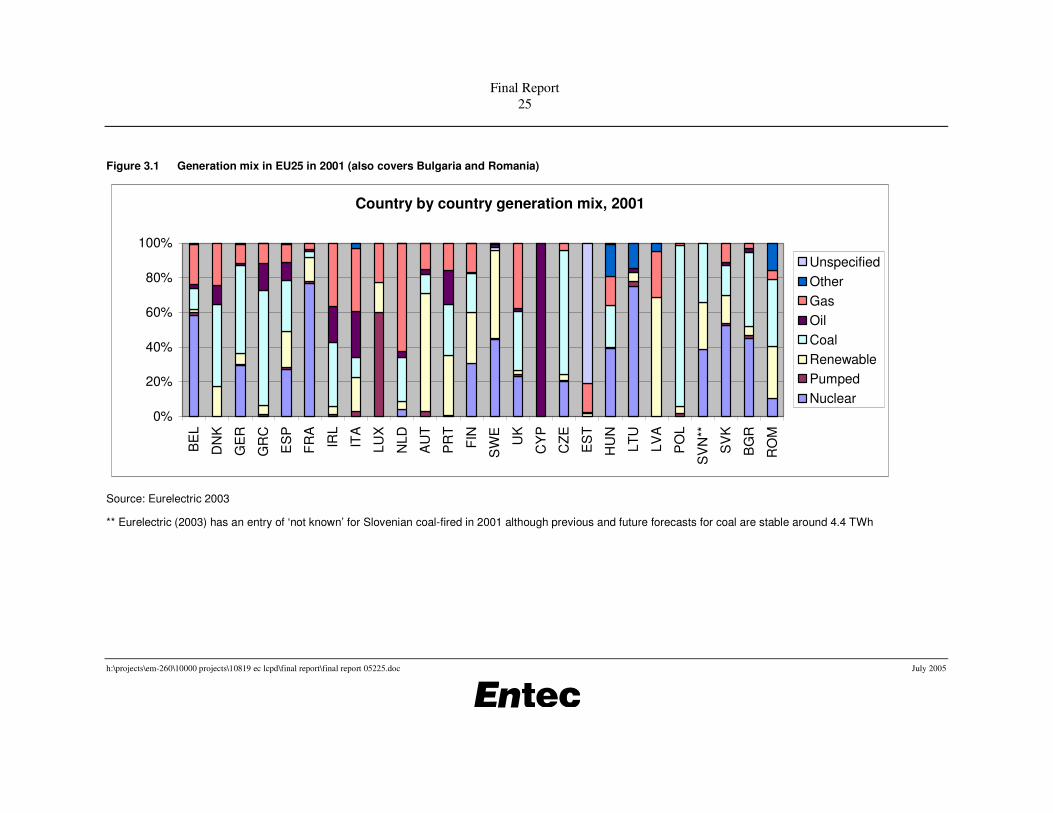
Final Report 25
h:\projects\em-260\10000 projects\10819 ec lcpd\final report\final report 05225.doc July 2005
Figure 3.1 Generation mix in EU25 in 2001 (also covers Bulgaria and Romania)
Country by country generation mix, 2001
0%
20%
40%
60%
80%
100%
BE
L
DN
K
GE
R
GR
C
ES
P
FRA
IRL
ITA
LUX
NLD
AU
T
PR
T
FIN
SW
E
UK
CY
P
CZE
ES
T
HU
N
LTU
LVA
PO
L
SV
N**
SV
K
BG
R
RO
M
UnspecifiedOtherGasOilCoalRenewablePumpedNuclear
Source: Eurelectric 2003
** Eurelectric (2003) has an entry of ‘not known’ for Slovenian coal-fired in 2001 although previous and future forecasts for coal are stable around 4.4 TWh
Final Report 26
h:\projects\em-260\10000 projects\10819 ec lcpd\final report\final report 05225.doc July 2005
Figure 3.2 Oil and coal fired electricity generation in EU25 in 2001 (Also covers Bulgaria and Romania)
Source: Eurelectric 2003
** Eurelectric (2003) has an entry of not known for Slovenian coal-fired in 2001 although previous and future forecasts for coal are stable around 4.4 TWh
0
50
100
150
200
250
300
350
BE
L
DN
K
GE
R
GR
C
ES
P
FR
A
IRL
ITA
LUX
NLD
AU
T
PR
T
FIN
SW
E
UK
CY
P
CZE
ES
T
HU
N
LTU
LVA
PO
L
SV
N**
SV
K
BG
R
RO
M
TWh
0%
10%
20%
30%
40%
50%
60%
70%
80%
90%
100%
Total oil andcoal sourcedproduction
% of totalgeneration
Final Report 27
h:\projects\em-260\10000 projects\10819 ec lcpd\final report\final report 05225.doc July 2005
Figure 3.2 shows that the countries with the greatest volumes of electricity generation from coal and oil fired plants include Germany, Greece, Spain, Italy, the UK, Czech Republic and Poland.
3.2.3 Future trends in fuel mix A general theme within literature and statistics concerning energy production is a broad expectation for increases in gas-fired production. Key comments on expected developments in the generation mix from the recent Eurelectric (2003) report include:
• Germany forecasts that coal, lignite and gas based generation is expected to rise due to decommissioning of nuclear capacity (decreasing from 28% in 2002 to 9% in 2020). Natural gas based generation is expected to increase from 9% to 20%.
• Italy expects to significantly increase gas-fired production, aiming for maximum development of natural gas-fired CCGT (49% of overall generation by 2010) and increased use of renewables (21% of overall generation by 2010).
• The Czech Republic expects to replace 3200 MW of large brown coal units with 1200 MW new brown coal units and 500 MW gas fired, and 1800 combined cycle. This will slightly reduce overall level of coal-fired production to around 37 TWh of coal production by 2010.
• Changes in Greek domestic generation are likely to amount to an increase in natural gas-fired production.
• Denmark forecasts decreases in its coal fired generation, and increased renewable.
• Finland expects domestic nuclear production to replace some coal production.
• Ireland and Greece’s coal fired generation remains constant, alongside increasing natural gas generation.
Energy projections developed for the European Commission (2003) and used to underpin the RAINS model provide a significant quantity of information on the estimated fuel trends to 2030.
These projections are based on the use of the PRIMES model for EU15 Member States and the ‘less sophisticated’ ACE model for New Member States. It is noted that projections make no assumptions on the implementation of specific new policies and measures aimed at meeting Kyoto targets in 2008-2012, and potentially more severe ones in the future. Within the RAINS model, that is referred to in Section 3.4, this is addressed by the incorporation of additional scenarios ‘with climate measures’.
In particular, the EU Emissions Trading Scheme (ETS) is likely to lead to a greater dependency on gas, although this will be constrained by the extent of the transmission capacity and security of supply considerations of individual Member States.
Some of the key findings for the EU25 from the abovementioned report of relevance to this analysis include:
• Increasing requirements for electricity and steam lead to a large expansion of installed capacity in the EU25 energy system, which is projected to almost double by 2030 from 2000 levels.

Final Report 28
h:\projects\em-260\10000 projects\10819 ec lcpd\final report\final report 05225.doc July 2005
• This is mainly through the extensive use of gas fired CCGT units. Beyond 2010 gas is projected to be the main energy carrier in electricity production. Overall, gas based electricity grows from 16% of power generation in 2000 to 36% in 2030.
• The strong shift towards a gas based power generation system combined with electricity market liberalisation is also projected to encourage more widespread exploitation of cogeneration options. By 2030 more than 16% of electricity will come from cogeneration units compared with 13% in 2000.
• Electricity production from solid fuels exhibits a continuous decline in the short / medium term, but it later recovers as a replacement fuel for nuclear both in absolute terms and as a share of total electricity generated. Overall, the solid fuel share reduces from 32% in 2000 to 27% in 2030. It is noted that hard coal is projected to make a strong comeback in the long run, whereas this is not the case for lignite. This is modelled as occurring because the EU power generation system is projected to rely heavily on competitively priced imported coal (close to 97.5% of coal used in power generation in 2030 compared to just 55% in 2000), compared to domestically produced coal and lignite. State aids for coal and in some cases also lignite are assumed to be substantially reduced by 2030.
• The share of electricity from renewables rises from 14% in 2000 to 17% in 2030.
• Oil is becoming a more limited form for power generation as many of the existing oil fired plants are kept only as part of the required reserve margin.
• Both industrial / refinery boilers, as well as district heating unit production are projected to grow much slower than demand for steam, given the prospects for cogeneration. Industrial boilers are characterized by a tendency towards higher use of biomass and waste whereas oil (mainly because of the increasing use of refinery gas in refinery boilers) and gas consumption remains rather stable over the projection period.
• Technological advances combined with changes in the market structure will reduce the dominance of large scale electricity generators (utilities) from 91% in 2000 to 82% in 2030.
3.2.4 Sulphur contents of fuels Emissions of SO2 result mainly from the presence of sulphur in the fuel, with this section presenting details of the sulphur content of fuels used in LCPs. This is to support the specific aspects of this report related to SO2 emissions.
Coal and lignite Table 3.1 shows the percentage sulphur content of lignite and hard coal burnt in existing and new power plants in EU25. Table 3.2 shows this data expressed per unit energy. This has been calculated by dividing the sulphur content (%), as presented in Table 3.1, by the calorific value (GJ/tonne) of each fuel in each country.
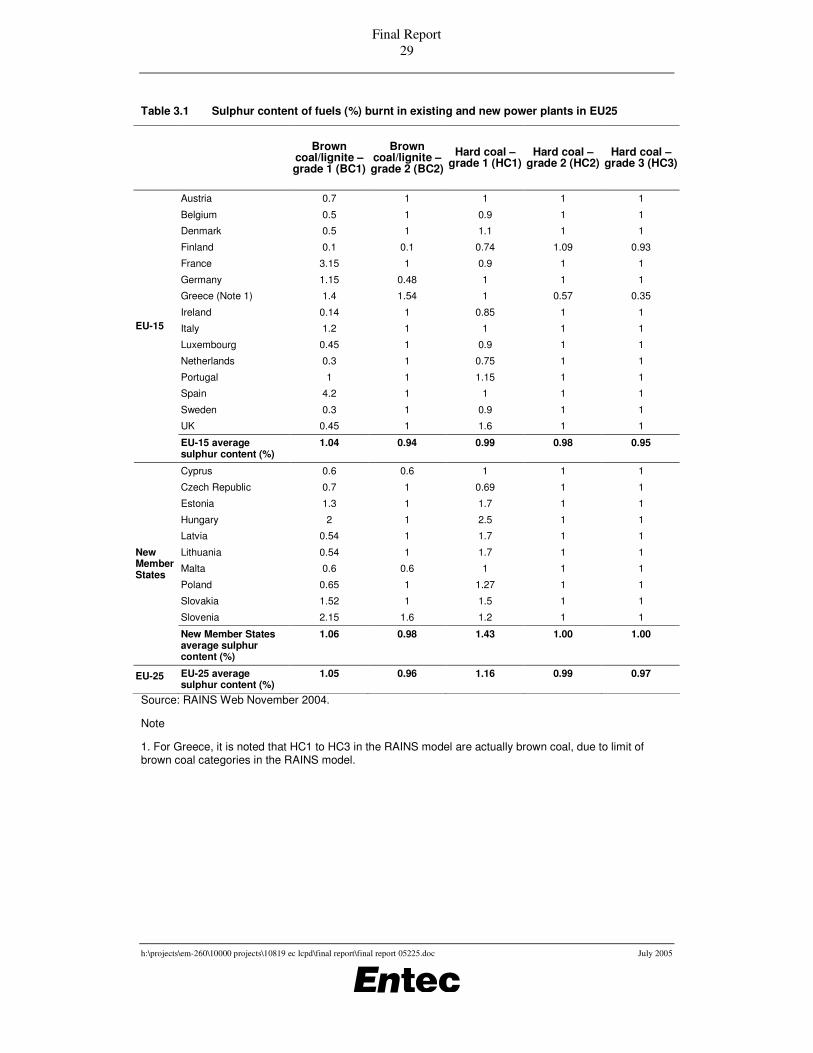
Final Report 29
h:\projects\em-260\10000 projects\10819 ec lcpd\final report\final report 05225.doc July 2005
Table 3.1 Sulphur content of fuels (%) burnt in existing and new power plants in EU25
Brown coal/lignite – grade 1 (BC1)
Brown coal/lignite – grade 2 (BC2)
Hard coal – grade 1 (HC1)
Hard coal – grade 2 (HC2)
Hard coal – grade 3 (HC3)
Austria 0.7 1 1 1 1
Belgium 0.5 1 0.9 1 1
Denmark 0.5 1 1.1 1 1
Finland 0.1 0.1 0.74 1.09 0.93
France 3.15 1 0.9 1 1
Germany 1.15 0.48 1 1 1
Greece (Note 1) 1.4 1.54 1 0.57 0.35
Ireland 0.14 1 0.85 1 1
Italy 1.2 1 1 1 1
Luxembourg 0.45 1 0.9 1 1
Netherlands 0.3 1 0.75 1 1
Portugal 1 1 1.15 1 1
Spain 4.2 1 1 1 1
Sweden 0.3 1 0.9 1 1
UK 0.45 1 1.6 1 1
EU-15
EU-15 average sulphur content (%)
1.04 0.94 0.99 0.98 0.95
Cyprus 0.6 0.6 1 1 1
Czech Republic 0.7 1 0.69 1 1
Estonia 1.3 1 1.7 1 1
Hungary 2 1 2.5 1 1
Latvia 0.54 1 1.7 1 1
Lithuania 0.54 1 1.7 1 1
Malta 0.6 0.6 1 1 1
Poland 0.65 1 1.27 1 1
Slovakia 1.52 1 1.5 1 1
Slovenia 2.15 1.6 1.2 1 1
New Member States
New Member States average sulphur content (%)
1.06 0.98 1.43 1.00 1.00
EU-25 EU-25 average sulphur content (%)
1.05 0.96 1.16 0.99 0.97
Source: RAINS Web November 2004.
Note
1. For Greece, it is noted that HC1 to HC3 in the RAINS model are actually brown coal, due to limit of brown coal categories in the RAINS model.

Final Report 30
h:\projects\em-260\10000 projects\10819 ec lcpd\final report\final report 05225.doc July 2005
Table 3.2 Sulphur content of fuels (%) per unit energy (GJ/tonne) burnt in new (PP_NEW) and existing (PP_EX) power plants in Europe (EU-15, New Member States and EU-25)
Brown coal/lignite – grade 1 (BC1)
Brown coal/lignite – grade 2 (BC2)
Hard coal – grade 1 (HC1)
Hard coal – grade 2 (HC2)
Hard coal – grade 3 (HC3)
Austria 0.05 0.07 0.03 0.03 0.03
Belgium 0.04 0.09 0.03 0.04 0.04
Denmark 0.05 0.11 0.04 0.04 0.04
Finland 0.01 0.01 0.03 0.04 0.04
France 0.18 0.06 0.03 0.04 0.04
Germany 0.13 0.06 0.04 0.04 0.04
Greece 0.32 0.23 0.04 0.09 0.06
Ireland 0.02 0.09 0.03 0.03 0.03
Italy 0.11 0.10 0.03 0.03 0.03
Luxembourg 0.04 0.09 0.03 0.03 0.03
Netherlands 0.03 0.09 0.03 0.03 0.03
Portugal 0.09 0.09 0.04 0.03 0.03
Spain 0.44 0.11 0.05 0.05 0.05
Sweden 0.03 0.09 0.03 0.03 0.03
UK 0.04 0.09 0.07 0.04 0.04
EU-15
EU-15 average sulphur content per unit energy
0.10 0.09 0.04 0.04 0.04
Cyprus 0.07 0.07 0.04 0.04 0.04
Czech Republic 0.06 0.08 0.03 0.04 0.04
Estonia 0.15 0.10 0.07 0.04 0.04
Hungary 0.25 0.10 0.16 0.06 0.06
Latvia 0.06 0.10 0.07 0.04 0.04
Lithuania 0.06 0.10 0.07 0.04 0.04
Malta 0.07 0.07 0.04 0.04 0.04
Poland 0.08 0.13 0.06 0.04 0.04
Slovakia 0.13 0.08 0.06 0.04 0.04
Slovenia 0.17 0.15 0.05 0.04 0.04
New Member States
New Member States average sulphur content per unit energy
0.12 0.10 0.07 0.04 0.04
EU-25 EU-25 average sulphur content per unit energy
0.11 0.09 0.05 0.04 0.04
Source: RAINS Web November 2004.
Table 3.1 shows that the EU25 average sulphur content of hard coal (HC1) is approximately 1.2%, with an average of 1.0% in EU15 and 1.4% in the new Member States. For lignite (BC1), the average is slightly lower for EU25 at approximately 1.1%, with an average of 1.0% in EU15 and 1.1% in the new Member States.
In contrast to the data in Table 3.1, the sulphur content per unit energy is much higher for lignite than it is for hard coal. This is because whilst lignite generally has a relatively low sulphur content it also has a low calorific value.

Final Report 31
h:\projects\em-260\10000 projects\10819 ec lcpd\final report\final report 05225.doc July 2005
Tables 3.3 and 3.4 below present information collected from members of EURACOAL relating to the sulphur content of coals used in Europe. According to the reported data, the level of sulphur in coal used in Europe varies considerably from 0.09% (coal from Australia and Indonesia) to as high as 6.6% (Spanish hard coal mined in Andorra).
Table 3.3 Sulphur content of coal used in Europe
Country of origin Type of use or mining area Sulphur content (%)
Briquetting 1.54 - 2.0 Bulgarian lignite
Energy production 1.7 - 2.2
Central Germany 1.5 - 2.1
Helmstedt 1.8 - 2.8
Lausitz 0.3 - 1.1 German lignite
Rheinland 0.15 - 0.5
German hard coal Average 0.88
Ptolemais 0.30 - 0.50
Amynteon 0.40 - 0.60
Florina 0.70 - 1.10 Greek lignite
Megalopolis 1.10 - 1.50
Area A 0.6 - 1.06
Area B 0.2 - 0.5
Area C 0.5 - 1.1 Polish lignite
Area D 0.28 - 0.71
As Pontes 2.7 - 3.0 Spanish hard coal
Andorra 5.4 - 6.6
Peñarroya -Puertollano 0.24 - 0.99 Spanish lignite
Ponferrada 0.5 - 2
Average 1.7
Deep mines 1.9 UK hard coal
Scottish opencast 1.4
Source: Information from EURACOAL members, May 2004.

Final Report 32
h:\projects\em-260\10000 projects\10819 ec lcpd\final report\final report 05225.doc July 2005
Table 3.4 Sulphur content of coal used by two companies for power production
Company Country of origin Sulphur content (%)
Australia 0.09 - 0.23
Colombia 0.65 - 0.8
Indonesia 0.09 - 0.89
Poland 0.73 - 0.8
Russia 0.3 - 0.92
South Africa 0.36 - 0.67
United States 0.28 - 0.3
Company A
Venezuela 0.7 - 0.93
South Africa 0.51 - 1.17
Australia 0.38 - 1.29
Colombia 0.61 - 0.77 Company B
Indonesia 0.54 - 0.67
Source: Information from EURACOAL members, May 2004.
Oil The sulphur content of oil is regulated by the Sulphur Content of Liquid Fuels Directive. This sets limits for the sulphur content of heavy fuel oil (e.g. 1.0% from 2003) and gas oil (e.g. 0.2% currently and 0.1% from 2008). It also sets emission limits for SO2 emissions from petroleum refineries.
3.2.5 Heavy metals content of fuels This section presents details of the heavy metals content of fuels used in LCPs, in order to support the specific aspects of this report related to heavy metals.
Most heavy metals are released from combustion processes as compounds in association with particulates, with only mercury and selenium are at least partly present in the vapour phase. Less volatile elements tend to condense onto the surface of smaller particles in the flue gas stream which results in enrichment in the finest particle fractions (European Commission, 2004a).
The content of heavy metals in coal and lignite is normally several orders of magnitude higher than in oil (except occasionally for nickel and vanadium in heavy fuel oil) or natural gas (European Commission, 2004a). Therefore this section primarily concentrates on coal and lignite. Proportionately greater focus is given to mercury, as it is less well abated by particulate abatement techniques due to its greater presence in the vapour phase.

Final Report 33
h:\projects\em-260\10000 projects\10819 ec lcpd\final report\final report 05225.doc July 2005
Coal and lignite The content of heavy metals in coal and lignite can vary widely depending on a range of factors such as the geographical source and rank of coal. For mercury, mean concentrations and ranges (where data is available) are presented in Table 3.5, with the more detailed supporting data given in Appendix 3.
Table 3.5 Mercury content of coal and lignite
Country where coal / lignite is used
Type of fuel Mean (ppm) Range (ppm) Source of data
Austria Bituminous steam coal 0.05 to 0.2 Eurelectric, 2004
Denmark Bituminous steam coal 0.05 to 0.13 Eurelectric, 2004
Germany Bituminous steam coal 0.15 (low ash coal); 0.25 (high ash coal)
Eurelectric, 2004
Ireland Bituminous steam coal 0.02 to 0.14 Eurelectric, 2004
Netherlands Bituminous steam coal 0.11 (1999) 0.03 to 0.3 Eurelectric, 2004
Poland Hard coal - National Geological Institute data 0,085 0,001-0,967 Energoprojekt, 2004
Hard coal - Group of coal mines A (data from mines)
no data < 0,200 Energoprojekt, 2004
Hard coal - Group of coal mines B (data from mines)
0,15 0,32 Energoprojekt, 2004
Lignite - National Geological Institute data 0,322 0,081-1,030 Energoprojekt, 2004
Lignite - National Geological Institute data – assessment for lignite humidity 50% (Note 1)
0,18 0,05-0,56
Energoprojekt, 2004
Lignite - Open pit A (data from mines) 0,385 0,015 – 4,595 Energoprojekt, 2004
Lignite - Open pit B - exploited deposit (data from mines)
0,215 0,111-0,436 Energoprojekt, 2004
Lignite - Open pit B - Non-exploited deposit (data from mines)
0,129 0,091-0,176 Energoprojekt, 2004
UK Bituminous steam coal 0.07 (weighted mean); 0.12 (arithmetic mean)
Eurelectric, 2004
Note
1. In the case of lignite there is an important difference between natural and analytical humidity. Natural humidity of lignite delivered to power plants is about 50 %.
From the above table and the supporting data it can be seen that there are significant variations in the concentration of mercury in coal and lignite between different mines. The average concentrations within individual countries appear to be in the broad range of 0.02 to 0.25ppm for coal. For lignite, available data covers Poland, with an average in the broad range of 0.13 to 0.39ppm.
There are also significant variations in the concentrations of arsenic, cadmium, nickel and vanadium. Mean concentrations of these metals in coal and lignite and the associated ranges (where data is available) are presented in Table 3.6.
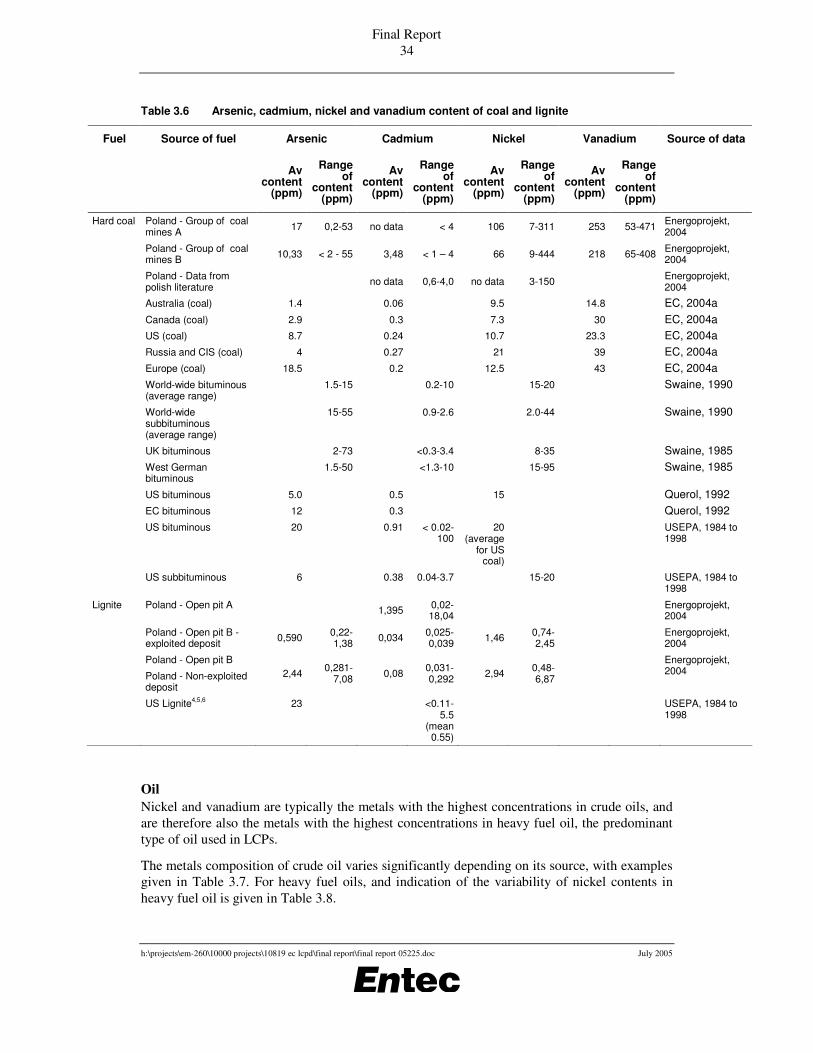
Final Report 34
h:\projects\em-260\10000 projects\10819 ec lcpd\final report\final report 05225.doc July 2005
Table 3.6 Arsenic, cadmium, nickel and vanadium content of coal and lignite
Fuel Source of fuel Arsenic Cadmium Nickel Vanadium Source of data
Av content
(ppm)
Range of
content (ppm)
Av content
(ppm)
Range of
content (ppm)
Av content
(ppm)
Range of
content (ppm)
Av content
(ppm)
Range of
content (ppm)
Hard coal Poland - Group of coal mines A 17 0,2-53 no data < 4 106 7-311 253 53-471 Energoprojekt,
2004
Poland - Group of coal mines B 10,33 < 2 - 55 3,48 < 1 – 4 66 9-444 218 65-408 Energoprojekt,
2004
Poland - Data from polish literature
no data 0,6-4,0 no data 3-150 Energoprojekt, 2004
Australia (coal) 1.4 0.06 9.5 14.8 EC, 2004a Canada (coal) 2.9 0.3 7.3 30 EC, 2004a US (coal) 8.7 0.24 10.7 23.3 EC, 2004a Russia and CIS (coal) 4 0.27 21 39 EC, 2004a Europe (coal) 18.5 0.2 12.5 43 EC, 2004a World-wide bituminous
(average range) 1.5-15 0.2-10 15-20 Swaine, 1990
World-wide subbituminous (average range)
15-55 0.9-2.6 2.0-44 Swaine, 1990
UK bituminous 2-73 <0.3-3.4 8-35 Swaine, 1985
West German bituminous
1.5-50 <1.3-10 15-95 Swaine, 1985
US bituminous 5.0 0.5 15 Querol, 1992
EC bituminous 12 0.3 Querol, 1992
US bituminous 20 0.91 < 0.02-100
20 (average
for US coal)
USEPA, 1984 to 1998
US subbituminous 6 0.38 0.04-3.7 15-20 USEPA, 1984 to 1998
Lignite Poland - Open pit A 1,395 0,02-18,04
Energoprojekt, 2004
Poland - Open pit B - exploited deposit 0,590 0,22-
1,38 0,034 0,025-0,039 1,46 0,74-
2,45 Energoprojekt,
2004
Poland - Open pit B
Poland - Non-exploited deposit
2,44 0,281-7,08 0,08 0,031-
0,292 2,94 0,48-6,87
Energoprojekt, 2004
US Lignite4,5,6 23
<0.11-5.5
(mean 0.55)
USEPA, 1984 to 1998
Oil Nickel and vanadium are typically the metals with the highest concentrations in crude oils, and are therefore also the metals with the highest concentrations in heavy fuel oil, the predominant type of oil used in LCPs.
The metals composition of crude oil varies significantly depending on its source, with examples given in Table 3.7. For heavy fuel oils, and indication of the variability of nickel contents in heavy fuel oil is given in Table 3.8.

Final Report 35
h:\projects\em-260\10000 projects\10819 ec lcpd\final report\final report 05225.doc July 2005
Table 3.7 Information on Crude Oils
Crude Oil Density Sulphur, % w/w
Vanadium, ppm
Nickel, ppm
Brent Blend, N Seaa 0.835 0.38 3.8 0.8
Nigeriaa 0.89 0.23 <1 7
Iranian Lighta 0.853 1.35 34 15
Kuwaita 0.868 2.52 30 9
Crudes run by petroleum refineries in Western Europeb
3.6 (in range 0 to 32)
Typical rangec 3 to 25 (in range 0.01 to 150)
Source: (a) Concawe, 1999 and Oil & Gas J, 1983; (b) Concawe, 2000; (c) Jones, 1988
Table 3.8 Range of Ni Content in Heavy Fuel Oils
Source of HFO Typical Ni content (ppm)
A UK refinery1 4-15
Sulphur content 1 %2 20
Sulphur content 0.5 %2 10
North Sea Crude 3 0.8-2 (content of crude)
West Africa Crude 3 up to 7 (content of crude)
US residual No.6 from low S sources 4 10
Fuel Oil (estimated concentration) 5 26
Sources of Data: (1) A UK refinery; (2) www.chemeng.ucl.ac.uk/research; (3) Entec (1999); (4) US EPA, 1984; (5) www.epa.gov/ttn/uatw/combust/utiltox/utoxpg.html
3.3 LCPD emission inventory data In accordance with both the original (88/609/EC) and new (2001/80/EC) LCPDs, Member States have been required to establish an emissions inventory for existing and new LCPs for SO2 and NOx. For existing plants this is required to be on a plant by plant basis for plants above 300MWth and for refineries; and on an overall basis for other LCPs. The results of this inventory shall be communicated to the Commission in an aggregated form within nine months form the end of the year considered.
This information therefore represents a key source of existing emissions data from LCPs, although to date, only EU15 Member States have so far been required to submit such an inventory.
On the basis of LCPD emissions inventory data supplied to Entec by the Commission, Table 3.9 below presents total emissions of SO2 from LCPs in each EU15 Member State, as well as the percentage of total emissions for different size bands and refineries, where data from the Member State is sufficiently disaggregated. The year of the data is also indicated.
Corresponding data for NOx is presented in Table 3.10.
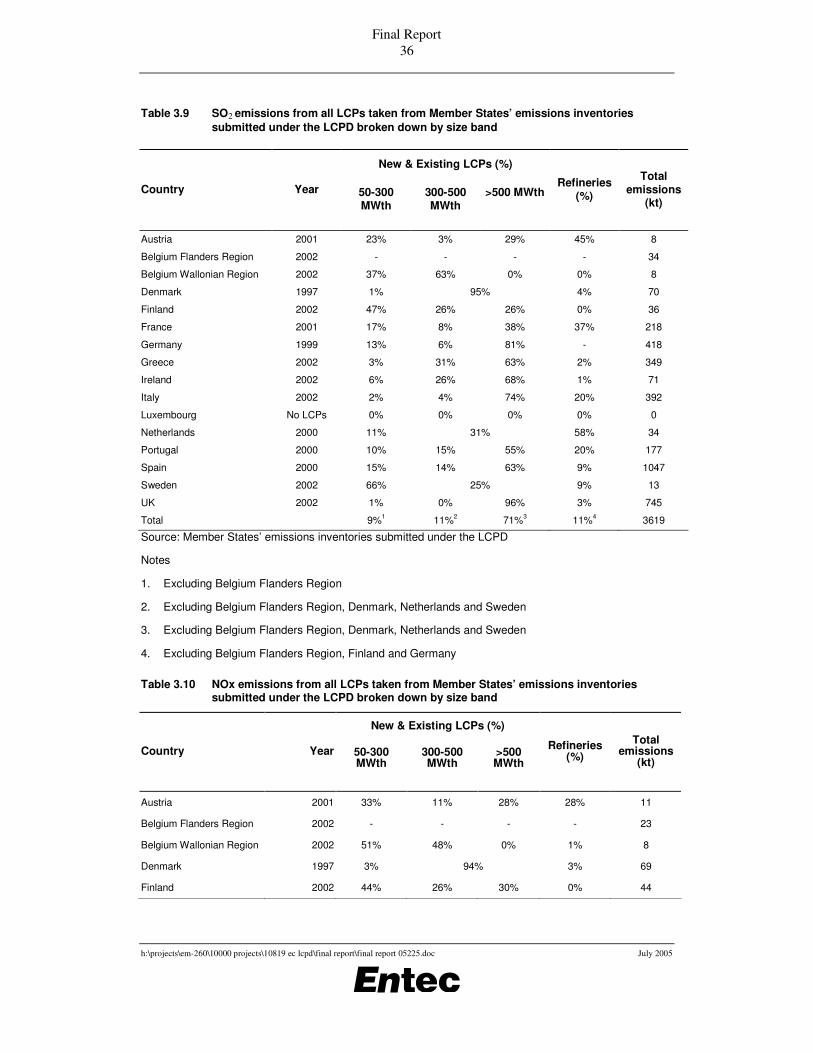
Final Report 36
h:\projects\em-260\10000 projects\10819 ec lcpd\final report\final report 05225.doc July 2005
Table 3.9 SO2 emissions from all LCPs taken from Member States’ emissions inventories submitted under the LCPD broken down by size band
New & Existing LCPs (%)
Country Year 50-300 MWth
300-500 MWth
>500 MWth Refineries
(%)
Total emissions
(kt)
Austria 2001 23% 3% 29% 45% 8
Belgium Flanders Region 2002 - - - - 34
Belgium Wallonian Region 2002 37% 63% 0% 0% 8
Denmark 1997 1% 95% 4% 70
Finland 2002 47% 26% 26% 0% 36
France 2001 17% 8% 38% 37% 218
Germany 1999 13% 6% 81% - 418
Greece 2002 3% 31% 63% 2% 349
Ireland 2002 6% 26% 68% 1% 71
Italy 2002 2% 4% 74% 20% 392
Luxembourg No LCPs 0% 0% 0% 0% 0
Netherlands 2000 11% 31% 58% 34
Portugal 2000 10% 15% 55% 20% 177
Spain 2000 15% 14% 63% 9% 1047
Sweden 2002 66% 25% 9% 13
UK 2002 1% 0% 96% 3% 745
Total 9%1 11%2 71%3 11%4 3619
Source: Member States’ emissions inventories submitted under the LCPD
Notes
1. Excluding Belgium Flanders Region
2. Excluding Belgium Flanders Region, Denmark, Netherlands and Sweden
3. Excluding Belgium Flanders Region, Denmark, Netherlands and Sweden
4. Excluding Belgium Flanders Region, Finland and Germany
Table 3.10 NOx emissions from all LCPs taken from Member States’ emissions inventories submitted under the LCPD broken down by size band
New & Existing LCPs (%)
Country Year 50-300 MWth
300-500 MWth
>500 MWth
Refineries (%)
Total emissions
(kt)
Austria 2001 33% 11% 28% 28% 11
Belgium Flanders Region 2002 - - - - 23
Belgium Wallonian Region 2002 51% 48% 0% 1% 8
Denmark 1997 3% 94% 3% 69
Finland 2002 44% 26% 30% 0% 44

Final Report 37
h:\projects\em-260\10000 projects\10819 ec lcpd\final report\final report 05225.doc July 2005
New & Existing LCPs (%)
Country Year 50-300 MWth
300-500 MWth
>500 MWth
Refineries (%)
Total emissions
(kt)
France 2001 25% 7% 52% 16% 109
Germany 1999 16% 5% 80% - 269
Greece 2002 3% 8% 87% 2% 70
Ireland 2002 6% 13% 80% 2% 37
Italy 2002 3% 7% 75% 16% 137
Luxembourg No LCPs 0% 0% 0% 0% 0
Netherlands 2000 17% 67% 16% 44
Portugal 2000 6% 10% 77% 8% 66
Spain 2000 17% 27% 52% 4% 283
Sweden 2002 53% 33% 14% 11
UK 2002 1% 1% 93% 5% 338
Total 12%1 10%2 72%3 7%4 1521
Source: Member States’ emissions inventories submitted under the LCPD
Notes
1. Excluding Belgium Flanders Region
2. Excluding Belgium Flanders Region, Denmark, Netherlands and Sweden
3. Excluding Belgium Flanders Region, Denmark, Netherlands and Sweden
4. Excluding Belgium Flanders Region, Finland and Germany
Furthermore, due to the lack of feedback from the petroleum refining sector from Entec’s survey of representative plants (described in Section 3.7), some further analysis has been undertaken of the emissions data on refineries in the LCPD inventories. In particular, the total refinery emissions of SO2 and NOx have been expressed per unit of crude capacity for that country in Table 3.11 - the LCPD inventory data is not sufficiently detailed to enable this analysis to be carried out at a plant level.
Table 3.11 SO2 emissions from LCPs at petroleum refineries taken from Member States’ emissions inventories expressed per unit of crude capacity
SO2 emissions NOx emissions Country
Emissions per unit throughput (t/b/cd)
Emissions per unit throughput
expressed as a % of the average
Emissions per unit throughput
(t/b/cd)
Emissions per unit throughput
expressed as a % of the average
A 0.016 48% 0.015 175%
B 0.016 46% 0.011 131%
C 0.042 124% 0.009 104%
D 0.020 60% 0.004 49%
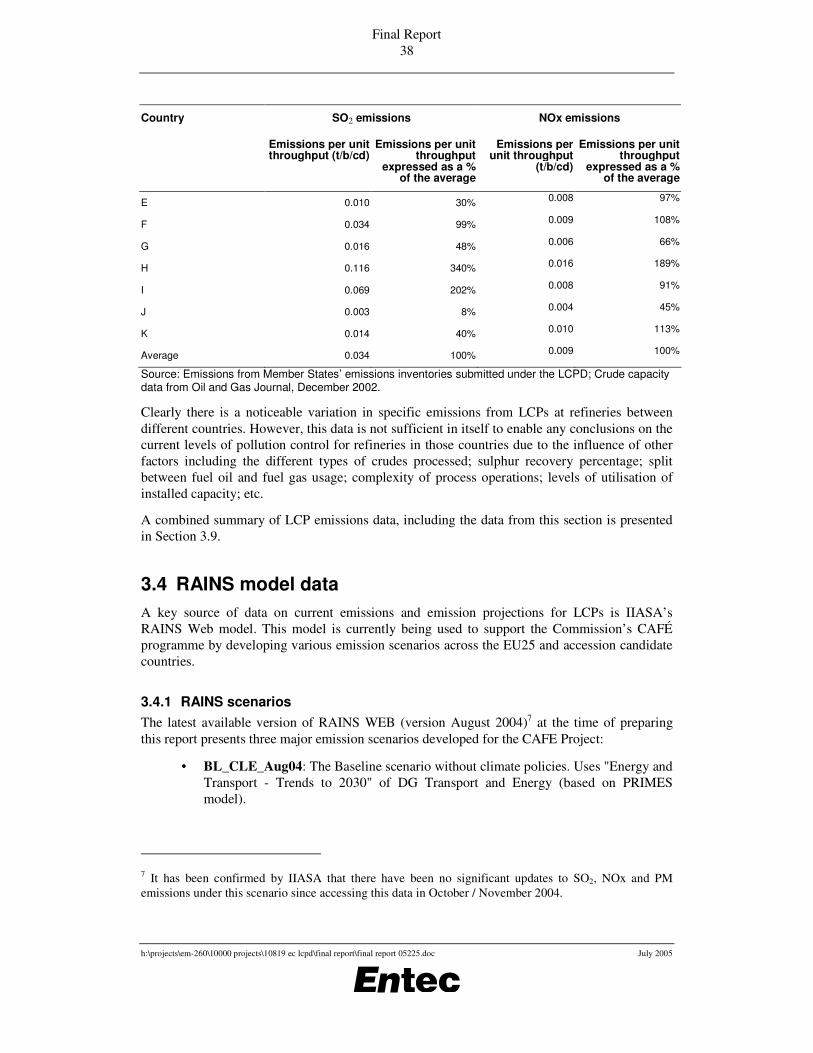
Final Report 38
h:\projects\em-260\10000 projects\10819 ec lcpd\final report\final report 05225.doc July 2005
SO2 emissions NOx emissions Country
Emissions per unit throughput (t/b/cd)
Emissions per unit throughput
expressed as a % of the average
Emissions per unit throughput
(t/b/cd)
Emissions per unit throughput
expressed as a % of the average
E 0.010 30% 0.008 97%
F 0.034 99% 0.009 108%
G 0.016 48% 0.006 66%
H 0.116 340% 0.016 189%
I 0.069 202% 0.008 91%
J 0.003 8% 0.004 45%
K 0.014 40% 0.010 113%
Average 0.034 100% 0.009 100%
Source: Emissions from Member States’ emissions inventories submitted under the LCPD; Crude capacity data from Oil and Gas Journal, December 2002.
Clearly there is a noticeable variation in specific emissions from LCPs at refineries between different countries. However, this data is not sufficient in itself to enable any conclusions on the current levels of pollution control for refineries in those countries due to the influence of other factors including the different types of crudes processed; sulphur recovery percentage; split between fuel oil and fuel gas usage; complexity of process operations; levels of utilisation of installed capacity; etc.
A combined summary of LCP emissions data, including the data from this section is presented in Section 3.9.
3.4 RAINS model data A key source of data on current emissions and emission projections for LCPs is IIASA’s RAINS Web model. This model is currently being used to support the Commission’s CAFÉ programme by developing various emission scenarios across the EU25 and accession candidate countries.
3.4.1 RAINS scenarios The latest available version of RAINS WEB (version August 2004)7 at the time of preparing this report presents three major emission scenarios developed for the CAFE Project:
• BL_CLE_Aug04: The Baseline scenario without climate policies. Uses "Energy and Transport - Trends to 2030" of DG Transport and Energy (based on PRIMES model).
7 It has been confirmed by IIASA that there have been no significant updates to SO2, NOx and PM emissions under this scenario since accessing this data in October / November 2004.
Final Report 39
h:\projects\em-260\10000 projects\10819 ec lcpd\final report\final report 05225.doc July 2005
• CP_CLE_Aug04: Climate policy scenario. Energy projection "with climate measures" developed with the PRIMES model. This incorporates to the maximum possible extent national perspectives, while maintaining Europe-wide consistency in assumptions about energy prices, electricity exports and imports etc.
• NAT_Aug04: Official national energy projections with climate policies and national agricultural projections (if supplied by Member States). Assumptions for other countries are the same as in the Climate policy scenario.
All scenarios assume successful implementation of the "Current legislation" (including the LCPD) on individual emission sources. The scenarios incorporate the findings from the bilateral consultations between IIASA and the Member States and stakeholders, including comments and national scenarios received by end of June 2004.
At the time of writing the BL_CLE and CP_CLE scenarios are available for all EU25 Member States, whilst the NAT scenario is available for 10 Member States only.
For the purposes of this study, the Commission has recommended the use of the ‘CP_CLE_Aug04’ scenario (current legislative controls with climate policies). As well as being the most applicable scenario for which data is available for all EU25 Member States, the use of this scenario will enable consistency to be achieved with the baseline scenarios under consideration in other Commission studies. As such, Section 3.4.4 presents key emissions data from this scenario.
For comparison, Section 3.4.5 presents data for the NAT_Aug04 scenarios (for those countries where this scenario has been developed), and compares the emissions estimates of these two scenarios.
For the LCP sector, energy projections clearly have a fundamental influence on the resultant emission levels. For example, variations in the predicted coal – gas split in the fuel mix can significantly influence the projected quantity of SO2, NOx and particulate matter emissions.
Comments from Member States on the Interim Report included remarks on differences between national energy projections and those in the RAINS model. Therefore, it is clearly important that national energy projections are factored into RAINS model as far as possible, and it is recommended that these RAINS emissions projections are also taken into account in supporting any policy decisions regarding the LCP sector.
3.4.2 Applicability to LCP sector
Coverage of processes Whilst the RAINS model does not have a specific sector for LCPs, the best match is given by the ‘Public Power’ (PP) sector.
In addition to the electricity supply industry, this sector also includes district heating plants and industrial power plants. The PP sector will include plants below the LCPD size threshold of 50MWth, although these are expected to have only a relatively limited impact on overall emissions of LCPD pollutants in comparison to plants above 50MWth, in particular large power stations. In this respect, the PP sector emissions will tend to represent a relatively small overestimate of LCP emissions.

Final Report 40
h:\projects\em-260\10000 projects\10819 ec lcpd\final report\final report 05225.doc July 2005
Furthermore, the PP sector will include pre-November 2002 gas turbines that are not included in the LCPD.
In addition to the PP sector, LCPs which are boilers or process heaters in the industrial sector (ie not power plants) will be included in other RAINS categories for example:
• ‘CON_COMB’ Fuel production and conversion: Combustion
• ‘IN_BO’ Industry: Combustion in boilers
• ‘IN_OC’ Industry: Other combustion
However, the level of disaggregation of these categories in RAINS does not enable the emissions of such plants to be separately identified. Therefore, in this respect, the PP sector will underestimate total LCP emissions. Based on knowledge of current LCP emissions, the extent of this underestimation is roughly estimated to be in the region of 5 to 15%, although the extent of underestimation of future emissions will be greater due to the proportionately greater impact the LCPD has on larger power stations compared to smaller industrial boilers and process heaters.
Whilst it is clearly not possible to achieve perfect agreement between national projections for LCP emissions and the projections in the RAINS model for the PP sector due to this sectoral mis-match, the emissions projections for the PP sector can provide a rough indication of absolute LCP emissions; as well as indications of the relative breakdown of overall LCP emissions by fuel type, country, ages of plant (existing / new), etc; and the relative contributions to emissions from all sources of LCP emissions.
Existing and new processes The PP sector is broken into existing (PP_EX) and new (PP_NEW) sub-sectors. In RAINS the split between existing and new plants is based on PRIMES inputs with ‘existing’ representing pre-1995 and ‘new’ representing post-1995 capacities. Clearly this is not consistent with the LCPD definitions of existing (pre July 1987) and new (post July 1987), although it should enable a rough approximation of the LCPD definitions, especially for existing coal and oil fired capacity which is dominated by pre-1987 plants.
3.4.3 Assumptions of uptake of abatement measures
Introduction The RAINS model calculates present and future emissions as a product of an activity rate (eg fuel consumption data) and an emission factor.
The emission factor is the product of an unabated emission factor, a percentage of capacity controlled by a specific abatement measure, and a percentage of emissions remaining following application of a specific abatement measure. Under the CLE (current legislation) scenarios, the specific abatement measures are those that are expected to be implemented under business as usual policy commitments.
As such, the assumptions regarding the capacity controlled by specific abatement measures are clearly important to the overall emissions estimates.
Details of current and planned measures have been gathered from the RAINS WEB (IIASA, 2004) and summarised in the tables below. The figures represent the percentage of plants in

Final Report 41
h:\projects\em-260\10000 projects\10819 ec lcpd\final report\final report 05225.doc July 2005
each category that are assumed to be fitted with the specified abatement equipment in the specified year. This information includes data for 2000 and projected data for 2005, 2010, 2015 and 2020, based on the CLE scenario.
The original data came from the national reviews of input data to RAINS undertaken for the NECD. During the bilateral consultations between Member States and IIASA in early 2004 to develop the baseline scenarios for CAFÉ, the data has been available for review and correction by EU25 countries. It is understood that IIASA have taken into account such review comments in the ‘Aug04’ version of the RAINSWEB that has been accessed in this study.
For countries where specific data has been unavailable, IIASA have assumed for the year 2000 such a degree of implementation of control measures that reproduces the emissions reported by national inventories. Assumptions on controls in other years simulate changes resulting from the current emission control legislation.
It is clear that the process of developing this data has been transparent and open, with active consultation with Member States. Notwithstanding this, in the event that RAINS model estimates are required for supporting any specific policy decisions regarding the LCP sector, it is recommended that confirmation is provided on the level of positive agreement from Member States of the capacity controlled assumptions in the RAINS model for the PP sector. This is because these assumptions are sensitive to the overall emissions estimates.
Whilst it is not within the scope of this study to review the capacity controlled tables for the PP sector at a detailed country-by-country level, some general observations of the data include:
• The estimated capacity of hard coal plants controlled with SCR in 2020 appears high (generally 100%), as the NOx ELV requiring SCR beyond 2016 is only applicable to >500MWth plants, not all plants. As such, this may lead to an underestimate of NOx emissions from 2020.
• The estimated capacity of brown coal plants controlled with SCR in 2020 also appears high (generally 50%), as it is expected that the 200mg/Nm3 NOx ELV could be achieved by primary measures (not SCR) for these plants. This may also lead to an underestimate of NOx emissions from 2020.
• Partial uptake (10 to 30%) of SCR is modelled for new gas turbine plants from 2005. However, feedback from key suppliers indicates that SCR is not currently forecast to be a business as usual commitment for this type of plant, and this technology is not required under the current LCPD. This may lead to an underestimate of NOx emissions from 2005.
• The extent of uptake of FGD for hard coal and lignite plants appears potentially high due to the potential for LCPs to opt-out of the LCP via the limited life derogation (Article 4(4)) which would enable them to operate without FGD until the end of 2015. Furthermore, the levels of uptake of FGD for heavy fuel oil plants appear potentially high as many of these are often low load factor plants that may also take up the limited life derogation.
SO2 control strategy tables The tables in this section summarise the estimated percentages of existing power plant and district heating plant capacity controlled by FGD (wet FGD or limestone injection, as indicated)

Final Report 42
h:\projects\em-260\10000 projects\10819 ec lcpd\final report\final report 05225.doc July 2005
under the CLE scenario in the RAINS model. Tables 3.12 and 3.13 present data for coal fired boilers (all except wet bottom boilers and wet bottom boilers respectively); Table 3.14 presents data for brown coal / lignite fired boilers and Table 3.15 presents data for oil fired boilers.
Table 3.12 Hard coal, existing plants, grade 1, all boiler types except wet bottom (figures are percentages of capacity controlled by FGD)
Country Abatement technique 2000 2005 2010 2015 2020
AUSTRIA Wet FGD 100 100 100 100 100
BELGIUM Wet FGD 30 30 75 80 80
CZECH REP Limestone injection 100 70 50 30 30
Wet FGD 0 30 50 70 70
DENMARK Wet FGD 100 100 100 100 100
ESTONIA Limestone injection 0 20 20 20 20
Wet FGD 0 20 25 30 35
FINLAND Limestone injection 25 25 0 0 0
Wet FGD 75 75 100 100 100
FRANCE Wet FGD 35 50 80 80 80
GERMANY Limestone injection 8 8 8 8 8
Wet FGD 92 92 92 92 92
GREECE (Note 1) Wet FGD 0 0 80 80 100
HUNGARY Wet FGD 0 0 50 50 50
IRELAND (Note 2) Wet FGD 0 0 80 80 100
ITALY Wet FGD 60 100 100 100 100
LUXEMBOURG Wet FGD 0 0 80 80 100
NETHERLANDS Wet FGD 96.5 100 100 100 100
POLAND Limestone injection 20 20 20 20 20
Wet FGD 20 20 25 30 35
PORTUGAL Wet FGD 0 0 80 80 100
SLOVAK REP Limestone injection 0 50 70 100 100
SPAIN Wet FGD 0 20 80 80 100
SWEDEN Wet FGD 100 100 100 100 100
UNITED KINGDOM Wet FGD 50 51 80 80 100
Source: RAINS WEB November 2004
Notes 1. It is noted that Greece does not have hard coal plants. This is shown in this table because the RAINS
model has 5 categories of brown coal plants for Greece, 2 of which are grouped into hard coal 1 and 2 as there is a limit of 3 categories of brown coal.
2. It is intended that FGD will be installed to all hard coal existing plants (ie. 100%) by 2009 at the latest (ESB, 2005).

Final Report 43
h:\projects\em-260\10000 projects\10819 ec lcpd\final report\final report 05225.doc July 2005
Table 3.13 Hard coal, existing plants, grade 1, wet bottom boilers (figures are percentages of capacity controlled by FGD)
Country Abatement technique 2000 2005 2010 2015 2020
AUSTRIA Wet FGD 0 100 100 100 100
CZECH REP. Wet FGD 90 100 100 100 100
FINLAND Wet FGD 100 100 100 100 100
GERMANY Limestone injection 4 4 4 4 4
Wet FGD 96 96 96 96 96
NETHERLANDS Wet FGD 100 100 100 100 100
SLOVAK REP. Wet FGD 90 100 100 100 100
Source: RAINS WEB November 2004
Table 3.14 Brown coal/lignite, existing plants, grade 1, all boiler types except wet bottom (figures are percentages of capacity controlled by FGD)
Country Abatement technique 2000 2005 2010 2015 2020
AUSTRIA Limestone injection 6 6 6 6 6
Wet FGD 94 94 94 94 94
CZECH REP Limestone injection 45 45 45 10 10
Wet FGD 55 55 55 90 90
ESTONIA Limestone injection 10 50 50 50 50
FINLAND Limestone injection 0 100 100 100 100
FRANCE Limestone injection 100 100 100 100 100
GERMANY Wet FGD 100 100 100 100 100
GREECE Limestone injection 25 25 0 0 0
Wet FGD 0 0 80 80 100
HUNGARY Wet FGD 36 36 75 75 75
IRELAND (Note 1) Limestone injection 0 0 100 100 100
ITALY Wet FGD 0 0 80 80 80
POLAND Wet FGD 40 45 50 50 60
SLOVAK REP. Wet FGD 70 90 90 90 90
SLOVENIA Wet FGD 49 50 100 100 100
SPAIN Wet FGD 0 0 80 80 100
SWEDEN Wet FGD 100 100 100 100 100
Source: RAINS WEB November 2004
Notes 1. All existing brown coal plants have been closed since January 2005 (ESB, 2005).

Final Report 44
h:\projects\em-260\10000 projects\10819 ec lcpd\final report\final report 05225.doc July 2005
Table 3.15 Heavy fuel oil, existing plants, all boiler types except wet bottom (figures are percentages of capacity controlled by FGD)
Country Abatement technique 2000 2005 2010 2015 2020
AUSTRIA Wet FGD 100 100 100 100 100
BELGIUM Wet FGD 4 4 4 4 4
DENMARK Wet FGD 100 100 100 100 100
FRANCE Wet FGD 0 0 80 80 100
GERMANY Wet FGD 100 100 100 100 100
GREECE Wet FGD 0 0 80 80 100
IRELAND (Note 1) Wet FGD 0 0 80 80 100
LUXEMBOURG Wet FGD 0 0 80 80 100
NETHERLANDS Wet FGD 96.5 100 100 100 100
PORTUGAL Wet FGD 0 0 0 80 100
SPAIN Wet FGD 0 0 80 80 0
SWEDEN Wet FGD 100 100 100 100 100
UNITED KINGDOM Wet FGD 0 0 80 80 100
Source: RAINS WEB November 2004
Notes 1. FGD is not intended to be installed on HFO units as they will fall within Ireland’s overall National
Emission Reduction Programme (NERP) ceiling (ESB, 2005).
Preliminary NOX control strategy tables The tables in this section summarise the estimated percentages of existing power plant and district heating plant capacity controlled by SCR under the CLE scenario in the RAINS model. Tables 3.16 and 3.17 present data for coal fired boilers (all except wet bottom boilers and wet bottom boilers respectively); Table 3.18 presents data for brown coal / lignite fired boilers; Table 3.19 presents data for oil fired boilers and Table 3.20 presents data for natural gas fired boilers.
Table 3.16 Hard Coal, existing plants, grade 1, all boiler types except wet bottom (figures are percentages of capacity controlled by SCR)
Country 2000 2005 2010 2015 2020
AUSTRIA 71 90.4 100 100 100
BELGIUM 0 0 55 70 70
CZECH REP 0 0 0 0 100
DENMARK 12.5 12.5 12.5 12.5 100
ESTONIA 0 0 0 0 0
FINLAND 0 0 0 0 100
FRANCE 0 0 0 0 100
GERMANY 80 90 100 100 100
GREECE 0 0 0 0 100
HUNGARY 0 0 0 0 100
IRELAND (Note 1) 0 0 0 0 100

Final Report 45
h:\projects\em-260\10000 projects\10819 ec lcpd\final report\final report 05225.doc July 2005
Country 2000 2005 2010 2015 2020
ITALY 80 90 90 100 100
LATVIA 0 0 0 0 0
LITHUANIA 0 0 0 0 0
LUXEMBOURG 0 0 0 0 100
NETHERLANDS 39 70 100 100 100
POLAND 0 0 0 0 100
PORTUGAL 0 0 17 17 100
SLOVAK REP. 0 0 0 0 100
SLOVENIA 0 0 0 0 100
SPAIN 0 0 0 0 100
SWEDEN 30 30 50 50 50
UNITED KINGDOM 0 0 0 0 100
Source: RAINS WEB November 2004
Notes 1. It is intended that SCR will be installed on all existing hard coal units (ie. 100%) by 2009 (ESB, 2005).
Table 3.17 Hard coal, existing plants, grade 1, wet bottom (figures are percentages of capacity controlled by SCR)
Country 2000 2005 2010 2015 2020
GERMANY 100 100 100 100 100
Source: RAINS WEB November 2004
Table 3.18 Brown coal/lignite, existing plants, grade 1, all boiler types except wet bottom (figures are percentages of capacity controlled by SCR) (Note 1)
Country 2000 2005 2010 2015 2020
AUSTRIA 90.4 100 100 100 100
CZECH REP 0 0 0 0 50
DENMARK 0 0 0 0 50
ESTONIA 0 0 0 0 0
FINLAND 0 0 0 0 50
FRANCE 0 0 0 0 50
GERMANY (Note 1) 50 50 50 50 50
GREECE 0 0 0 0 50
HUNGARY 0 0 0 0 50
IRELAND (Note 2) 0 0 0 0 50
LATVIA 0 0 0 0 0
LITHUNIA 0 0 0 0 0
NETHERLANDS 0 0 0 0 50
POLAND 0 0 0 0 50
PORTUGAL 0 0 0 0 50
SLOVAK REP. 0 0 0 0 50
SLOVENIA 0 0 0 0 0
SPAIN 0 0 0 0 50
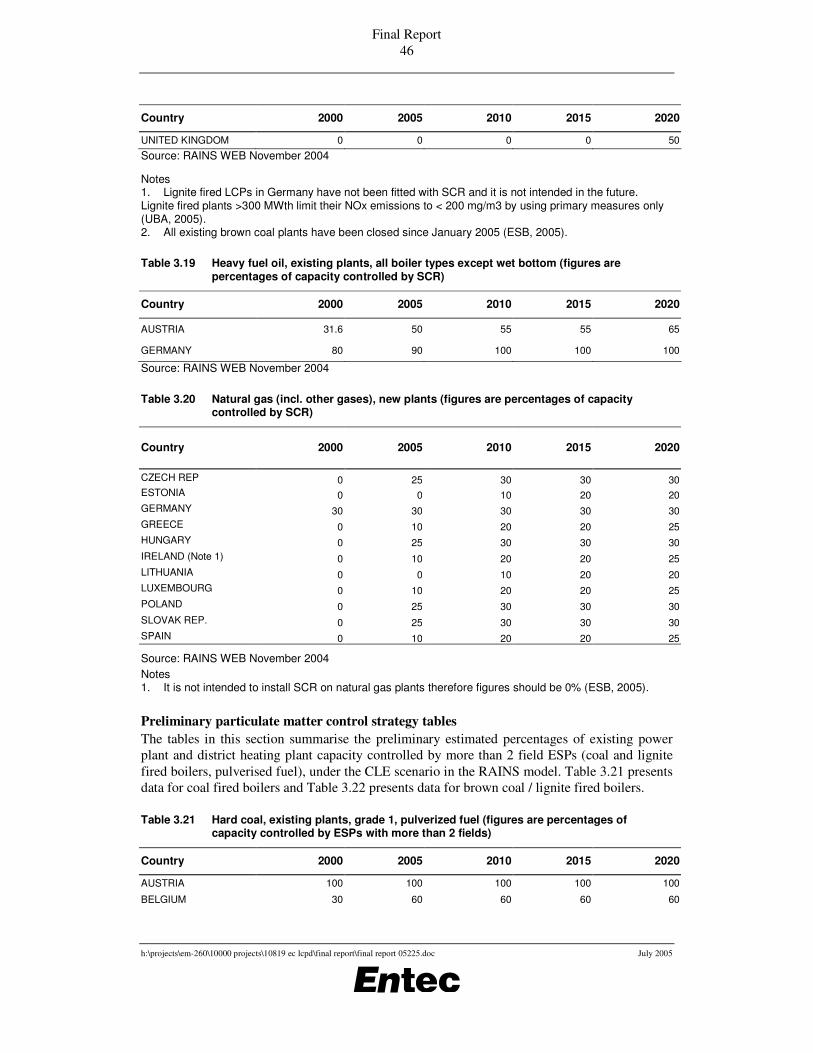
Final Report 46
h:\projects\em-260\10000 projects\10819 ec lcpd\final report\final report 05225.doc July 2005
Country 2000 2005 2010 2015 2020
UNITED KINGDOM 0 0 0 0 50
Source: RAINS WEB November 2004
Notes 1. Lignite fired LCPs in Germany have not been fitted with SCR and it is not intended in the future. Lignite fired plants >300 MWth limit their NOx emissions to < 200 mg/m3 by using primary measures only (UBA, 2005). 2. All existing brown coal plants have been closed since January 2005 (ESB, 2005).
Table 3.19 Heavy fuel oil, existing plants, all boiler types except wet bottom (figures are percentages of capacity controlled by SCR)
Country 2000 2005 2010 2015 2020
AUSTRIA 31.6 50 55 55 65
GERMANY 80 90 100 100 100
Source: RAINS WEB November 2004
Table 3.20 Natural gas (incl. other gases), new plants (figures are percentages of capacity controlled by SCR)
Country 2000 2005 2010 2015 2020
CZECH REP 0 25 30 30 30 ESTONIA 0 0 10 20 20 GERMANY 30 30 30 30 30 GREECE 0 10 20 20 25 HUNGARY 0 25 30 30 30 IRELAND (Note 1) 0 10 20 20 25 LITHUANIA 0 0 10 20 20 LUXEMBOURG 0 10 20 20 25 POLAND 0 25 30 30 30 SLOVAK REP. 0 25 30 30 30 SPAIN 0 10 20 20 25
Source: RAINS WEB November 2004
Notes 1. It is not intended to install SCR on natural gas plants therefore figures should be 0% (ESB, 2005).
Preliminary particulate matter control strategy tables The tables in this section summarise the preliminary estimated percentages of existing power plant and district heating plant capacity controlled by more than 2 field ESPs (coal and lignite fired boilers, pulverised fuel), under the CLE scenario in the RAINS model. Table 3.21 presents data for coal fired boilers and Table 3.22 presents data for brown coal / lignite fired boilers.
Table 3.21 Hard coal, existing plants, grade 1, pulverized fuel (figures are percentages of capacity controlled by ESPs with more than 2 fields)
Country 2000 2005 2010 2015 2020
AUSTRIA 100 100 100 100 100
BELGIUM 30 60 60 60 60

Final Report 47
h:\projects\em-260\10000 projects\10819 ec lcpd\final report\final report 05225.doc July 2005
Country 2000 2005 2010 2015 2020
CZECH REP. 10 10 10 10 10
DENMARK 90 90 90 90 90
FINLAND 100 100 100 100 100
FRANCE 30 30 30 30 30
GERMANY 100 100 100 100 100
GREECE 80 80 80 80 80
HUNGARY 0 30 100 100 100
IRELAND (Note 1) 30 60 60 60 60
ITALY 30 60 60 60 60
LUXEMBOURG 60 60 60 60 60
NETHERLANDS 100 100 100 100 100
POLAND 80 80 100 100 100
PORTUGAL 30 40 60 60 60
SPAIN 30 40 60 60 60
SWEDEN 50 100 100 100 100
UNITED KINGDOM 50 50 50 50 50
Source: RAINS WEB November 2004
Notes 1. It is not intended to install ESPs with more than 2 fields at existing hard coal plants (ESB, 2005).
Table 3.22 Brown coal/lignite, existing plants, grade 1, pulverised fuel (figures are percentages of capacity controlled by ESPs with more than 2 fields)
Country 2000 2005 2010 2015 2020
AUSTRIA 100 100 100 100 100
BELGIUM 30 60 60 60 60
CYPRUS 50 50 100 100 100
CZECH REP. 20 80 100 100 100
DENMARK 60 60 60 60 60
ESTONIA
FINLAND 100 100 100 100 100
FRANCE ? ? ? ? ?
GERMANY 88 88 100 100 100
GREECE 80 80 80 80 80
HUNGARY 30 30 100 100 100
IRELAND (Note 1) 30 60 60 60 60
ITALY 30 60 60 60 60
LUXEMBOURG 60 60 60 60 60
MALTA 50 50 100 100 100
NETHERLANDS 100 100 100 100 100
POLAND 80 80 80 80 80
PORTUGAL 60 60 60 60 60
SLOVENIA
SPAIN 60 60 60 60 60
SWEDEN 50 100 100 100 100

Final Report 48
h:\projects\em-260\10000 projects\10819 ec lcpd\final report\final report 05225.doc July 2005
Country 2000 2005 2010 2015 2020
UNITED KINGDOM 60 60 60 60 60
Source: RAINS WEB November 2004 Notes 1. All existing brown coal plants have been closed since January 2005 (ESB, 2005).
3.4.4 Emissions data in CP_CLE_Aug04 scenario Figures 3.3 to 3.6 and Tables 3.23 to 3.26 summarise emissions under the CP_CLE_Aug04 scenario from existing and new power and district heat plants for the EU25, broken down by fuel type. These figures and tables cover SO2, NOx, PM10 and PM2.5.
Note that ‘All other RAINS sources’ includes emissions of SO2 from all stationary and mobile RAINS sources excluding new and existing power plants.
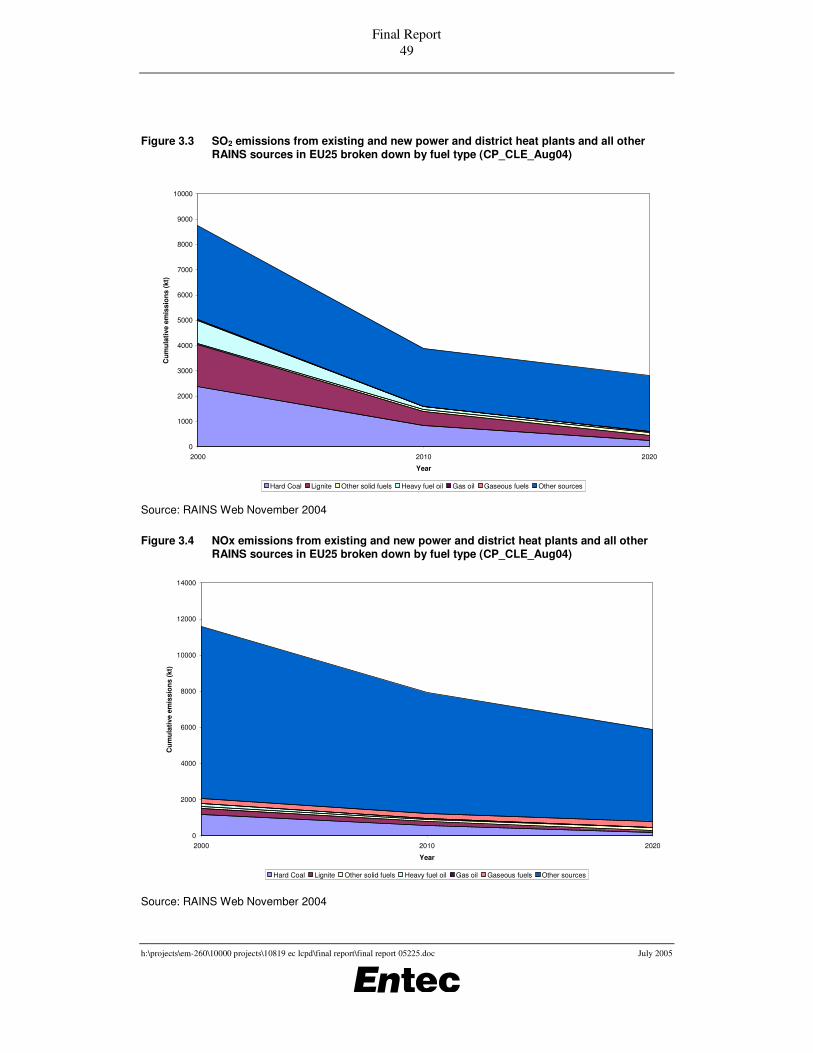
Final Report 49
h:\projects\em-260\10000 projects\10819 ec lcpd\final report\final report 05225.doc July 2005
Figure 3.3 SO2 emissions from existing and new power and district heat plants and all other RAINS sources in EU25 broken down by fuel type (CP_CLE_Aug04)
Source: RAINS Web November 2004
Figure 3.4 NOx emissions from existing and new power and district heat plants and all other RAINS sources in EU25 broken down by fuel type (CP_CLE_Aug04)
Source: RAINS Web November 2004
0
2000
4000
6000
8000
10000
12000
14000
2000 2010 2020
Year
Cum
ulat
ive
emis
sion
s (k
t)
Hard Coal Lignite Other solid fuels Heavy fuel oil Gas oil Gaseous fuels Other sources
0
1000
2000
3000
4000
5000
6000
7000
8000
9000
10000
2000 2010 2020
Year
Cum
ulat
ive
emis
sion
s (k
t)
Hard Coal Lignite Other solid fuels Heavy fuel oil Gas oil Gaseous fuels Other sources

Final Report 50
h:\projects\em-260\10000 projects\10819 ec lcpd\final report\final report 05225.doc July 2005
Figure 3.5 PM10 emissions from existing and new power and district heat plants and all other RAINS sources in EU25 broken down by fuel type (CP_CLE_Aug04)
0
500
1000
1500
2000
2500
3000
2000 2010 2020
Year
Cum
ulat
ive
emis
sion
s (k
t)
Hard Coal Lignite Other solid fuels Heavy fuel oil Gas oil Gaseous fuels Other sources Source: RAINS Web November 2004
Figure 3.6 PM2.5 emissions from existing and new power and district heat plants and all other RAINS sources in EU25 broken down by fuel type (CP_CLE_Aug04)
0
200
400
600
800
1000
1200
1400
1600
1800
2000
2000 2010 2020
Year
Cum
ulat
ive
emis
sion
s (k
t)
Hard Coal Lignite Other solid fuels Heavy fuel oil Gas oil Gaseous fuels Other sources
Source: RAINS Web November 2004

Final Report 51
h:\projects\em-260\10000 projects\10819 ec lcpd\final report\final report 05225.doc July 2005
Table 3.23 SO2 emissions from existing and new power and district heat plants and all other RAINS sources in EU25 broken down by fuel type (CP_CLE_Aug04)
Existing Power Plants & District Heat Plants (kt) New Power Plants & District Heat Plants (kt)
Country Lignite Hard Coal
Other solid fuels
Heavy fuel oil
Gas oil Gaseous fuels
Total (Existing)
Lignite Hard Coal
Other solid fuels
Heavy fuel oil
Gas oil Gaseous fuels
Total (New)
Total (New &
Existing)
Total all sources
2000 Total 1600 2378 36 874 5 2 4894 40 18 9 48 5 0 121 5015 8736
% of total emissions
from all sources
18.3% 27.2% 0.4% 10.0% 0.1% 0.0% 56.0% 0.5% 0.2% 0.1% 0.6% 0.1% 0.0% 1.4% 57.4% 100%
2010 Total 503 793 29 65 2 0 1393 57 33 56 39 3 0 188 1581 3890
% of total emissions
from all sources
12.9% 20.4% 0.8% 1.7% 0.1% 0.0% 35.8% 1.5% 0.8% 1.4% 1.0% 0.1% 0.0% 4.8% 40.6% 100%
2020 Total 131 152 22 33 1 0 339 67 84 100 10 5 1 267 606 2806
% of total emissions
from all sources
4.7% 5.4% 0.8% 1.2% 0.0% 0.0% 12.1% 2.4% 3.0% 3.6% 0.4% 0.2% 0.0% 9.5% 21.6% 100%
Source: RAINS Web October 2004
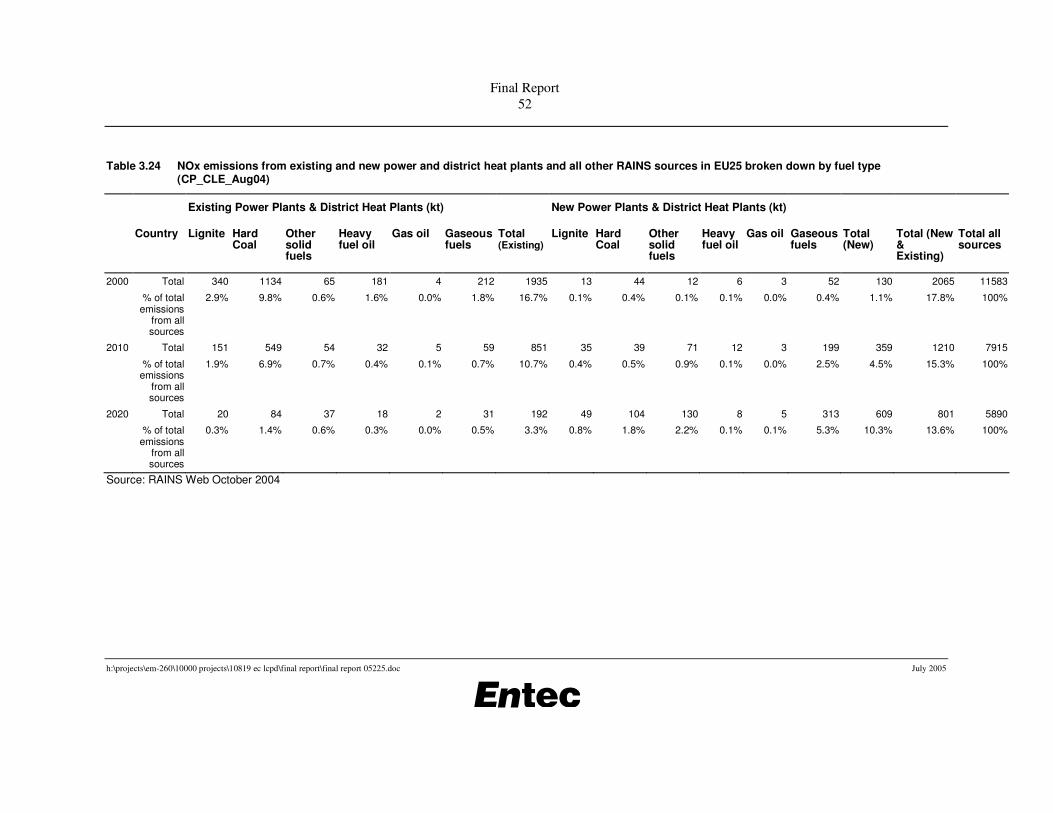
Final Report 52
h:\projects\em-260\10000 projects\10819 ec lcpd\final report\final report 05225.doc July 2005
Table 3.24 NOx emissions from existing and new power and district heat plants and all other RAINS sources in EU25 broken down by fuel type (CP_CLE_Aug04)
Existing Power Plants & District Heat Plants (kt) New Power Plants & District Heat Plants (kt)
Country Lignite Hard Coal
Other solid fuels
Heavy fuel oil
Gas oil Gaseous fuels
Total (Existing)
Lignite Hard Coal
Other solid fuels
Heavy fuel oil
Gas oil Gaseous fuels
Total (New)
Total (New & Existing)
Total all sources
2000 Total 340 1134 65 181 4 212 1935 13 44 12 6 3 52 130 2065 11583
% of total emissions
from all sources
2.9% 9.8% 0.6% 1.6% 0.0% 1.8% 16.7% 0.1% 0.4% 0.1% 0.1% 0.0% 0.4% 1.1% 17.8% 100%
2010 Total 151 549 54 32 5 59 851 35 39 71 12 3 199 359 1210 7915
% of total emissions
from all sources
1.9% 6.9% 0.7% 0.4% 0.1% 0.7% 10.7% 0.4% 0.5% 0.9% 0.1% 0.0% 2.5% 4.5% 15.3% 100%
2020 Total 20 84 37 18 2 31 192 49 104 130 8 5 313 609 801 5890
% of total emissions
from all sources
0.3% 1.4% 0.6% 0.3% 0.0% 0.5% 3.3% 0.8% 1.8% 2.2% 0.1% 0.1% 5.3% 10.3% 13.6% 100%
Source: RAINS Web October 2004

Final Report 53
h:\projects\em-260\10000 projects\10819 ec lcpd\final report\final report 05225.doc July 2005
Table 3.25 PM10 emissions from existing and new power and district heat plants and all other RAINS sources in EU25 broken down by fuel type (CP_CLE_Aug04)
Existing Power Plants & District Heat Plants (kt) New Power Plants & District Heat Plants (kt)
Country Lignite Hard Coal
Other solid fuels
Heavy fuel oil
Gas oil Gaseous fuels
Total (Existing)
Lignite Hard Coal
Other solid fuels
Heavy fuel oil
Gas oil Gaseous fuels
Total (New)
Total (New & Existing)
Total all sources
2000 Total 136 87 1 14 0 0 239 4 5 0 1 0 0 10 249 2445
% of total emissions
from all sources
5.5% 3.5% 0.1% 0.6% 0.0% 0.0% 9.8% 0.2% 0.2% 0.0% 0.0% 0.0% 0.0% 0.4% 10.2% 100%
2010 Total 37 44 1 2 0 0 85 16 7 3 2 0 1 28 113 1726
% of total emissions
from all sources
2.2% 2.5% 0.1% 0.1% 0.0% 0.0% 4.9% 0.9% 0.4% 0.2% 0.1% 0.0% 0.0% 1.6% 6.5% 100%
2020 Total 9 13 1 2 0 0 24 25 28 5 1 0 1 60 85 1495
% of total emissions
from all sources
0.6% 0.9% 0.1% 0.1% 0.0% 0.0% 1.6% 1.7% 1.8% 0.4% 0.1% 0.0% 0.1% 4.0% 5.7% 100%
Source: RAINS Web October 2004

Final Report 54
h:\projects\em-260\10000 projects\10819 ec lcpd\final report\final report 05225.doc July 2005
Table 3.26 PM2.5 emissions from existing and new power and district heat plants and all other RAINS sources in EU25 broken down by fuel type (CP_CLE_Aug04)
Existing Power Plants & District Heat Plants (kt) New Power Plants & District Heat Plants (kt)
Country Lignite Hard Coal
Other solid fuels
Heavy fuel oil
Gas oil Gaseous fuels
Total (Existing)
Lignite Hard Coal
Other solid fuels
Heavy fuel oil
Gas oil Gaseous fuels
Total (New)
Total (New &
Existing)
Total all sources
2000 Total 79 50 1 10 0 0 141 3 3 0 0 0 0 7 148 1749
% of total emissions
from all sources
4.5% 2.9% 0.1% 0.6% 0.0% 0.0% 8.1% 0.2% 0.2% 0.0% 0.0% 0.0% 0.0% 0.4% 8.5% 100%
2010 Total 25 27 1 2 0 0 55 11 4 3 1 0 1 20 75 1193
% of total emissions
from all sources
2.1% 2.3% 0.1% 0.1% 0.0% 0.0% 4.6% 0.9% 0.4% 0.2% 0.1% 0.0% 0.1% 1.7% 6.2% 100%
2020 Total 6 8 1 1 0 0 16 17 15 5 1 0 1 39 55 971
% of total emissions
from all sources
0.6% 0.9% 0.1% 0.1% 0.0% 0.0% 1.7% 1.7% 1.6% 0.5% 0.1% 0.0% 0.1% 4.0% 5.7% 100%
Source: RAINS Web October 2004

Final Report 55
h:\projects\em-260\10000 projects\10819 ec lcpd\final report\final report 05225.doc July 2005
A combined summary of LCP emissions data, including the data from this section is presented in Section 3.9.
3.4.5 Emissions data in NAT_Aug04 scenario Table 3.27 presents comparisons of emissions from power and district heat plants between the national (NAT) and PRIMES-based (CP_CLE) energy projections, for those countries where data on the NAT scenarios is currently available. The data shows the NAT scenario emissions expressed as a factor of the CP_CLE scenario emissions, ie 1.0 means the NAT scenario and CP_CLE scenario have the same emissions, whilst 1.5 means the NAT scenario emissions are 50% higher than those under the CP_CLE scenario.
Table 3.27 Emissions from power and district heat plants in ‘NAT’ scenario expressed as a proportion of emissions in ‘CP_CLE’ scenario
Country NOx SO2 PM10 PM2.5
2010 2020 2010 2020 2010 2020 2010 2020
Belgium 1.8 1.4 3.5 3.1 8.0 6.0 5.9 4.4
Czech Republic 1.3 2.0 1.2 2.0 1.2 1.8 1.2 1.8
Denmark 1.3 1.2 1.6 2.1 1.5 2.3 1.4 2.0
Finland 0.7 0.5 1.0 0.9 3.0 2.9 2.3 2.2
France 1.2 0.8 1.0 1.4 1.0 0.7 1.2 1.1
Italy 2.0 1.1 4.8 1.0 3.6 1.7 3.6 1.5
Portugal 1.1 1.0 1.4 2.0 1.2 1.2 1.1 1.2
Slovenia 2.1 1.5 1.1 2.0 3.1 2.7 3.1 2.6
Sweden 0.7 0.7 0.8 1.0 1.5 1.9 1.3 1.7
UK 1.3 1.2 1.6 2.3 1.4 2.4 1.4 2.0
Source: RAINS Web October 2004
It can be seen from this table that using activity rates based on official national energy projections can result in significantly higher emissions than those estimated using the PRIMES-based energy projections which form the basis of the CP_CLE scenario. This highlights the sensitivity of the RAINS model estimates to energy projections, and the importance of taking into account the best available national data on energy projections when informing future policy on the LCP sector.
3.5 EPER data The European Pollutant Emissions Register (EPER) provides an additional source of data on emissions from LCPs. According to the EPER Decision, Member States have to produce a triennial report on the emissions of industrial facilities into the air and waters. Only those activities which are listed in Annex A3 of the EPER Decision are included, resulting in coverage of approximately 90% of the emissions from industrial facilities. The data available was reported for 2001, the first reporting year for the EPER.
Emissions data for combustion installations over 50MWth has been extracted from the EPER in this section. However, it should be noted that this data is expected to represent an underestimation of total LCP emissions because:

Final Report 56
h:\projects\em-260\10000 projects\10819 ec lcpd\final report\final report 05225.doc July 2005
• Emissions from LCP processes at sites such as petroleum refineries are reported under separate sectors;
• The EPER reported data does not necessarily include data for all relevant installations covered by the EPER as it is dependent on the completeness of reporting.
We therefore must be cautious when comparing this data with other sources. As such, the EPER data is only used in this study when more robust data is not available.
Table 3.28 presents EPER emissions data for combustion installations (>50MWth) for SO2, NOx and PM10.
Table 3.28 SO2, NOx and PM10 emissions from combustion installations (>50MWth) and all sources as reported to the EPER for 2001
NOx (tpa) SOx (tpa) PM10 (tpa)
Country All EPER sources
(see note 1)
Combustion installations
> 50MW
All EPER sources (see
note 1)
Combustion installations
> 50MW
All EPER sources (see
note 1)
Combustion installations
> 50MW
EU-15 Austria 22,270 5,363 12,321 2,350 1,535 62
Belgium 106,362 31,318 105,664 30,469 12,683 618
Denmark 43,863 30,489 12,433 7,709 201 ND
Finland 69,427 38,803 59,436 34,061 8,279 1,350
France 243,181 90,844 369,051 101,855 5,942 3,013
Germany 395,277 221,201 370,590 202,513 21,762 7,780
Greece 119,861 84,050 408,222 330,111 3,352 ND
Ireland 50,958 40,072 91,498 73,312 1,542 1,308
Italy 344,520 161,535 514,126 322,571 5,076 1,433
Luxembourg 4,738 ND 604 ND 107 ND
Netherlands 61,656 31,241 51,777 9,444 4,768 236
Portugal 77,681 45,593 166,147 124,879 9,605 3,329
Spain 801,301 651,501 1,156,625 937,634 43,575 29,326
Sweden 26,482 2,200 22,353 1,604 3,423
UK 534,990 428,534 948,213 795,957 18,668 8,529
Sub-total 2,902,567 1,862,744 4,289,060 2,974,469 140,516 56,983
% of total emissions (all sources)
64% 69% 43%
New Member States
Cyprus ND ND ND ND ND ND
Czech Republic ND ND ND ND ND ND
Estonia ND ND ND ND ND ND
Hungary 39,973 29,363 284,785 275,857 58,300 ND
Latvia ND ND ND ND ND ND
Lithuania ND ND ND ND ND ND
Malta ND ND ND ND ND ND
Poland ND ND ND ND ND ND
Slovakia ND ND ND ND ND ND
Slovenia ND ND ND ND ND ND
Sub-total 39,973 29,363 284,785 275,857 58,300 ND
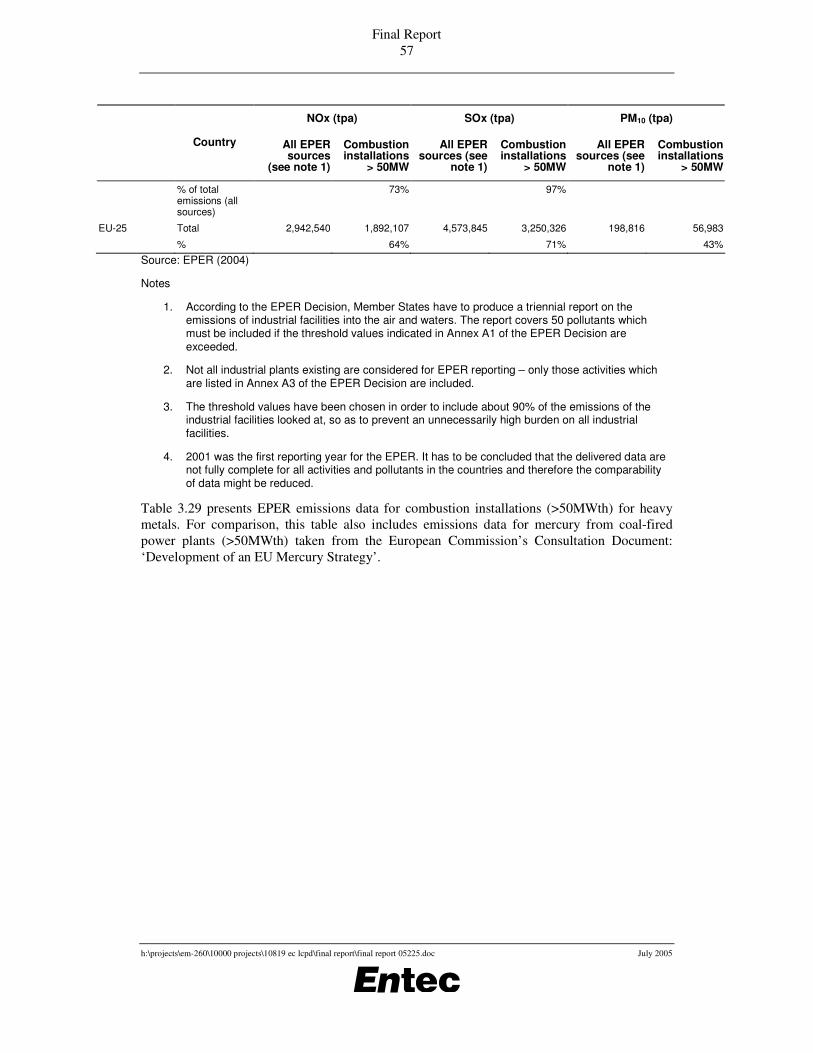
Final Report 57
h:\projects\em-260\10000 projects\10819 ec lcpd\final report\final report 05225.doc July 2005
NOx (tpa) SOx (tpa) PM10 (tpa)
Country All EPER sources
(see note 1)
Combustion installations
> 50MW
All EPER sources (see
note 1)
Combustion installations
> 50MW
All EPER sources (see
note 1)
Combustion installations
> 50MW
% of total emissions (all sources)
73% 97%
EU-25 Total 2,942,540 1,892,107 4,573,845 3,250,326 198,816 56,983
% 64% 71% 43%
Source: EPER (2004)
Notes
1. According to the EPER Decision, Member States have to produce a triennial report on the emissions of industrial facilities into the air and waters. The report covers 50 pollutants which must be included if the threshold values indicated in Annex A1 of the EPER Decision are exceeded.
2. Not all industrial plants existing are considered for EPER reporting – only those activities which are listed in Annex A3 of the EPER Decision are included.
3. The threshold values have been chosen in order to include about 90% of the emissions of the industrial facilities looked at, so as to prevent an unnecessarily high burden on all industrial facilities.
4. 2001 was the first reporting year for the EPER. It has to be concluded that the delivered data are not fully complete for all activities and pollutants in the countries and therefore the comparability of data might be reduced.
Table 3.29 presents EPER emissions data for combustion installations (>50MWth) for heavy metals. For comparison, this table also includes emissions data for mercury from coal-fired power plants (>50MWth) taken from the European Commission’s Consultation Document: ‘Development of an EU Mercury Strategy’.
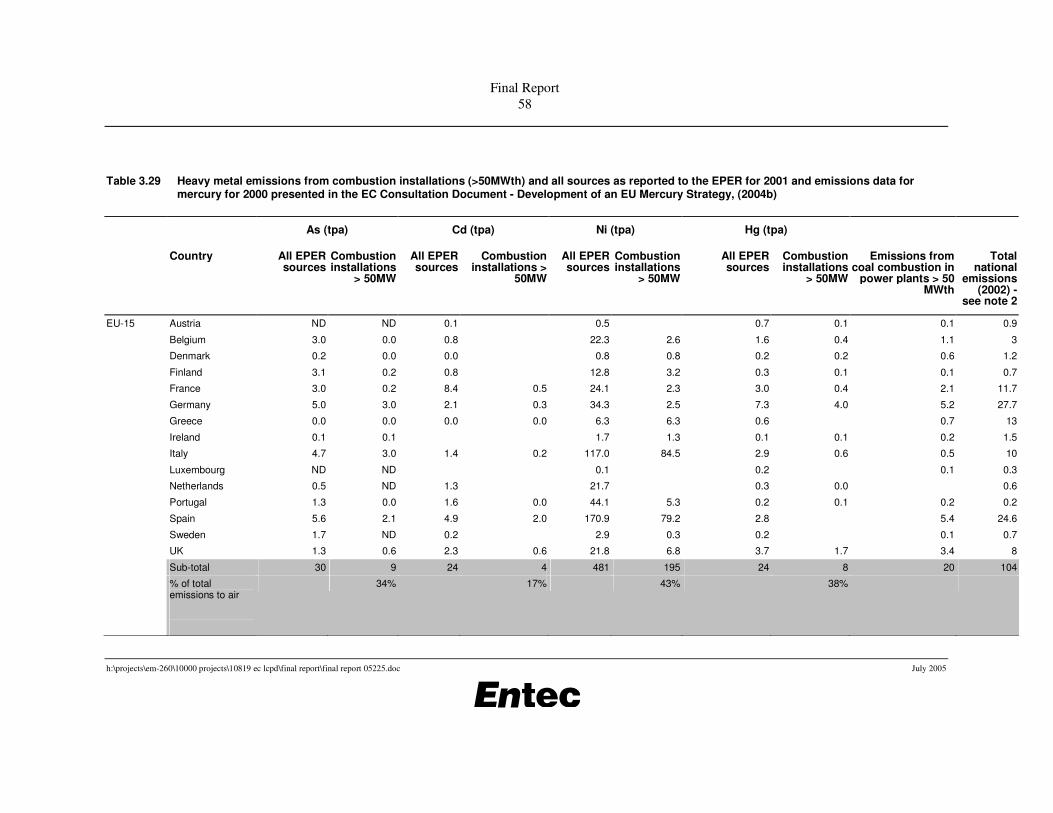
Final Report 58
h:\projects\em-260\10000 projects\10819 ec lcpd\final report\final report 05225.doc July 2005
Table 3.29 Heavy metal emissions from combustion installations (>50MWth) and all sources as reported to the EPER for 2001 and emissions data for mercury for 2000 presented in the EC Consultation Document - Development of an EU Mercury Strategy, (2004b)
As (tpa) Cd (tpa) Ni (tpa) Hg (tpa)
Country All EPER sources
Combustion installations
> 50MW
All EPER sources
Combustion installations >
50MW
All EPER sources
Combustion installations
> 50MW
All EPER sources
Combustion installations
> 50MW
Emissions from coal combustion in
power plants > 50 MWth
Total national
emissions (2002) -
see note 2
EU-15 Austria ND ND 0.1 0.5 0.7 0.1 0.1 0.9
Belgium 3.0 0.0 0.8 22.3 2.6 1.6 0.4 1.1 3
Denmark 0.2 0.0 0.0 0.8 0.8 0.2 0.2 0.6 1.2
Finland 3.1 0.2 0.8 12.8 3.2 0.3 0.1 0.1 0.7
France 3.0 0.2 8.4 0.5 24.1 2.3 3.0 0.4 2.1 11.7
Germany 5.0 3.0 2.1 0.3 34.3 2.5 7.3 4.0 5.2 27.7
Greece 0.0 0.0 0.0 0.0 6.3 6.3 0.6 0.7 13
Ireland 0.1 0.1 1.7 1.3 0.1 0.1 0.2 1.5
Italy 4.7 3.0 1.4 0.2 117.0 84.5 2.9 0.6 0.5 10
Luxembourg ND ND 0.1 0.2 0.1 0.3
Netherlands 0.5 ND 1.3 21.7 0.3 0.0 0.6
Portugal 1.3 0.0 1.6 0.0 44.1 5.3 0.2 0.1 0.2 0.2
Spain 5.6 2.1 4.9 2.0 170.9 79.2 2.8 5.4 24.6
Sweden 1.7 ND 0.2 2.9 0.3 0.2 0.1 0.7
UK 1.3 0.6 2.3 0.6 21.8 6.8 3.7 1.7 3.4 8
Sub-total 30 9 24 4 481 195 24 8 20 104
% of total emissions to air
34% 17% 43% 38%

Final Report 59
h:\projects\em-260\10000 projects\10819 ec lcpd\final report\final report 05225.doc July 2005
As (tpa) Cd (tpa) Ni (tpa) Hg (tpa)
Country All EPER sources
Combustion installations
> 50MW
All EPER sources
Combustion installations >
50MW
All EPER sources
Combustion installations
> 50MW
All EPER sources
Combustion installations
> 50MW
Emissions from coal combustion in
power plants > 50 MWth
Total national
emissions (2002) -
see note 2
New Member States
Cyprus ND ND ND ND ND ND ND ND ND 0.3
Czech Republic ND ND ND ND ND ND ND ND 1.7 2.8
Estonia ND ND ND ND ND ND ND ND ND 0.5
Hungary 0.7 0.1 0.2 0.1 7.9 7.8 0.2 ND 1.0 4
Latvia ND ND ND ND ND ND ND ND ND 0.1
Lithuania ND ND ND ND ND ND ND ND ND 0.3
Malta ND ND ND ND ND ND ND ND ND ND
Poland ND ND ND ND ND ND ND ND 10.2 23.2
Slovakia ND ND ND ND ND ND ND ND 1.1 3.1
Slovenia ND ND ND ND ND ND ND ND 0.3 0.6
Sub-total 1 0 0 0 8 8 0 0 14 35
% of total emissions to air
9% 27% 99% 0%
EU-25 Total 30 9 24 4 489 203 24 8 34 139
% 33% 17% 43% 38%
Source: (a) EPER (2004) (b) EC Consultation Document - Development of an EU Mercury Strategy, March 2004.

Final Report 60
h:\projects\em-260\10000 projects\10819 ec lcpd\final report\final report 05225.doc July 2005 10819
A detailed breakdown of 2001 mercury emissions from Poland (the country making the greatest overall contribution to mercury emissions from combustion plants >50MWth) is presented in Table 3.30 below. This is taken from Poland’s national submission to UNECE.
Table 3.30 Emissions of mercury in Poland in 2001 (from national submission to UNECE)
Sector Sub-sector Fuel Emission in t Percentage of total
All emission sources All emission sources Total 23.2 100%
01. Combustion in energy and transformation industries
Sub-total 10.2 44%
0101 Public power Sub-total 9.7 42%
Hard coal 7.1 31%
Brown coal 2.6 11%
Fuel oil 0 0%
0102 District heating plants Sub-total 0.2 1%
Hard coal 0.2 1%
Brown coal 0 0%
Coke 0 0%
Fuel oil 0 0%
This shows that the public power and district heating sector emits approximately 44% of mercury emissions from all UNECE sources in Poland. Approximately 75% of the contribution from the public power and district heating sector is from hard coal, with the remaining 25% from brown coal.
A combined summary of LCP emissions data, including the data from this section is presented in Section 3.9.
3.6 NECD and UNECE/EMEP data
NECD projections The NECD requires, in Article 7, that Member States shall prepare and annually update emission inventories and emission projections for 2010 for SO2, NOx, VOC and NH3. Methods for developing inventories and projections are specified in Annex III ‘Member States shall establish emission inventories and projections using the methodologies agreed upon by the Convention on Long-Range Transboundary Air Pollution and are requested to use the joint EMEP/CORINAIR guidebook in preparing these inventories and projections.'
However, the projections that have been presented to the Commission are, in most cases, at a level of aggregation that does not enable the projected emissions from the LCP sector to be identified separately.
UNECE/EMEP The UNECE/EMEP emission database WebDab has been constructed in order to facilitate the access to the emission data reported to the Convention on Long-Range Transboundary Air Pollution (CLRTAP) on key pollutants such as NOx, PM10, SO2, Heavy Metals and Persistent

Final Report 61
h:\projects\em-260\10000 projects\10819 ec lcpd\final report\final report 05225.doc July 2005 10819
Organic Pollutants. However, the current version of WebDab does not include emissions from large stationary combustion sources and therefore could not be used for this report.
3.7 Plant level data
3.7.1 Survey of emissions and abatement data for selected plants in the ESI In order to supplement the abovementioned data sources, a survey was undertaken to gather plant level data on emissions and abatement techniques for selected LCPs across the EU25.
The survey process involved making initial contact with the relevant European level industry associations to introduce the project objectives, approach and role of the survey (for Eurelectric and Concawe / Europia this also involved face to face meetings). National level representatives were then contacted to describe the project aims prior to requesting information on representative plants through the completion of a tailored survey form. A combination of email and telephone contact was used in order to maximise the response rate.
Due to the dominance of the electricity supply industry in relation to overall LCP emissions, the resources available within the project for the survey were prioritised towards this sector. For each national level representative, information was sought on:
• Categories of large combustion plants in the electricity supply industry within that country. This information was structured in the form of a matrix covering different fuel types, plant size categories and plant age categories; and
• Data for a representative large combustion plant for each of the above categories in the electricity supply industry. Data was requested on electricity production, fuel consumption, mass emissions and concentrations for a variety of pollutants, as well as details of current and future emission abatement techniques. The survey form defined a representative plant within a particular category as one where the capacity, activity rate (load factor) and level of emission control is broadly typical of the category as a whole.
It was not possible to obtain completed survey forms covering each Member State, and hence for some countries the following supplementary information sources were used:
• Member States’ National Plans under the LCPD;
• Member States’ emissions inventories under the LCPD;
• Information from the IEA CoalPower4 database;
• Published reports; and
• Information held in-house by Entec.
As such, whilst we have endeavoured to obtain information on representative plants, it has not been possible to obtain this for each country, and the achievement of a truly representative sample would be beyond the resources available to this project. However, the plant level information that has been obtained should provide a realistic indication of current emission levels and abatement techniques for key types of LCPs.
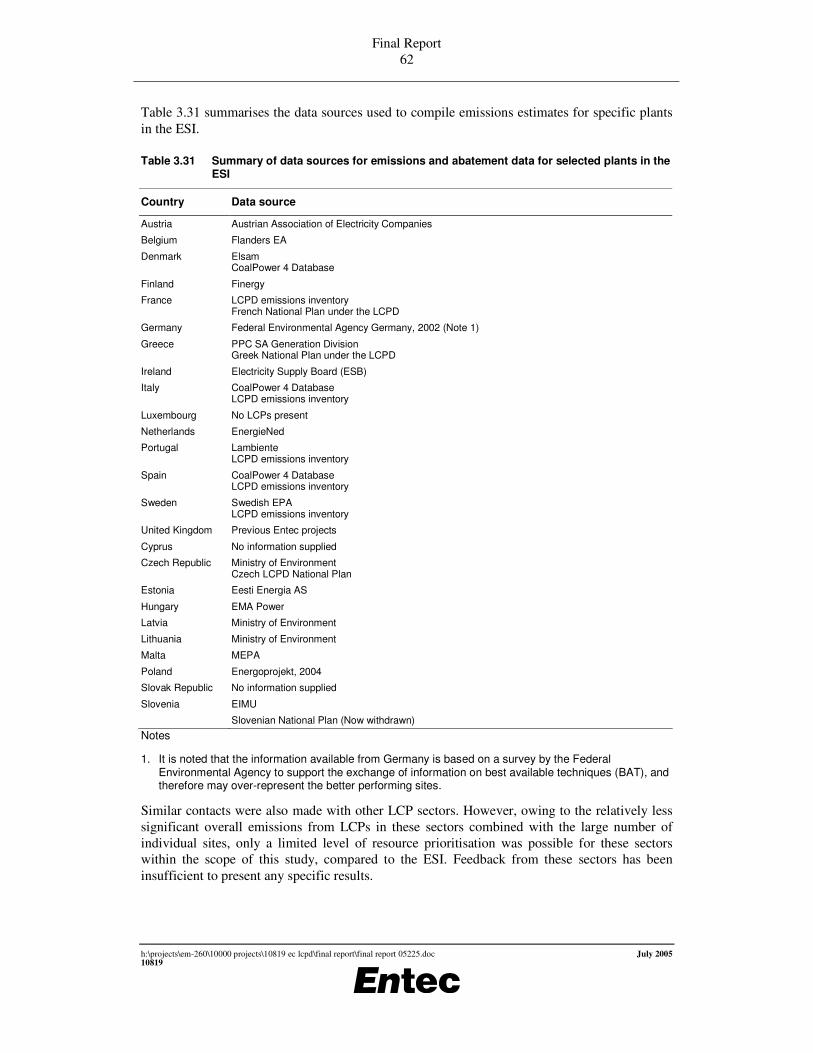
Final Report 62
h:\projects\em-260\10000 projects\10819 ec lcpd\final report\final report 05225.doc July 2005 10819
Table 3.31 summarises the data sources used to compile emissions estimates for specific plants in the ESI.
Table 3.31 Summary of data sources for emissions and abatement data for selected plants in the ESI
Country Data source
Austria Austrian Association of Electricity Companies
Belgium Flanders EA
Denmark Elsam CoalPower 4 Database
Finland Finergy
France LCPD emissions inventory French National Plan under the LCPD
Germany Federal Environmental Agency Germany, 2002 (Note 1)
Greece PPC SA Generation Division Greek National Plan under the LCPD
Ireland Electricity Supply Board (ESB)
Italy CoalPower 4 Database LCPD emissions inventory
Luxembourg No LCPs present
Netherlands EnergieNed
Portugal Lambiente LCPD emissions inventory
Spain CoalPower 4 Database LCPD emissions inventory
Sweden Swedish EPA LCPD emissions inventory
United Kingdom Previous Entec projects
Cyprus No information supplied
Czech Republic Ministry of Environment Czech LCPD National Plan
Estonia Eesti Energia AS
Hungary EMA Power
Latvia Ministry of Environment
Lithuania Ministry of Environment
Malta MEPA
Poland Energoprojekt, 2004
Slovak Republic No information supplied
Slovenia EIMU
Slovenian National Plan (Now withdrawn)
Notes
1. It is noted that the information available from Germany is based on a survey by the Federal Environmental Agency to support the exchange of information on best available techniques (BAT), and therefore may over-represent the better performing sites.
Similar contacts were also made with other LCP sectors. However, owing to the relatively less significant overall emissions from LCPs in these sectors combined with the large number of individual sites, only a limited level of resource prioritisation was possible for these sectors within the scope of this study, compared to the ESI. Feedback from these sectors has been insufficient to present any specific results.

Final Report 63
h:\projects\em-260\10000 projects\10819 ec lcpd\final report\final report 05225.doc July 2005 10819
The results of the abovementioned survey, supplemented with additional data as appropriate, are summarised in Figures 3.7 to 3.15. These focus on current SO2, NOx and dust emissions for coal, lignite and oil power stations in EU25 (Consideration of gas fired plant is presented separately in Section 3.7.2). It should be emphasised that as the emissions data represents current performance, it does not necessarily reflect future performance consistent with compliance with LCPD, IPPCD etc. Whilst information was sought for future abatement plans, such information is not widely available, partly due to the uncertainty in specifically how plants would respond to these and other key directives.
Each plant has a reference number, which can be used to reference further information about the plant in Appendix 5.
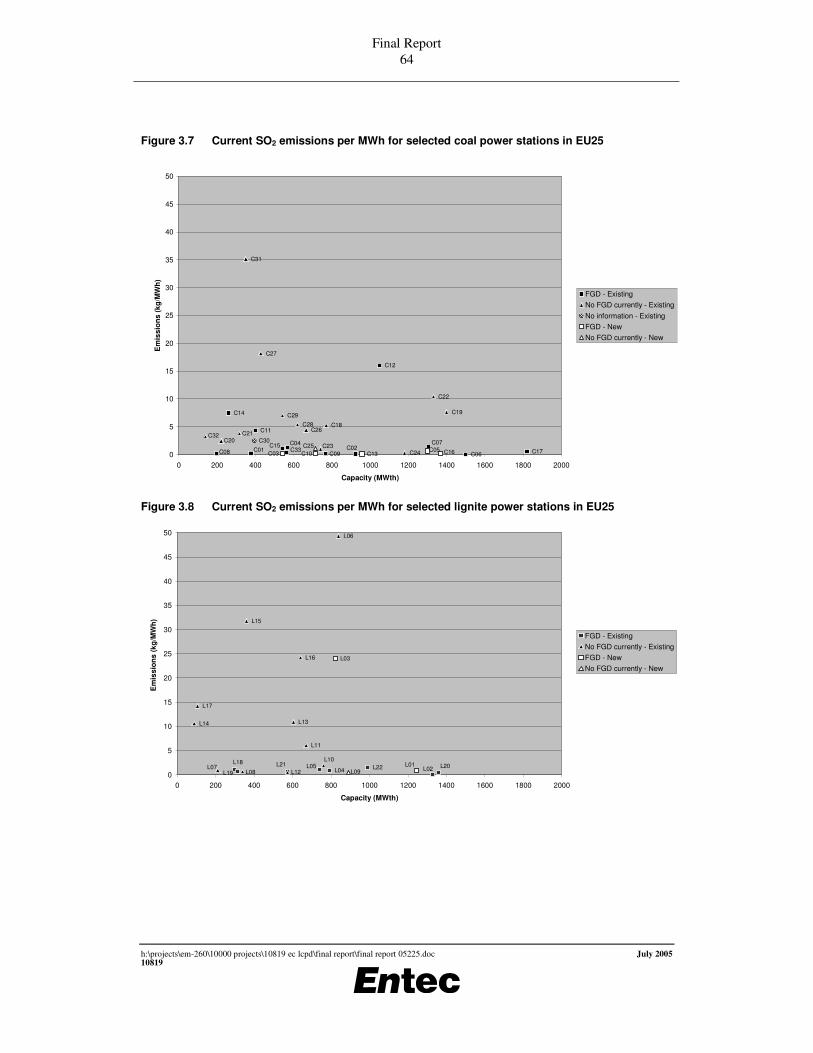
Final Report 64
h:\projects\em-260\10000 projects\10819 ec lcpd\final report\final report 05225.doc July 2005 10819
Figure 3.7 Current SO2 emissions per MWh for selected coal power stations in EU25
Figure 3.8 Current SO2 emissions per MWh for selected lignite power stations in EU25
C33 C17C15
C14
C12
C11
C09C08
C07
C06
C04C02C01
C32
C31
C29C28
C27
C26
C24C23
C22
C21C20
C19
C18
C30
C16C13C10C05
C03C25
0
5
10
15
20
25
30
35
40
45
50
0 200 400 600 800 1000 1200 1400 1600 1800 2000
Capacity (MWth)
Em
issi
ons
(kg/
MW
h)
FGD - ExistingNo FGD currently - ExistingNo information - ExistingFGD - NewNo FGD currently - New
L22L21 L20L19
L18L05
L04 L02
L17
L16
L15
L14 L13
L12
L11
L10
L08L07
L06
L03
L01L090
5
10
15
20
25
30
35
40
45
50
0 200 400 600 800 1000 1200 1400 1600 1800 2000
Capacity (MWth)
Em
issi
ons
(kg/
MW
h)
FGD - ExistingNo FGD currently - ExistingFGD - NewNo FGD currently - New
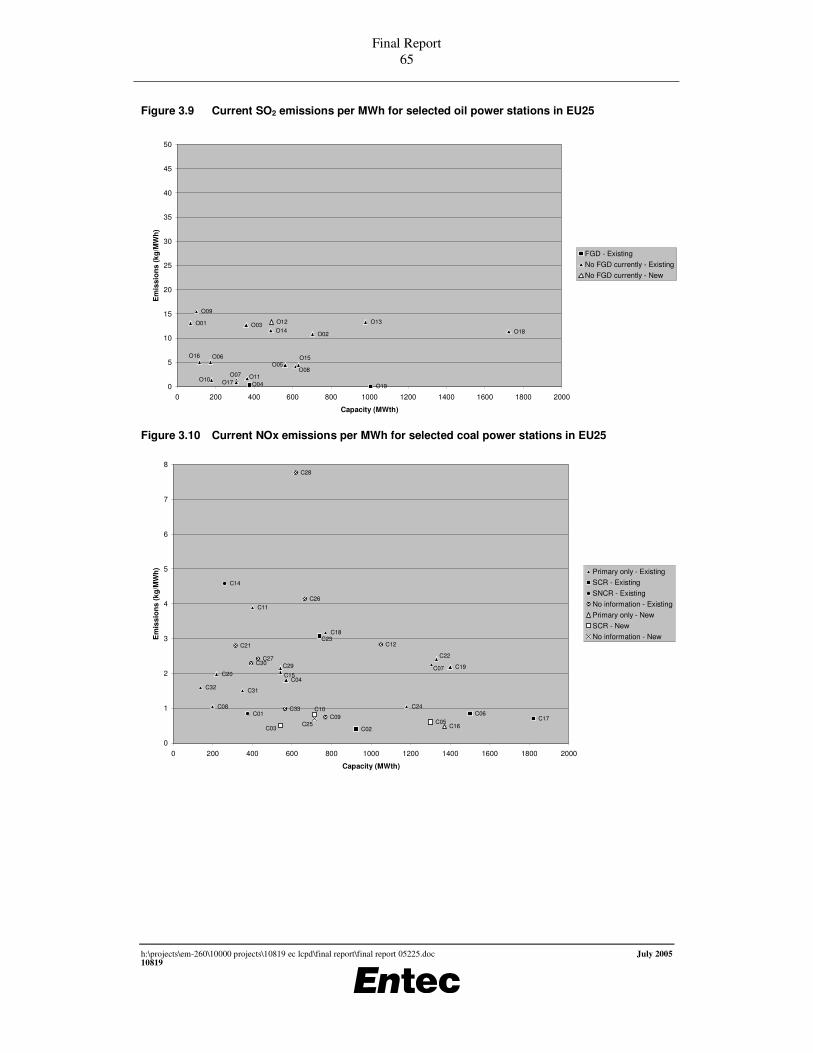
Final Report 65
h:\projects\em-260\10000 projects\10819 ec lcpd\final report\final report 05225.doc July 2005 10819
Figure 3.9 Current SO2 emissions per MWh for selected oil power stations in EU25
Figure 3.10 Current NOx emissions per MWh for selected coal power stations in EU25
O19O04
O18
O17
O16 O15
O14O13
O11O10
O09
O08O07
O06O05
O03O02
O01 O12
0
5
10
15
20
25
30
35
40
45
50
0 200 400 600 800 1000 1200 1400 1600 1800 2000
Capacity (MWth)
Em
issi
ons
(kg/
MW
h)
FGD - ExistingNo FGD currently - ExistingNo FGD currently - New
C04
C07
C08
C11
C15
C18
C19C20
C22
C24
C29
C31C32
C02
C06C17
C23
C01
C14
C09
C12C21
C26
C27
C28
C30
C33
C16C03C05
C10
C25
0
1
2
3
4
5
6
7
8
0 200 400 600 800 1000 1200 1400 1600 1800 2000
Capacity (MWth)
Em
issi
ons
(kg/
MW
h) Primary only - ExistingSCR - ExistingSNCR - ExistingNo information - ExistingPrimary only - NewSCR - NewNo information - New
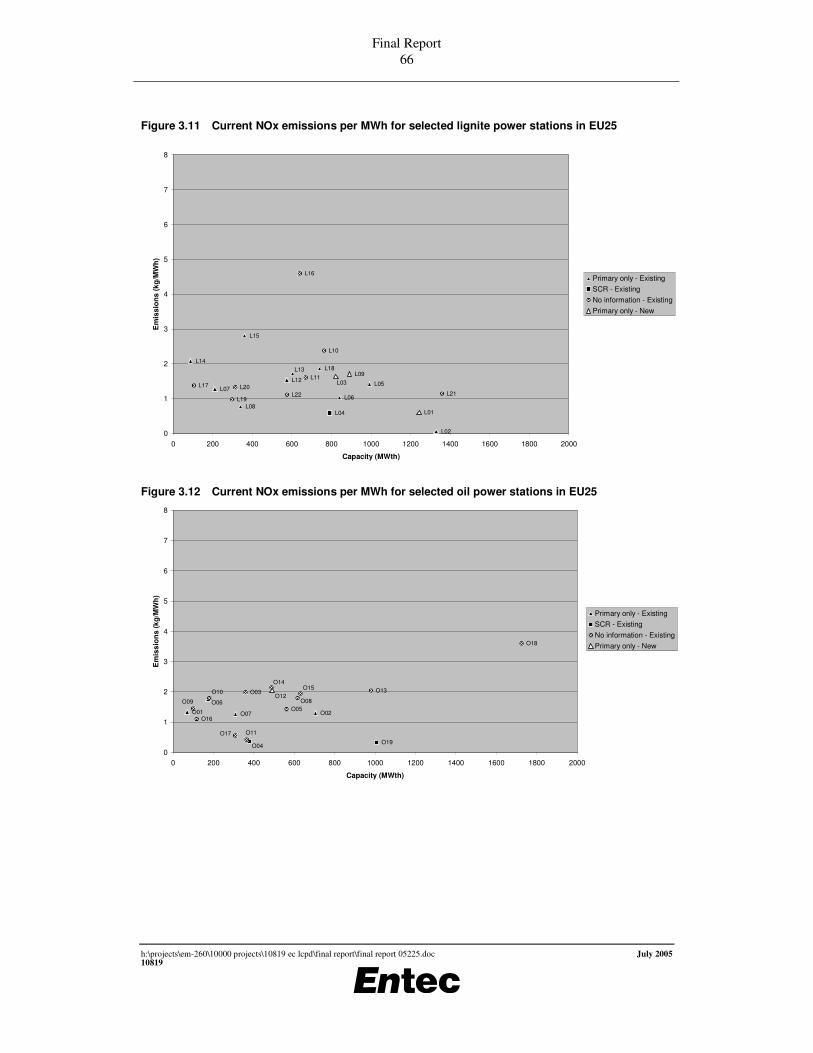
Final Report 66
h:\projects\em-260\10000 projects\10819 ec lcpd\final report\final report 05225.doc July 2005 10819
Figure 3.11 Current NOx emissions per MWh for selected lignite power stations in EU25
Figure 3.12 Current NOx emissions per MWh for selected oil power stations in EU25
L18
L15
L14L13
L12
L08
L07L06
L05
L02
L04
L22 L21L20
L19
L17
L16
L11
L10
L09L03
L01
0
1
2
3
4
5
6
7
8
0 200 400 600 800 1000 1200 1400 1600 1800 2000
Capacity (MWth)
Em
issi
ons
(kg/
MW
h)
Primary only - ExistingSCR - ExistingNo information - ExistingPrimary only - New
O07
O06
O02O01
O19O04
O18
O17
O16
O15O14
O13
O11
O10
O09 O08O05
O03O12
0
1
2
3
4
5
6
7
8
0 200 400 600 800 1000 1200 1400 1600 1800 2000
Capacity (MWth)
Em
issi
ons
(kg/
MW
h)
Primary only - ExistingSCR - ExistingNo information - ExistingPrimary only - New
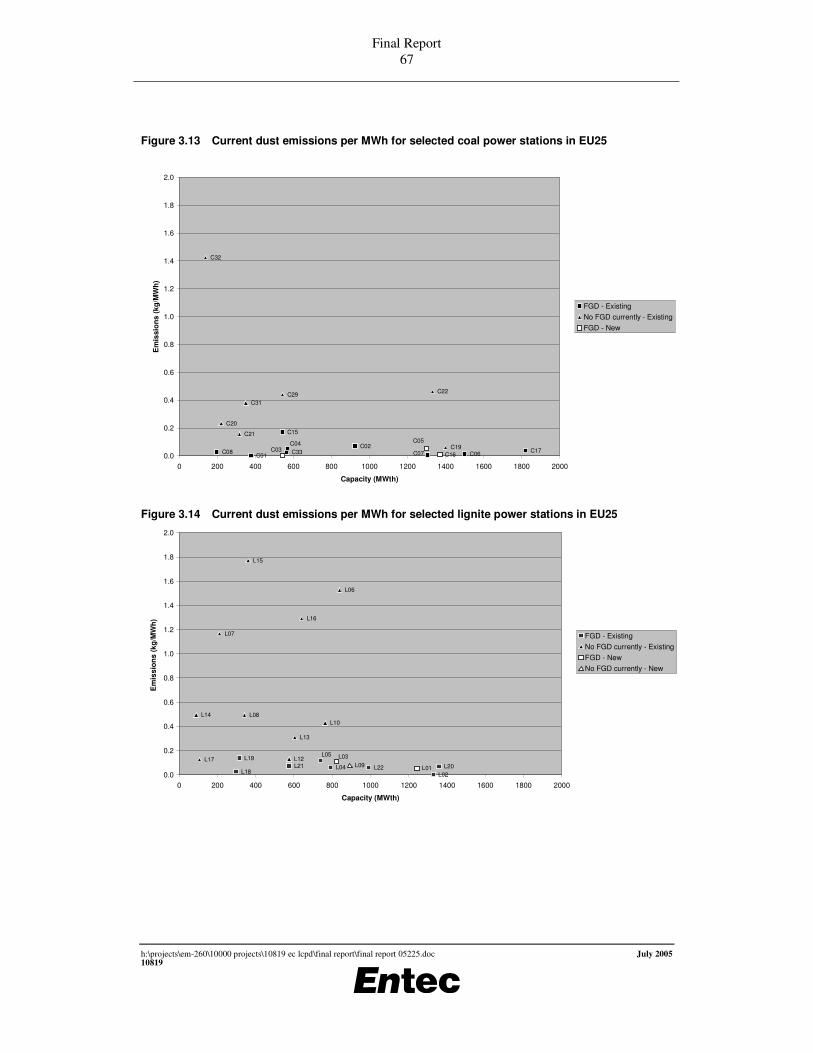
Final Report 67
h:\projects\em-260\10000 projects\10819 ec lcpd\final report\final report 05225.doc July 2005 10819
Figure 3.13 Current dust emissions per MWh for selected coal power stations in EU25
Figure 3.14 Current dust emissions per MWh for selected lignite power stations in EU25
C33 C17
C15
C08 C07 C06
C04 C02
C01
C32
C31C29 C22
C21
C20
C19C16
C05C03
0.0
0.2
0.4
0.6
0.8
1.0
1.2
1.4
1.6
1.8
2.0
0 200 400 600 800 1000 1200 1400 1600 1800 2000
Capacity (MWth)
Em
issi
ons
(kg/
MW
h)
FGD - ExistingNo FGD currently - ExistingFGD - New
L22L21 L20L19
L18
L05
L04L02
L17
L16
L15
L14
L13
L12
L10L08
L07
L06
L03
L01L09
0.0
0.2
0.4
0.6
0.8
1.0
1.2
1.4
1.6
1.8
2.0
0 200 400 600 800 1000 1200 1400 1600 1800 2000
Capacity (MWth)
Em
issi
ons
(kg/
MW
h)
FGD - ExistingNo FGD currently - ExistingFGD - NewNo FGD currently - New

Final Report 68
h:\projects\em-260\10000 projects\10819 ec lcpd\final report\final report 05225.doc July 2005 10819
Figure 3.15 Current dust emissions per MWh for selected oil power stations in EU25
A combined summary of LCP emissions data, including the data from this section is presented in Section 3.9.
3.7.2 Survey of gas turbine manufacturers For gas turbines, due to the greater homogeneity in technology and fuel types across the EU, information on emissions performance was sought from the key turbine manufacturers, via their EU industry association, EUnited Turbines.
Information was provided by 5 different EUnited Turbines member companies, with the findings presented in Tables 3.32 and 3.33 for land based gas turbines >50 MWth licensed before 27 November 2002 (ie excluded from scope of LCPD) and after 27 November 2002 respectively.
Table 3.32 Information for land based gas turbines >50MWth licensed before 27 November 2002
Typical range of NOx emissions of gas turbines in this category
(mg/Nm3, 15% O2, >70% load, daily average)
Typical range of efficiencies of gas turbines in this category
(Note 1)
Type of NOx control
Approx % (by MWe) of installed capacity in EU fitted with the indicated types of NOx control Natural gas Liquid fuels Single cycle -
efficiency (%) Combined cycle
- overall electrical
efficiency (%)
No controls 0 to 14 400 to 520 730 to 1040 30 to 36 (70% load)
N/A
Steam injection 0 to 2 (oil or mixed fuelled)
No data <85 N/A N/A
Water injection 2.5 to 28 (oil or mixed fuelled);
50 to 150 <85 to 200 30 to 38 53 to 58
O19O04
O18
O17O16
O13
O11O10
O09
O05
O03
O02
O01
O12
0.0
0.2
0.4
0.6
0.8
1.0
1.2
1.4
1.6
1.8
2.0
0 200 400 600 800 1000 1200 1400 1600 1800 2000
Capacity (MWth)
Em
issi
ons
(kg/
MW
h)
FGD - ExistingNo FGD currently - ExistingNo FGD currently - New
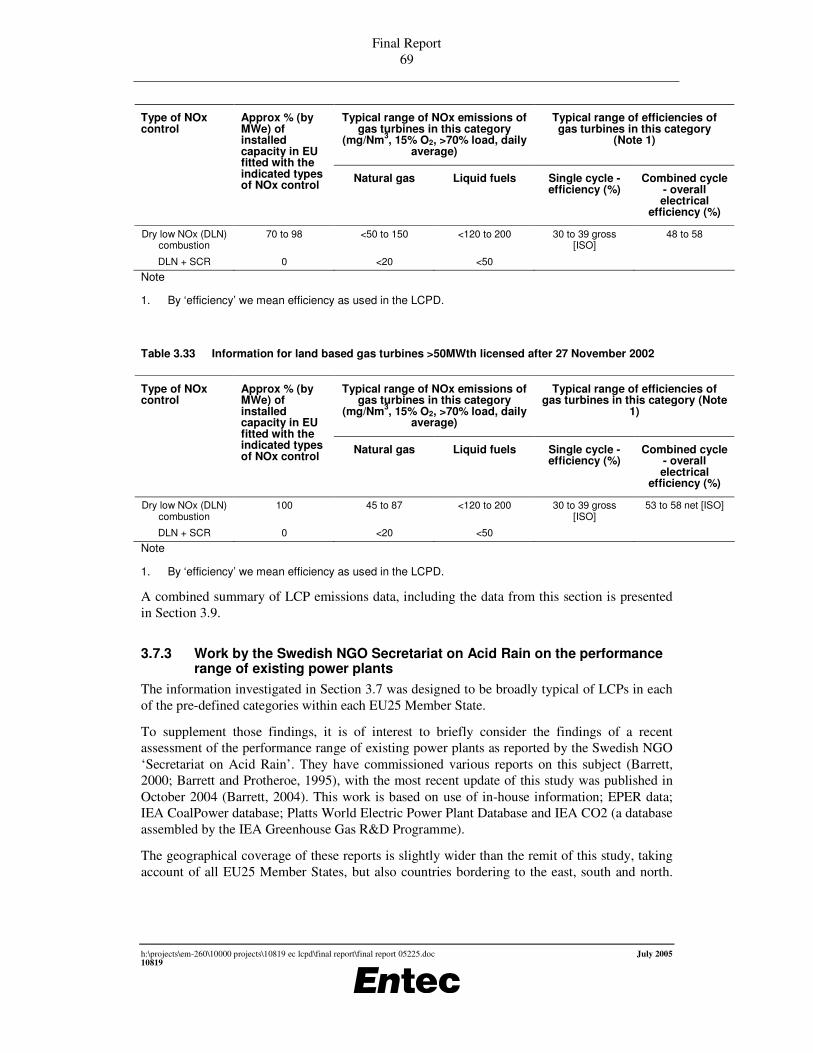
Final Report 69
h:\projects\em-260\10000 projects\10819 ec lcpd\final report\final report 05225.doc July 2005 10819
Typical range of NOx emissions of gas turbines in this category
(mg/Nm3, 15% O2, >70% load, daily average)
Typical range of efficiencies of gas turbines in this category
(Note 1)
Type of NOx control
Approx % (by MWe) of installed capacity in EU fitted with the indicated types of NOx control Natural gas Liquid fuels Single cycle -
efficiency (%) Combined cycle
- overall electrical
efficiency (%)
Dry low NOx (DLN) combustion
70 to 98 <50 to 150 <120 to 200 30 to 39 gross [ISO]
48 to 58
DLN + SCR 0 <20 <50
Note
1. By ‘efficiency’ we mean efficiency as used in the LCPD.
Table 3.33 Information for land based gas turbines >50MWth licensed after 27 November 2002
Typical range of NOx emissions of gas turbines in this category
(mg/Nm3, 15% O2, >70% load, daily average)
Typical range of efficiencies of gas turbines in this category (Note
1)
Type of NOx control
Approx % (by MWe) of installed capacity in EU fitted with the indicated types of NOx control Natural gas Liquid fuels Single cycle -
efficiency (%) Combined cycle
- overall electrical
efficiency (%)
Dry low NOx (DLN) combustion
100 45 to 87 <120 to 200 30 to 39 gross [ISO]
53 to 58 net [ISO]
DLN + SCR 0 <20 <50
Note
1. By ‘efficiency’ we mean efficiency as used in the LCPD.
A combined summary of LCP emissions data, including the data from this section is presented in Section 3.9.
3.7.3 Work by the Swedish NGO Secretariat on Acid Rain on the performance range of existing power plants
The information investigated in Section 3.7 was designed to be broadly typical of LCPs in each of the pre-defined categories within each EU25 Member State.
To supplement those findings, it is of interest to briefly consider the findings of a recent assessment of the performance range of existing power plants as reported by the Swedish NGO ‘Secretariat on Acid Rain’. They have commissioned various reports on this subject (Barrett, 2000; Barrett and Protheroe, 1995), with the most recent update of this study was published in October 2004 (Barrett, 2004). This work is based on use of in-house information; EPER data; IEA CoalPower database; Platts World Electric Power Plant Database and IEA CO2 (a database assembled by the IEA Greenhouse Gas R&D Programme).
The geographical coverage of these reports is slightly wider than the remit of this study, taking account of all EU25 Member States, but also countries bordering to the east, south and north.

Final Report 70
h:\projects\em-260\10000 projects\10819 ec lcpd\final report\final report 05225.doc July 2005 10819
Furthermore, the studies consider SO2 emissions from all large point sources, not specifically from LCPs.
The 2004 report found that whilst emissions from ‘large point sources’ have declined markedly over the last decade, the largest 100 sources of SO2 account for 43% of total SO2 emissions from all land based sources in 2001. Of these 100, 89 are power stations, of which 70 are coal-fired, 11 are oil-fired and two Estonian plants are fuelled by oil shale. Furthermore, it was found that 90% of SO2 emissions from the largest coal-fired plants are from ‘existing’ (pre July 1987) plants.
Clearly, however, there are expected to be significant reductions in emissions for many of these plants once they are required to comply with the emission limit values (or a national plan approach) of the LCPD, as well as complying with BAT under the IPPC Directive.
The report also ranked the ‘best’ plants according to their combined emission of SO2 and NOX in relation to their output of ‘useful’ energy (electricity and/or heat). Under this analysis, the most environmentally efficient plants are generally those fired by natural gas, followed by oil- and then coal-fired plants. However, it is noted that emission control techniques, such as FGD do have an impact on the rankings, with most of the ‘best’ plants found in Germany, but also with some in Austria, Denmark and the Netherlands.
3.8 Other data This section presents other data to support the consideration of the projected emissions from LCPs, including information on particle size distribution and heavy metal emission projections.
3.8.1 Particle size distribution
Introduction The type of combustion process used has a considerable effect on the proportion of ash entrained in the flue gas emissions from boilers. For example, moving grate boilers (relevant to smaller coal fired boilers such as in district heating plants) produce a relatively small amount of fly ash (20 to 40% of total ash), whereas pulverised coal boilers (most common type for electricity generation) produce an appreciable amount (80 to 90%). The combustion of liquid fuels is also a source of particulate emissions, although to a lesser extent than coal. The combustion of natural gas is not a significant source of dust emissions.
Environmental problems can occur particularly from particles less than 2.5µm (PM2.5) in diameter because they can remain suspended in the atmosphere for days or even weeks; are associated with proportionately higher levels of trace metals etc due to their greater surface area8; and are more easily respirable. Particles larger than 10µm in diameter settle fairly rapidly, with their impact being near the source (European Commission, 2004a).
8 For example, one gram of 0.1µm particles has a surface area of 60 square metres, 10 times the surface area of a gram of 1.0µm particles (IEA, 2003).

Final Report 71
h:\projects\em-260\10000 projects\10819 ec lcpd\final report\final report 05225.doc July 2005 10819
Typical particle size ranges Particle size distribution can vary widely between different types of fuel, combustion process, combustion temperature etc. However, a relatively limited number of studies have so far been carried out investigating the size distribution of particulate matter emitted from LCPs.
Furthermore, in relation to the particle size distribution of LCP emissions, this study is most concerned with the size distribution after the impact of any abatement measures that are fitted, or are planned to be fitted under business as usual policy commitments.
The emissions estimates from the RAINS modelling show absolute emissions of both PM10 and PM2.5 from the EU25 public power sector, taking into account assumptions on the particulate abatement efficiency of various techniques as shown in Table 3.34.
Table 3.34 Particulate abatement efficiency for existing hard coal and lignite power stations
Fuel Abatement technique PM10 abatement efficiency (%)
PM2.5 abatement efficiency (%)
Hard coal ESP1 (1 field) 94.2 93.0
ESP2 (2 fields) 97.9 96.0
ESP3+ (more than 2 fields)
99.6 99.0
FF 99.7 99.0
Brown coal / lignite ESP1 (1 field) 94.2 93.0
ESP2 (2 fields) 97.9 96.0
ESP3+ (more than 2 fields)
99.6 99.0
FF 99.6 99.0
Heavy fuel oil FF 99.3 99.0 Source: RAINS WEB (November 2004)
According to a provisional draft of information from EGTEI (2004) the impact of different levels of particulate abatement on residual concentrations and particle size fractions is as shown in Table 3.35.
Table 3.35 Impact of different levels of particulate abatement on residual concentrations and size fractions
Fuel type Type of particulate abatement
Achieved PM concentration
(mg/Nm3)
Size fraction of PM10 in TSP (%)
Size fraction of PM2.5 in TSP (%)
Hard coal Before deduster ND 23 12
‘Deduster 1’ 300 40 15
‘Deduster 2’ 100 65 40
‘Deduster 3’ 45 75 50
‘Deduster 4’ 20 90 60
Brown coal / lignite Before deduster ND 32 10
‘Deduster 1’ 300 45 17
‘Deduster 2’ 100 70 45
‘Deduster 3’ 45 80 50
‘Deduster 4’ 20 90 60
Heavy fuel oil Before deduster ND 85 60
‘Deduster 1’ 10 98 95

Final Report 72
h:\projects\em-260\10000 projects\10819 ec lcpd\final report\final report 05225.doc July 2005 10819
Source: EGTEI 2004. The specific meaning of the different deduster types is not clear from the source document.
It is clear from Tables 3.12 to 3.14 that there is expected to be significant uptake of FGD for coal and lignite plants in the public power sector, principally as a result of the requirements of the LCPD and IPPCD. According to the Draft LCPD BREF document (EC, 2004a), wet FGD can reduce PM emissions by more than 50% depending on particle size.
EGTEI assumes (IIASA, 2004a) that application of FGD allows the achievement of the same PM reduction efficiencies as in ‘Deduster 4’. The RAINS model does not assume that FGD has an impact on PM emissions, however, FGD is usually combined with high efficiency PM controls (ESP3 or FF in RAINS), which results in similar emissions as in the EGTEI estimate, especially for PM2.5 (IIASA, 2004). According to EGTEI (2004), the achieved PM concentration for ESP3 levels in the RAINS model is 37mg/Nm3, compared with 20mg/Nm3 for EGTEI’s Deduster 4 levels and 45mg/Nm3 for Deduster 3 levels. For the purposes of this study, a typical PM emission concentration following ESP and FGD is assumed to be 25mg/Nm3 or below.
Table 3.36 below, presents a similar type of data collected from members of EURELECTRIC and VGB showing the proportion of PM2.5 and PM10 in emissions from plants fitted with different abatement technologies.
Table 3.36 Proportion (%) of PM2.5 and PM10 in emissions from LCPs with or without abatement technology (members of EURELECTRIC and VGB)
Fuel type Type of particulate abatement Proportion of PM10 in
PM emissions
Proportion of PM2.5 in
PM emissions
Hard coal No emission control 40 17
ESP or FF; or dry FGD; or spray dry FGD with additional ESP or FF 80 35
ESP or FF and wet FGD 95 60
Lignite No emission control 38 33
ESP or FF; or dry FGD; or spray dry FGD with additional ESP or FF 75 65
ESP or FF and wet FGD 98 90
Peat No emission control 40 20
ESP or FF; or dry FGD; or spray dry FGD with additional ESP or FF 80 40
ESP or FF and wet FGD 95 60
Biomass No emission control 40 20
ESP or FF; or dry FGD; or spray dry FGD with additional ESP or FF 80 40
ESP or FF and wet FGD 95 60
Fuel oil No emission control 43 35
ESP or FF; or dry FGD; or spray dry FGD with additional ESP or FF 85 70
ESP or FF and wet FGD 90 85
Natural gas Any of the above 100 100
Industr. Gas Any of the above 100 100
Source: EURELECTRIC/VGB (2004)

Final Report 73
h:\projects\em-260\10000 projects\10819 ec lcpd\final report\final report 05225.doc July 2005 10819
On the basis of the above data, for power plants fitted with wet FGD, the above estimates would indicate that the size fractions in TSP would be:
• 90 to 95% PM10 and 60% PM2.5 for hard coal;
• 90 to 98% PM10 and 60 to 90% PM2.5 for lignite;
• 90 to 98% PM10 and 85 to 95% PM2.5 for heavy fuel oil.
Therefore, overall PM emissions from such plants mainly comprise the size fraction of most concern to health, ie PM2.5, however the achieved PM concentration is low, in the region of 25mg/m3 or lower for coal and lignite plants. Furthermore, the abatement efficiency for this size fraction is expected to be high, at in the region of 99%.
The Draft LCP BREF (EC, 2004a) also reports that the main mass emission for modern ESPs with low emissions (eg 10 to 15mg/Nm3) is well below 2.5µm. This document describes the difference between the emission caused by rapping and that by general re-entrainment (or ash that has not been precipitated at all). Rapping losses occur in the form of agglomerates and have coarser particle sizes. In order to control eg PM2.5, the ESP must be sized for an emission close to what is allowed for PM2.5. It is not possible to vary any ratio between fractional efficiencies for coarse and fine particulate in a practical way, ie lowering the amount of particles <2.5µm will also lower the amount of larger particles and vice versa.
Therefore, when considering the dominant types of LCPs contributing overall PM emissions, namely large coal, lignite and heavy fuel oil plants, any further reductions in PM2.5 emissions could be effectively achieved through tighter overall dust emission standards. This is because the same techniques would be applicable for both pollutants, and the majority of dust emitted from such plants following compliance with the LCPD is expected to be PM2.5.
The particle size of the PM from furnaces and boilers on heavy fuel oil is in the order of 1µm (European Commission, 2003c).
3.8.2 Projections of heavy metal emissions
Introduction From the investigations carried out for this study, readily available data does not appear to exist on heavy metal emission projections from the LCP sector.
Many heavy metals are associated with particulate matter, as such, measures focussed on particulate matter abatement will also be the most appropriate measures for abating those types of metals, as shown in Table 3.37. For example it is reported by the Finnish LCP WG (EC, 2004a) that with good particle removal, the concentrations of all heavy metals in emissions are typically below or around 1µg/Nm3.
However, the relatively high vapour pressure of mercury means that it will not be abated as effectively as particulate matter or other heavy metals in traditional abatement techniques. This is illustrated in Table 3.37 below.

Final Report 74
h:\projects\em-260\10000 projects\10819 ec lcpd\final report\final report 05225.doc July 2005 10819
Table 3.37 Abatement efficiency of metals by traditional abatement techniques for LCPs
Abatement efficiency (%) Source of data Type of metal Percentage removed in
boiler as bottom ash
Percentage abated in
ESP
Percentage abated in
wet scrubber
(FGD)
Percentage released to
atmosphere
EC, 2004a Group 1 metals (Al, Ca, Co, Cr, Fe, Mg, Mn, Ni, Si)
3.9 95.1 0.9 0.10
Group 2 metals (As, B, Be, Cd, Cu, Mo, Pb, Sb, Se, Zn, V)
1.7 96.8 1.4 0.07
Group 3 (Hg) 0.1 33.3 36.0 30.6
EC, 2004a As 97 – 98.7 0.5 – 1.0 0.3 – 2
Cd 95.2 – 97.6 0 – 1.1 2.4 – 3.6 (note 1)
Cr 97.9 – 99.9 0 – 0.9 0.1 – 0.5
Hg 72.5 – 82 0 – 16 5.1 – 13.6
Mn 98 – 99.8 0.1 – 1.7 0.1
Ni 98.4 – 99.8 0.2 – 1.4 0.1 – 0.4
Pb 97.2 – 99.9 0 – 0.8 0.1 – 1.8
V 98.4 – 99.0 0.9 – 1.3 0.2 – 0.3
Note
1. The emission of Cd was higher in these measurements than generally reported in the literature
Furthermore, key heavy metals, namely arsenic, cadmium and nickel are covered by the Fourth Air Quality Daughter Directive.
Therefore, there is greater potential concern associated with those metals that are less well abated by particulate abatement techniques due to their greater presence in the vapour phase. In particular, this relates to mercury, which is discussed in more detail in the next section.
Furthermore this analysis confirms that, with the main exception of mercury, dust emission standards can represent an effective proxy for the control of heavy metal emissions from LCPs. The use of dust emission standards in this way would also avoid the potential difficulties associated with direct heavy metal emission limit values, namely that there can be very significant variations in the heavy metals content of the same type of fuel, but from different mines or crude types. If specific heavy metal emission limit values were to be given further consideration, the associated economic and environmental impacts would require more detailed consideration.
In an indirect way, SO2 emission standards (dependent on whether FGD is selected as a measure) can also contribute to the further reduction of heavy metal emissions. It will be seen later that NOx emission standards (dependent on whether SCR is selected as a measure) can also contribute to the further reduction of mercury emissions.
Mercury emission projections According to the European Commission’s Consultation Document on the Development of an EU Mercury Strategy (2004b), coal combustion is the largest source of mercury emissions in the EU and globally. In particular, coal combustion in power plants >50MWth were estimated to emit the largest share of overall mercury emissions, with emissions of 38tpa in 2000 (for EU25

Final Report 75
h:\projects\em-260\10000 projects\10819 ec lcpd\final report\final report 05225.doc July 2005 10819
+ other European countries), compared with total emissions of 144tpa. The next highest contributor to total mercury emissions was coal combustion in power plants <50MW and district heat (European Commission, 2004b).
As such, this section focuses on the development of indicative emission projections for mercury from the LCP sector, under business as usual policy commitments.
The basis for the projections are the estimated emissions in 2000 of mercury from coal combustion in power plants >50MWth.
Key assumptions include:
• The changes in activity rate are as indicated in the EC report on energy and transport trends to 2030 (European Commission, 2003a).
• On average roughly 50% of mercury is removed in an ESP (Meij and Winkel, 2004 and Eurelectric 2004), a technology that is assumed to be already applied in the 2000 base year;
• On average roughly 50% of the remainder is removed in the FGD (Meij and Winkel, 2004 and Eurelectric 2004);
• If high dust SCR is present (which is the most common type of SCR for coal plants), the total removal (by ESP, FGD and SCR) is 90% (Meij and Winkel, 2004 and Eurelectric 2004);
• The uptake of additional abatement measures under the business as usual scenario is in line with the RAINS capacity controlled estimates.
On the basis of these assumptions, the projected mercury emissions from coal fired power plants are as shown in Table 3.38.
Table 3.38 Mercury emission projections from combustion installations (>50MWth) (tonnes)
Country 1995 2000 2005 2010 2015 2020 2002 All Sources
EU-15 Austria 0.4 0.1 0.1 0.1 0.1 0.1 0.9
Belgium 1.7 1.1 0.5 0.1 0.2 0.2 3
Denmark 0.7 0.6 0.5 0.5 0.3 0.1 1.2
Finland 0.1 0.1 0.1 0.1 0.1 0.0 0.7
France 1.5 2.1 1.9 1.5 2.2 1.2 11.7
Germany 5.7 5.2 4.7 4.3 4.4 4.4 27.7
Greece 0.7 0.7 0.8 0.5 0.5 0.2 13
Ireland 0.2 0.2 0.2 0.1 0.1 0.0 1.5
Italy 0.5 0.5 0.4 0.4 0.4 0.5 10
Luxembourg 0.1 0.1 0.1 0.1 0.1 0.0 0.3
Netherlands
Portugal 0.2 0.2 0.2 0.1 0.1 0.0 0.2
Spain 2.6 5.4 3.3 1.5 1.5 0.5 24.6
Sweden 0.1 0.1 0.2 0.2 0.4 0.8 0.7
UK 7.8 3.4 2.2 1.2 1.3 0.5 8
Sub-total 22 20 15 11 12 9 104

Final Report 76
h:\projects\em-260\10000 projects\10819 ec lcpd\final report\final report 05225.doc July 2005 10819
Country 1995 2000 2005 2010 2015 2020 2002 All Sources
ACC-10 Cyprus
Czech Republic
7.0 1.7 1.2 0.8 0.7 0.3 2.8
Estonia
Hungary 1.6 1.0 1.2 1.0 1.2 0.5 4
Latvia
Lithuania
Malta
Poland 20.6 10.2 10.0 9.6 9.8 4.0 23.2
Slovakia 0.8 1.1 1.4 1.8 2.2 1.0 3.1
Slovenia 0.4 0.3 0.2 0.2 0.2 0.1 0.6
Sub-total 30 14 14 13 14 6 34
EU-25 Total 53 34 29 24 26 15 137
% of 2000 emissions from power plants
- - 85% 71% 75% 43% -
% of current emissions from all sources
38% 25% 21% 18% 19% 11% 100%
Source: 1995 and 2000 data taken from EC Mercury Strategy Consultation Document (2004b)
Source: Current total emissions data taken from data submitted by Member States to the UNECE.
Source: Current emissions from EC Consultation Document - Development of an EU Mercury Strategy, March 2004.
Table 3.38 shows that whilst emissions of mercury in 2000 from coal fired power plants >50MWth represented approximately 25% of overall mercury emissions from all sources in 2002, the proportion of emissions to overall 2002 emissions from all sources is estimated to fall to 18% in 2010 and 11% in 2020.
3.9 Summary of emissions data A brief summary of key points from this section is presented in the sub-sections below. For more details, it is recommended to refer to the detailed information earlier in this section.
3.9.1 Fuel types and trends • According to projections developed for the European Commission (EC, 2003),
increasing requirements for electricity and steam are expected to lead to a large expansion of installed capacity in the EU25 energy system, which is projected to almost double by 2030 from 2000 levels.
• Gas is projected to be the main energy source for electricity production beyond 2010. Overall, gas based electricity is predicted to grow from 16% of power generation in 2000 to 36% in 2030.
• Solid fuels are predicted exhibit a continuous decline as an energy source for electricity production in the short / medium term, but later recover as a replacement fuel for nuclear both in absolute terms and as a share of total electricity generated. Overall the solid fuel share reduces from 32% in 2000 to 27% in 2030. Hard coal is

Final Report 77
h:\projects\em-260\10000 projects\10819 ec lcpd\final report\final report 05225.doc July 2005 10819
projected to make a strong comeback in the long run, whereas this is not the case for lignite.
• Oil is becoming a more limited form for electricity production as many of the existing oil fired plants are kept only as part of the required reserve margin.
3.9.2 Emissions data sources • A key source of current emissions data for LCPs is given in the emissions
inventories submitted by Member States (so far only EU15) under the requirements of the LCPD.
• Future (2010) emissions projections by Member States are incorporated in their projections developed to meet the requirements of the NECD, however the data is usually aggregated within national totals hence the specific contributions from LCPs are not clear.
• The RAINS web model, which is being used to support the Commission’s CAFE programme, provides an important source of data with which to investigate projections of emissions for the LCP sector at an EU25 level. The main RAINS scenario referred to in this study is the ‘CP_CLE’ scenario, as agreed with the Commission. It has been selected because it provides data for each EU25 Member State, it incorporates assumptions on current legislative controls and climate measures, and its use will enable consistency with other studies undertaken for the Commission.
• The CP_CLE scenario uses energy projections developed from the PRIMES model. An equivalent scenario which also accounts for current legislative controls and climate measures has been developed which, instead of using PRIMES-based energy projections, uses national energy projections. This ‘NAT’ scenario is only currently available for 10 Member States, but a comparison with the ‘CP_CLE’ scenario reveals significantly higher emissions for the public power sector under the ‘NAT’ scenario compared to the ‘CP_CLE’ scenario for many countries. Due to the significant differences between these scenarios for the public power sector, it is therefore recommended that national energy projections are taken into account when informing future policy developments affecting the LCP sector.
• It should be noted that the RAINS model does not have a specific sector for LCPs, with the best match given by the ‘Public Power’ (PP) sector. Overall this is thought to underestimate the emissions from the LCP sector because it excludes industrial boilers and process heaters (that are incorporated within various other sectors in the model), although this is counteracted to some extent by the inclusion of plants <50MWth (ie not LCPs) within the PP sector. The match between LCPs is further complicated by the different definitions of ‘existing’ and ‘new’ plants between RAINS (based on PRIMES inputs with a cut-off year of 1995) and the LCPD (cut-off date of 1 July 1987).
• The capacity controlled data within the RAINS model is a significant variable affecting overall emissions and consultations between IIASA and Member States have sought to review and, where necessary, correct this and other key data within the model. However, due to the significance of these assumptions within the model,
Final Report 78
h:\projects\em-260\10000 projects\10819 ec lcpd\final report\final report 05225.doc July 2005 10819
it is recommended that if using the RAINS model to inform policy developments affecting the LCP sector, then positive confirmation is gained from Member States that the assumptions within the model represent best available data. For example, some general observations on the data include higher than expected levels of future uptake of SCR for coal, lignite and gas plants, which may lead to an underestimation in NOx emission projections, together with potentially high levels of uptake for FGD in some cases, which may lead to an underestimation in SO2 emission projections.
• The European Pollutant Emissions Register (EPER) provides an additional source of data on emissions from LCPs. However, this data is likely to represent an underestimation because emissions from LCPs at some sites (eg petroleum refineries) are reported under separate sectors and the data is dependent on the completeness of reporting for each site. As such, the EPER emissions data is only used in this study when more robust data is not available.
• To supplement the abovementioned sources, Entec has gathered extensive data at a plant level on emissions, activity levels, fuel types and abatement techniques for LCPs. This covers a large number of EU25 member states and focuses on the dominant LCP sector, namely the electricity supply industry. In particular, for each Member State information was sought on a representative plant in each of a number of categories (based on size, age and abatement levels), with plants considered as representative within a particular category where the capacity, activity rate (load factor) and level of emission control was broadly typical of the category as a whole.
3.9.3 SO2 emissions • According to the emission inventories submitted under the LCPD, total current SO2
emissions from LCPs in EU15 are in the region of 3600kt.
• Within this total, the majority is from plants >500MWth (71%), with 11% from 300-500MWth plants, 9% from 50-300MWth plants and 11% from petroleum refineries. However the proportionately tighter requirements in the LCPD on larger plants is expected to increase the relative contribution from smaller plants and petroleum refineries in the future.
• An examination of SO2 (and NOx) emissions from LCPs at petroleum refineries reveals significant differences in emissions per unit throughput across EU15 (8% to 340% for SO2, based on an average of 100%, with a smaller variation for NOx). However, due to the influence of other factors it is not possible to draw any clear conclusions from this.
• According to the RAINS CP_CLE scenario, SO2 emissions from public power plants are estimated to decline between 2000 and 2020 both in absolute terms (5015kt to 606kt) and relative terms in comparison to emissions from all RAINS sources (57% to 22%).
• Within the public power sector, the fuel types contributing greatest SO2 emissions by 2020 are hard coal (39% of emissions from public power) and lignite (33%).
• The RAINS model estimates that the average level of sulphur in hard coal is 1.2% in EU25, and the average for lignite is 1.1%. However, the lower calorific value of
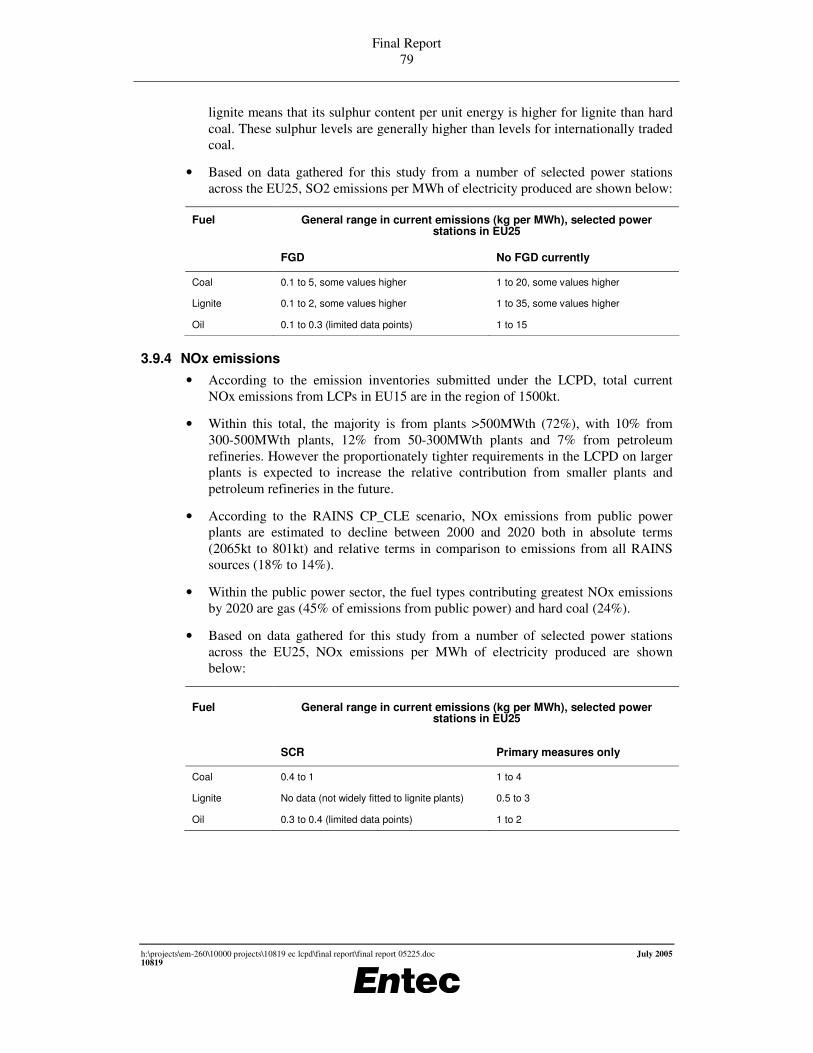
Final Report 79
h:\projects\em-260\10000 projects\10819 ec lcpd\final report\final report 05225.doc July 2005 10819
lignite means that its sulphur content per unit energy is higher for lignite than hard coal. These sulphur levels are generally higher than levels for internationally traded coal.
• Based on data gathered for this study from a number of selected power stations across the EU25, SO2 emissions per MWh of electricity produced are shown below:
Fuel General range in current emissions (kg per MWh), selected power stations in EU25
FGD No FGD currently
Coal 0.1 to 5, some values higher 1 to 20, some values higher
Lignite 0.1 to 2, some values higher 1 to 35, some values higher
Oil 0.1 to 0.3 (limited data points) 1 to 15
3.9.4 NOx emissions • According to the emission inventories submitted under the LCPD, total current
NOx emissions from LCPs in EU15 are in the region of 1500kt.
• Within this total, the majority is from plants >500MWth (72%), with 10% from 300-500MWth plants, 12% from 50-300MWth plants and 7% from petroleum refineries. However the proportionately tighter requirements in the LCPD on larger plants is expected to increase the relative contribution from smaller plants and petroleum refineries in the future.
• According to the RAINS CP_CLE scenario, NOx emissions from public power plants are estimated to decline between 2000 and 2020 both in absolute terms (2065kt to 801kt) and relative terms in comparison to emissions from all RAINS sources (18% to 14%).
• Within the public power sector, the fuel types contributing greatest NOx emissions by 2020 are gas (45% of emissions from public power) and hard coal (24%).
• Based on data gathered for this study from a number of selected power stations across the EU25, NOx emissions per MWh of electricity produced are shown below:
Fuel General range in current emissions (kg per MWh), selected power stations in EU25
SCR Primary measures only
Coal 0.4 to 1 1 to 4
Lignite No data (not widely fitted to lignite plants) 0.5 to 3
Oil 0.3 to 0.4 (limited data points) 1 to 2

Final Report 80
h:\projects\em-260\10000 projects\10819 ec lcpd\final report\final report 05225.doc July 2005 10819
3.9.5 Dust and PM emissions • Of the particle size fractions, PM2.5 is of most concern because it is associated with
proportionately higher levels of trace metals and is more easily respirable than larger particle sizes.
• According to the RAINS CP_CLE scenario, PM emissions from public power plants are estimated to decline between 2000 and 2020 both in absolute terms (249kt to 85kt for PM10 and 148 to 55 for PM2.5) and relative terms in comparison to emissions from all RAINS sources (10% to 6% for PM10 and 9% to 6% for PM2.5).
• Within the public power sector, the fuel types contributing greatest PM10 and PM2.5 emissions by 2020 are hard coal (47% of PM10 emissions from public power and 44% of PM2.5 emissions) and lignite (40% of PM10 and PM2.5).
• Based on data gathered for this study from a number of selected power stations across the EU25, dust emissions per MWh of electricity produced are shown below:
Fuel General range in current emissions (kg per MWh), selected power stations in EU25
FGD No FGD currently
Coal 0.01 to 0.2 0.1 to 0.5
Lignite 0.01 to 0.2 0.1 to 2
Oil 0.02 (limited data) 0.01 to 1
• For dominant LCP sources of PM, namely large coal and lignite power stations, according to the RAINS model, a large proportion of plants are assumed to be fitted with more than 2 ESP fields which are assumed to achieve 99.0% abatement of PM2.5 (and 99.6% abatement of PM10).
• Of the PM that is emitted the majority is expected to be PM2.5. As it is not generally possible to vary any ratio between fractional abatement efficiencies for coarse and fine PM in a practical way in ESPs (the dominant PM abatement technique by far in the power sector), lowering the amount of overall PM will also lower the amount of PM2.5. Therefore, the requirement for any further reductions in PM2.5 emissions from such power stations may effectively be achieved through tighter overall dust emission standards.
3.9.6 Heavy metal emissions • Heavy metals in coal and lignite are normally several orders of magnitude higher
than in oil (except occasionally for nickel and vanadium in heavy fuel oil) or natural gas.
• There can be significant variations in the concentration of mercury and other heavy metals in coal and lignite between different countries and between different mines within the same country.

Final Report 81
h:\projects\em-260\10000 projects\10819 ec lcpd\final report\final report 05225.doc July 2005 10819
• Key heavy metals in LCP emissions, with the exception of mercury, are associated with particulate matter. As such, measures focussed on particulate matter abatement will also be the most appropriate measures for abating those types of metals, and can achieve high levels of abatement (generally over 99% abatement is possible with ESPs and FGD). For these metals, dust emission standards can represent an effective proxy for the control of such metal emissions from LCPs. The use of dust emission standards in this way would also avoid the potential difficulties associated with direct heavy metal emission limit values, namely that there can be very significant variations in the heavy metals content of the same type of fuel, but from different mines or crude types.
• For mercury, however, its relatively high vapour pressure means that it will not be abated as effectively as particulate matter or other heavy metals in traditional particulate abatement techniques. However, the combination of ESPs (or fabric filters) with FGD and SCR (‘high dust’ type) is claimed by recent research to achieve an approximate 90% overall abatement of mercury for coal power stations. Combining the results of this research with emissions data from the EC’s Mercury Strategy Consultation Document and capacity controlled data from the RAINS model, indicates that mercury emissions from LCPs will represent a declining proportion of 2002 baseline emissions from all sources (reducing from 25% in 2000 to approximately 11% in 2020).
3.10 References Ågren, C. (2004) Introduction in Barrett, M. (2004) Atmospheric emissions from large point sources in Europe. Report for the Swedish NGO Secretariat on Acid Rain. Published online at: http://www.acidrain.org/publications.htm. Accessed November 2004.
Barrett, M. (2004) Atmospheric emissions from large point sources in Europe. Report for the Swedish NGO Secretariat on Acid Rain. Published online at: http://www.acidrain.org/publications.htm. Accessed November 2004.
Barrett, M. (2000) The worst and the best: Atmospheric emissions from large point sources in Europe. Report for the Swedish NGO Secretariat on Acid Rain. Published online at: http://www.acidrain.org/publications.htm. Accessed March 2004.
Barrett M. and Protheroe, R. (1995) Sulphur Emission from Large Point Sources in Europe. Report for the Swedish NGO Secretariat on Acid Rain. Published online at: http://www.acidrain.org/publications.htm. Accessed March 2004.
Concawe, 1999. Best available techniques to reduce emissions from refineries, Concawe report no. 99/01, 1999.
Concawe, 2000. Telephone conversations and communications with Entec, extracts of Concawe Report Nickel in oil products and ambient air (Draft, unpublished), 2000.
CONCAWE (2002): Sulphur dioxide emissions from oil refineries and combustion of oil products in Western Europe and Hungary (1998). Report number 10/02 prepared by the CONCAWE Air Quality Management Group Task Force on Refinery Sulphur Survey (AQ/STF 51), December 2002.

Final Report 82
h:\projects\em-260\10000 projects\10819 ec lcpd\final report\final report 05225.doc July 2005 10819
DTI (2001) Annex A, Digest of United Kingdom Energy Statistics 2001, DTI; Table 3.1, Paper CCA10, DEFRA. Accessible online at: remas.ewindows.eu.org/REMAS/downloads/ energy_convert.xls. Accessed April 2004.
EGTEI (2004). Draft background document on combustion sector. Part 1: plants greater than 500MWth. October 2004.
Energoprojekt, 2004. Report for Entec UK to support the study on the preparation of the review of the LCPD. October 2004.
Entec, 1999. The determination of the costs and benefits for England and Wales of transposing European Directive 1999/32/EC on the sulphur content of certain liquid fuels into domestic legislation, Report for DETR, Entec UK Ltd. (2000).
Environment Agency (EA) (2000) IPC Guidance Note: Combustion Processes. S3 1.01. November 2000.
ESB (2005). Comments received from the Electricity Supply Board (ESB), Ireland, on the Draft Final Report, June 2005.
Eurelectric (2003) Statistics and prospects for the European electricity sector: 1980-1990, 2000-2020. EURPROG Network of Experts. July 2003. 2003-542-0005.
Eurelectric (2004). Eurelectric comments on the EC consultation document “Development of the EU Mercury Strategy”, May 2004.
European Commission (EC) (2000). Guidance document for EPER implementation. According to Article 3 of the Commission Decision of 17 July 2000 (2000/479/EC) on the implementation of an European Pollutant Emission Register (EPER) according to Article 15 of Council Directive 86/61/EC concerning Integrated Pollution Prevention and Control (IPPC). November 2000.
European Commission (2003a). European energy and transport trends to 2030. January 2003.
European Commission (2003b). Particulate matter emissions from large combustion plants - A short overview of measurement methods. Report by Gioppo F., Dilara P., Krasenbrink A. and De Santi G.F. from the Joint Research Centre of the European Commission, 2003.
European Commission (2003c). Integrated Pollution Prevention and Control (IPPC) Reference Document on Best Available Techniques for Mineral Oil and Gas Refineries, dated February 2003
EEuropean Commission (2004a). Draft Reference Document on Best Available Techniques for Large Combustion Plants. Draft November 2004.
European Commission (2004b). Development of an EU Mercury Strategy. Consultation Document. 15 March 2004.
Federal Environmental Agency Germany, 2002. Exemplary investigation into the state of practical realisation of integrated environmental protection with regard to large combustion plants in Germany. Report by French-German Institute for Environmental Research, University of Karlsruhe. November 2004.
FOE (2005). Comments received from Friends of the Earth, the European Environmental Bureau and the Swedish NGO Secretariat on Acid Rain on the Draft Final Report, July 2005.

Final Report 83
h:\projects\em-260\10000 projects\10819 ec lcpd\final report\final report 05225.doc July 2005 10819
IIASA (2004) Information downloaded from the IIASA RAINSWEB. Available online at: www.iiasa.ac.at/web-apps/tap/RainsWeb/. Accessed October 2004.
IIASA (2004a). Personnal communication.
IEA, 2003. Developments in particulate control. IEA Clean Coal Centre. 2003.
Jones, 1988. Jones, P., Petroleum Review, 39-42, June 1988.
Maguhn J., Zimmerman R., Karg E. and Kettrup A. (2000): On-line measurement of the particle-size distribution in the stack of a waste incineration plant. J. Aerosol Sci., Vol 31, Suppl. 1, 2000.
Meij and Winkel, 2004. Mercury emissions from coal fired power stations in the Netherlands: the current state of the art. Paper at the 7th International Conference on Mercury as a Global Pollutant, June 27 to July 2, 2004.
Moisio M., Laitinen A., Hautanen J. and Keskinen J. (1998): Fine particle size distributions of seven different combustion power plants. J. Aerosol Sci., Vol 29, Suppl. 1, 1998.
Secretariat on Acid Rain (2004) Personal Communication. 11th March 2004.
Swaine, 1990. Trace elements in coal. Butterworths, London.
Swaine, 1985. Modern methods in bituminous coal analysis. CRC Critical reviews in Analytical Chemistry. Volume 15, issue 4.
Querol, 1992. Trace elements in high-S subbituminous coals from the Teruel Mining District, NE Spain. Applied Geochemistry, Volume 7, 547-561.
UBA, 2005. UBA comments on the Draft Final Report, June 2005.
US EPA, 1998. Locating and Estimating air emissions from sources of arsenic and arsenic compounds. EPA-454/R-98-013, June 1998.
US EPA, 1997. Locating and Estimating air emissions from sources of mercury and mercury compounds. EPA-454/R-97-012, December 1997.
US EPA, 1993. Locating and Estimating air emissions from sources of cadmium and cadmium compounds. EPA-454/R-93-040, September 1993.
US EPA, 1984. Locating and Estimating air emissions from sources of nickel and nickel compounds. EPA-450/4-84-007f, March 1984.
Wehner B., Birmili W., Heintzenberg J. and Wiedensohler A. (1997): Measurement of particulate number-based emission characteristics of a coal-fired heating plant. J. Aerosol Sci., Vol 28, Suppl. 1, 1997.
Zimmermann R., Maguhn J. and Kettrup A. (2000): On-line analysis of combustion aerosols in the state of formation (900-300oC) at industrial incinerators. J. Aerosol Sci., Vol 31, Suppl. 1, 2000.
Final Report 84
h:\projects\em-260\10000 projects\10819 ec lcpd\final report\final report 05225.doc July 2005 10819
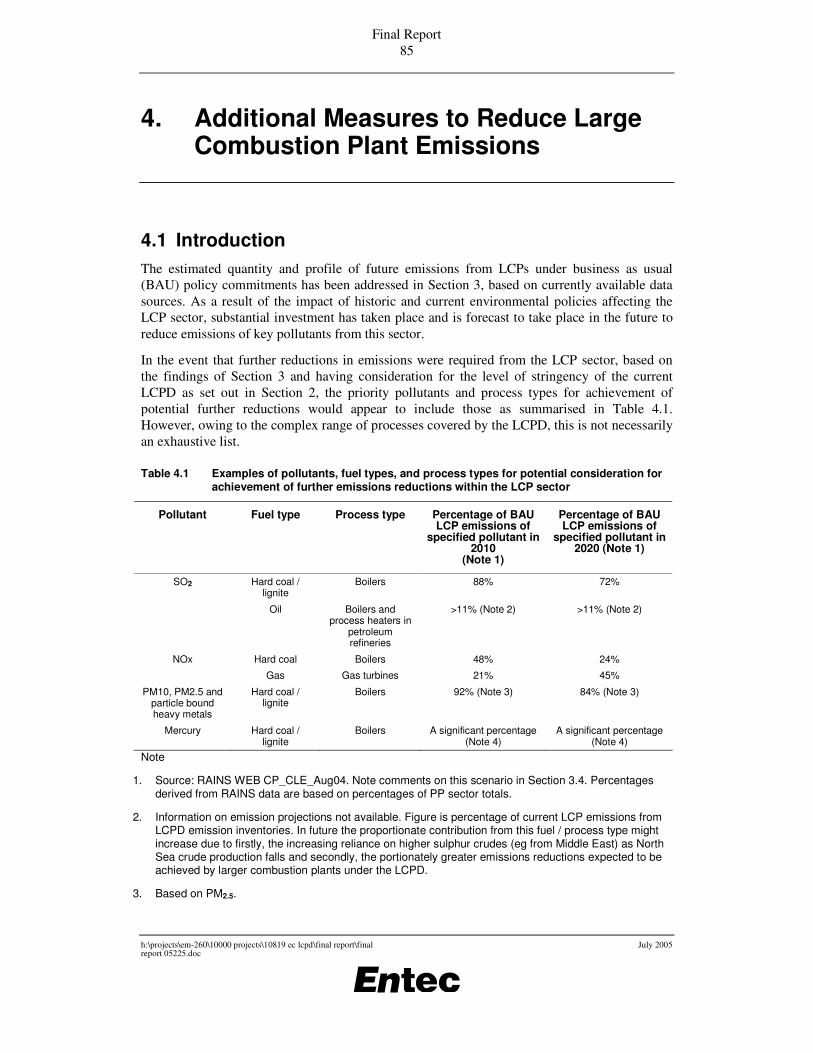
Final Report 85
h:\projects\em-260\10000 projects\10819 ec lcpd\final report\final report 05225.doc
July 2005
4. Additional Measures to Reduce Large Combustion Plant Emissions
4.1 Introduction The estimated quantity and profile of future emissions from LCPs under business as usual (BAU) policy commitments has been addressed in Section 3, based on currently available data sources. As a result of the impact of historic and current environmental policies affecting the LCP sector, substantial investment has taken place and is forecast to take place in the future to reduce emissions of key pollutants from this sector.
In the event that further reductions in emissions were required from the LCP sector, based on the findings of Section 3 and having consideration for the level of stringency of the current LCPD as set out in Section 2, the priority pollutants and process types for achievement of potential further reductions would appear to include those as summarised in Table 4.1. However, owing to the complex range of processes covered by the LCPD, this is not necessarily an exhaustive list.
Table 4.1 Examples of pollutants, fuel types, and process types for potential consideration for achievement of further emissions reductions within the LCP sector
Pollutant Fuel type Process type Percentage of BAU LCP emissions of
specified pollutant in 2010
(Note 1)
Percentage of BAU LCP emissions of
specified pollutant in 2020 (Note 1)
SO2 Hard coal / lignite
Boilers 88% 72%
Oil Boilers and process heaters in
petroleum refineries
>11% (Note 2) >11% (Note 2)
NOx Hard coal Boilers 48% 24%
Gas Gas turbines 21% 45%
PM10, PM2.5 and particle bound heavy metals
Hard coal / lignite
Boilers 92% (Note 3) 84% (Note 3)
Mercury Hard coal / lignite
Boilers A significant percentage (Note 4)
A significant percentage (Note 4)
Note
1. Source: RAINS WEB CP_CLE_Aug04. Note comments on this scenario in Section 3.4. Percentages derived from RAINS data are based on percentages of PP sector totals.
2. Information on emission projections not available. Figure is percentage of current LCP emissions from LCPD emission inventories. In future the proportionate contribution from this fuel / process type might increase due to firstly, the increasing reliance on higher sulphur crudes (eg from Middle East) as North Sea crude production falls and secondly, the portionately greater emissions reductions expected to be achieved by larger combustion plants under the LCPD.
3. Based on PM2.5.
Final Report 86
h:\projects\em-260\10000 projects\10819 ec lcpd\final report\final report 05225.doc
July 2005
4. Coal is by far the fuel that makes the most significant contribution to mercury emissions from the LCP sector.
On the basis of these potential priority fuel / process combinations, this section presents brief details of additional abatement measures that would be potentially suitable to reduce emissions further. As such, these represent techniques that would generally go beyond those potentially required to comply with the LCPD. However, due to significant planned investments by the LCP sector in abatement measures to comply with the LCPD (and also IPPCD), a more accurate assessment could be made of the potential for additional measures once the implications of the LCPD and IPPCD on the LCP sector are known with greater certainty.
It should be stressed that due to the current uncertainty in what the application of the IPPC Directive based on ‘best available techniques’ (BAT) might mean at a site specific level for LCPs across the EU, it is not possible to comment on how the additional techniques in the following section might compare to BAT. The general concept of BAT is presented separately earlier in this report.
4.2 Additional measures for SO2
4.2.1 Existing coal / lignite boilers
Introduction According to data from the LCPD emission inventories, over 70% of current emissions from the LCP sector are from plants over 500MWth that will be covered by the most stringent SO2 ELV in the LCPD for existing plants of 400mg/Nm3. A further 11% fall within the 300 to 500MWth size band that will require intermediate levels of ELV stringency. As such, a large proportion of these plants that are not already fitted with FGD are expected to be fitted with FGD in order to comply with the relevant LCPD ELVs.
This is supported by the estimations in the RAINS Web model that predict that by 2010, 100% of hard coal fired capacity in the public power sector will be controlled by FGD in 8 EU25 Member States; and over 70% in a further 9 Member States.
The majority of large coal and lignite LCPs that are not planned to be fitted with FGD under BAU policy commitments are likely to opt for the limited life derogation under the LCPD (Article 4.4) which exempts plants from compliance with the ELVs and from inclusion in a national emission reduction plan provided that they undertake to operate for no more than 20,000 operational hours starting from 1 January 2008 and ending no later than 31 December 2015. It is considered economically unrealistic to expect opted-out plants to fit FGD, due to the tight limit on allowable load factors.
Information from the survey of specific plants (Section 3.7) and from the literature indicates that FGD systems with abatement efficiencies of over 90% are most common.
As such, it is expected that the scope for achieving significant additional reductions in SO2 emissions through the use of FGD beyond the quantity of FGD already installed or planned under BAU policy commitments for coal and lignite fired LCPs is limited. It would be recommended that this situation is reviewed after the LCPD compliance date for existing plants in 2008 (except for those countries with a transition period) to confirm the potential scope for further application of FGD).
Final Report 87
h:\projects\em-260\10000 projects\10819 ec lcpd\final report\final report 05225.doc
July 2005
Therefore this section does not present further details on FGD techniques beyond the brief details presented below.
Wet limestone scrubbing is the leading flue gas desulphurisation (FGD) technology and is the dominant technique used in larger plants (>300MWth) (EC, 2004a). The flue gas is usually treated with a limestone slurry. Other sorbents may be used, including lime, however limestone is most commonly used as it is generally readily available and cheap to process. The main by-product is gypsum. As wet FGD requires a large amount of space, retrofitting may be more expensive in cases where there is a lack of available space.
The draft BAT Reference Document (EC, 2004a) gives an SO2 emission reduction efficiency of between 92-98%, depending on the absorber type. Improvements in existing FGD installations may be possible to improve abatement efficiency. The RAINS database gives a removal efficiency of 90% for wet FGD that has already been retrofitted, and 95% for FGD to be retrofitted in the future, for existing hard coal power plants.
Potential issues relate to solid waste management if the gypsum produced by the FGD cannot be sold and a waste water stream is generated requiring treatment. FGD has a power consumption requirement of 1-3% of electrical capacity, used for pumping slurries and overcoming the increased gas-side pressure resistance. A further potential issue relates to the water requirements, although wet FGD plants do not generally use significant amounts of make-up water relative to the normal cooling water requirements of a coal fired power station.
In addition to SO2, wet FGD also removes SO3 (<70%), HCl and HF (95-99%), and particulates by up to 50%, depending on particle size (EC, 2004a). The process is also effective at removing certain metals. This is mostly because the flue gas temperature is reduced, allowing the more volatile metals to condense and be removed from the flue gas, being transferred to the waste water stream.
The use of lime and limestone are potential sources of heavy metals and other contaminants that can ultimately be discharged from the FGD via either the gypsum byproduct or the aqueous effluent stream. These include arsenic, cadmium, selenium and boron, the last two of which can be difficult to remove from the waste water treatment plant.
Seawater scrubbing can be used as an FGD process at power plants near to the coast. This method uses seawater, which is naturally alkaline, to scrub the flue gas and neutralise the SO2. The only import required is seawater. The gas is cooled by the seawater and must be reheated prior to release to minimise plume visibility. The method is most effective where low sulphur fuels are used. Where higher sulphur fuels are used (2.5-3% sulphur), additional seawater, beyond the station’s normal cooling water requirement, would be required which could dramatically increase costs (ETSU, 2000).
The SO2 abatement efficiency is between 85-98% (EC, 2004a).
This technique requires energy consumption of 0.8-1.6% of electrical capacity. It also abates HCl and HF (by 95-99%). The main output of the process is seawater, which will have dissolved sulphate and chloride ions and trace metals, a slightly reduced pH level and a slightly raised temperature.
Spray dry scrubbers generally use lime slurry or calcium oxide to remove SO2 from flue gases. They have mainly been used in smaller installations, using coal with lower levels of sulphur content. This technique has a relatively low energy consumption, compared to wet
Final Report 88
h:\projects\em-260\10000 projects\10819 ec lcpd\final report\final report 05225.doc
July 2005
scrubbers. However, the operating costs of purchasing the sorbents is generally higher than the limestone used in wet scrubbers (EC, 2004a).
The draft BAT Reference Document (EC, 2004a) states that spray dry FGD achieves 85-92% SO2 abatement. In addition, SO3 and HCl are abated by 95%.
The by-products of the process are generally a mixture of fly ash, unreacted additive and CaSO3. A key issue with this technique relates to disposal of the solid residue streams. Dry and semi-dry FGD residues have experienced problems with destabilisation years after disposal and also the release of sulphurous odours due to the relatively high sulphite content.
Sorbent injection is another form of FGD technique used in smaller applications (mainly <250MWth) (EC, 2004a), with variants including furnace sorbent injection; duct sorbent injection; hybrid sorbent injection and CFB dry scrubber. These techniques may use limestone, hydrated lime or dolomite to abate SO2. The by-products of sorbent injection can contain calcium sulphite, calcium sulphate, unreacted sorbent and ash. The potential outlets are limited, and it may require handling as a special waste.
The abatement efficiencies given in the draft BAT Reference Document are 40-50% for furnace sorbent injection (or 70-80% if the reaction product is recycled); 50-90% for duct sorbent injection and hybrid sorbent injection; and 90-95% for the CFB dry scrubber. JEP (2003) quotes a reduction efficiency for duct sorbent injection of 40%.
The RAINS database gives a removal efficiency of 60% for limestone injection for existing hard coal power plants.
Additional measure: Switching to lower sulphur coal Whilst the scope for achieving significant additional reductions in SO2 from application of additional FGD, beyond that anticipated under BAU policy commitments, appears to be limited at the current time, there may be scope for achievement of additional reductions in emissions through the switching to lower sulphur coal.
It is noted from Section 3 that according the energy trends developed for the European Commission (2003), the EU power generation system is projected to rely heavily on competitively priced imported coal (close to 97.5% of coal used in power generation in 2030 compared to just 55% in 2000) in the future. Imported coal is generally of a lower sulphur content than that available from certain Member States, with internationally traded coal being widely available at sulphur levels of 0.8% and below and down to 0.1%, compared to current estimates in the RAINS WEB model of higher sulphur contents than 0.8% for most Member States, and an EU25 average of 1.2% for coal and 1.1% for lignite.
As such, according the above energy trends there is likely to be a gradual shift towards lower sulphur content coals in the future as a result of economic trends.
Clearly, it would be technically possible to bring forward this shift towards lower sulphur coals as a potential option to achieve further SO2 emissions reductions. This option would, however, raise a number of fundamental wider factors including:
• The security and diversity of energy supplies of particular Member States;
• The potential economic impacts on the EU25 coal mining sector; and

Final Report 89
h:\projects\em-260\10000 projects\10819 ec lcpd\final report\final report 05225.doc
July 2005
• The environmental impacts of additional transportation of fuels and any potential negative impacts on other LCP pollutants (although there may be positive impacts for some pollutants).
At a more site specific level, the key issues would relate to any potential future price premia for lower sulphur coals and potential costs of boiler and / or ESP modifications. The latter technical aspects are briefly considered below.
Boiler modifications. Usually, a switch from one coal type to another is often possible with the existing burners (EC, 2004a). However, it is reported (JEP, 2003) that boiler modifications would be anticipated to allow the long term burning of lower sulphur coals.
ESP modifications. For coals with a low sulphur content the resulting fly ash normally exhibits high electrical resistivity, which may significantly reduce ESP performance, whereas a high ash content in the coal will increase the ash load and may strain the ash handling system. Flue gas conditioning (FGC) has been proved to be an effective means to improve ESP performance when collecting high resistivity fly ash. FGC aims to reduce fly ash resistivity and / or to increase fly ash cohesivity through the injection of small quantities of chemical reagents (most commonly sulphur trioxide and / or ammonia) into the flue gas ahead of the ESP (IEA, 2003). According to a recent report (JEP, 2003), the requirement for ESP modifications would not be necessary in switching to 0.8% sulphur coals, but would be necessary in switching to lower sulphur coals eg 0.4%.
4.2.2 Existing oil fired boilers and process heaters in the petroleum refining sector
Introduction A review of the contribution petroleum refineries make to current overall LCP emissions of SO2 indicated that they contribute approximately 11% of overall emissions.
Whilst these processes will be required to comply with the LCPD SO2 ELV by 2008 (for example an average ELV across a refinery’s pre-1987 combustion processes of 1000mg/Nm3), for a number of countries, current emissions are already expected to be within the LCPD ELVs for a significant number of refineries therefore for these refineries additional SO2 reductions may not be achieved. For example, data on average SO2 emissions for different groups of countries is given in Table 4.2.
Table 4.2 Weighted average combustion related emissions (mg/Nm3) of SO2 for different European areas
Europe as a whole
Atlantic Mediterranean North West Europe
Others
Countries Including: Ireland
Portugal Atlantic costs of
France and Spain
Including: Spain
Med coast of France Italy
Greece
Including: Mainland France
UK Belgium
NL Germany Denmark
Including: Sweden Finland Austria
Hungary
1000 1290 1540 570 310
Source: European Commission, 2003

Final Report 90
h:\projects\em-260\10000 projects\10819 ec lcpd\final report\final report 05225.doc
July 2005
Furthermore, those countries currently utilising North Sea Crudes (with relatively low levels of sulphur, in the range <1 to 3% (European Commission, 2003)), particularly those in North West Europe, may find that sulphur levels in crudes increase in the future as North Sea production declines and refineries become more dependent on crudes from other regions (with potentially higher levels of sulphur, eg from the Middle East, in the range 2.5% to 6%). This contrasts with coal fired LCPs that are expected to be utilising fuels with gradually lower sulphur levels in the future.
As a result, it is possible that petroleum refineries will also contribute a reasonable proportion of overall SO2 emissions from LCPs in the future, and may thus be a significant source of potential additional SO2 reductions.
Additional measures Additional SO2 abatement measures for LCPs at petroleum refineries will depend on a number of site specific factors, however, in general they could include:
Fuel switching to refinery fuel gas, LPG (often produced on-site) or natural gas. Due to the availability of refinery fuel gas and the low emissions of SO2, NOx, dust and other pollutants, it is assumed that this option has already, or is already being, investigated at key refineries. The ratio of gas to liquid refinery fuel is a function of a number of factors, and can vary from 80/20 or 70/30 (gas/liquid) on a stand-alone, moderately complex refinery to 40/60 on a highly complex site that also serves a chemicals complex. However, these ratios can be increased when energy conservation measures are applied and the gas availability becomes sufficient for the energy supply of the refinery (European Commission, 2003).
Natural gas is already imported into some petroleum refineries for use as internal fuel instead of heavy fuel oil e.g. as a means of achieving SO2 bubble emission limits. However, natural gas supplies may not be adequately available in quantity or location for all petroleum refineries that may wish to use this fuel.
Alternatively, in the absence of natural gas, it can be argued that a petroleum refinery could use another fuels such as LPG, from its own production. The significantly higher costs of these fuels would obviously impose a greater economic burden.
Furthermore, whilst it does not follow that all the refinery fuel oil has to be replaced, there is the issue of disposing of that refinery fuel which is displaced and the consequent relocation of its sulphur, particulate and metal emissions. Consumption of such heavy fuel oils by industrial, etc. consumers has declined significantly in recent years in those countries where natural gas is available, whilst smaller industrial and similar users prefer distillate fuels due to advantages in handling, etc., although they are more costly.
Reducing the sulphur content of the fuels used. A technically feasible option would be to desulphurise the refinery fuel oil. Currently there is very little fuel oil desulphurisation capacity installed in the EC; there are a number of plants in the USA and Japan (Entec, 2001). The technology is expensive as high pressures are involved, the plants are constructed in special alloys, and the demand for hydrogen usually requires installation of a hydrogen production plant which is also an expensive item.
One aspect of this is whether the refinery would also be desulphurising its “normal” sales of production fuel oil, with demand for lower sulphur fuel oil being driven by the Sulphur Content in Liquid Fuels Directive, and tighter controls proposed on sulphur levels in marine bunker fuels for ships in the North Sea and Baltic, as well as ferries. This would increase the individual plant

Final Report 91
h:\projects\em-260\10000 projects\10819 ec lcpd\final report\final report 05225.doc
July 2005
capacity and so reduce the unit capital costs. Commercial benefits can arise because in the desuphurisation process some of the fuel oil is converted to lighter, more valuable products, with better prices being obtained.
The process for desulphurising refinery fuel oil reacts the oil with hydrogen in the presence of a catalyst. The available technology uses either fixed beds of catalyst or “ebullated” beds. In both types the heavy metals are retained in the pores of the catalyst, thus resulting in a high degree of de-metallisation of the fuel oil product.
Using a lower sulphur crude. Due to the forecast decline in production of low sulphur crudes from the North Sea, it is not clear that this would be a realistic option. Furthermore, this option would reduce the flexibility of petroleum refineries to change crude oils to assist in meeting changes in product demand and could have significant consequences arising from security of supply of crude.
Overall, on the basis of the above analysis it is difficult to identify a clear candidate technology for achieving additional SO2 emissions reductions for refineries in general, due to the importance of site specific factors. However, for the purposes of this analysis, the options to reduce the sulphur content of fuels and to switch to LPG are taken forward in the next section on the cost effectiveness of additional measures.
4.3 Additional measures for NOx
4.3.1 Existing coal boilers
Introduction Primary measures are widely fitted for the control of NOx from LCPs, especially low NOx burners and combustion optimisation, but also more advanced primary measures such as overfire air and reburn. The uptake of these measures, especially overfire air, will increase further in order to comply with the 2008 NOx ELV of 500mg/Nm3 (>500MWth plants) under the LCPD.
A more challenging target is posed by the 2016 NOx ELV of 200mg/Nm3 (>500MWth plants) which is expected to require investment in selective catalytic reduction (SCR). For <500MWth plants the corresponding ELV is 600mg/m3.
Additional measure: overfire air or reburn For <500MWth pulverised fuel plants, the LCPD ELVs may be achievable through the use of low NOx burners alone. This will leave scope for more advanced ‘primary’ measures for NOx control including overfire air and reburn.
Overfire air (OFA) is a commonly used primary measure in coal fired boilers. It is a form of air staging and involves introducing air (15 and 30% of the total combustion air) above the primary combustion zone in a boiler, via additional air ports above the burners. These can be operated with low excess air, which inhibits NOx formation. Retrofitting of OFA is possible, and its use is now considered integral in new plants.
With modern OFA designs (optimised nozzle design, separated and swirled airflow), NOx reductions of 40 to 50% can be achieved in wall or tangentially fired boilers (EC, 2004a). JEP (2001) gives an abatement efficiency of 20% for boosted OFA, beyond that achieved by LNBs

Final Report 92
h:\projects\em-260\10000 projects\10819 ec lcpd\final report\final report 05225.doc
July 2005
and combustion optimisation (CO), and an abatement efficiency of 40% for deep staged OFA relative to LNBs and CO.
It is noted, however, that the furnace height in old furnaces is usually small and may prevent the installation of OFA ports. Even if there is room for an OFA, the residence time of the combustion gases in the upper part of the furnace may not be long enough for complete combustion (EC, 2004a).
Reburn (or fuel staging) involves injecting part of the fuel (up to 20%) above the main combustion zone, incorporating OFA. This creates different zones in the furnace by staging the injection of fuel and air. The fuel used in this way does not necessarily have to be the same as the main fuel - so for example gas-over-coal and coal-over-coal reburn both exist, although gas-over-coal reburn is more common. In addition, installation is relatively simple (EC, 2004a). It can be installed on new plants or retrofitted at existing plants.
The draft BAT Reference Document (EC, 2004a) states that reburn has a NOx abatement efficiency of 45-60%, compared to LNBs alone. This is in a similar range to figures from JEP (2001) which gives an abatement efficiency of 50%, compared to performance with LNBs and combustion optimisation.
Information from NESCAUM (1998) in the USA shows a reduction of 40% for fuel-lean gas reburn; 60% for conventional gas reburn; and 50% for coal reburn.
Reburn may require a slight increase in energy consumption, due to a reduction in thermal efficiency of the boiler, although in practice thermal efficiency reductions have been small (EC, 2004a).
When natural gas is used as the reburn fuel, the mass emissions of particulates, SO2 and CO2 are reduced in direct proportion to the amount of coal replaced, as gas contains no particles or sulphur. Potential impacts of reburn can include an increase in carbon-in-ash, thus rendering the fly ash unsaleable and increasing landfilling. However, in practice carbon-in-ash levels have not been high enough to cause problems (EC, 2004a).
Additional measure: SCR A potential ‘additional’ measure for >500MWth plants could potentially include the retrofitting of SCR at an earlier date, such as 2010, with SCR also being technically applicable to smaller pulverised fuel coal boilers. It is assumed that these (>500MWth) plants would already be fitted with OFA or equivalent technology in order to meet the 2008 NOx ELV of 500mg/Nm3.
SCR is based on the reduction of NOx with ammonia or urea in the presence of a catalyst. It relies on injecting the reagent at a point in the flue gas ductwork system at which there is an appropriate temperature window. This is a significant issue which complicates (and increases the costs) of retrofitting these techniques. Ammonia is more commonly used as the reducing agent than urea, as it is cheaper to purchase, thus reducing operating costs. The catalysts used can be heavy metal oxides, zeolites, iron oxides or activated carbon. SCR is applicable to processes using a range of fuel types. There are three configurations of SCR, namely high-dust, low-dust and tail end. The high-dust arrangement is the most commonly implemented because it avoids flue gas reheating due to the high operating temperature of the catalyst (EC, 2004a).
The NOx emission reduction efficiency of SCR can be up to 90% or more, but depends on levels of NOx achieved by primary measures in place (EC, 2004a).

Final Report 93
h:\projects\em-260\10000 projects\10819 ec lcpd\final report\final report 05225.doc
July 2005
The RAINS database gives a removal efficiency of 80% for SCR (including combustion modifications) for existing hard coal power plants. Information from NESCAUM (1998) shows reductions of between 67% and 90% for coal fired boilers of various types, and 85% for gas fired boilers.
Potential issues with SCR include ammonia slip, in which ammonia is released in the flue gas due to incomplete reactions of ammonia with the NOx. Emissions of ammonia are believed to be below 20mg/Nm3 (UBA, 1997). Similarly, ammonia sulphates may be deposited on the downstream facilities, and ammonia may also occur in FGD waste waters and the air heater cleaning water and in the fly ash (EC, 2004a). The resources required to produce ammonia for use in SCR can be an issue, as large volumes of natural gas are required. The emission of nitrous oxide from SCR in road vehicles is an issue which has been investigated, however there is considered to be more limited data on similar emissions from SCR in power stations. A study in relation to the Swedish NOx tax, however, found that the increase in nitrous oxide represented approximately 5% of total emissions.
Whilst SCR technology has been successfully applied to coal fired power stations, it has not yet been applied to lignite fired plants. In a few cases where an SCR system has been applied to lignite fired plants, it was shown that the catalyst lifetime was too short, because of the high quartz content in the ash causing abrasion of the catalyst (European Commission, 2004a). However, since combustion temperatures for lignite are lower and the humidity of gases is higher compared to hard coal, the NOx formation is comparatively low and emissions of 200mg/Nm3 can be achieved in lignite plants without the need for SCR (European Commission, 2004a).
4.3.2 New gas fired gas turbines
Introduction As demonstrated by the findings of the survey of EUnited Turbines members (see Section 3), new gas turbines are mostly fitted with dry low NOx (DLN) technologies. These involve the use of a dry low NOx combustion chamber, which allows the air and fuel mixing and combustion to take place in two separate steps. This allows a lower flame temperature, resulting in lower NOx emissions (in the region of 50mg/Nm3). This now represents a well established technology for natural gas. Some gaseous fuels such as hydrogen-rich fuel are not suitable for DLN technology (EUnited Turbines, 2005).
Additional measure: SCR Many new gas turbines currently only use such primary measures to reduce NOx emissions. However, SCR systems have been installed at some gas turbines in Austria, Japan, the Netherlands and in the USA (especially in California). It is estimated that approximately 300 gas turbines worldwide are equipped with SCR systems, with further applications planned in Denmark and Italy. SCR systems can achieve an approximate 60 to 85% reduction in NOx emissions (European Commission, 2004a).
For example, two cases are quoted in the Draft LCP BREF (EC, 2004a) of gas turbines in California fitted with DLN technologies and SCR, operating with NOx limits of 5mg/Nm3 and 6 mg/Nm3 respectively (at 15% O2 averaged over 3 hours) for 170MW and 102MW plants. Furthermore, there are reported to be other major CCGT projects in California with proposed limits of 5mg/Nm3 at 15% O2 averaged over 1 hour.

Final Report 94
h:\projects\em-260\10000 projects\10819 ec lcpd\final report\final report 05225.doc
July 2005
As mentioned in Section 4.3.1, a potential issue with SCR is ammonia slip.
Gaz de France (2005) reports that, for new installations, the European natural gas industry currently prefer DLN technology over SCR due to the high cost of the technology and the environmental risks of handling ammonia or urea.
4.4 Additional measures for dust, PM10, PM2.5 and particulate bound heavy metals
4.4.1 Existing coal / lignite boilers
Introduction A number of particulate control measures are available, including the two main types in use: electrostatic precipitators (ESPs) and fabric filters.
With the exception of mercury, which is volatile, the heavy metals of interest to this study are generally removed by particulate control devices to the same extent as are particulates, as they condense onto particulate matter.
Electrostatic precipitators (ESPs) are by far the most commonly used dust removal technology for European power plants using hard coal or lignite. ESPs remove particles from the flue gas stream using an electrical charge. This is applied to the dust, which is then placed in an electrical field, and captured onto a collecting electrode. The dust is then removed from the surface of the electrode for disposal. ESPs are applicable to both solid and liquid fuels, and can operate over a wide range of temperatures, pressures, and dust levels. Large gas volumes can be treated, with low pressure drop. However, particulates with a very high electrical resistivity may not be suitable for capture with ESPs.
The PM10 and PM2.5 abatement efficiencies of ESPs are given in Section 3.
Heavy metals (other than mercury – see next section) tend to be found in the smaller particle size range and are removed efficiently with the particles.
Fabric filters (FFs) consist of isolated compartments containing rows of fabric filter bags or tubes. The flue gas passes through the fabric, leaving particles retained on its surface. The filter is operated with long periods of filtering and short periods of cleaning to collect the particles for disposal. The technique has been used for industrial and smaller combustion plants, but the trend is now towards greater use in larger plants. It is suitable for both solid and liquid fuels (EC, 2004a) and is able to cope with virtually any fly ash with practically no change in outlet emissions (FOE, 2005). FFs can be used with injection of absorbent to abate SO2 and other emissions.
The application of fabric filters generally results in a higher pressure drop, and hence greater electricity requirements and costs. According to Eurelectric, FFs are currently applied only for high resistivity ash (eg for very low sulphur fuels) where ESP systems are less applicable; or for fluidised bed combustion systems; or with dry and semidry FGD systems.
The PM10 and PM2.5 abatement efficiencies of fabric filters are given in Section 3.

Final Report 95
h:\projects\em-260\10000 projects\10819 ec lcpd\final report\final report 05225.doc
July 2005
Additional measure: Adding new fields The particle removal efficiency of an ESP can be increased almost indefinitely by increasing its size (EC, 2004a). From Section 3, typical initial levels of PM concentrations following existing ESPs and FGD are expected to be in the region of 25mg/Nm3 or lower. For medium to high sulphur coals with low fly ash resistivity, ESP upgrades (adding a new field) may provide the lowest cost solution to achieve emission levels of 12mg/Nm3 (0.01lb/MBTU) (IEA, 2003). Furthermore, the Draft LCP BREF reports that in many cases PM emissions in the range of 10mg/Nm3 and less have been measured.
ESP upgrades with SO3 conditioning (see Section 4.2.1) may provide a cost effective solution for achieving these levels with low sulphur coal.
Additional measure: Hybrid systems Hybrid particulate collection systems combine ESPs with fabric filtration to achieve high particulate removal efficiencies, and offer alternatives to ESP upgrades. A particular type of hybrid system that is claimed to provide a low cost option to upgrade existing aged or undersized ESPs is Compact Hybrid Particulate Technology (COHPAC) (IEA, 2003).
This involves a pulse jet fabric filter installed in series with an existing ESP, serving as the polishing or final collection devise. Due to the fact that the ESP removes the majority of the ash or dust prior to entering the fabric filter, the filtration rate (air to cloth ratio) can be increased substantially while still maintaining the same pressure drops as conventional filtration rates. To date, COHPAC technology has been applied on four coal fired boilers (in the range 150 to 300MWe) and other combustion or non-combustion applications for particulate control (IEA, 2003).
It is reported (IEA, 2003) that in a comparison between the COHPAC technology, a new pulse jet bag filter and a wet ESP, the COHPAC was shown to be a cost effective option at achieving a 12mg/Mm3 (0.01lb/MBTU) dust emission target for a range of coal types (including low sulphur coals with high fly ash resistivity).
4.5 Additional measures for mercury
4.5.1 Existing coal and lignite boilers
Introduction Mercury has a higher vapour pressure than the other metals of interest to this study, meaning it is less likely to condense onto particulate matter and be removed by particulate abatement technologies. The following sections firstly consider the impact of abatement measures for particulates, SO2 and NOx on mercury emissions, followed by consideration of specific measures for mercury.
Furthermore, the focus of this section is on coal and lignite boilers which represent the fuel types of most concern regarding mercury emissions.
Additional measures: Abatement measures for particulates, SO2 and NOx The potential effectiveness of abatement techniques for mercury depends, among other factors, on the different species of mercury that are present in the flue gas.

Final Report 96
h:\projects\em-260\10000 projects\10819 ec lcpd\final report\final report 05225.doc
July 2005
Both gaseous elemental mercury (Hg0) and gaseous oxidised mercury (Hg2+) are in the vapour phase at abatement temperatures. Hg0 is insoluble in water and cannot be captured in wet scrubbers. The predominant Hg2+ compounds of coal flue gas are weakly to strongly soluble, and the more soluble species can generally be captured in wet scrubber (or wet FGD) systems. Both Hg0 and Hg2+ are adsorbed onto porous solids such as fly ash, powdered activated carbon or calcium-based acid gas sorbents for subsequent collection in a dust control device. Hg2+ is generally easier to capture by adsorption than Hg0.
Particle bound mercury Hgp is attached to solids that can be readily captured in a particulate control device.
Therefore, mercury abatement techniques for combustion installations comprise three basic methods:
• Capture of Hgp by particulate matter control devices;
• Adsorption of Hg0 and Hg2+ onto entrained sorbents for subsequent capture in particulate control devices. Alternatively Hg may be captured in a packed carbon bed; and
• Solvation of Hg2+ in wet scrubbers.
Particulate abatement measures
During combustion, the mercury in the coal is released as gaseous elemental mercury. It may react with chlorine9 from the coal to form HgCl2. HgCl2 condenses more readily than elemental mercury on ash particles. A large part of the mercury is therefore found in fly ash and is therefore collected by the electrostatic precipitator (ESP) (Eurelectric, 2004). According to Eurelectric (2004), the removal efficiency of an ESP for mercury is typically 50%, with values reported from Denmark (49%), Ireland (52.6%), and the UK (48-52%). According to work by KEMA (Meij and Winkel, 2004), extensive measurements at Dutch coal fired power stations over a period of 25 years indicate that approximately 50% of mercury is removed by ESPs. The actual removal efficiency may fluctuate depending on parameters such as the chlorine content of the coal, the temperature of the ESP and unburned carbon in the ash. Other sources quote lower efficiencies for example, EC (2001) quotes a median mercury removal efficiency of 32% for ESPs, while EC (2004b) suggests a 10% efficiency.
Fabric Filters have the potential to abate mercury, as flue gases are relatively cool before they meet the fabric filter, allowing some condensation of mercury which allows it to be removed (EC, 2004a). Various levels of mercury abatement are quoted for FFs, including 40% (EC, 2004a); 42% (EC, 2001); and 29% (EC, 2004b). The EC (2004b) also quotes a removal efficiency of 85% for FFs when in combination with FGD. For fabric filters, Eurelectric (2004) considers the reported 29% removal efficiency is very low compared to evidence from the USA: for bituminous coals, EPRI gives after various studies an average capture efficiency of 75% and EPA provides an even higher figure.
SO2 abatement measures
With wet limestone scrubbing removal efficiencies of 30-50% have been found (EC, 2004a), with other sources showing a median reduction of 34%, with a range from 18% to over 97% 9 Chlorine also has an opposing effect, which is to increase the share of gaseous mercury, EC 2003.

Final Report 97
h:\projects\em-260\10000 projects\10819 ec lcpd\final report\final report 05225.doc
July 2005
removal (EC, 2001). The use of FGD in combination with an ESP has been reported to give a 75% removal efficiency for mercury based on work by KEMA in the Netherlands (Meij and Winkel, 2004). The FGD itself achieves a 50% reduction in mercury, adding to the 50% reduction in the ESP. The overall reduction of 75% based on work in the Netherlands compares with 72% reported by Denmark and 87% by the UK (Eurelectric, 2004). These figures are in the same range as the 85% figure in EC’s Consultation Document (European Commission, 2004b). STEAG (2004) estimates the contribution of the FGD (in a system with ESP and SCR) to reducing total mercury is in the range 50-75%.
Spray dry scrubbers can also abate mercury emissions. The draft BAT Reference Document (EC, 2004a) gives a range of 35-85% abatement. The EC (2004b) suggests a 67% efficiency for spray dryers in combination with ESPs, while the EC (2001) also gave a median efficiency of 67% (in a range of 23-83%) for spray dry scrubbers with ESP or fabric filter. A second study quoted in EC (2001) gave a median value of 30%. According to data from Denmark, the removal efficiency for Spray Drier Adsorption (SDA) and ESP is 75% (Eurelectric, 2004).
NOx abatement measures
Research has shown that high dust SCR (the most common type of SCR for coal plants) can abate mercury emissions. This is due to the oxidation of mercury being catalysed, leading to higher concentrations of ionic mercury that can be removed by ESP and FGD systems.
For example an electrostatic precipitator (ESP) and flue gas desulphurisation (FGD) together may abate mercury by 75%, but when SCR is added, this may improve mercury abatement to 90% (Meij and Winkel, 2004 and TWG). STEAG (2004) gives a removal efficiency of 70-75% for SCR, ESP and FGD, with the contribution of the SCR being to reduce elemental mercury from 40-50% to 2-12%. Mercury removal efficiencies of 80-85% for the combination of SCR, SDA (spray dry adsorption) and ESP are reported in Austria (Eurelectric, 2004).
Additional measures: Specific mercury abatement techniques It is clear from the above consideration of abatement measures not specifically targeted at mercury, that high levels of mercury reduction appear to be achievable from the combined application of ESP, FGD and SCR.
For coal fired power stations >500MWth, all these measures will generally be required to comply with the LCPD ELVs (with FGD required by 2008 and SCR by 2016). FGD may also be required for a number of smaller power stations. For lignite power stations, SCR is not expected to be required to comply with the LCPD NOx ELVs (due to inherently lower NOx levels), although these plants are expected to contribute a smaller proportion of overall mercury emissions from power stations than hard coal plants (eg data for Poland suggests coal contributes 75% compared to 25% for lignite).
The above techniques would appear to represent the first techniques to be considered when addressing mercury emissions, considering their significant impact on other LCP pollutants as well as mercury. In the event that additional mercury emissions reductions were required, additional techniques may also be considered. These are briefly discussed below.
Fuel cleaning is a primary measure available to reduce the mercury content of solid fuel prior to combustion. A range of cleaning processes are available. The aim of coal cleaning is usually to remove mineral matter and pyritic sulphur content, with removal of mercury a side benefit. The removal efficiency ranges from 0-60%, with an average reduction of 21%, depending on the type and chloride content of the coal (EC, 2001).
Final Report 98
h:\projects\em-260\10000 projects\10819 ec lcpd\final report\final report 05225.doc
July 2005
Selenium impregnated filters may potentially be available for large combustion plants to abate mercury, although most processes are not at a commercial stage or are more appropriate for waste incinerators (EC, 2004a) or for steel and non-ferrous metal smelters (EC, 2001). The filter contains selenium, which combines with mercury to form mercury selenide, which is highly stable. Spent filters are returned to the manufacturer for recharging. The mercury reduction can be over 90% (EC, 2001).
In addition, selenium scrubbers are wet processes in which gaseous mercury reacts with activated amorphous selenium, circulating in a scrubber with sulphuric acid. The removal efficiency is generally 90-95%, with lower levels at plants with lower mercury levels.
STEAG (2004) studied a range of potential methods for mercury emission abatement and concluded that selenium filters were not feasible for power plants.
Activated carbon or coke filters have been developed to abate mercury, cadmium and lead from flue gases. However, most are not at a commercial stage, or are applicable to waste incinerators, and therefore additional research is required to determine whether these are applicable to LCPs. Tests at a pilot system at an incinerator suggest that the majority of mercury is abated by lignite coke material (EC, 2004a). The EC (2004b) suggests a 90-95% mercury abatement efficiency for carbon filters in combination with ESPs; and a 50-90% or more efficiency for carbon filters and fabric filters, while the EC (2001) quoted a 90-95% efficiency at a non-ferrous metal smelter in Sweden.
STEAG (2004) studied a range of potential methods for mercury emission abatement and concluded that activated carbon filters were not feasible for power plants.
Carbon injection has shown a reduction of 13-20% of mercury in the flue gas, according to the draft BAT Reference Document. However, most carbon injection processes are at a commercial stage or more appropriate for waste incinerators, and therefore further research is required to assess applicability to LCPs (EC, 2004a).
STEAG (2004) studied a range of potential methods for mercury emission abatement. It was concluded that activated carbon injection upstream of the ESP was not feasible for power plants. However, it concluded that activated carbon injection in the FGD and activated carbon injection combined with a baghouse filter following the ESP were the only two feasible methods for power plant mercury abatement. Abatement rates of over 90% for injection in the FGD and over 95% in combination with a baghouse filter are quoted.
Different sorbents such as silica, bauxite (alumina), kaolinite, emathlite and lime have been investigated for their ability to remove metals from flue gas. However, many are of limited use for large power stations, and further research is required into their applicability. The USEPA (2004) is currently investigating low-cost dry sorbents suitable for retrofitting to existing plants to abate mercury.
Another experimental method for mercury abatement is outlined in the draft BAT Reference Document (EC, 2004a). This involves removing mercury vapour from flue gases using sulphur-impregnated adsorbents in packed beds. Although the sorbents have high mercury adsorption capacity, they cannot abate all the mercury. Higher abatement efficiencies may be achieved using a bed or sulphur-impregnated alumina or zeolite adsorbents, followed by a second bed of sulphur-impregnated active carbon adsorbents.

Final Report 99
h:\projects\em-260\10000 projects\10819 ec lcpd\final report\final report 05225.doc
July 2005
The lead sulphide process is an additional suggested mercury abatement technique. The flue gas passes through a tower packed with lead sulphide coated balls, which remove mercury at up to 99% efficiency. This method has been used at the Mitsubishi smelter in Japan (EC, 2001).
In conclusion, once an LCP is already fitted with key items of pollution control equipment including ESP, FGD and SCR, in the event that additional mercury emission reductions would be required, techniques to consider include activated carbon addition in FGD or activated carbon addition in a bag filter (following the ESP).
4.6 Costs of additional measures
4.6.1 Cost effectiveness of additional measures The costs of the potential additional measures identified in the previous section are presented in this section.
A wide range of information sources have been reviewed in order to identify appropriate cost data. Where more there are multiple data sources for a specific measure, preference has been given to those that are most up-to-date and transparent, in terms of the breakdown of the different cost elements.
Key sources of data that have been consulted include:
• European Commission BAT Reference Documents;
• UK electricity industry’s Joint Environmental Programme (JEP) reports;
• German sources including STEAG and VGB PowerTech;
• IEA Coal Research reports
• Report on the NOx emissions trading programme in the USA
At the time of undertaking the research for this study, cost data for additional measures in the LCP sector was not available from EGTEI, as, at that time, only a provisional draft (for >500MWth LCPs) was available. However, any future work on this subject should also consider any relevant final outputs from EGTEI.
Cost data from each document used has been converted into Euros, in year 2000 prices. This is to allow consistency with IIASA’s RAINS model, which uses this basis for its cost data. A 4% discount rate and 15 year economic life have been used for the measures considered in this section.
Overall, it should be emphasised that the cost-effectiveness data in � / t presented in this section is subject to uncertainty due to the potential site specific variations in baseline emissions prior to the additional measures; the costs of the additional measures and the abatement efficiency achievable. Due to the range of factors and the complexity of the sector, it is difficult to quantify the uncertainty associated with these estimates, although an indicative uncertainty would be in the range +/ - 20%.
The data on costs and cost-effectiveness of additional measures is presented in Table 4.3 below.
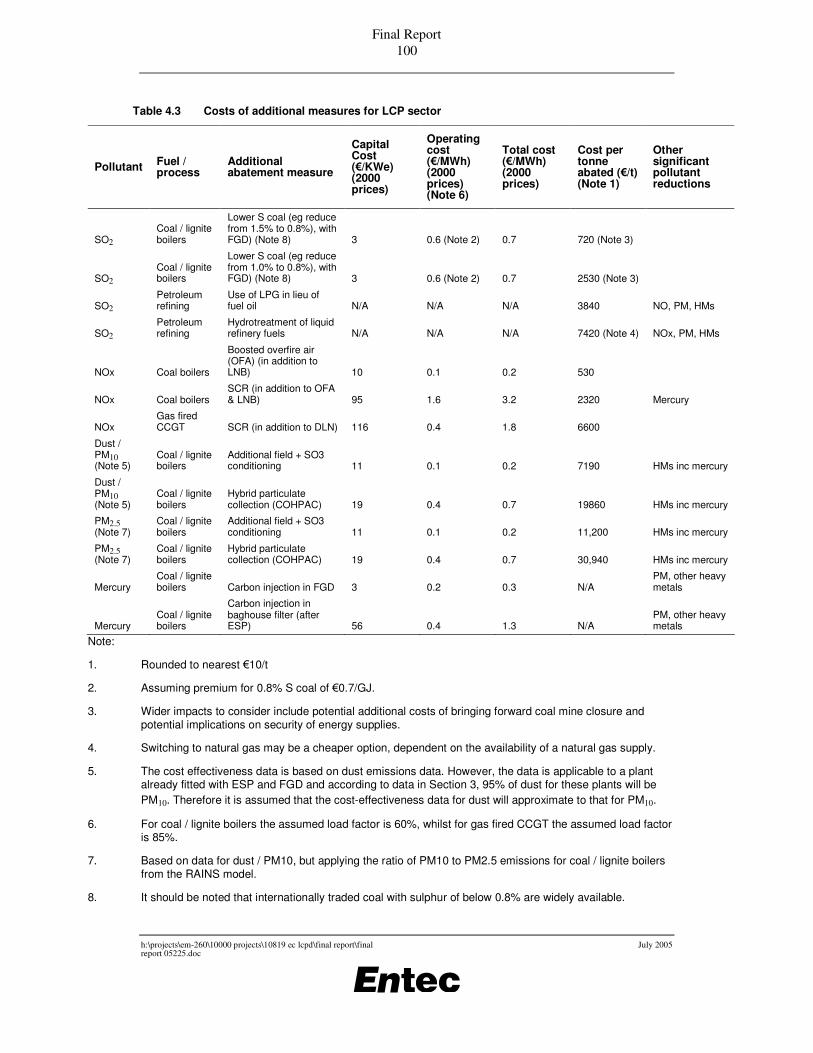
Final Report 100
h:\projects\em-260\10000 projects\10819 ec lcpd\final report\final report 05225.doc
July 2005
Table 4.3 Costs of additional measures for LCP sector
Pollutant Fuel / process
Additional abatement measure
Capital Cost (�/KWe) (2000 prices)
Operating cost (�/MWh) (2000 prices) (Note 6)
Total cost (�/MWh) (2000 prices)
Cost per tonne abated (�/t) (Note 1)
Other significant pollutant reductions
SO2 Coal / lignite boilers
Lower S coal (eg reduce from 1.5% to 0.8%), with FGD) (Note 8) 3 0.6 (Note 2) 0.7 720 (Note 3)
SO2 Coal / lignite boilers
Lower S coal (eg reduce from 1.0% to 0.8%), with FGD) (Note 8) 3 0.6 (Note 2) 0.7 2530 (Note 3)
SO2 Petroleum refining
Use of LPG in lieu of fuel oil N/A N/A N/A 3840 NO, PM, HMs
SO2 Petroleum refining
Hydrotreatment of liquid refinery fuels N/A N/A N/A 7420 (Note 4) NOx, PM, HMs
NOx Coal boilers
Boosted overfire air (OFA) (in addition to LNB) 10 0.1 0.2 530
NOx Coal boilers SCR (in addition to OFA & LNB) 95 1.6 3.2 2320 Mercury
NOx Gas fired CCGT SCR (in addition to DLN) 116 0.4 1.8 6600
Dust / PM10 (Note 5)
Coal / lignite boilers
Additional field + SO3 conditioning 11 0.1 0.2 7190 HMs inc mercury
Dust / PM10 (Note 5)
Coal / lignite boilers
Hybrid particulate collection (COHPAC) 19 0.4 0.7 19860 HMs inc mercury
PM2.5 (Note 7)
Coal / lignite boilers
Additional field + SO3 conditioning 11 0.1 0.2 11,200 HMs inc mercury
PM2.5 (Note 7)
Coal / lignite boilers
Hybrid particulate collection (COHPAC) 19 0.4 0.7 30,940 HMs inc mercury
Mercury Coal / lignite boilers Carbon injection in FGD 3 0.2 0.3 N/A
PM, other heavy metals
Mercury Coal / lignite boilers
Carbon injection in baghouse filter (after ESP) 56 0.4 1.3 N/A
PM, other heavy metals
Note:
1. Rounded to nearest �10/t
2. Assuming premium for 0.8% S coal of �0.7/GJ.
3. Wider impacts to consider include potential additional costs of bringing forward coal mine closure and potential implications on security of energy supplies.
4. Switching to natural gas may be a cheaper option, dependent on the availability of a natural gas supply.
5. The cost effectiveness data is based on dust emissions data. However, the data is applicable to a plant already fitted with ESP and FGD and according to data in Section 3, 95% of dust for these plants will be PM10. Therefore it is assumed that the cost-effectiveness data for dust will approximate to that for PM10.
6. For coal / lignite boilers the assumed load factor is 60%, whilst for gas fired CCGT the assumed load factor is 85%.
7. Based on data for dust / PM10, but applying the ratio of PM10 to PM2.5 emissions for coal / lignite boilers from the RAINS model.
8. It should be noted that internationally traded coal with sulphur of below 0.8% are widely available.

Final Report 101
h:\projects\em-260\10000 projects\10819 ec lcpd\final report\final report 05225.doc
July 2005
4.6.2 Comparison of costs of additional measures for LCP sector with RAINS model costs for all other sectors
Clearly, in the context of EU policy development, emissions reductions should be sought where they are most cost-effective in achieving environmental objectives, taking into consideration all emission source groups. This section compares the marginal abatement costs of additional abatement measures for the LCP sector (from Table 4.3) with the corresponding costs of additional abatement measures for other sectors.
The marginal abatement costs of additional abatement measures for all other sectors are taken from the RAINS Web model, and represent measures beyond those that are estimated to be implemented under current legislative controls (the CP_CLE_Aug04 scenario), ie the measures represent ‘beyond BAU’ measures.
The data is presented in the following figures for SO2, NOx and PM2.5 respectively. Each figure shows the RAINS Web cost curve for the specified year, which is comprised of large numbers of individual ‘beyond BAU’ measures ranked in order of cost effectiveness. Each measure represents an individual point on the curve. The slope of the curve indicates the cost effectiveness at any given point.
Overlaid onto each figure are text boxes and arrows indicating the approximate point in the cost curve where the additional measures for the LCP sector would fit, based on their cost effectiveness. This enables the relative cost effectiveness of additional measures for the LCP sector to be considered.
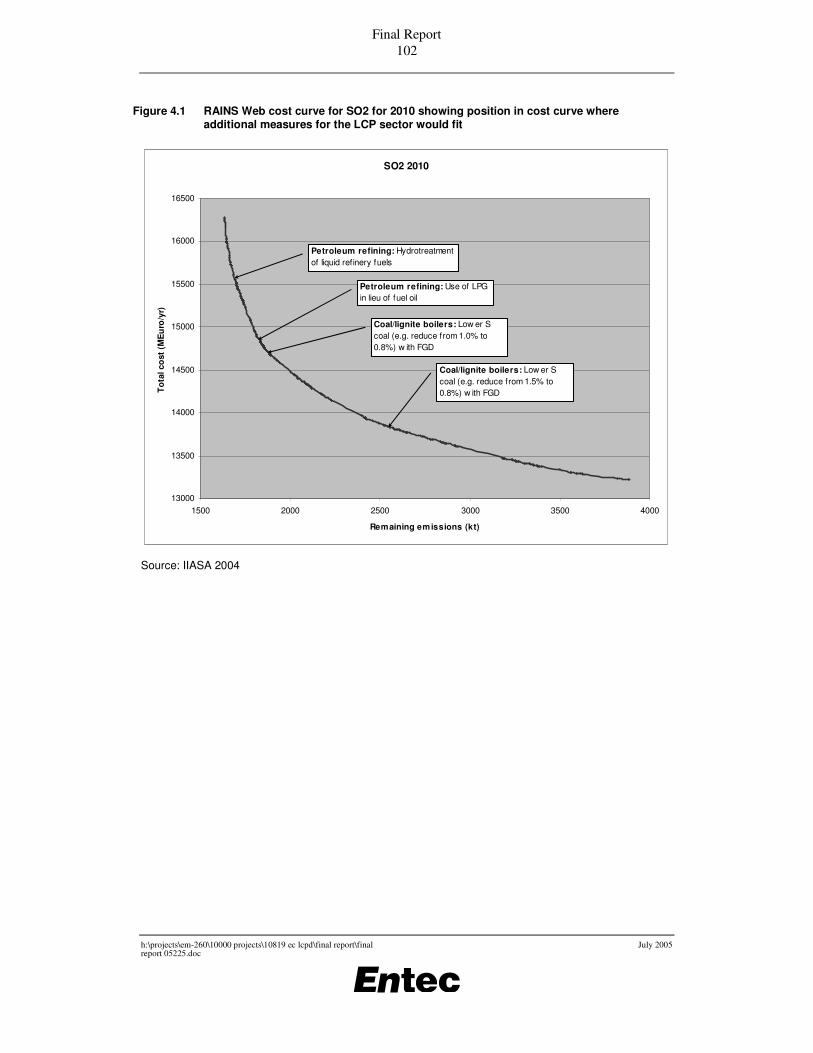
Final Report 102
h:\projects\em-260\10000 projects\10819 ec lcpd\final report\final report 05225.doc
July 2005
Figure 4.1 RAINS Web cost curve for SO2 for 2010 showing position in cost curve where additional measures for the LCP sector would fit
SO2 2010
13000
13500
14000
14500
15000
15500
16000
16500
1500 2000 2500 3000 3500 4000
Remaining emissions (kt)
Tot
al c
ost
(M
Eu
ro/y
r)
Coal/lignite boilers: Low er S coal (e.g. reduce from 1.5% to 0.8%) w ith FGD
Coal/lignite boilers: Low er S coal (e.g. reduce from 1.0% to 0.8%) w ith FGD
Petroleum refining: Use of LPG in lieu of fuel oil
Petroleum refining: Hydrotreatment of liquid refinery fuels
Source: IIASA 2004

Final Report 103
h:\projects\em-260\10000 projects\10819 ec lcpd\final report\final report 05225.doc
July 2005
Figure 4.2 RAINS Web cost curve for SO2 for 2020 showing position in cost curve where additional measures for the LCP sector would fit
SO2 2020
12500
13000
13500
14000
14500
15000
15500
16000
16500
1200 1400 1600 1800 2000 2200 2400 2600 2800 3000
Remaining emissions (kt)
To
tal c
ost (
ME
uro
/yr)
Coal/lignite boilers: Low er S coal (e.g. reduce from 1.5% to 0.8%) w ith FGD
Coal/lignite boilers: Low er S coal (e.g. reduce from 1.0% to 0.8%) w ith FGD
Petroleum refining: Use of LPG in lieu of fuel oil
Petroleum refining: Hydrotreatment of liquid refinery fuels
Source: IIASA 2004

Final Report 104
h:\projects\em-260\10000 projects\10819 ec lcpd\final report\final report 05225.doc
July 2005
Figure 4.3 RAINS Web cost curve for NOx for 2010 showing position in cost curve where additional measures for the LCP sector would fit
NOx 2010
24500
26500
28500
30500
32500
34500
36500
5700 6200 6700 7200 7700 8200
Remaining emissions (kt)
To
tal c
ost
(M
Eu
ro/y
r)
Coal boilers: Boosted overfire air (OFA) (in addition to LNB)
Coal boilers: SCR (in addition to OFA and LNB)
Gas fired CCGT: SCR (in addition to DLN)
Source: IIASA 2004

Final Report 105
h:\projects\em-260\10000 projects\10819 ec lcpd\final report\final report 05225.doc
July 2005
Figure 4.4 RAINS Web cost curve for NOx for 2020 showing position in cost curve where additional measures for the LCP sector would fit
NOx 2020
39500
44500
49500
54500
59500
64500
3500 4000 4500 5000 5500 6000
Remaining emissions (kt)
To
tal c
ost
(ME
uro/
yr)
Coal boilers: Boosted OFA (in addition to LNB)
Coal boilers: SCR (in addition to OFA and LNB)
Gas fired CCGT: SCR (in addition to DLN)
Source: IIASA 2004

Final Report 106
h:\projects\em-260\10000 projects\10819 ec lcpd\final report\final report 05225.doc
July 2005
Figure 4.5 RAINS Web cost curve for PM2.5 for 2010 showing position in cost curve where additional measures for the LCP sector would fit
PM2.5 2010
30000
35000
40000
45000
50000
55000
700 750 800 850 900 950 1000 1050 1100 1150 1200
Remaining emissions (kt)
Tota
l co
st (
ME
uro
/yr)
Coal / lignite boilers: Additional ESP f ield and SO3 conditioning
Coal / lignite boilers: Hybrid particulate collection (COHPAC)
Source: IIASA 2004
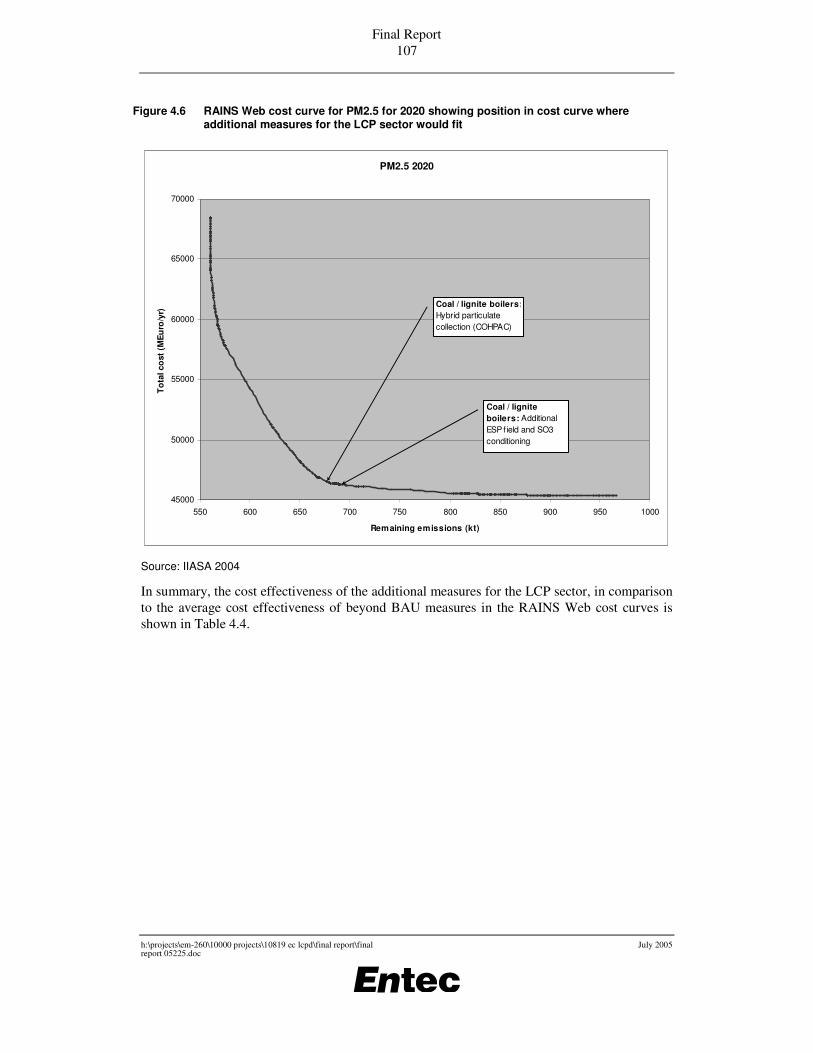
Final Report 107
h:\projects\em-260\10000 projects\10819 ec lcpd\final report\final report 05225.doc
July 2005
Figure 4.6 RAINS Web cost curve for PM2.5 for 2020 showing position in cost curve where additional measures for the LCP sector would fit
PM2.5 2020
45000
50000
55000
60000
65000
70000
550 600 650 700 750 800 850 900 950 1000
Remaining emissions (kt)
Tot
al c
ost
(MEu
ro/y
r)
Coal / lignite boilers: Additional ESP field and SO3 conditioning
Coal / lignite boilers: Hybrid particulate collection (COHPAC)
Source: IIASA 2004
In summary, the cost effectiveness of the additional measures for the LCP sector, in comparison to the average cost effectiveness of beyond BAU measures in the RAINS Web cost curves is shown in Table 4.4.
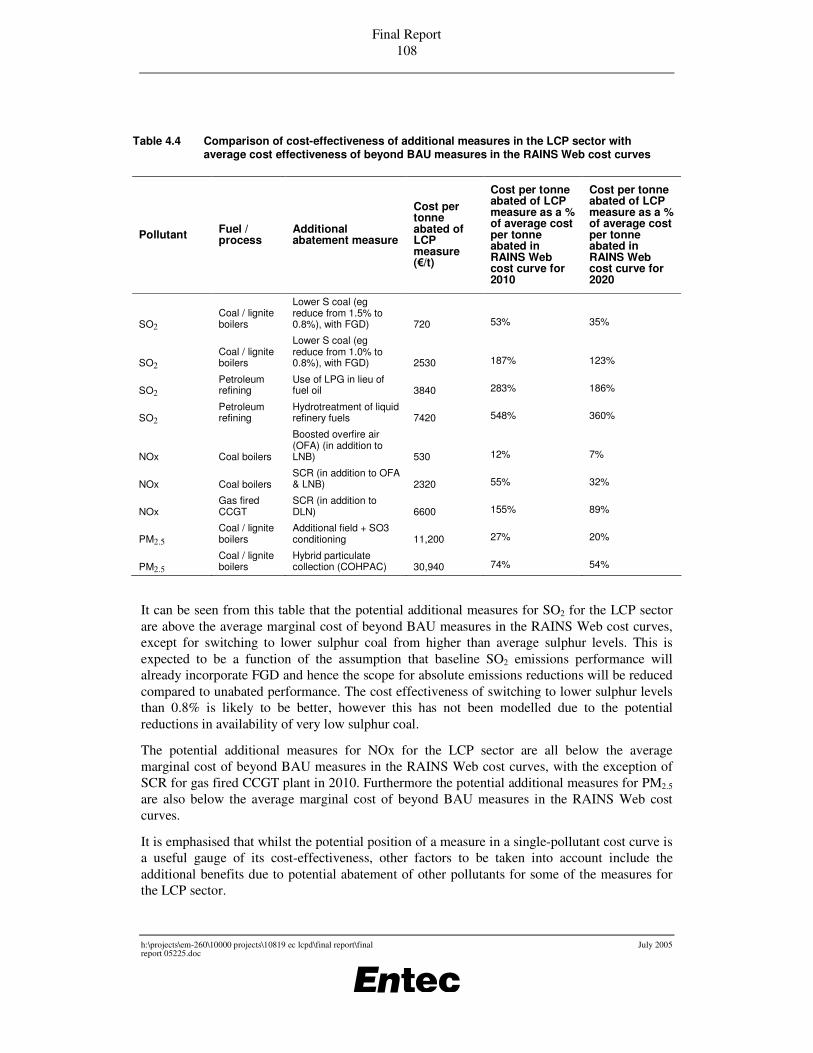
Final Report 108
h:\projects\em-260\10000 projects\10819 ec lcpd\final report\final report 05225.doc
July 2005
Table 4.4 Comparison of cost-effectiveness of additional measures in the LCP sector with average cost effectiveness of beyond BAU measures in the RAINS Web cost curves
Pollutant Fuel / process
Additional abatement measure
Cost per tonne abated of LCP measure (�/t)
Cost per tonne abated of LCP measure as a % of average cost per tonne abated in RAINS Web cost curve for 2010
Cost per tonne abated of LCP measure as a % of average cost per tonne abated in RAINS Web cost curve for 2020
SO2 Coal / lignite boilers
Lower S coal (eg reduce from 1.5% to 0.8%), with FGD) 720 53% 35%
SO2 Coal / lignite boilers
Lower S coal (eg reduce from 1.0% to 0.8%), with FGD) 2530 187% 123%
SO2 Petroleum refining
Use of LPG in lieu of fuel oil 3840 283% 186%
SO2 Petroleum refining
Hydrotreatment of liquid refinery fuels 7420 548% 360%
NOx Coal boilers
Boosted overfire air (OFA) (in addition to LNB) 530 12% 7%
NOx Coal boilers SCR (in addition to OFA & LNB) 2320 55% 32%
NOx Gas fired CCGT
SCR (in addition to DLN) 6600 155% 89%
PM2.5 Coal / lignite boilers
Additional field + SO3 conditioning 11,200 27% 20%
PM2.5 Coal / lignite boilers
Hybrid particulate collection (COHPAC) 30,940 74% 54%
It can be seen from this table that the potential additional measures for SO2 for the LCP sector are above the average marginal cost of beyond BAU measures in the RAINS Web cost curves, except for switching to lower sulphur coal from higher than average sulphur levels. This is expected to be a function of the assumption that baseline SO2 emissions performance will already incorporate FGD and hence the scope for absolute emissions reductions will be reduced compared to unabated performance. The cost effectiveness of switching to lower sulphur levels than 0.8% is likely to be better, however this has not been modelled due to the potential reductions in availability of very low sulphur coal.
The potential additional measures for NOx for the LCP sector are all below the average marginal cost of beyond BAU measures in the RAINS Web cost curves, with the exception of SCR for gas fired CCGT plant in 2010. Furthermore the potential additional measures for PM2.5 are also below the average marginal cost of beyond BAU measures in the RAINS Web cost curves.
It is emphasised that whilst the potential position of a measure in a single-pollutant cost curve is a useful gauge of its cost-effectiveness, other factors to be taken into account include the additional benefits due to potential abatement of other pollutants for some of the measures for the LCP sector.

Final Report 109
h:\projects\em-260\10000 projects\10819 ec lcpd\final report\final report 05225.doc
July 2005
Furthermore, whilst the scope of this particular study does not extend to a cost-benefit analysis, it would clearly be necessary to consider the costs in more detail (including absolute costs and relevant wider economic impacts) and to quantify the health and environmental benefits of any potential emissions reductions in the event of further policy development related to potentially tighter standards in the LCP sector.
4.7 Summary • In the event that further reductions in emissions were required from the LCP sector,
combinations of pollutants / process types have been identified for potential further reductions if they are expected to make a significant contribution to overall LCP emissions in 2010 and 2020, under a BAU scenario.
• For these combinations, specific additional abatement measures have been identified that would be technically feasible for reducing emissions further, and which would generally go beyond those potentially required to comply with the LCPD. These are summarised below.
Pollutant Fuel / process Additional abatement measure
SO2 Coal / lignite boilers Lower S coal (eg reduce from 1.5% to 0.8%), with FGD
SO2 Coal / lignite boilers Lower S coal (eg reduce from 1.0% to 0.8%), with FGD
SO2 Petroleum refining Use of LPG in lieu of fuel oil
SO2 Petroleum refining Hydrotreatment of liquid refinery fuels
NOx Coal boilers (<500MWth) Boosted overfire air (OFA) (in addition to LNB)
NOx Coal boilers (>500MWth before 2016, or <500MWth) SCR (in addition to OFA & LNB)
NOx Gas fired CCGT SCR (in addition to DLN)
PM10 / PM2.5 Coal / lignite boilers Additional field + SO3 conditioning
PM10 / PM2.5 Coal / lignite boilers Hybrid particulate collection (COHPAC)
Mercury Coal / lignite boilers Carbon injection in FGD
Mercury Coal / lignite boilers Carbon injection in baghouse filter (after ESP)
• The estimated cost effectiveness of these additional measures has been presented, and compared with the cost-effectiveness of other ‘beyond BAU’ measures in the RAINS Web cost curves, which includes measures for other RAINS sectors.
• On the basis of these comparisons, the potential additional measures for SO2 for the LCP sector are above the average marginal cost of beyond BAU measures in the RAINS Web cost curves, except for switching to lower sulphur coal from higher than average sulphur levels.
• The potential additional measures for NOx are all below the average marginal cost of beyond BAU measures in the RAINS Web cost curves, with the exception of SCR for gas fired CCGT plant in 2010.
• Furthermore the potential additional measures for PM2.5 are also below the average marginal cost of beyond BAU measures in the RAINS Web cost curves.
• It is emphasised that whilst the potential position of a measure in a single-pollutant cost curve is a useful gauge of its cost-effectiveness, other factors to be taken into

Final Report 110
h:\projects\em-260\10000 projects\10819 ec lcpd\final report\final report 05225.doc
July 2005
account include the additional benefits due to potential abatement of other pollutants for some of the measures for the LCP sector.
• Furthermore, whilst the scope of this particular study does not extend to a cost-benefit analysis, it would clearly be necessary to consider the costs in more detail (including absolute costs and relevant wider economic impacts) and to quantify the health and environmental benefits of any potential emissions reductions in the event of further policy development related to potentially tighter standards in the LCP sector.
4.8 References • EA, 2000. UK Technical Guidance IPC S3 1.01 ‘Combustion Processes:
Supplementary Guidance Note’
• Entec, 2001. “The determination of the costs and benefits of the Revised Large Combustion Plant Directive for existing plant”
• Entec, 2001a. Economic Evaluation of Air Quality Targets for Heavy Metals. Report for European Commission. January 2001.
• ETSU, 2000. Flue gas desulphurisation technologies.
• EUnited Turbines, 2005. Comments on Entec Draft Final Report of April 2005 for LCPD Review.
• Eurelectric, 2003. Eurprog 2003: Statistics and prospects for the European electricity sector, July 2003.
• Eurelectric, 2004. Eurelectric comments on the EC consultation document “Development of the EU Mercury Strategy”, May 2004.
• Eurelectric , 2005. Eurelectric comments on the Draft Final Report, June 2005.
• European Commission, 2001. ‘Ambient air pollution by mercury (Hg). Position paper’
• European Commission, 2003. Integrated Pollution Prevention and Control (IPPC) Reference Document on Best Available Techniques for Mineral Oil and Gas Refineries, dated February 2003
• European Commission, 2004a. Draft Reference Document on Best Available Techniques for Large Combustion Plants. Draft November 2004.
• European Commission, 2004b. Development of an EU Mercury Strategy. Consultation Document. 15 March 2004.
• FoE, 2005. Comments on Draft Final Report by EEB, Friends of the Earth and the Swedish NGO Secretariat on Acid Rain 2005.
• IIASA, 2004. Cost curves supplied to Entec, December 2004.
• IEA, 2003. Developments in particulate control. IEA Clean Coal Centre. 2003
Final Report 111
h:\projects\em-260\10000 projects\10819 ec lcpd\final report\final report 05225.doc
July 2005
• JEP, 2001. ‘Assessment of England and Wales Electricity Sector BATNEEC for NOx’. A report by the Joint Environmental Programme in the UK.
• JEP, 2003. ‘A review of SO2 control options and costs’. A report by the Joint Environmental Programme in the UK. March 2003.
• KEMA, 2004. Personal communication sent to European Commission regarding the mercury consultation document, 22/4/04
• Meij and Winkel, 2004. Mercury emissions from coal fired power stations in the Netherlands: the current state of the art. Paper at the 7th International Conference on Mercury as a Global Pollutant, June 27 to July 2, 2004.
• STEAG, 2004. Statement: improved reduction of mercury emissions in coal-fired power stations. April 2004.
• UBA, 1997. Emission control at stationary sources in the Federal Republic of Germany - Volume I, Sulphur Oxide and Nitrogen Oxide Emission Control
• UKOOA (2005) Comment from UK Offshore Operators Association on the Draft Final Report, June 2005.
• USEPA (2004) An improved sorbent for mercury abatement - Phase II (68D00281) Abstract, on www.epa.gov)

Final Report 112
h:\projects\em-260\10000 projects\10819 ec lcpd\final report\final report 05225.doc
July 2005
Final Report 113
h:\projects\em-260\10000 projects\10819 ec lcpd\final report\final report 05225.doc
July 2005
5. Analysis of Other Specific Provisions of the LCPD
5.1 Assistance on possible end dates or of lower limit values for the NOx ELV derogation
5.1.1 Introduction This brief section provides supporting information related to possible end dates or lower limit values for the derogation contained in footnote 2 to Annex VI A. This derogation allows operators of solid fuel LCPs >500MWth a less stringent NOX ELV if they do not operate for more than 2,000 hours per annum until 31/12/15 (ELV of 600 vs 500mg/Nm3) and 1,500 hours per annum after 01/01/16 (ELV of 450 vs 200mg/Nm3).
This analysis takes into account, firstly, the likely significance of these plants in terms of NOx emissions, and secondly, the expected cost-effectiveness of various NOx abatement measures.
5.1.2 Potential significance of NOx emissions from plants covered by this derogation It is helpful to express the limits on operational hours in terms of load factors, together with the load factors that would be allowable under the limited life derogation in Article 4.4.
• Less stringent NOx ELV up to 2016 23% load factor limit
• Less stringent NOx ELV from 2016 17% load factor limit
• Limited life derogation 28% load factor limit (2008 to 2015 av)
It is not clear at the time of writing what proportion of >500MWth solid fuel plants are likely to take up the low load factor derogation - this will not be known until 2008 and beyond. Qualification for the less stringent NOx ELVs by maintaining very low load factors appears relatively unattractive because:
• To qualify for the less stringent NOx ELVs, the load factors will need to be at particularly low levels, which might be uneconomically low for a number of plants.
• Plants anticipating operating at low load factors are likely to have found the limited life derogation10 (opting-out of the LCPD) more advantageous than ‘opting-in’ to the LCPD and qualifying for the less stringent NOx ELV. Opting-out through the limited life derogation would allow plants to operate at higher load factors than for the less stringent NOx ELV (although they would need to close by end of 2015) and without
10 Operators were required to submit a declaration to their competent authority by 30 June 2004 if they wanted to qualify for the limited life derogation.
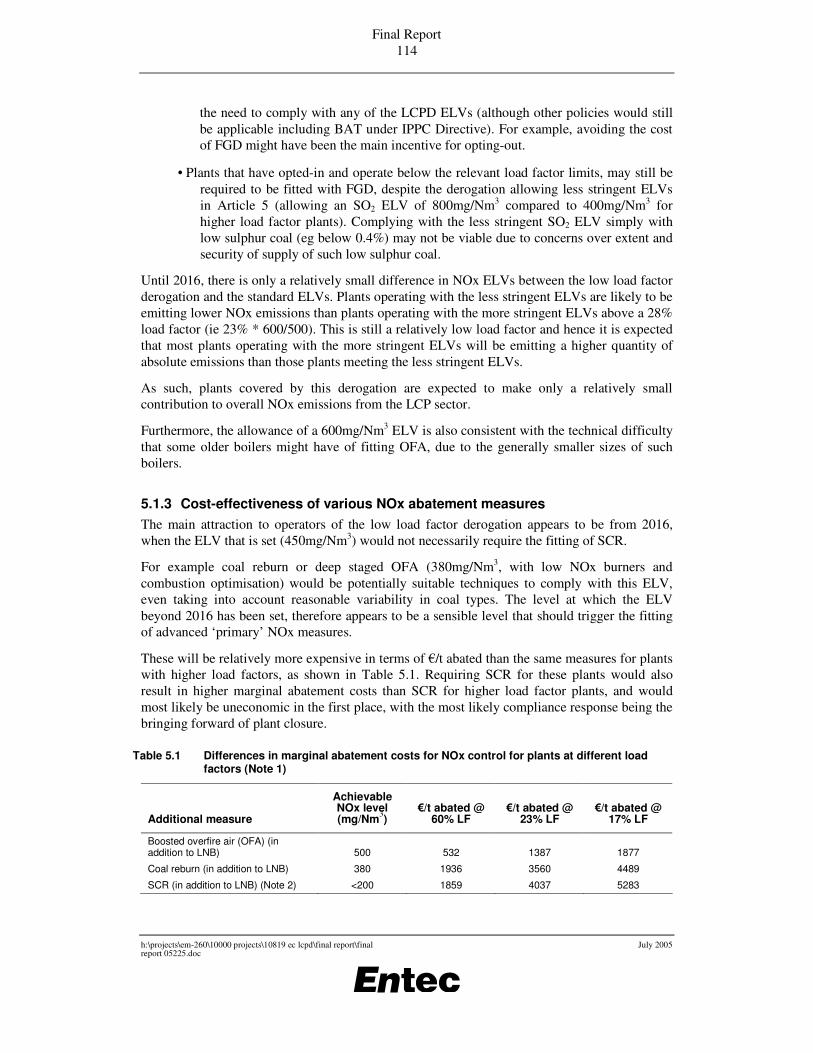
Final Report 114
h:\projects\em-260\10000 projects\10819 ec lcpd\final report\final report 05225.doc
July 2005
the need to comply with any of the LCPD ELVs (although other policies would still be applicable including BAT under IPPC Directive). For example, avoiding the cost of FGD might have been the main incentive for opting-out.
• Plants that have opted-in and operate below the relevant load factor limits, may still be required to be fitted with FGD, despite the derogation allowing less stringent ELVs in Article 5 (allowing an SO2 ELV of 800mg/Nm3 compared to 400mg/Nm3 for higher load factor plants). Complying with the less stringent SO2 ELV simply with low sulphur coal (eg below 0.4%) may not be viable due to concerns over extent and security of supply of such low sulphur coal.
Until 2016, there is only a relatively small difference in NOx ELVs between the low load factor derogation and the standard ELVs. Plants operating with the less stringent ELVs are likely to be emitting lower NOx emissions than plants operating with the more stringent ELVs above a 28% load factor (ie 23% * 600/500). This is still a relatively low load factor and hence it is expected that most plants operating with the more stringent ELVs will be emitting a higher quantity of absolute emissions than those plants meeting the less stringent ELVs.
As such, plants covered by this derogation are expected to make only a relatively small contribution to overall NOx emissions from the LCP sector.
Furthermore, the allowance of a 600mg/Nm3 ELV is also consistent with the technical difficulty that some older boilers might have of fitting OFA, due to the generally smaller sizes of such boilers.
5.1.3 Cost-effectiveness of various NOx abatement measures The main attraction to operators of the low load factor derogation appears to be from 2016, when the ELV that is set (450mg/Nm3) would not necessarily require the fitting of SCR.
For example coal reburn or deep staged OFA (380mg/Nm3, with low NOx burners and combustion optimisation) would be potentially suitable techniques to comply with this ELV, even taking into account reasonable variability in coal types. The level at which the ELV beyond 2016 has been set, therefore appears to be a sensible level that should trigger the fitting of advanced ‘primary’ NOx measures.
These will be relatively more expensive in terms of �/t abated than the same measures for plants with higher load factors, as shown in Table 5.1. Requiring SCR for these plants would also result in higher marginal abatement costs than SCR for higher load factor plants, and would most likely be uneconomic in the first place, with the most likely compliance response being the bringing forward of plant closure.
Table 5.1 Differences in marginal abatement costs for NOx control for plants at different load factors (Note 1)
Additional measure
Achievable NOx level (mg/Nm3)
�/t abated @ 60% LF
�/t abated @ 23% LF
�/t abated @ 17% LF
Boosted overfire air (OFA) (in addition to LNB) 500 532 1387 1877
Coal reburn (in addition to LNB) 380 1936 3560 4489
SCR (in addition to LNB) (Note 2) <200 1859 4037 5283
Final Report 115
h:\projects\em-260\10000 projects\10819 ec lcpd\final report\final report 05225.doc
July 2005
Notes
1. Based on emissions abatement and unit cost data from JEP (2001)
2. The marginal abatement cost for SCR in this table is lower than in Table 4.3 because in this table it does not include pre-existing OFA. Pre-existing OFA reduces baseline emissions and the scope for additional reductions, and hence increases �/t abated figures.
5.1.4 Summary • At the present time it is difficult to foresee a significant number of plants seeking to
qualify for the low load factor derogation allowing less stringent NOx ELVs. This is due to economic constraints of operating at very low load factors combined with only a limited relaxation in emission standards (for the period to 2016). As such, plants covered by this derogation are expected to make only a relatively small contribution to overall NOx emissions from the LCP sector.
• Furthermore, until 2016, the slightly more relaxed ELV appears sensible in making provision for potential technical difficulties of older (and potentially low load factor) boilers fitting OFA. Beyond 2016, ELVs should still trigger advanced primary NOx abatement measures, which would be an appropriate measure for very low load factor plants, rather than SCR which is likely to have high marginal abatement costs for these plants.
• However, it would be recommended that a more accurate indication of the potential uptake of this derogation is sought in 2008, to assess how significant the derogation is. Following this a further review could be undertaken of the potential need to tighten the ELVs from 2016 for low load factor plants, based on the information available at that time on achievable emission levels for advanced primary NOx measures (eg OFA, reburn, etc).
5.2 Potential inclusion of offshore gas turbines in the LCPD
5.2.1 Introduction The current LCPD excludes from its scope gas turbines used on offshore platforms. In contrast, onshore gas turbines licensed from 27 November 2002, and with a thermal input of at least 50MW, are included within the scope of the directive. This section provides supporting information related to the potential justification, if any, for inclusion of offshore gas turbines (of at least 50MWth) within the scope of the directive. This section is specifically concerned with NOx emissions, to be consistent with the pollutant of concern for gas turbines in the current LCPD, and to reflect the dominant LCPD pollutant from this type of plant.
5.2.2 Relative significance of NOx emissions from offshore gas turbines
Overview of sector Of the EU Member States, the country with the most significant number of offshore gas turbines is the UK. Other Member States operating offshore gas turbines include the Netherlands,

Final Report 116
h:\projects\em-260\10000 projects\10819 ec lcpd\final report\final report 05225.doc
July 2005
Germany and Denmark, although the numbers operated by these countries are much smaller than for the UK.
In addition to the UK, Norway is the other significant operator of offshore gas turbines in European waters. Whilst Norway is not a member of the EU, it requires its plants to operate to the standards given in European Directives including the IPPCD and the LCPD. Therefore, any changes to the LCPD to bring offshore gas turbines into its remit might also affect Norwegian plants.
There are estimated to be around 270 offshore gas turbines (of at least 50MWth) in the North Sea (EC, 2004). According to the International Association of Oil and Gas Producers (OGP) (2004b), about 130 gas turbines (of at least 50MWth) are operated on platforms in the UK Continental Shelf (UKCS), and about the same number in Norway.
These are mostly fuelled by gas produced from the field under operation.
It is estimated (EC, 2004) that 44% of the turbines operated offshore are “dual fuel”, which can burn either gas or diesel. This type of plant is generally used to generate electricity for activities on board a platform. Diesel is normally only used for non-routine operations or emergencies, eg when the gas production has shut down. Diesel is also used for start-up when only a limited amount of natural gas is available.
The remaining 56% of plants burn only gas, and are used primarily for mechanical drives, such as gas compression.
There are three basic types of industrial gas turbines used on offshore platforms: aero-derived gas turbines, dedicated industrial gas turbines and heavy duty gas turbines. Aero derivatives are widely used for gas and oil pumping, heavy duty machines are used mainly for electrical power generation and the dedicated industrial turbines span both sectors.
Business as usual emissions Oil and natural gas production in Europe has reached a mature stage of development. Consequently, a growing number of platforms will be taken out of service and on balance a lower level of overall emissions is expected to be produced (OGP, 2004b). According to a survey reported by UKOOA (2004), the forecast number of UK offshore gas turbines (of at least 50MWth) is given in Table 5.2. This table also presents UKOOA’s estimates of NOx emissions from these turbines, together with the estimated emissions from all EU25 power plants and district heating plants according to the RAINS Web CP_CLE_Aug04 scenario.

Final Report 117
h:\projects\em-260\10000 projects\10819 ec lcpd\final report\final report 05225.doc
July 2005
Table 5.2 Estimated number of existing UK offshore gas turbines (of at least 50MWth) and their corresponding NOx emissions according to UKOOA
2004 2010 2015 2020
No of turbines 119 101 68 29
Estimated NOx emissions from gas turbines of at least 50MWth (kt)
37 (Notes 1, 2)
34 22 10
NOx emissions from EU25 power plants and district heating plants according to RAINS Web CP_CLE_Aug04 scenario (kt)
1210 801
Estimated percentage of EU25 NOx emissions from power plants contributed by offshore gas turbines
3% 1%
Source: UKOOA
Notes
1. 2003 data
2. For information, 2002 emissions of NOx from offshore facility operations on the Norwegian Continental Shelf were 37kt from offshore facilities (NPD, 2004) which appears consistent with the emissions estimates for the UK.
It is anticipated that there will be few new large installations developed on the UKCS that will significantly change this forecast. As such, inclusion of potential new large installations is not expected to result in a significant increase in the projected emissions shown in Table 5.2.
As can be seen from Table 5.2, according to UKOOA’s emissions projections, the UK’s offshore gas turbines are expected to contribute a relatively small and decreasing share of overall NOx emissions from LCPs (from 3% in 2010 to 1% in 2020). Allowing for those operated by other Member States, there is not expected to be a significant increase above these figures.
5.2.3 Additional abatement measures for offshore gas turbines
Introduction Offshore gas turbines operate in a more complex and potentially hazardous environment than equivalent onshore gas turbines. Space and weight are at a premium and undue complexity is avoided. The gas used in these turbines varies both in composition and calorific value, from field to field and, within a field, over time.
Overview of potential additional measures A brief overview of potential additional abatement measures for NOx for offshore gas turbines is given below.
• Water injection. This requires the injection of demineralised water into the combustion system to reduce flame temperature and hence reduces NOx. However, the

Final Report 118
h:\projects\em-260\10000 projects\10819 ec lcpd\final report\final report 05225.doc
July 2005
requirement for large quantities of demineralised water (over 100 tonnes per day for a large gas turbine) preclude this from offshore use;
• Selective Catalytic Reduction (SCR). This measure takes up a significant amount of space and is relatively heavy. It also presents health and safety issues related to the storage and handling of ammonia. SCR has therefore not yet been applied offshore; and
• Dry Low NOx premix burners (DLN). This measure controls the flame temperature within a narrow band by premixing a lean air / fuel mixture followed by injection of additional air at a later stage to complete combustion and to provide further cooling. This achieves a lower flame temperature and therefore lower NOx emissions. According to the draft LCPD BREF (EC, 2004), a normal gas turbine has at full load an emission of about 360mg/Nm3 NOx (at 15% oxygen), while the DLN version produces, at similar service, around 50mg/Nm3, measured under ISO conditions, although is associated with slightly higher carbon monoxide and unburned hydrocarbon emissions. Furthermore, DLN is not always suitable for start up or operation at part load, as it is difficult to maintain staged combustion under these operating conditions.
The measure considered to be most suitable for reduction of NOx emissions at offshore gas turbines at present is DLN.
Applicability of DLN technology According to the draft LCPD BREF (EC, 2004), DLN is identified as a technique to be considered in the determination of BAT for offshore installations although it states that dual fuel turbines have not yet field experience, and DLN technology is not retrofittable to all turbine types.
A summary of key issues related to the applicability of DLN technology is presented below.
Operational experience
The majority of experience with DLN turbines on offshore installations has been gained in the Norwegian sector. According to UKOOA (2004), in all cases operators have experienced a reduction in reliability (leading to more frequent process shutdowns and higher operating costs) and problems arising from the complexity of the DLN control system.
Rate of change of fuel gas composition
The engine control system of a DLN turbine can only accept a gas fuel with a molecular weight composition that is tightly controlled. Similarly the rate of change of gas composition must be controlled to avoid flameout. Offshore operations cause particular problems as the fuel gas may change significantly at short notice as numerous wells with different compositions are brought on line or are stopped or where pressures may vary.
Part load operation
Offshore gas turbines typically operate in an environment of changing load demand due to changing production profiles from the reservoir over time and the need for redundancy to ensure continuous production even on failure of one unit. Due to this, most gas turbines operate in part load for a large part of their life. At part loads (typically 50 or 70% load depending on the engine manufacturer and model), DLN gas turbines must be controlled differently to maintain

Final Report 119
h:\projects\em-260\10000 projects\10819 ec lcpd\final report\final report 05225.doc
July 2005
stable engine performance. This change in engine control will alter emissions performance. Furthermore, current LCPD emission limits apply only to operating loads above 70%. As such, current LCPD emission limits may not apply for a large part of the engine’s life if the LCPD were applied offshore. An aero-derivative DLN gas turbine in general has poorer part-load efficiency than the non-DLN version due to bleeding off excessive compressor air, and will therefore give higher CO2 emissions (OGP, 2004a). The increase in CO2 emissions due to lower part load efficiency of DLN technology compared to conventional gas turbines has been estimated at 1 to 2%.
Applicability for retrofitting
It is potentially possible to retrofit DLN, although only two plants have had DLN retrofitted to date (EC, 2004), whereas 32 new Norwegian plants have had DLN installed (NPD, 2004).
Although DLN variants are designed to occupy the same footprint as the standard turbine, they may have protruding combustion chambers making adequate maintenance difficult and may even preclude installation without modification of the acoustic enclosure.
According to OGP (2004a), in most cases production must be reduced considerably, or fully, during the retrofitting period. This is currently considered to require approximately 25 – 50 days of unit downtime. On platforms with limited bed capacity, this period will be even longer.
Furthermore, whilst all gas turbine manufacturers have developed DLN variants for their most popular models, certain models in offshore use are considered obsolete and the investment required to provide a DLN variant has not been made.
Applicability for dual fuel applications
The DLN control system is more complicated if there is also a need to cater for liquid fuel as required for power generation duty in start up or emergency situations. The controls have to provide for an automatic changeover between the liquid and gas fuel to provide security of supply. Not all manufacturers offer dual fuel, and there have been operational problems with those that have supplied this variant.
Some dual fuel turbines exhibit regular ‘coking’ of the burners causing fuel jet blockage to occur. Consequently, burners have often to be changed, with potential impacts on production, and resulting in additional operating costs (UKOOA, 2004). For example, one type of dual fuel DLN gas turbine is installed within the Dutch sector in an offshore installation producing from a gas field. The gas turbines have been operating for less than a year but have suffered some major problems with burners, with coking of the burners observed after short periods in service.
Furthermore, dual-fuel retrofitting requires twice as many days of unit downtime compared with single fuel retrofitting (OGP, 2004a).
Fuel gas quality and composition
Fuel gas quality and composition often varies significantly between offshore platforms. Some offshore applications offer gas fuels with a composition that could not be utilised in a DLN-equipped gas turbine due to the combustion properties of various fuel constituents and fundamental DLN design constraints. DLN technology is most applicable to gas fired turbines using a gas of reasonably acceptable quality and composition (EUnited Turbines, 2005).

Final Report 120
h:\projects\em-260\10000 projects\10819 ec lcpd\final report\final report 05225.doc
July 2005
Costs of DLN technology Indicative capital costs of DLN technology for offshore gas turbines are summarised in Table 5.3.
Additional operating costs are not quoted in this table, as they are likely to be extremely application specific. In some cases these may be significant and could include loss of income during modification; cost of reduced reliability; higher maintenance costs and higher fuel consumption costs.
Table 5.3 Indicative additional capital costs of DLN technology for offshore gas turbines
New or retrofit Capital cost data from various sources (Note 1)
New US$1m (�0.8m) per unit
New £1m (�1.4m) per turbine
New £0.5m to £1m (�0.7m to �1.4m) per turbine
New �1m
Retrofit US$9m (�7.5m) to US$65m (�54m) (Note 2)
Retrofit £2m to £5m (�2.9m to �7m) per turbine
Retrofit £1.7m per turbine (�2.4m) (low range estimate)
Retrofit �5m (Note 3)
Notes
1. Excluding the cost of package and platform modifications unless otherwise specified.
2. This wide range is for plants which are partly prepared for DLN, up to those older plants which would require huge modifications (including package and platform modifications) to allow the slightly larger DLN to be retrofitted. It appears that this data relates to a whole platform rather than an individual turbine.
3. This figure is based on the mid range of estimates. However, the range of the available data and the sensitivity of the costs to site specific factors results in potentially significant uncertainty around this estimate.
Figures from OGP (2004a) indicate that the estimated additional capital cost (excluding package and platform modifications) of DLN compared to a standard turbine is:
• 20% additional cost for a new DLN turbine (plus potential platform modifications);
• 60% additional cost for a retrofit DLN turbine (plus potential package and platform modifications, with extremely high additional capital costs for turbines that have not been prepared for retrofitting DLN technology).
In addition to this, OGP estimate the cost associated with downtime and resulting loss of production for retrofitting is approximately 25-50 days (OGP, 2005).
Clearly the above table indicates a broad range in additional costs for DLN technology. Applying the capital cost figures derived in the above table, the average emissions per turbine in Table 5.2 and the abovementioned estimated abatement efficiency of DLN, the estimates of the marginal abatement costs for DLN are as shown in Table 5.4.

Final Report 121
h:\projects\em-260\10000 projects\10819 ec lcpd\final report\final report 05225.doc
July 2005
Table 5.4 Marginal abatement costs of DLN for the offshore gas turbine sector
Measure Marginal abatement cost for NOx (�/t) (Note 1)
DLN (New gas turbine) 310
DLN (retrofit) 1570 Note
1. Figures rounded to nearest �10/t. Based on 4% discount rate, 15 year economic life.
2. Figures exclude potential additional operating costs as indicated above. These could be potentially high for retrofitting, although will be dependent on site specific issues. As such, the quoted marginal abatement costs are expected to be underestimates.
5.2.4 Summary
• According to industry estimates, projected NOx emissions from the offshore gas turbine sector are expected to represent a relatively small and decreasing share of overall NOx emissions from the EU25 LCP sector from 2010 to 2020, although there is greater uncertainty in the potential contribution to be made by new gas turbines.
• The available information indicates that the most applicable NOx abatement technology for offshore gas turbines is DLN.
• For dual fuel gas turbines, DLN does not appear to be proven at the current time for the offshore sector due to operational problems experienced in practice and by fuel constraints.
• For single fuel gas turbines, DLN does not appear to be proven where the field gas is of variable or inappropriate composition (OGP, 2005).
• Within the offshore sector, this technology is most applicable to new single fuel (gas fired) gas turbines using gas with a reasonably steady and acceptable composition. This technology is estimated to have a low range cost of approximately �310/t NOx abated. Whilst this is well below the average marginal cost for ‘beyond BAU’ NOx measures (according the RAINS Web cost curves described in Section 4), potential impacts of reduced reliability, higher maintenance and higher fuel consumption costs would increase this cost, although these elements are difficult to estimate, being very application specific.
• Furthermore, whilst retrofitting DLN technology has been undertaken in practice in a small number of offshore examples, experience shows it to be significantly more expensive than the application of this technology to new gas turbines (a low range estimate of the marginal cost is �1570/t) due to the potential requirement for modifications to other equipment and the potential impacts on production during the retrofitting period. Furthermore, it is possible that not all gas turbine types in operation will be upgradable to DLN technology.

Final Report 122
h:\projects\em-260\10000 projects\10819 ec lcpd\final report\final report 05225.doc
July 2005
5.2.5 References
• Entec, 2000. The determination of the implications of including offshore gas turbines within an emission reduction strategy for existing plant under the revised Large Combustion Plant Directive, confidential report for DEFRA.
• EUnited Turbines, 2005. EUnited Turbines comments on Draft Final Report, July 2005.
• European Commission, 2004. Integrated Pollution Prevention and Control (IPPC) Draft Reference Document on Best Available Techniques for Large Combustion Plants, draft dated November 2004.
• Norwegian Petroleum Directorate (NPD), 2004. Personal communication, 5/4/04.
• OGP, 2004a. OGP response to Entec questionnaire. November 2004.
• OGP, 2004b. OGP statement on Large Combustion Plant Directive – Exclusion of Offshore Gas Turbines, November 2004.
• OGP, 2005. OGP comments on Draft Final Report, June 2005.
• UKOOA, 2004. UK Offshore Operators Association Briefing Paper. Review of the Large Combustion Plant Directive and the Exclusion for Turbines on Offshore Oil and Gas Installations.
5.3 Monitoring aspects
5.3.1 Comments on measurement requirements This brief section present comments from Member States on the measurement requirements of the LCPD, which are set out in Article 14. These relate both to ELVs described in Annexes III to VII, as well as details of the methods of measurement, presented in Annex VIII. Figure 5.1 shows how each of these three parts link together.
Figure 5.1 Application of various parts of the directive

Final Report 123
h:\projects\em-260\10000 projects\10819 ec lcpd\final report\final report 05225.doc
July 2005
The following table presents the comments returned by policy makers with regard to measurement requirements of the LCPD.
Table 5.5 Comments on measurement requirements
Country Comments
Austria No comments
Belgium No comments
Denmark No response received
Finland No comments
France The provisions concerning quality assurance of automated measuring systems should refer to CEN standards in the course of adoption
Germany No comments
Greece No response received
Ireland No response received
Italy No comments
Netherlands No response received
Portugal The operators of existing LCPs are claiming that the requirements for continuous emissions measurement (Annex VIII, Part A (6)) are excessive once they don’t have to prove compliance with ELV
Spain No response received
Sweden A potential problem has been raised with plants/units running for a very short time. It is suggested that there could be a clause saying that plants/units running less than a certain number of hours are excluded from the general measurement requirements. Then it could be up to the competent authorities to decide, taking the specific circumstances into account. It might also be appropriate to question the need for “small” units (being a part of a plant) to measure continuously. It would have been easier if the measurement requirements had been directly coupled to “units”. Then it might be said: Units < xx MW excl and Units running less than xx hours excl (competent authorities etc).
United Kingdom A related point has been made in relation to the requirements of Article 7 which states that “in no circumstances shall the cumulative duration of unabated operation in any twelve month period exceed 120 hours”. The level of reliability that this requires (over 98%) is higher than the claimed levels that current equipment is designed for (95%). No comments on measurement requirements.
Cyprus The importance of ‘self-monitoring’ is emphasized. Potential difficulties occur with monitoring for different pollutants – although specific details not provided.
Czech Republic No comments
Estonia No comments
Hungary No response received
Latvia From the operator’s point of view, guidelines are necessary with definite conditions of the monitoring points, monitoring tools, methods, estimation methods, verification demands and reporting forms. Guidelines must be drawn up considering local conditions.
Lithuania No comments
Malta No comments
Poland No response received
Slovak Republic No response received
Slovenia No comments
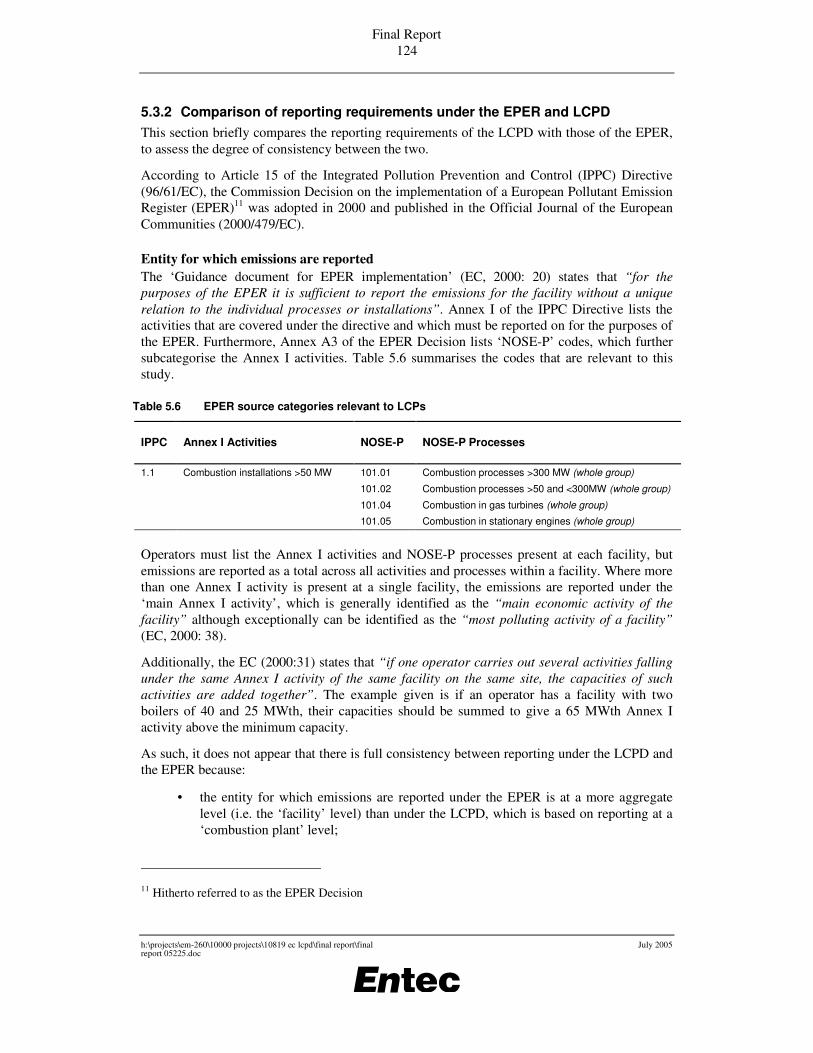
Final Report 124
h:\projects\em-260\10000 projects\10819 ec lcpd\final report\final report 05225.doc
July 2005
5.3.2 Comparison of reporting requirements under the EPER and LCPD This section briefly compares the reporting requirements of the LCPD with those of the EPER, to assess the degree of consistency between the two.
According to Article 15 of the Integrated Pollution Prevention and Control (IPPC) Directive (96/61/EC), the Commission Decision on the implementation of a European Pollutant Emission Register (EPER)11 was adopted in 2000 and published in the Official Journal of the European Communities (2000/479/EC).
Entity for which emissions are reported The ‘Guidance document for EPER implementation’ (EC, 2000: 20) states that “for the purposes of the EPER it is sufficient to report the emissions for the facility without a unique relation to the individual processes or installations”. Annex I of the IPPC Directive lists the activities that are covered under the directive and which must be reported on for the purposes of the EPER. Furthermore, Annex A3 of the EPER Decision lists ‘NOSE-P’ codes, which further subcategorise the Annex I activities. Table 5.6 summarises the codes that are relevant to this study.
Table 5.6 EPER source categories relevant to LCPs
IPPC Annex I Activities NOSE-P NOSE-P Processes
1.1 Combustion installations >50 MW 101.01 Combustion processes >300 MW (whole group)
101.02 Combustion processes >50 and <300MW (whole group)
101.04 Combustion in gas turbines (whole group)
101.05 Combustion in stationary engines (whole group)
Operators must list the Annex I activities and NOSE-P processes present at each facility, but emissions are reported as a total across all activities and processes within a facility. Where more than one Annex I activity is present at a single facility, the emissions are reported under the ‘main Annex I activity’, which is generally identified as the “main economic activity of the facility” although exceptionally can be identified as the “most polluting activity of a facility” (EC, 2000: 38).
Additionally, the EC (2000:31) states that “if one operator carries out several activities falling under the same Annex I activity of the same facility on the same site, the capacities of such activities are added together”. The example given is if an operator has a facility with two boilers of 40 and 25 MWth, their capacities should be summed to give a 65 MWth Annex I activity above the minimum capacity.
As such, it does not appear that there is full consistency between reporting under the LCPD and the EPER because:
• the entity for which emissions are reported under the EPER is at a more aggregate level (i.e. the ‘facility’ level) than under the LCPD, which is based on reporting at a ‘combustion plant’ level;
11 Hitherto referred to as the EPER Decision

Final Report 125
h:\projects\em-260\10000 projects\10819 ec lcpd\final report\final report 05225.doc
July 2005
• under the EPER, emissions from 2 or more combustion plants below 50MWth at the same facility that together equated to over 50MWth, would lead to the registration of emissions for a ‘combustion installation >50MWth’; and
• if the main economic activity of the facility was not a ‘combustion installation >50MW’, then emissions from LCPs at that facility would not be reported in that category.
Reporting of national totals The EPER Decision requires Member States to provide an overview report of the national totals of all reported emissions for each of the source categories of the main Annex I activities and corresponding NOSE-P codes. There will be some degree of overlap between the total emissions reported under the Annex I activities relating to combustion plants >50 MW, and the requirements of the LCPD (as set out in Annex VIII B). However, as described above, some combustion plants >50 MW may not be the main Annex I activity at any given facility, e.g. at a petroleum refining plant. These emissions will contribute to the total emissions reported under a separate Annex I activity.
Emission determination methodology The reporting requirements of the EPER are such that an operator need only report the total emissions of the facility for pollutants where certain threshold values are exceeded. These thresholds are listed in Annex A1 of the EPER Decision. Operators may report emissions as:
• ‘measured’, from direct monitoring (either continuous or discontinuous) using standardised or accepted methods, e.g. CEN standards;
• ‘calculated’ from activity data and emission factors using published methods; or
• ‘estimated’ using expert judgement rather than publicly available data.
The methods used for the determination of emissions at individual sites can vary, and is largely dependent on the permits issued by the competent authority under the IPPC Directive. For example, in the UK, the Process Guidance Note published by the Environment Agency (2000) states that continuous monitoring should be used where available and appropriate and cites the LCPD requirements for continuous monitoring under Article 14(1) and (4). However, it goes on to list a number of factors that can be taken into consideration when determining the appropriateness of continuous monitoring. These include the size of the process, the true value of monitored versus calculated data and the usefulness of continuous measurements, particularly when the release is time dependent (e.g. installation of a catalyst)
As this UK example shows, there may potentially be a mismatch between the method of emissions estimation required for reporting under the EPER and the more prescriptive monitoring requirements set out in the LCPD.
5.3.3 References Environment Agency (EA) (2000) IPC Guidance Note: Combustion Processes. S3 1.01. November 2000.
European Commission (EC) (2000) Guidance document for EPER implementation. According to Article 3 of the Commission Decision of 17 July 2000 (2000/479/EC) on the implementation

Final Report 126
h:\projects\em-260\10000 projects\10819 ec lcpd\final report\final report 05225.doc
July 2005
of a European Pollutant Emission Register (EPER) according to Article 15 of Council Directive 86/61/EC concerning Integrated Pollution Prevention and Control (IPPC). November 2000.

Final Report 127
h:\projects\em-260\10000 projects\10819 ec lcpd\final report\final report 05225.doc
July 2005
6. Effects of Differences between Community Environmental Standards for the LCP Sector
6.1 Introduction This section investigates the effects of differences between the Community environmental standards for the LCP sector on competition in the energy market, focussing particularly on where there is expected to be a delay in meeting the LCPD requirements due to derogation allowances for new Member States. Of the new Member States in this category, Poland has by far the most significant LCP sector and the most substantial derogation allowances hence the examples in this section focus on Poland. In addition, this section gives brief consideration to the effects of differences in standards on the environment.
The key focus of this section on the impacts on competition in the energy market does not exclude the fact that there are other economic impacts, however the consideration of these is outside the scope of this study.
6.2 Effects on competition in the energy market
6.2.1 Introduction This brief assessment of the degree to which differences in environmental standards in the LCP sector affect competition in the energy market considers the following points:
1. Level of physical and administrative interconnection;
2. Extent of market12 and supply market13 opening;
3. Levels of market maturity and development;
4. Power generation costs;
5. Abatement costs; and
6. EU generation mix and extent of reliance on LCPs.
The first three points determine the level of exposure possible between LCP generators; the extent to which an effect of differences in standards is felt within the market depends initially on the extent to which producers with different levels of control actually have the opportunity to trade. Clearly, this may change over time depending on the extent of interconnection and
12 The extent to which the market is open to market entries and competitors.
13 The extent to which consumers are able to choose their supplier.

Final Report 128
h:\projects\em-260\10000 projects\10819 ec lcpd\final report\final report 05225.doc
July 2005
market development, resulting in the potential for competitive (dis)advantage relating to different levels of environmental control to develop as markets open.
Points 4 and 5 describe internal influences on production costs. Point 6 considers the economic significance of the LCP sector within the overall generation mix. The net effect of different environmental standards is therefore proportionate to other cost components and market factors.
Figure 6.1 presents this overall approach for assessment of the extent of influence differences in environment standards may exert upon competitiveness in the internal market.

Final Report 129
h:\projects\em-260\10000 projects\10819 ec lcpd\final report\final report 05225.doc
July 2005
Figure 6.1 Differences in environmental standards - a context for assessing effects on competition
LCP Sector -competitiveness
Capital and O&M cost
Fuel prices and taxation
Stringency/ flexibility of environmental standard
Internal (cost)
Domestic market
conditions
General level of international market development
Proportion of total cost
Level of market opening within country
Political
Differences in national policy towards, or support of
generation types
Preconditions
Level of exposureto international
competitors
Average cost of production
Average cost ofabatement
Support of certain generation
Interconnection/physical network
development
Administrative network
development
Reliance on coal/oil fired generation
Unbundling
Internationalmarket
conditions
Level of supply market opening (customer choice)

Final Report 130
h:\projects\em-260\10000 projects\10819 ec lcpd\final report\final report 05225.doc
July 2005
6.2.2 Interconnection
Current levels of interconnection Interconnection is the basic provision for international or inter-regional trade in the energy sector. Within the European region, two main blocks of interconnection exist (as defined by the Union for the Coordination of Transmission of Electricity), UCTE 1 and 2, spanning continental and Eastern European countries and including interconnection to North African countries14. The UCTE network was split into these two disconnected blocks15 since 1991 as a consequence of the war in ex-Yugoslavia, resulting in Greece also being disconnected from the central UCTE system. Reconnection of the two systems is planned to occur within 2004.
The Nordic countries (Denmark, Sweden, Norway, Finland and Iceland) co-operate under the Nordel body, the function of which is to develop and create the conditions for a harmonised Nordic energy market (Eurelectric/UCTE 2002). The UK grid is connected to the French grid via the England-France Interconnector with ownership shared between National Grid and Réseau de Transport d'Electricité (RTE).
The current available capacity of European interconnection is insufficient to satisfy demand for exchange within a single market, leading to congestion and ‘missing links’ between demand and supply capacity (Eurelectric/UCTE 2003). The current picture for interconnection within the EU15 and New Member States is represented within Figure 6.2, which describes a period of trading within the UCTE regions.
14 Morrocco, Algeria and Tunisia, Eurelectric/UCTE (2002)
15 UCTE 1 comprises all EU15 countries (except the UK, Ireland, Sweden, Denmark, and Finland), the Czech Republic, Slovenia, Poland, Slovakia, Hungary and Croatia and includes connection to Morocco, Tunisia and Algeria. UCTE2 comprises Bosnia Herzegovina, Serbia, Montenegro, Former Yugoslav Republic of Macedonia, Greece, Bulgaria, Romania and Albania.

Final Report 131
h:\projects\em-260\10000 projects\10819 ec lcpd\final report\final report 05225.doc
July 2005
Figure 6.2 Current trading Partnerships - physical energy flows (GWh), April - September 2003
Extracted from UCTE (II 2003).

Final Report 132
h:\projects\em-260\10000 projects\10819 ec lcpd\final report\final report 05225.doc
July 2005
Future levels of interconnection Opportunities for competition between LCP-sourced electricity would be facilitated by measures to overcome geographical barriers through physical and administrative measures. It is most likely that interconnection will occur where a need based on economic grounds is identified through identification of demand and supply gaps, and/or where broader goals of supply security exist.
The European Commission’s first communication on energy infrastructure (2001) identified an interconnection target equivalent to 10% of each member state’s installed capacity. By 2003, this target had not been met in all Member States and the Commission stated in its Communication on energy infrastructure and security of supply that it would not be considered an adequate level of interconnection to support the internal market where barriers to market entry in domestic markets persist (EC, 2003). Higher levels of interconnection may therefore be needed in order to encourage competition in markets where conditions that create low competitiveness persist.
Insufficient import capacity limits the extent to which domestic suppliers are competitively challenged and thereby allows high market concentration to persist. There is significant concern over the development of competition in the electricity market (specifically in relation to high concentration and low interconnection capacity) among major consumers particularly in countries with relatively high concentration such as Belgium, Italy, Germany, Austria and Finland (EC, 2003). It is observed that these include some countries with tighter standards for LCPs than the LCPD.
The Commission has also put forward an action plan setting priority projects following identification of ‘bottleneck’ congestion points. Implementation of investment programmes agreed by the regulators will take place between 2005-2010 (EC, 2004). Specifically, critical bottlenecks were identified16 between:
• France and Spain;
• France and Belgium;
• Belgium/Germany and the Netherlands;
• West Denmark and Germany;
• France/Switzerland/Austria(/Slovenia) and Italy;
• Norway and Sweden;
• The UK and continental Europe;
• Ireland and the UK;
• Greece and the UCTE 1 system.
Furthermore, in outlining cross border interconnection priorities, the Commission’s revised Trans European Networks guidelines (2003), include a list of priority project areas as follows:
16 By EC (2001) and Eurelectric/UCTE (2002).

Final Report 133
h:\projects\em-260\10000 projects\10819 ec lcpd\final report\final report 05225.doc
July 2005
• France — Belgium — Netherlands — Germany: electricity network reinforcements in order to resolve congestion in electricity flow through the Benelux.
• Borders of Italy with France, Austria, Slovenia and Switzerland: increasing electricity interconnection capacities.
• France — Spain — Portugal: increasing electricity interconnection capacities between these countries and for the Iberian peninsula and grid development in island regions.
• Greece — Balkan countries — UCTE System: development of electricity infrastructure to connect Greece to the UCTE System.
• United Kingdom — Continental Europe and Northern Europe: establishing/increasing electricity interconnection capacities and possible integration of offshore wind energy.
• Ireland — United Kingdom: increasing electricity interconnection capacities and possible integration of offshore wind energy.
• Denmark — Germany — Baltic Ring (including Norway — Sweden — Finland — Denmark — Germany): increasing electricity interconnection capacity and possible integration of offshore wind energy.
In continuation of the TEN-Energy project, the Commission provides Community 2004 budget allocation for energy network17 projects which have a positive effect on security of supply or the internal market. Funding criteria follows the guidelines set out in Decision No 1229/2003/EC defining energy network projects of common interest including both cross border interconnection and networks within member states. 10% of the recent 2004/1 allocation18 for new projects was designated for new member states.
6.2.3 Administrative network developments In order for energy markets in the EU and wider market to function in the same way as a national market, in combination with greater interconnection, a co-operative system of exchange between Transmission System Operators (TSOs) would need to be developed, including further integration of:
• trading regulations;
• arrangements around the degree of market opening;
• congestion management systems; and
• transmission tariffs (EC, 2004).
17 Refers to both gas and electricity networks.
18 EUR 21.5 million is available for this call for proposals from the 2004 budget, including EUR 2.15 million for the new Member States.

Final Report 134
h:\projects\em-260\10000 projects\10819 ec lcpd\final report\final report 05225.doc
July 2005
The EC’s Medium Term Vision for the Internal Electricity Market suggests that a period of regionalised integration of markets may develop, prior to full harmonisation within a single market. Regional market arrangements and rules will most likely be standardised at EU level.
EC indicative timetables indicate that:
• by 2006, market participants should have access to a relevant functioning power exchange;
• by 2008 regionalised wholesale markets are to be introduced;
• between 2008-2010, integration of intra-day and balancing markets; and
• beyond 2010, regional groupings will be progressively integrated (EC, 2004).
6.2.4 Internal market conditions Once the physical interconnection and administrative network is in place, the domestic market conditions play an important role in allowing competition between domestic and import suppliers from any source to exist. These issues are addressed within the European Union by the implementation of Electricity Directive (2003/54/EC).
Key indicators used within DG TREN’s third benchmarking report on the implementation of the internal electricity and gas market (2004) include:
• level of market opening;
• unbundling of transmission and distribution system operators; and
• level of market concentration.
This highlights areas where competition will not develop satisfactorily due to relatively low levels of market opening and/or unbundling and/or high levels of concentration.
Further, the Commission’s notes for the implementation of the Electricity directive 2003/54/EC includes guidance on:
• unbundling19
• level of supply market opening20
• labelling of product fuel mixes21
19 Unbundling refers to the process of sufficiently separating the interests of distributing system operators from generation or supply interests in order to avoid discriminatory practice.
20 Supply market opening refers to the process of allowing consumers to genuinely choose their supplier.
21 The Electricity Directive (2003/54/EC) introduces the obligation on suppliers to specify the fuel mix and its related environmental impact of the electricity they sell to final consumers.
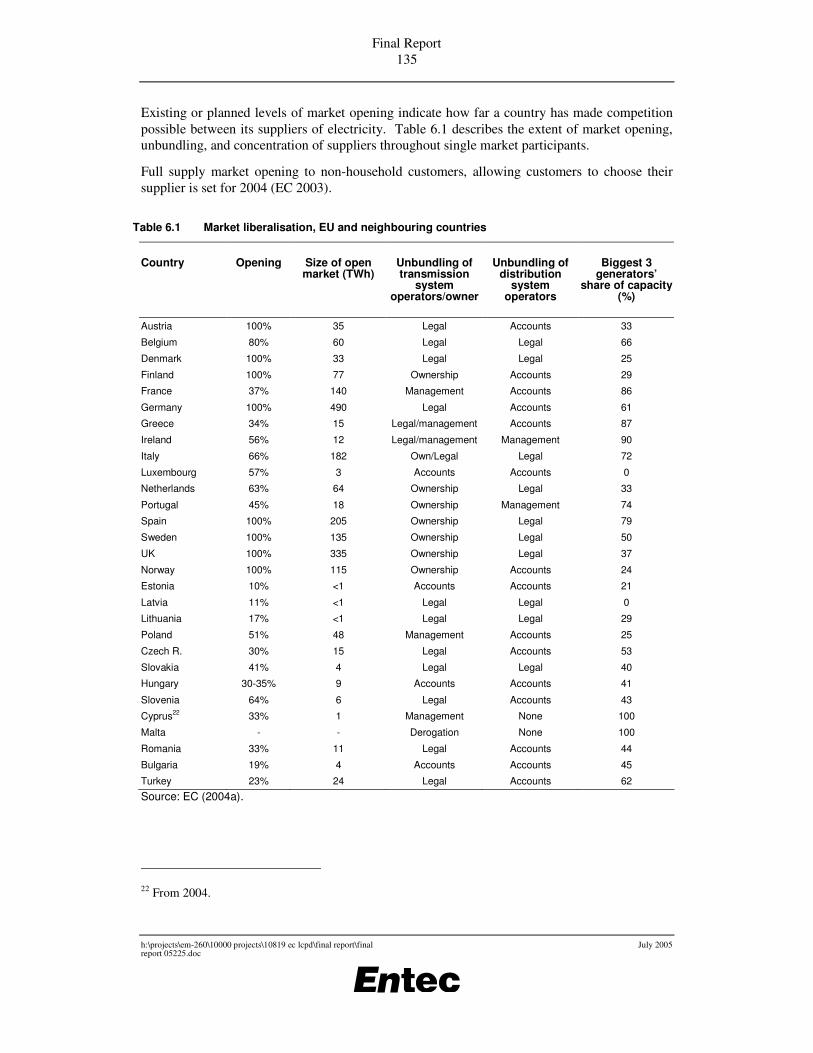
Final Report 135
h:\projects\em-260\10000 projects\10819 ec lcpd\final report\final report 05225.doc
July 2005
Existing or planned levels of market opening indicate how far a country has made competition possible between its suppliers of electricity. Table 6.1 describes the extent of market opening, unbundling, and concentration of suppliers throughout single market participants.
Full supply market opening to non-household customers, allowing customers to choose their supplier is set for 2004 (EC 2003).
Table 6.1 Market liberalisation, EU and neighbouring countries
Country Opening Size of open market (TWh)
Unbundling of transmission
system operators/owner
Unbundling of distribution
system operators
Biggest 3 generators’
share of capacity (%)
Austria 100% 35 Legal Accounts 33
Belgium 80% 60 Legal Legal 66
Denmark 100% 33 Legal Legal 25
Finland 100% 77 Ownership Accounts 29
France 37% 140 Management Accounts 86
Germany 100% 490 Legal Accounts 61
Greece 34% 15 Legal/management Accounts 87
Ireland 56% 12 Legal/management Management 90
Italy 66% 182 Own/Legal Legal 72
Luxembourg 57% 3 Accounts Accounts 0
Netherlands 63% 64 Ownership Legal 33
Portugal 45% 18 Ownership Management 74
Spain 100% 205 Ownership Legal 79
Sweden 100% 135 Ownership Legal 50
UK 100% 335 Ownership Legal 37
Norway 100% 115 Ownership Accounts 24
Estonia 10% <1 Accounts Accounts 21
Latvia 11% <1 Legal Legal 0
Lithuania 17% <1 Legal Legal 29
Poland 51% 48 Management Accounts 25
Czech R. 30% 15 Legal Accounts 53
Slovakia 41% 4 Legal Legal 40
Hungary 30-35% 9 Accounts Accounts 41
Slovenia 64% 6 Legal Accounts 43
Cyprus22 33% 1 Management None 100
Malta - - Derogation None 100
Romania 33% 11 Legal Accounts 44
Bulgaria 19% 4 Accounts Accounts 45
Turkey 23% 24 Legal Accounts 62
Source: EC (2004a).
22 From 2004.
Final Report 136
h:\projects\em-260\10000 projects\10819 ec lcpd\final report\final report 05225.doc
July 2005
The Commission identified the following countries23 where conditions relating to implementation of market opening, unbundling and concentration were “unfavourable” for the development of competition:
• Belgium;
• Germany;
• Greece;
• Luxembourg;
• Estonia;
• Czech Republic;
• Slovenia.
Such conditions may be said to reflect market rigidity within importing countries such as Belgium, effectively protecting domestic supply from competition which in turn may maintain domestic supply where cheaper sources might be available on the market.
6.2.5 EU generation mix The significance, within the internal electricity market of a competitive (dis)advantage relating to differences in environmental protection measures depends on the generation profile of a given country, and the extent of reliance on the LCP sector.
Figure 3.1 provides a view of the EU 25 member states’ individual generation mix, whilst Figure 3.2 provides some indication of 2001 proportions of coal and oil generation versus alternative sources in the EU 25.
Figure 3.2 shows that the countries with the greatest capacity to generate electricity from coal and oil fired plants (the key fuel types affected by the LCPD ELVs) are Germany, Greece, Spain, Italy, the UK, Czech Republic and Poland. Therefore, if this is also combined with the physical and administrative capability to trade electricity between other countries, as well as differences in environmental standards, then there is the potential for impacts on markets, subject to relative overall production costs.
Trends in the EU generation mix are also briefly discussed in Section 3.
6.2.6 Potential for electricity trade between countries with different environmental standards
The current situation within electricity trading reflects key rigidities within trade relationships in place within the European region. Table 6.2 displays the import-export balances for all relevant countries.
23 Other countries were not known or undecided (Latvia, Cyprus, Malta). Other categories included ‘favourable’ and ‘moderate’.

Final Report 137
h:\projects\em-260\10000 projects\10819 ec lcpd\final report\final report 05225.doc
July 2005
Table 6.2 Import-export trade balances for electricity* (TWh)
Country 2001 2010 2020
Import Export Bal Import Export Bal Import Export Bal
Austria 14.5 14.4 0.1 na na 3.6 na na 4.4
Belgium 15.8 6.7 9.1 16.1 7 9.1 na na na
Denmark 8.2 8.8 -0.4 na na -0.6 na na 0
Finland 11.8 1.8 10 1.5 0.3 1.2 3.8 0.3 3.5
France (Note 1) 4.2 72.6 -68.4 na na -83.7 na na -83.4
Germany 43.5 44.8 -1.3 na na Na na na na
Greece 3.6 1.1 na 5.3 1.1 4.2 5.9 0.5 5.4
Ireland 0 0.3 0.2 na na Na na na na
Italy 48.9 0.6 48.3 71.4 1.5 69.9 69.3 2 67.3
Luxembourg 6.4 0.7 Na na na 0.9 na na 1
Netherlands 21.5 4.2 17.3 23.5 7.5 16 27 9 18
Portugal 1.3 1.1 0.2 na na 0.2 na na 0
Spain 10.2 6.7 3.5 22.7 17.6 5.1 29.7 23.9 5.8
Sweden 11.2 18.5 -7.3 na na 6.2 na na 5
UK 10.7 0.3 10.4 na na 0 na na 0
Norway 10.7 7.2 3.6 3.9 0 3.9 2.7 0 2.7
Estonia 0.3 0.9 -0.6 na na na na na na
Latvia 4.8 2.9 1.8 1.9 2 -0.1 2.4 2 0.4
Lithuania 0.2 4.2 -4 0 0 0 0 0 0
Poland 4.3 11 -6.7 6.4 11.2 -4.9 6.4 11.2 -4.9
Czech R. 2.6 12.2 -9.5 4.4 5.7 -1.3 4.4 4.4 0
Slovakia 0.8 4.5 -3.7 0 0 0 0 0 0
Hungary 6.9 3.8 3.1 na na 6.1 na na 1.5
Slovenia 0.7 2.3 na 0.7 0.6 0.1 0.9 0.4 0.5
Cyprus 0 0 0 0 0 0 Na na 0
Malta na Na na na na na Na na na
Romania 0.7 2.1 -1.4 0 0 0 0 0 0
Bulgaria 0 7 -7 0 5 -5 0 5 -5
Turkey 4.6 0.4 4.2 na na na Na na na
Source: Eurelectric 2003.
Notes
na: value not available
0 - zero or almost zero
* imports minus exports
Note 1: According to national energy projections this export balance is expected to decrease to zero by 2030 (SGCI, 2005).
Of the Member States with relatively significant levels of coal and oil fired electricity generation (ie the fuel types most potentially impacted by the LCPD), Poland appears to have greatest potential for export from unabated power stations. In the case of Poland, it is noted that

Final Report 138
h:\projects\em-260\10000 projects\10819 ec lcpd\final report\final report 05225.doc
July 2005
surplus energy (exports) is forecast to remain stable towards 202024. 2010 export flows from Poland are forecast into the Czech Republic and Slovakia, with import flows from Sweden, Belarus and the Ukraine (Eurelectric 2003).
6.2.7 Power generation costs
Electricity generation costs excluding abatement costs In a well functioning electricity market, the competitiveness of any type of generation is affected by the relative cost of production and distribution as compared with other generators, and generation types in the market. A summary of data on the costs of generating electricity is shown in Table 6.3. Clearly each cost element is subject to considerable variation depending on the site specific circumstances of the power station, with fuel costs being subject to particularly high variability.
Table 6.3 Summary of costs of generating electricity (� per MWh) (Note 1)
Fully depreciated coal fired pulverised fuel
plant
Fully depreciated coal
fired fluidised bed plant
New coal fired
pulverised fuel plant
New coal fired
fluidised bed plant
New gas fired CCGT plant General costs in public power sector
(Note 3)
Reference RAE, 2004 Generating company,
2004
RAE, 2004 RAE, 2004 RAE, 2004 RAE, 2004 Generating company
2004
CER, 2004 Energo-projekt,
2004
Capital expenditure
0 0 0 15 14 5 N/A 10 N/A
Fuel 17 22 17 17 17 23 28 29 N/A
Operation & maintenance
2 5 3 2 3 2 6 9 N/A
General overhead
2 3 5 2 5 3 2 N/A N/A
Total 22 30 25 38 39 33 N/A 48 30
Notes
1. Costs exclude costs of carbon emissions
2. RAE = Royal Academy of Engineering; CER = Commission for Energy Regulation (Ireland)
3. Including thermal hard coal and lignite power plants and thermal CHP, including CCGT. Figures are for Poland (2003 data), which is of relevance to later parts of this section.
As supported by the above table, the most significant variable cost to a producer of thermal-generated electricity is generally fuel costs. Fuel costs are influenced primarily by:
• differences in quality and quantity of national primary fuel reserves, and consequently the efficiency with which they can be mined and processed;
• differences in the cost of imported primary fuel supplies to users, depending on the cost of importing and transporting fuel to the end-user; and
24 2010 exports at 11.2 TWh (imports 6.4 TWh).
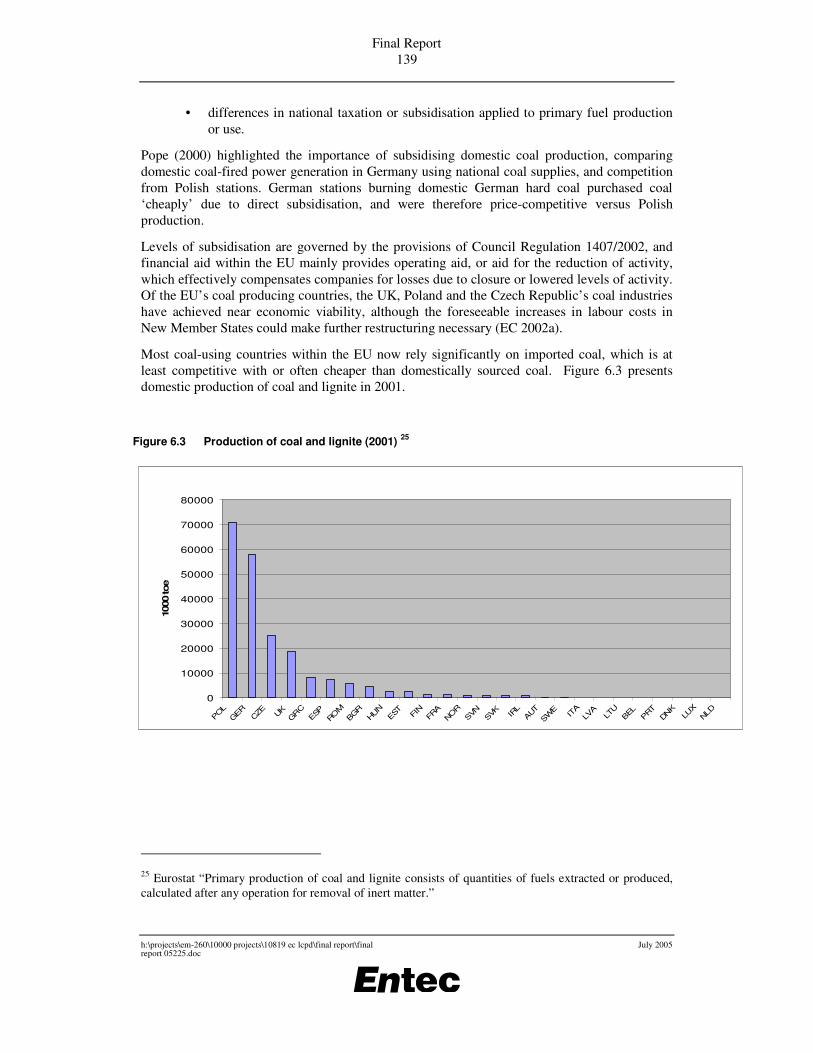
Final Report 139
h:\projects\em-260\10000 projects\10819 ec lcpd\final report\final report 05225.doc
July 2005
0
10000
20000
30000
40000
50000
60000
70000
80000
POLGER
CZE UKGRC
ESPRO
MBGR
HUNEST FI
NFR
ANO
RSVN SVK IR
LAUT
SWE IT
ALV
ALT
UBEL PRT
DNKLU
XNLD
1000
toe
• differences in national taxation or subsidisation applied to primary fuel production or use.
Pope (2000) highlighted the importance of subsidising domestic coal production, comparing domestic coal-fired power generation in Germany using national coal supplies, and competition from Polish stations. German stations burning domestic German hard coal purchased coal ‘cheaply’ due to direct subsidisation, and were therefore price-competitive versus Polish production.
Levels of subsidisation are governed by the provisions of Council Regulation 1407/2002, and financial aid within the EU mainly provides operating aid, or aid for the reduction of activity, which effectively compensates companies for losses due to closure or lowered levels of activity. Of the EU’s coal producing countries, the UK, Poland and the Czech Republic’s coal industries have achieved near economic viability, although the foreseeable increases in labour costs in New Member States could make further restructuring necessary (EC 2002a).
Most coal-using countries within the EU now rely significantly on imported coal, which is at least competitive with or often cheaper than domestically sourced coal. Figure 6.3 presents domestic production of coal and lignite in 2001.
Figure 6.3 Production of coal and lignite (2001) 25
25 Eurostat “Primary production of coal and lignite consists of quantities of fuels extracted or produced, calculated after any operation for removal of inert matter.”
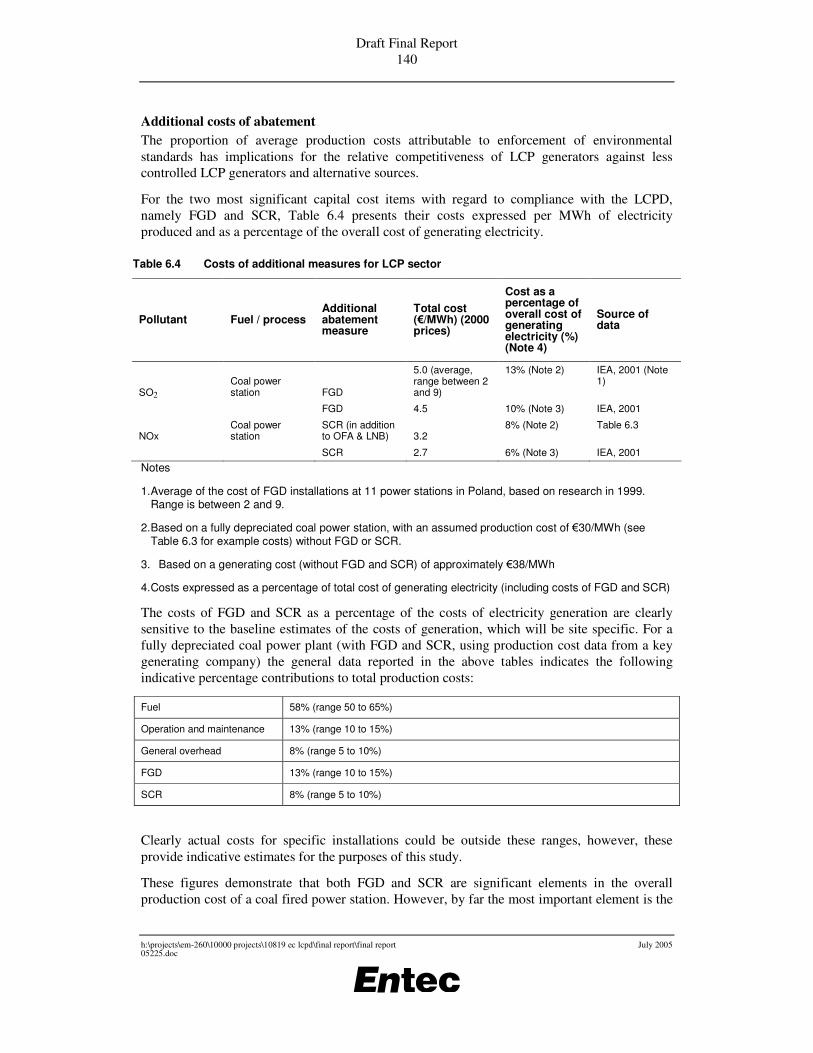
Draft Final Report 140
h:\projects\em-260\10000 projects\10819 ec lcpd\final report\final report 05225.doc
July 2005
Additional costs of abatement The proportion of average production costs attributable to enforcement of environmental standards has implications for the relative competitiveness of LCP generators against less controlled LCP generators and alternative sources.
For the two most significant capital cost items with regard to compliance with the LCPD, namely FGD and SCR, Table 6.4 presents their costs expressed per MWh of electricity produced and as a percentage of the overall cost of generating electricity.
Table 6.4 Costs of additional measures for LCP sector
Pollutant Fuel / process Additional abatement measure
Total cost (�/MWh) (2000 prices)
Cost as a percentage of overall cost of generating electricity (%) (Note 4)
Source of data
SO2 Coal power station FGD
5.0 (average, range between 2 and 9)
13% (Note 2) IEA, 2001 (Note 1)
FGD 4.5 10% (Note 3) IEA, 2001
NOx Coal power station
SCR (in addition to OFA & LNB) 3.2
8% (Note 2) Table 6.3
SCR 2.7 6% (Note 3) IEA, 2001 Notes
1. Average of the cost of FGD installations at 11 power stations in Poland, based on research in 1999. Range is between 2 and 9.
2. Based on a fully depreciated coal power station, with an assumed production cost of �30/MWh (see Table 6.3 for example costs) without FGD or SCR.
3. Based on a generating cost (without FGD and SCR) of approximately �38/MWh
4. Costs expressed as a percentage of total cost of generating electricity (including costs of FGD and SCR)
The costs of FGD and SCR as a percentage of the costs of electricity generation are clearly sensitive to the baseline estimates of the costs of generation, which will be site specific. For a fully depreciated coal power plant (with FGD and SCR, using production cost data from a key generating company) the general data reported in the above tables indicates the following indicative percentage contributions to total production costs:
Fuel 58% (range 50 to 65%)
Operation and maintenance 13% (range 10 to 15%)
General overhead 8% (range 5 to 10%)
FGD 13% (range 10 to 15%)
SCR 8% (range 5 to 10%)
Clearly actual costs for specific installations could be outside these ranges, however, these provide indicative estimates for the purposes of this study.
These figures demonstrate that both FGD and SCR are significant elements in the overall production cost of a coal fired power station. However, by far the most important element is the

Draft Final Report 141
h:\projects\em-260\10000 projects\10819 ec lcpd\final report\final report 05225.doc
July 2005
fuel cost, which can potentially vary within a wide range dependent on the fuel markets and the potential presence of any fuel subsidies.
6.2.8 Impact of differences in electricity generation costs on competition in the energy market
Potential for countries to take advantage of lower emission standards to be more competitive in the energy market
A broad range of factors, including macroeconomic factors reaching beyond the scope of the electricity generation market, will influence the potential for countries to take advantage of lower emission standards to be more competitive in the energy market. Therefore, within the scope of this study, only brief consideration is possible on this extensive issue.
In view of both the extent of transition period derogation allowances and the size of its coal fired electricity generating sector, this section focuses on Poland as an example.
Fundamentally, it is estimated (Energoprojekt, 2004) that the quantity of electricity exports from Poland is likely to decline, whilst the quantity of imports is likely to increase, due to:
• Increase in domestic electricity consumption. Final electricity consumption in the year 2003 in Poland was 2,58 MWh per capita. Assuming yearly 3 % growth26 Polish consumption per capita even in the year 2025 will be less than present consumption in EU-15.
• Reductions in generating capacity. The Polish power sector is old, and by the years 2008 to 2012 it will be necessary to decommission around 2 to 3 GWe of installed capacity in comparison to the capacity installed in 2003. After 2008, because of plant age and LCPD requirements, additional decommissioning is predicted. According to early Energoprojekt estimates27, due to LCPD requirements28 and to ensure that the growing demand for power is adequately met, power generation sources totalling 14 GWe need to be replaced and developed by 2020.
Furthermore, in the Treaty of Accession there are SO2 and NOx emission ceilings for the LCP sector, supplementary to transition periods (TPs) for compliance with LCPD requirements for units not fitted in FGD (SO2: eight year TP from 2008 to 2015) and secondary deNOx installations (NOx: two year TP from 2016 to 2017):
26 In view of the draft National Power Policy until 2025, the demand for power in the forecast period will increase by 3% per year on average, and this increase will be relatively lower in the first 10 years and higher in the second decade.
27 Implementation and financial plan of 2001/80/EC Directive in Poland, Energoprojekt-Warszawa S.A, Warsaw 2003
28 With transition periods and ceilings for LCP sector

Draft Final Report 142
h:\projects\em-260\10000 projects\10819 ec lcpd\final report\final report 05225.doc
July 2005
Table 6.5 The Accession Treaty emission ceilings for Polish LCP sector
2008 2010 2012
SO2 kt/a 454 426 358
NOx kt/a 254 251 239
If the Accession Treaty SO2 emission ceilings are to be met by the LCP sector, according to Energoprojekt (2004), SO2 emissions would have to be cut by 44% in 2008 and by more than 55% in 2012 in comparison with 2002 values. The stringency of the Accession Treaty ceilings for the Polish LCP sector is such that by 2012 it is predicted that they will not allow production of electricity from Polish power plants without being fitted with FGD. In the years 2008 - 2012 production of electricity in power plants without FGD will be significantly limited. As such the eight year TP for SO2 might effectively become a four year TP. Furthermore, with FGD taking potentially one year to fit per unit, the investment in FGD may need to commence four years in advance of the compliance date for a typical four unit power station.
Additional factors considered to limit export of electricity from Poland include (Energoprojekt, 2004):
• Relatively poor electricity transmission system in Poland;
• High capacity power plants in east side of Germany which forces electricity current flow from Poland to Czech Republic and Slovakia; and
• Subsidisation of German coal.
Therefore, whilst many power stations in Poland may be operating without FGD for longer than other countries, the actual fitting of FGD is likely to occur much sooner than indicated in the transition period derogation allowances in order to enable compliance with the Accession Treaty emission ceilings. Therefore the length of time for which lower emission standards will apply will be shorter. Furthermore, during this time, the scope for exporting electricity to countries with tighter standards is likely to reduce from current levels due to increased domestic demand for electricity and reductions in power plant capacity. Overall therefore, whilst there is the potential for Poland to take advantage of lower emission standards, in practice this is expected to be relatively limited and declining in the future.
Other countries with derogation allowances are considered to have less potential to take advantage of lower standards due to the smaller size of their power sector and the less significant allowances in comparison to Poland. As such, the conclusion for Poland that the ability to take advantage of lower emission standards is relatively limited and declining in the future is expected to apply to other new Member States. However, confirmation of this, and more detailed analysis of the potential impact of different environmental standards on competition in the energy market would require additional resources beyond the scope of this study.
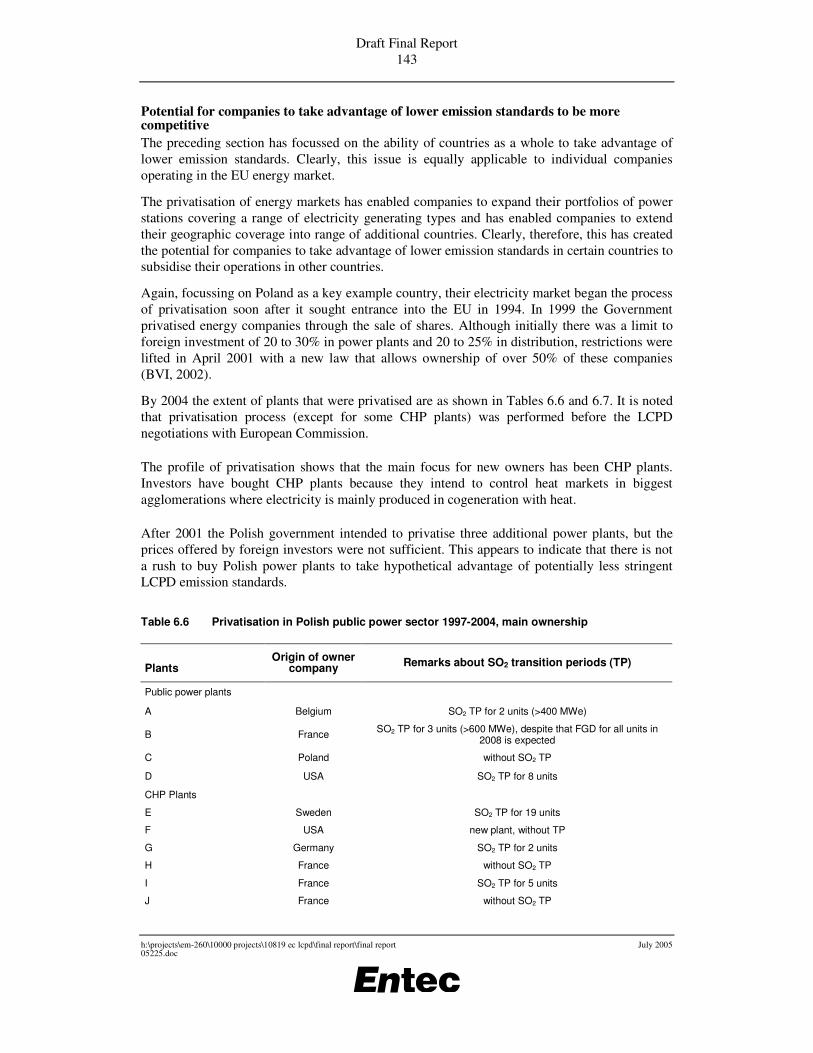
Draft Final Report 143
h:\projects\em-260\10000 projects\10819 ec lcpd\final report\final report 05225.doc
July 2005
Potential for companies to take advantage of lower emission standards to be more competitive The preceding section has focussed on the ability of countries as a whole to take advantage of lower emission standards. Clearly, this issue is equally applicable to individual companies operating in the EU energy market.
The privatisation of energy markets has enabled companies to expand their portfolios of power stations covering a range of electricity generating types and has enabled companies to extend their geographic coverage into range of additional countries. Clearly, therefore, this has created the potential for companies to take advantage of lower emission standards in certain countries to subsidise their operations in other countries.
Again, focussing on Poland as a key example country, their electricity market began the process of privatisation soon after it sought entrance into the EU in 1994. In 1999 the Government privatised energy companies through the sale of shares. Although initially there was a limit to foreign investment of 20 to 30% in power plants and 20 to 25% in distribution, restrictions were lifted in April 2001 with a new law that allows ownership of over 50% of these companies (BVI, 2002).
By 2004 the extent of plants that were privatised are as shown in Tables 6.6 and 6.7. It is noted that privatisation process (except for some CHP plants) was performed before the LCPD negotiations with European Commission.
The profile of privatisation shows that the main focus for new owners has been CHP plants. Investors have bought CHP plants because they intend to control heat markets in biggest agglomerations where electricity is mainly produced in cogeneration with heat.
After 2001 the Polish government intended to privatise three additional power plants, but the prices offered by foreign investors were not sufficient. This appears to indicate that there is not a rush to buy Polish power plants to take hypothetical advantage of potentially less stringent LCPD emission standards.
Table 6.6 Privatisation in Polish public power sector 1997-2004, main ownership
Plants Origin of owner
company Remarks about SO2 transition periods (TP)
Public power plants
A Belgium SO2 TP for 2 units (>400 MWe)
B France SO2 TP for 3 units (>600 MWe), despite that FGD for all units in 2008 is expected
C Poland without SO2 TP
D USA SO2 TP for 8 units
CHP Plants
E Sweden SO2 TP for 19 units
F USA new plant, without TP
G Germany SO2 TP for 2 units
H France without SO2 TP
I France SO2 TP for 5 units
J France without SO2 TP
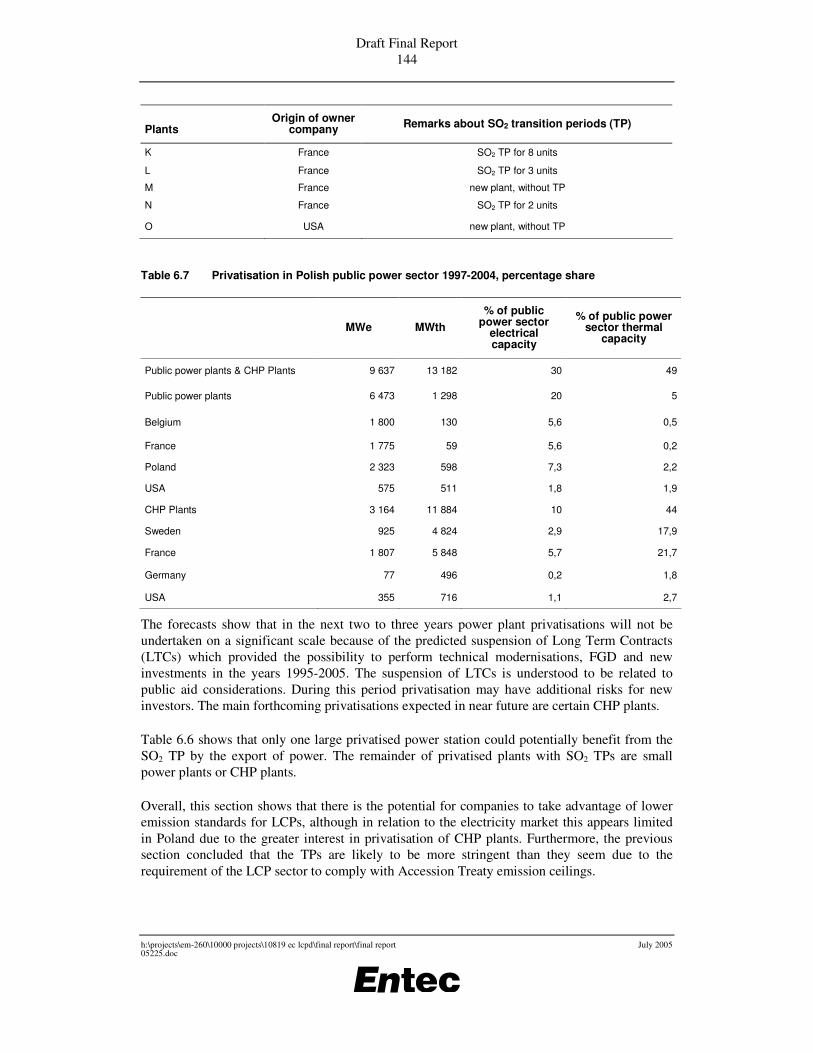
Draft Final Report 144
h:\projects\em-260\10000 projects\10819 ec lcpd\final report\final report 05225.doc
July 2005
Plants Origin of owner
company Remarks about SO2 transition periods (TP)
K France SO2 TP for 8 units
L France SO2 TP for 3 units
M France new plant, without TP
N France SO2 TP for 2 units
O USA new plant, without TP
Table 6.7 Privatisation in Polish public power sector 1997-2004, percentage share
MWe MWth % of public
power sector electrical capacity
% of public power sector thermal
capacity
Public power plants & CHP Plants 9 637 13 182 30 49
Public power plants 6 473 1 298 20 5
Belgium 1 800 130 5,6 0,5
France 1 775 59 5,6 0,2
Poland 2 323 598 7,3 2,2
USA 575 511 1,8 1,9
CHP Plants 3 164 11 884 10 44
Sweden 925 4 824 2,9 17,9
France 1 807 5 848 5,7 21,7
Germany 77 496 0,2 1,8
USA 355 716 1,1 2,7
The forecasts show that in the next two to three years power plant privatisations will not be undertaken on a significant scale because of the predicted suspension of Long Term Contracts (LTCs) which provided the possibility to perform technical modernisations, FGD and new investments in the years 1995-2005. The suspension of LTCs is understood to be related to public aid considerations. During this period privatisation may have additional risks for new investors. The main forthcoming privatisations expected in near future are certain CHP plants.
Table 6.6 shows that only one large privatised power station could potentially benefit from the SO2 TP by the export of power. The remainder of privatised plants with SO2 TPs are small power plants or CHP plants.
Overall, this section shows that there is the potential for companies to take advantage of lower emission standards for LCPs, although in relation to the electricity market this appears limited in Poland due to the greater interest in privatisation of CHP plants. Furthermore, the previous section concluded that the TPs are likely to be more stringent than they seem due to the requirement of the LCP sector to comply with Accession Treaty emission ceilings.
Draft Final Report 145
h:\projects\em-260\10000 projects\10819 ec lcpd\final report\final report 05225.doc
July 2005
6.2.9 Summary This assessment considers a number of issues influencing the effect that any differences in environmental standards in the LCP sector may have on competition in the energy market. These include the level of physical and administrative interconnection between Member States; the extent to which the market is open to market entries and competitors and the extent to which consumers are able to choose their suppliers; differences in electricity generation costs (including abatement costs) and the extent of reliance of the electricity generating sector on LCPs. Some of key points from the assessment include:
• The currently available capacity of European interconnection is reported to be insufficient to satisfy demand for exchange within a single market. However, ‘bottleneck’ congestion points have been identified and the Commission has put forward an action plan to address this issue. Further integration of administrative networks is also planned, with regionalised integration of markets expected to develop prior to full harmonisation within a single market.
• Domestic market conditions play an important role in allowing competition between domestic and import suppliers. These issues are addressed within the European Union by the implementation of Electricity Directive (2003/54/EC). Full supply market opening to non-household customers, allowing customers to choose their supplier is set for 2004.
• The Member States with the greatest capacity to generate electricity from coal and oil fired plants (the key fuel types affected by the LCPD ELVs) are Germany, Greece, Spain, Italy, the UK, Czech Republic and Poland. Of these Member States, Poland appears to have greatest potential for export from power stations without flue gas desulphurisation (FGD).
• Whilst Poland has transition period of 8 years for the SO2 requirements (and 2 years for the 2016 NOx requirements), is estimated that the associated Accession Treaty emission ceilings will have the effect of reducing this transition period to about 4 years. Therefore the length of time for which lower emission standards will apply is expected to be shorter than implied in the Accession Treaty. Furthermore, during this time, the scope for Poland to export electricity to countries with tighter standards is likely to reduce from current levels due to increased domestic demand for electricity and reductions in power plant capacity.
• The overall situation, therefore, is that whilst there is the potential for Poland to take advantage of lower emission standards, in practice this is expected to be relatively limited and declining in the future. This conclusion is expected to be broadly true for other new Member States with derogation allowances, although further work outside the scope of this study would be required to confirm this.
6.3 Effects on the environment Due to the multitude of policies affecting the environmental impact of air emissions from LCPs (including LCPD, IPPCD, Air Quality Daughter Directives, National Emission Ceilings Directive, etc) and the different options that operating companies have got in response to these policies, it is not possible to draw any broad conclusions on the effects of differences between the Community environmental standards for the LCP sector on the environment.
Draft Final Report 146
h:\projects\em-260\10000 projects\10819 ec lcpd\final report\final report 05225.doc
July 2005
Notwithstanding this, it is clear that the differences in LCP standards themselves are becoming smaller in time, between the best and the worst performing ‘old’ Member States, and between the ‘old’ and ‘new’ Member States.
6.4 References CER (Commission for Energy Regulation) (Ireland), (2004). Best New Entrant Price 2004, Consultation Paper.
EC (1999) SECOND REPORT TO THE COUNCIL AND THE EUROPEAN PARLIAMENT ON HARMONISATION REQUIREMENTS, SEC 1999/470. http://www.europa.eu.int/comm/energy/electricity/publications/doc/cb_harmo2_en.pdf
EC (2001) Analysis of Electricity Network Capacities and Identification of Congestion. http://europa.eu.int/comm/energy/electricity/publications/index_en.htm
EC (2002) COMMUNITY IMPORTS OF POWER STATION COAL FROM THIRD COUNTRIES IN 2001. http://www.europa.eu.int/comm/energy/coal/annual_report/2001_en.pdf
EC (2002a) Report from the Commission on the applicability of the Community rules for state aid to the coal industry in 2001.
EC (2003) Communication from the Commission to the European Parliament and the Council on Energy Infrastructure and Security of Supply. December 2003. http://europa.eu.int/comm/energy/electricity/infrastructure/doc/2003/com_2003_743_en.pdf
EC 1229/2003/EC (2003). Guidelines for trans-European energy networks.
EC (2004). Strategy Paper: Medium Term Vision for the Internal Electricity Market. European Commission DG Energy and Transport Working Paper.
EC (2004a) DG TREN Draft Working Paper: third benchmarking report on the implementation of the internal electricity and gas market.
Energoprojekt, 2004. Specialist input to Entec on the EC study on the review of the LCPD. November 2004. http://www.europa.eu.int/comm/energy/electricity/benchmarking/doc/3/3rd_bencmarking_report_en.pdf
EURELECTRIC/UCTE (2002). European Interconnection: state of the art 2002 (SYSTINT Annual Report). http://www.eurelectric.org
EURELECTRIC/UCTE (2003). Mediterranean Interconnection: state of the art 2003 (1st SYSTMED Report). http://www.eurelectric.org
Eurelectric (2003) Eurprog 2003: statistics and prospects for the European electricity sector, July 2003.
EURELECTRIC (2003a) Comments on the Commission’s Strategy paper “medium term vision for the internal electricity market”.
Eurostat statistics: Primary production of coal and lignite.

Draft Final Report 147
h:\projects\em-260\10000 projects\10819 ec lcpd\final report\final report 05225.doc
July 2005
http://europa.eu.int/comm/eurostat/newcronos/queen/display.do?screen=detail&language=en&product=THEME8&root=THEME8_copy_151979619462/yearlies_copy_1067300085946/ebc_copy_664895565607/ebc10512_copy_530348471623
Generating company, 2004. Personal Communication with major European generating company.
IEA, 2001. Air pollution control costs for coal fired power stations. October 2001.
IIASA (2004) reference to be provided.
OECD/IEA (2001). Competition in Electricity Markets. Paris.
Pope, Ian (2000) The potential for electricity trade in an enlarged EU based on differential environmental standards.
SGCI (2005) Comments on Draft Final Report. Premier Ministre Comité Interministériel pour les questions de coopération économique Européene, Secrétariat général, July 2005.
Royal Academy of Engineering, 2004. The Costs of Generating Electricity. A study carried out by PB Power for the Royal Academy of Engineering.
UCTE (II 2003) Second Half Yearly Report. http://www.ucte.org/pdf/Publications/2003/Report_II_2003.pdf

Draft Final Report 148
h:\projects\em-260\10000 projects\10819 ec lcpd\final report\final report 05225.doc
July 2005

Final Report 149
h:\projects\em-260\10000 projects\10819 ec lcpd\final report\final report 05225.doc July 2005 10819
7. Screening Level Analysis of the Feasibility and Desirability of Market Based Instruments for SO2 and NOx in the EU LCP Sector
7.1 Introduction This section starts by very briefly identifying key aspects of EU and US approaches to reducing emissions of SO2 and NOx in the LCP sector, incorporating a selection of case studies of market-based instruments (MBIs) that have been applied in practice to reducing SO2 and NOx emissions in the LCP sector, mainly in the USA, but with one example in the EU. Each of the case studies considers:
• Key elements of the approach;
• How have plants responded? What technologies are used?
• What are the compliance costs?
• To what degree has the policy achieved its objectives?
• Summary points.
By drawing on these case studies and other information, specific consideration is then given to the feasibility and desirability of market based instruments for reducing emissions of SO2 and NOx in the EU’s LCP sector. Within the scope of this project, this is a screening level analysis, and hence the discussions deal in outline terms only. The discussions consider a number of aspects including:
• The rationale for introducing taxation or trading;
• Introducing taxation or trading in addition to existing command and control regulation;
• Hybrid tax and permit trading schemes;
• The potential need for further reductions in EU SO2 and NOx emissions beyond business as usual reductions;
• The technical feasibility of achieving further SO2 and NOx emissions reductions in the EU LCP sector beyond business as usual reductions;
• Preliminary considerations of key design issues for trading schemes;
• Preliminary considerations of key design issues for tax schemes;
• Cost-effectiveness of MBIs for the EU LCP sector compared with tightening command and control legislation; and

Final Report 150
h:\projects\em-260\10000 projects\10819 ec lcpd\final report\final report 05225.doc July 2005 10819
• Summary of key points.
It is acknowledged that the experience of the EU ETS as a market based instrument may well provide lessons that could usefully be taken into account, although it is not within the scope of this study to consider this specifically.
7.2 EU and US approaches to reducing emissions of SO2 and NOx in the LCP sector
7.2.1 Introduction There is a wide range of policies in the EU and the USA aimed at reducing emissions of SO2 and NOX in the LCP sector. As can be expected, individual policies vary substantially in focus, for example controlling techniques or emission concentrations at individual processes; total emissions at a national level; ambient concentrations at ground level; etc.
In both the EU and US, both traditional regulation (so called “command and control”) and economic instruments have been and are still used in air policy. The use of both types of instrument may reflect a policy mix, whereby the regulations used historically are seen to be complemented by economic instruments, or may be a result of existing regulations being superseded, but not withdrawn (Ellerman, 12th November 2004). Regardless of reason, in both the EU and US policy includes a strong regulatory element (in the EU case this includes the LCPD and IPPCD amongst many other Directives, in the US regulation is dominated by the Clean Air Act), with several economic instruments also used, most extensively in the US. It should also be noted that negotiated and voluntary agreements can also play a role in air policy, but are not considered as part of this analysis.
Some of the key policies are summarised in Table 7.1 and are discussed further below.
Table 7.1 Selection of some policies in the European Union and United States addressing emissions of SO2 and NOx from LCPs
Policy name Geographic coverage SOx NOx Type of policy
European Union
Large Combustion Plant Directive (2001/80/EC) EU ���� ���� Regulation / Potential trading scheme (Note 1)
Integrated Pollution Prevention and Control Directive (96/61/EC)
EU ���� ���� Regulation
National Emissions Ceiling Directive (2001/81/EC) EU ���� ���� Regulation / Potential trading scheme (Note 2)
Air Quality Framework Directive (96/62/EC) EU ���� ���� Regulation
Air Quality First Daughter Directive (1999/30/EC) EU ���� ���� Regulation
Sulphur Content of Liquid Fuels Directive (1999/32/EC)
EU ���� Regulation
Swedish NOx charge Sweden ���� Charge
Dutch NOx trading (planned) Netherlands ���� Trading scheme (planned)
Other NOx taxes and charges Various Member States and regions e.g. Galicia, Spain
���� Tax

Final Report 151
h:\projects\em-260\10000 projects\10819 ec lcpd\final report\final report 05225.doc July 2005 10819
Policy name Geographic coverage SOx NOx Type of policy
United States
Clean Air Act (and amendments) National ���� ���� Regulation
Air Emission Permit Fees National requirement but implemented at state level
���� ���� Tax
The Acid Rain Program National ���� ���� Trading scheme
Regional Clean Air Incentives Market (RECLAIM) Los Angeles, California ���� ���� Trading scheme
Ozone Transport Commission NOx Budget Program
States in the north east ���� Trading scheme
NOx SIP (State Implementation Plan) Call and Section 126 Trading Program
States in the north east ���� Trading scheme
Notes
1 Subject to implementation method of National Plan for existing plants.
2 For example, the proposed Dutch NOx trading scheme (see Section 7.3) is aimed at helping achieve compliance with the Dutch NECs.
7.3 EU approaches for reducing emissions of SO2 and NOx in the LCP sector
7.3.1 Overview of EU approaches
Large Combustion Plant Directive Directive 2001/80/EC, referred to as the Large Combustion Plant Directive (LCPD), applies to combustion plants with a rated thermal input of 50MW or more. This directive is described in Section 2.
Integrated Pollution Prevention and Control Directive The purpose of the Integrated Pollution Prevention and Control (IPPC) Directive (Directive 96/61/EC) is to achieve a high level of protection for the environment as a whole. The central principle of IPPC is that operators should take all appropriate preventative measures against pollution, and in particular apply ‘best available techniques’ (BAT) to improve environmental performance. This directive is described in Section 2.
National Emission Ceilings Directive The National Emission Ceilings Directive (NECD) was developed as the primary means of implementing the European Commission’s Acidification Strategy and making progress on the problem of ground-level ozone. It sets ceilings for national emissions of sulphur dioxide, nitrogen oxides, volatile organic compounds and ammonia, to be complied with by 2010.
Air Quality Framework Directive The Air Quality Framework Directive (described further in Section 2) established an overall directive on ambient air quality assessment and management to control and monitor levels of certain pollutants in the air. The directive revised existing legislation (for sulphur dioxide, nitrogen dioxide, particulates, lead and ozone) and also covered previously unregulated pollutants (benzene, carbon monoxide, polyaromatic hydrocarbons, cadmium, arsenic, nickel
Final Report 152
h:\projects\em-260\10000 projects\10819 ec lcpd\final report\final report 05225.doc July 2005 10819
and mercury). It also established the framework for a number of daughter directives to address specific pollutants. The first daughter directive, dealing with SO2 and NOx is discussed below.
First Air Quality Daughter Directive The first daughter directive of the Air Quality Framework Directive set the limit values for NOx, SO2, lead and particulates (PM10). The directive was introduced in July 1999 with two years to transpose the directive. The aim was to set air quality limits and thresholds, as well as harmonise monitoring, measuring and quality assessment methods throughout the EU. The directive also requires Member States to implement attainment programmes where the objectives are not expected to be achieved under the business as usual scenario. The first daughter directive was amended by Commission Decision 2001/744/EC, and it repealed a number of existing directives.
Section 2 contains more details of the limit values in the First Daughter Directive.
Sulphur Content of Liquid Fuels Directive This directive sets limits for the sulphur content of heavy fuel oil (e.g. 1.0% from 2003) and gas oil (e.g. 0.2% currently and 0.1% from 2008). It also sets emission limits for SO2 emissions from petroleum refineries.
Swedish NOx charge The Swedish NOx charge is included as Case Study 1 in Section 7.3.2.
Dutch NOx trading Discussions for a NOx trading scheme for large industrial plant (with energy use exceeding 20MWth) in the Netherlands have been ongoing since 1997. The scheme aims to improve the NOx emissions of existing energy sources, with the possibility for improvements through use of new energy sources, with an overall objective of reducing emissions from the sector to 55kt by 2010 (55% reduction from 1995 emissions). Reductions in overall emissions (including transport, which is also a significant emitter) are required by the National Emissions Ceilings Directive (NECD), with overall emissions of NOx set at 260kt in 2010, in comparison to projections made in 2002 of emissions of 289kt (ENDS Daily, 2004).
The scheme will be implemented through performance standard rates (PSR) (mass of NOx per unit energy consumption) for each plant, with the standard tightened progressively from 2004 to 2010. The PSR has been calculated as 40g/GJ (approximately equivalent to 40mg/m3) (Dekker, 2004), based on the emissions standard required to achieve the target of 55kt emissions assuming projected fuel use in 2010 (1350PJ) (Dekker, 2004). Each plant will be allocated emissions rights based on the PSR multiplied by their actual fuel use, with the permits allocated at the end of each trading period. Therefore, credits are traded, in anticipation of allocation of allowances. Because of the uncertainty generated by distributing the permits at the end of the period, each facility will be able to bank or borrow up to 5% of their allowance.
The scheme has achieved a high level of acceptance from Dutch industry, and this is accredited to the extensive dialogue between the regulators and industry, and the large number of experiments in monitoring and validation, including a large scale demonstration project for 6 months involving 27 companies.

Final Report 153
h:\projects\em-260\10000 projects\10819 ec lcpd\final report\final report 05225.doc July 2005 10819
NOx taxes and charges The tax on nitrogen oxides introduced in Galicia, Spain is one of a number of taxes on NOx in Europe introduced at low rates (in comparison to the Swedish charge). The tax is of particular interest because it has been introduced at a regional level. The tax is set on a rising block tariff (no tax for the first 1,000 tonnes emitted, �33/tonne from 1,001 to 40,000 tonnes, �36/tonne from 40,001 to 80,000 tonnes, and �42/tonne thereafter), with the first level of charge set to reflect damage and the higher levels to provide incentives. As a result of the exemption for smaller plants, only six of the potential 370 plants pay the tax, with 70% of taxed emissions coming from a single source. The tax is based on self-reporting of measured emissions or through application of emissions factors backed up by inspection. Revenue from the scheme is received by the regional government, with 5% dedicated to an environmental restoration fund. Environmental taxes provide an important source of revenue at a regional level (providing 80% of all receipts), since regional receipts are small (Labandeira, 2004).
7.3.2 Market-based instrument case study 1: Swedish NOx charge The Swedish charge on NOx emissions from energy generation at combustion plant has been in place since 1992. It provides an example of how an effective charge can attract broad industry support by means of revenue neutrality.
Key elements of the approach The decision to impose a charge on emissions of NOx was taken in 1985 and it was introduced in 1992, with the aim of reducing airborne emissions of nitrogen oxides by 30% by 1995 in comparison to 1980 levels. It was recognised that further reductions would be required in accordance with the Gothenburg Protocol and the EU National Emission Ceilings Directive.
The Swedish NOx charge is paid on emissions of nitrogen oxides from boilers, stationary combustion engines and gas turbines with a useful energy production of at least 25 gigaWatt hours (GWh) per year. Almost all of the units affected by the charge are boilers, including pulp and paper mills, food, metal and other manufacturing as well as waste incineration plants. Very few electricity plants are covered by the charge, since Sweden’s significant generation from hydro and nuclear is excluded. Originally the charge was set to cover units producing at least 50GWh per year in order to restrict investment in monitoring equipment to the largest plants. However, with the effectiveness in emission reductions and the fall in monitoring costs, the charge was extended to smaller units.
The charge is set at SEK40 (about �4.4) per kilogram of emitted NOx, and has remained constant in nominal terms since its introduction. The rate was set based on the expected costs of abatement for electricity power stations and district heating plants required to achieve the overall reduction target of 30%. Based on engineering data, it was expected that abatement costs would be between 3 and 84 SEK/kg, with 40SEK appearing a reasonable mean.
A key element of the approach that distinguishes it from other charges and taxes is recycling of the revenue, excluding administration costs, to the organisations subject to the charge. In order to achieve the reductions required, the policy needed to use direct monitoring of emissions and a very high tax rate. Emissions of NOx cannot be easily calculated based on inputs since they are largely due to the chemical reaction in the combustion chamber, and engineers had difficulty in predicting the effects of fine-tuning. Therefore monitoring of individual plants was deemed essential in order to understand the effectiveness of different fine-tuning measures and to calculate actual emissions. For smaller plants, this was expected to be prohibitively expensive.

Final Report 154
h:\projects\em-260\10000 projects\10819 ec lcpd\final report\final report 05225.doc July 2005 10819
However, if smaller units were to be excluded from the scheme, this would have created an incentive to close larger plants subject to the tax in favour of smaller, less efficient plants. Even for larger plants, this would have imposed significant costs in a small, open economy. Therefore, a tax rebate to participating plants in proportion to final energy production was chosen to maintain incentives while minimising disruption to competition between plants subject to the charge and those excluded. With the refund, boilers with high emissions relative to energy production are net payers, while those with relatively low emissions relative to production are net receivers. This refund arrangement proved to be very important in securing industry acceptance for the charge, and allowed a higher charge to be used whilst minimising the effects on industrial competitiveness.
How have plants responded? What technologies are used? Much of the reduction in emissions has been achieved through change of fuel use (Lindgren, 2004), although plants have also used combustion measures and flue gas cleaning.
Combustion measures include low-NOx burners, flue gas recirculation, air staging, over or rotating fire air, reburning, and ‘fine tuning’ of the combustion system. The Swedish EPA reports that changes in operating procedures have allowed substantial reductions in emissions for minimal cost at several plants. However, there are risks associated with ‘trimming’ combustion, particularly as incomplete combustion increases emissions of carbon monoxide.
There are two flue gas cleaning measures that have been considered as a response to the NOx charge, selective non-catalytic reduction (SNCR) and selective catalytic reduction (SCR). The latter technology is more effective, but is also more expensive, especially given the relatively small size of Swedish plant. Eight boilers had installed SCR by the end of 2000.
The charge is calculated on measured emissions or on presumptive emissions per unit of energy produced. These presumptive emission levels are applied unless the plant has installed monitoring equipment that complies with the Swedish Environmental Protection Agency’s standards. However, there has been an incentive for plant to install these technologies, since in most cases the presumptive levels of emissions are substantially higher than actual emissions. In addition, the plant is required to report data on energy production. The technologies required to collect this information were generally already installed in the plant for other purposes and were not introduced in response to the charge.
What are the compliance costs? The revenue neutral design of the charge indicates that the compliance costs to the sector as a whole may be limited to investment in additional technology, monitoring costs and administrative costs.
The Swedish EPA has reported that comparatively large reductions were available at low or no cost. It is thought that at the time the charge was introduced there were unused opportunities for reducing NOx at low cost, and that the charge provided the incentive to consider these measures. In addition to options known about but not used, it may be that the consideration of boiler performance helped to identify new options to improve efficiency and reduce cost. According to a 1996 study, the average cost of abatement measures was SEK7.5 (about �0.90) per kilogram NOx, with 30% of boilers reporting reduction at zero cost or positive benefit. However, even in identifying seemingly cost-less solutions, there may be opportunity costs of managerial time and capital, and there may have been greater benefits associated with allocating resources elsewhere.

Final Report 155
h:\projects\em-260\10000 projects\10819 ec lcpd\final report\final report 05225.doc July 2005 10819
The relatively high presumptive emissions applied to calculate charges to those plants without monitoring equipment has encouraged many plants to install equipment to assess actual emissions.
In addition to costs to the plants themselves, there are administrative costs associated with the charge. In 1999, administrative work carried out by the Swedish EPA represented five man-years at a cost of SEK 3.3 million (approximately �413,000), or approximately 0.6% of the total charge amount.
To what degree has the policy achieved its objectives? On average, the plants originally targeted have reduced emissions by about 60% per unit of energy input since the announcement of the NOx charge. This represents a significant improvement, with all sectors targeted except the metals industry reducing their total emissions. This improvement is shown in Figure 7.1 below (Swedish Environmental Protection Agency, 2000). This figure also shows the increase in 1996 when more boilers were included in the scheme.
Figure 7.1 Total and specific NOx emissions from boilers subject to the NOx charge (estimated for 1990)
However, the original target was to reduce emissions by 30% from all sources from 1980 levels by 1995. In practice, overall emissions only reached this level towards the end of the 1990s, as shown in Figure 7.2.

Final Report 156
h:\projects\em-260\10000 projects\10819 ec lcpd\final report\final report 05225.doc July 2005 10819
Figure 7.2 Emissions of nitrogen oxides, 1980-2002
Within the overall fall, different industries have had different degrees of success in reducing NOx emissions in response to the charge. Heat and cogeneration plants have been net receivers of money throughout the life of the scheme, while the pulp and paper and chemicals sectors have experienced more difficulty in reducing emissions.
The difficulties associated with reducing overall emissions may be in part due to the relatively limited coverage of the charge. In 1998, plants subject to the charge represented 5% of NOx
emissions. On the other hand, road traffic, which has exhibited significant growth over the last two decades, represented 43% of emissions.
Overall, although the charge failed to meet its stated objective, it was not significantly adrift from the target. Although this suggests that the charge has been successful, the total reduction in NOx should not be ascribed solely to the introduction of the charge, since a large number of boilers are also subject to specific regulations detailed in the plant’s operating permit under the Environmental Code.
A secondary consequence of the charge has been through its effect on other atmospheric pollutants. Changes to plant behaviour in response to the NOx charge may increase emissions of carbon monoxide (CO) where ‘trimming’ of combustion techniques reduces the efficiency of combustion. Although the changes in CO are generally low, they can indicate emissions of other pollutants from less complete combustion, such as volatile organic compounds (VOC) and polycyclic aromatic hydrocarbons (PAH). Flue gas treatment (SCR and SNCR) uses ammonia or urea, and may increase emissions of ammonia. In addition, under certain climatic conditions, flue gas treatment using urea may also increase emissions of nitrous oxide (N2O). A study in 1995 of emissions from plants subject to the NOx charge found that the increase in emissions of carbon monoxide and ammonia represented 0.5% or less of total emissions, while the increase of nitrous oxide represented approximately 5% of total emissions. The Swedish EPA has
Final Report 157
h:\projects\em-260\10000 projects\10819 ec lcpd\final report\final report 05225.doc July 2005 10819
suggested that these increases could have been minimised if emissions of these substances had been targeted at the same time as the charge was introduced.
The revenue neutrality of the charge was key to the political acceptance of the scheme, and has also minimised potential negative consequences after introduction, particularly by ensuring that as a whole, the sector faces relatively low costs. As the refund is linked to specific plants, it is also seen to provide a continuous incentives to firms to reduce emissions per energy unit, as opposed to the refunds of the French tax on air pollution29 for example, in which there was no built-in check on ex-post efficiency or use of subsidised equipment (Millock et.al., 2004).
Within the affected sectors, there are undoubtedly units and groups that benefit or are disadvantaged. The pulp and paper industry, chemical industry and waste incinerators have been net payers into the scheme. However, to address these losses would risk distorting the environmental incentives for which the scheme was designed. One group within the combustion sector that faces relatively high costs is smaller units required to install expensive equipment for measuring emissions. The Swedish EPA has suggested that making measurement costs tax-deductible for plants subject to the NOx charge could reduce costs to this sector.
Summary The Swedish NOx charge was introduced to control emissions from large stationary sources.
• Revenue recycling to industry helped to generate support for introduction of the charge and has improved the success.
• At least part of the success is attributed to the availability of control technologies that were under-utilised at the time the charge was introduced.
• However, not all of the reduction in emissions is attributed to the charge, since a large number of plants also reduced emissions in response to other environmental legislation.
• The charge may have consequences on emissions of other pollutants unless they are otherwise controlled, with a potential for increases in nitrous oxide, CO and emissions associated with incomplete combustion.
7.4 US approaches for reducing emissions of SO2 and NOx in the LCP sector
7.4.1 Overview of US approaches
Clean Air Act (and amendments) The Clean Air Act and later amendments provide the framework for air legislation across the US, and the federal government requires each state to develop a State Implementation Plan (SIP) to indicate how they will address requirements of the Act. Under the latest amendment
29 Taxe parafiscale sur la pollution atmosphérique (TPPA), replaced by a general pollution tax in 2000

Final Report 158
h:\projects\em-260\10000 projects\10819 ec lcpd\final report\final report 05225.doc July 2005 10819
(1990), National Ambient Air Quality Standards (NAAQS) were set for carbon monoxide, lead, nitrogen dioxide, particulate matter, ozone and sulphur oxides.
New Source Performance Standards (NSPS) have also been set out to provide limits on emissions and reduction requirements for a large number of processes where new facilities are built or existing facilities are modified. The limits apply to SO2, NOx and particulate matter. There are also reduction requirements based on reductions from a potential combustion concentration (PCC) - a theoretical emission that would result from combustion of an uncleaned fuel without emissions controls. A summary of these limits is included in Table 7.2 below, although there are a large number of differences for different facilities, and these figures do not include this level of detail. Furthermore, it is understood that there are some newer standards (Milieu et al, 2004) which include 0.15lb/mmBTU (185mg/Nm3) for NOx for existing power generators that become subject to NSPS through modification, with industrial sources meeting a standard of 0.11 to 0.2lb/mmBTU (135 to 245mg/Nm3) depending on the fuels used and other factors.
Table 7.2 SO2 and NOx emission limits under Standards of Performance for New Stationary Source (Note 1)
SO2 NOx Process type Fuel
Emission limit
(lb/mmBtU) (mg/m3 in brackets)
Reduction to…
Emission limit
(lb/mmBtU) (mg/m3 in brackets)
Reduction to…
Gaseous fuel .. 0.2 (245)
Gaseous fuel and wood residue
.. 0.3 (370)
Liquid fuel or liquid fuel and wood residue
0.8 (985) 0.3 (370)
Solid fuel or solid fuel and wood residue
1.2 (1475) 0.7 (860)
Fossil-fuel-fired steam generators (for which construction commenced after 17/08/1971)
Lignite or lignite and wood residue
.. 0.6 (740)
Solid fuel or solid-derived fuel
1.2 (1475) 10% of PCC, or
30% of PCC when
emissions are less than
0.6
Solid fuels See above See above 0.5-0.8 (615 to 985) depending
on fuel
65% of PCC
Electric utility steam generating units for which construction commenced after 18/09/1978
Liquid fuels 0.8 (985) 10% of PCC, or 100% of PCC if
emissions are less than
0.2
0.3-0.5 (370 to 615) depending
on fuel
30% of PCC
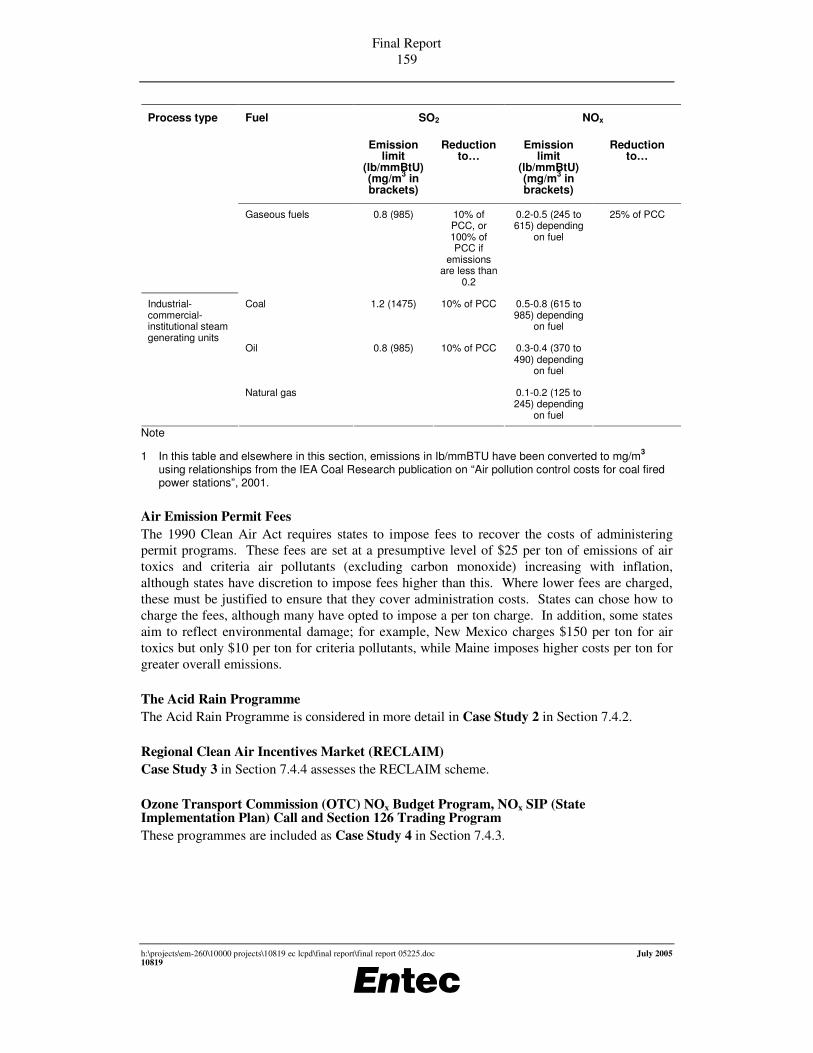
Final Report 159
h:\projects\em-260\10000 projects\10819 ec lcpd\final report\final report 05225.doc July 2005 10819
SO2 NOx Process type Fuel
Emission limit
(lb/mmBtU) (mg/m3 in brackets)
Reduction to…
Emission limit
(lb/mmBtU) (mg/m3 in brackets)
Reduction to…
Gaseous fuels 0.8 (985) 10% of PCC, or 100% of PCC if
emissions are less than
0.2
0.2-0.5 (245 to 615) depending
on fuel
25% of PCC
Coal 1.2 (1475)
10% of PCC 0.5-0.8 (615 to 985) depending
on fuel
Oil 0.8 (985) 10% of PCC 0.3-0.4 (370 to 490) depending
on fuel
Industrial-commercial-institutional steam generating units
Natural gas 0.1-0.2 (125 to 245) depending
on fuel
Note
1 In this table and elsewhere in this section, emissions in Ib/mmBTU have been converted to mg/m3 using relationships from the IEA Coal Research publication on “Air pollution control costs for coal fired power stations”, 2001.
Air Emission Permit Fees The 1990 Clean Air Act requires states to impose fees to recover the costs of administering permit programs. These fees are set at a presumptive level of $25 per ton of emissions of air toxics and criteria air pollutants (excluding carbon monoxide) increasing with inflation, although states have discretion to impose fees higher than this. Where lower fees are charged, these must be justified to ensure that they cover administration costs. States can chose how to charge the fees, although many have opted to impose a per ton charge. In addition, some states aim to reflect environmental damage; for example, New Mexico charges $150 per ton for air toxics but only $10 per ton for criteria pollutants, while Maine imposes higher costs per ton for greater overall emissions.
The Acid Rain Programme The Acid Rain Programme is considered in more detail in Case Study 2 in Section 7.4.2.
Regional Clean Air Incentives Market (RECLAIM) Case Study 3 in Section 7.4.4 assesses the RECLAIM scheme.
Ozone Transport Commission (OTC) NOx Budget Program, NOx SIP (State Implementation Plan) Call and Section 126 Trading Program These programmes are included as Case Study 4 in Section 7.4.3.

Final Report 160
h:\projects\em-260\10000 projects\10819 ec lcpd\final report\final report 05225.doc July 2005 10819
7.4.2 Market-based instrument case study 2: US Acid Rain Programme The emissions trading scheme for SO2 from power plant has been in operation in the USA since 1995. Its objective was to reduce emissions to 50% of 1980 levels, and a nation-wide cap was set for SO2 emissions from generation plant in two phases of expanding coverage and tightening control.
Key elements of the approach The Acid Rain Programme is a cap-and-trade emissions trading scheme for emissions of sulphur dioxide developed from earlier permit schemes in the United States. The main objective of the programme is to reduce SO2 emissions from power plants by approximately 50%, with an additional objective to reduce NOx emissions. Phase I, which started in 1995, reduced emissions of SO2 by 4 million tonnes and NOx by 2 million tonnes, and Phase II (from 2000) reduced SO2
emissions by a further 5 million tonnes, to an overall cap of 8.95 million tonnes of SO2 per year.
The programme combines an emissions trading scheme for SO2 with NOx emissions standards. The first phase targeted those units whose emissions exceeded 2.5 pounds of SO2 per million Btu (British thermal units) (3075mg/m3) and whose capacity exceeded 100MW. This equated to the 110 highest emitting coal-fired power plants. Phase II includes all power plants with capacity of 25MW or greater. There are also a number of units not required to participate in the programme who have opted to join in order to reduce emissions and sell excess permits.
Allowances are granted to plants involved in the scheme based on average 1985-1987 Btu consumption, with:
• Phase I allowances calculated on 2.5 pounds SO2 per million Btu (3075mg/m3) and
• Phase II allowances calculated on 1.2 pounds SO2 per million Btu (1475mg/m3).
In response to political and equity considerations, allowances were granted without cost and in perpetuity to existing plants and are not recalled on plant closure. However, new entrants do not have allowance entitlements, and must purchase allowances to cover all of their emissions. While no new plant with high emissions was anticipated at the time the scheme was introduced, some are now under discussion.
In addition to plant required to take part in the programme, other plants are able to join the allowance trading scheme. The opt-in programme was designed to help electricity plant with high costs of reduction meet their emissions targets by trading with other industrial plant with lower abatement costs. These plants participate in the scheme by reducing emissions against the agreed baseline and trading these surplus allowances, although in practice few have taken this option.
Allowances are traded in private transactions or in an annual auction operated by the EPA. Private transactions can occur between different units within economically related organisations or between distinct organisations. The ratio of these trades is shown in Figure 7.3 (EPA, 2003b). There was some concern that early in the scheme, the majority of trades occurred within organisations, a behaviour attributed to early high transaction costs, the behaviour of public utility commissions and legislation in some states promoting locally produced coal. However, that concern seems to have become less important over time, with a significant number of trades now occurring between economically distinct organisations.

Final Report 161
h:\projects\em-260\10000 projects\10819 ec lcpd\final report\final report 05225.doc July 2005 10819
Figure 7.3 SO2 allowances traded, 1994-2002
The key purpose of the auction was to provide a price signal to government and participants in the early stages of the programme, although it was also used as an additional source of allowances (approximately 2.8% of the total were offered through the auction). There has been some concern over the design of the auction (a discriminating price auction), which matches the seller with the lowest price with the buyer with the highest bid, working up the list of sellers and down the list of buyers until no more trades are accepted. Although the idea was that such an auction would maximise revenue to sellers, there is concern that sellers may under-reveal their true costs of emission control in order to improve their chances of making a sale. In practice it is not clear whether this has been the case.
However, regardless of this issue, it is more apparent that the auction has become of minimal importance in comparison to private trades. Joskow et al (1998) find that this occurred after just two auctions, although these first two were important in indicating that trading prices would be lower than predicted. The number of private trades in comparison to EPA and market trades is shown in Figure 7.4 below (EPA, 2003b). In this case, EPA and market transfers include the auction as well as Phase I extension allowances and substitution allowances.
0
5
10
15
20
25
30
35
1994 1995 1996 1997 1998 1999 2000 2001 2002
mill
ions
of a
llow
ance
s tr
ansf
erre
d
Betweeneconomicallyrelatedorganisations
Betweeneconomicallydistinctorganisations
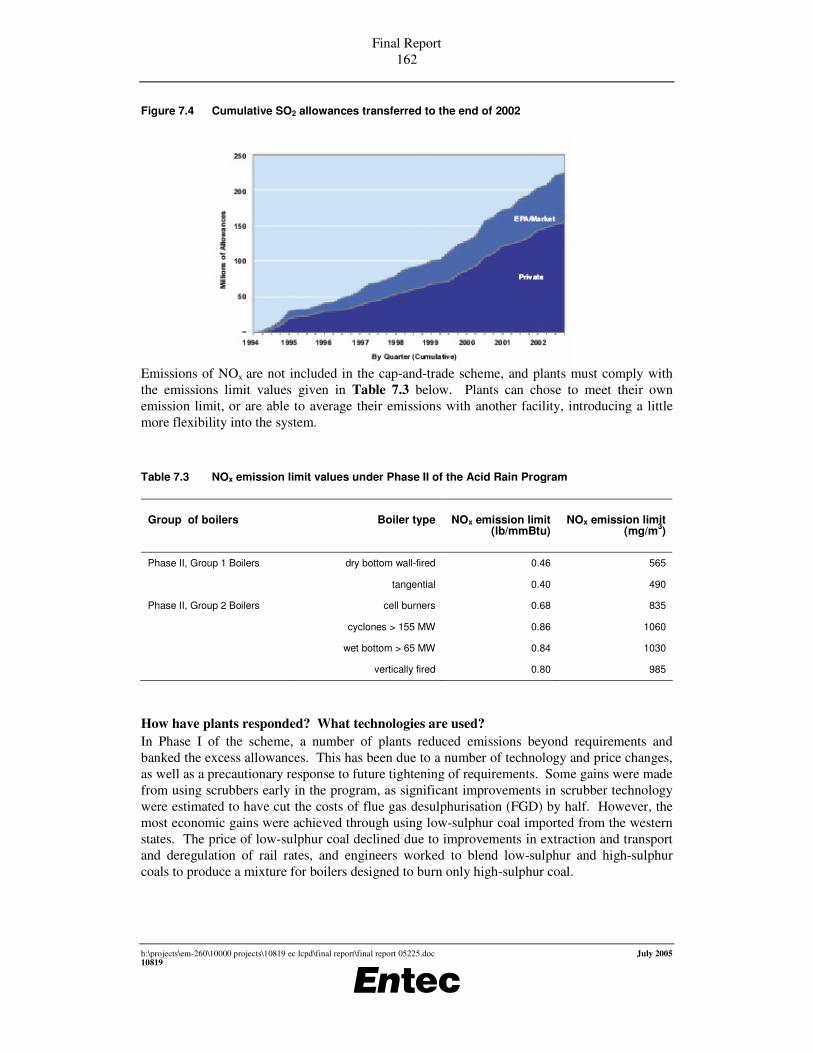
Final Report 162
h:\projects\em-260\10000 projects\10819 ec lcpd\final report\final report 05225.doc July 2005 10819
Figure 7.4 Cumulative SO2 allowances transferred to the end of 2002
Emissions of NOx are not included in the cap-and-trade scheme, and plants must comply with
the emissions limit values given in Table 7.3 below. Plants can chose to meet their own emission limit, or are able to average their emissions with another facility, introducing a little more flexibility into the system.
Table 7.3 NOx emission limit values under Phase II of the Acid Rain Program
Group of boilers Boiler type NOx emission limit (lb/mmBtu)
NOx emission limit (mg/m3)
Phase II, Group 1 Boilers dry bottom wall-fired 0.46 565
tangential 0.40 490
Phase II, Group 2 Boilers cell burners 0.68 835
cyclones > 155 MW 0.86 1060
wet bottom > 65 MW 0.84 1030
vertically fired 0.80 985
How have plants responded? What technologies are used? In Phase I of the scheme, a number of plants reduced emissions beyond requirements and banked the excess allowances. This has been due to a number of technology and price changes, as well as a precautionary response to future tightening of requirements. Some gains were made from using scrubbers early in the program, as significant improvements in scrubber technology were estimated to have cut the costs of flue gas desulphurisation (FGD) by half. However, the most economic gains were achieved through using low-sulphur coal imported from the western states. The price of low-sulphur coal declined due to improvements in extraction and transport and deregulation of rail rates, and engineers worked to blend low-sulphur and high-sulphur coals to produce a mixture for boilers designed to burn only high-sulphur coal.
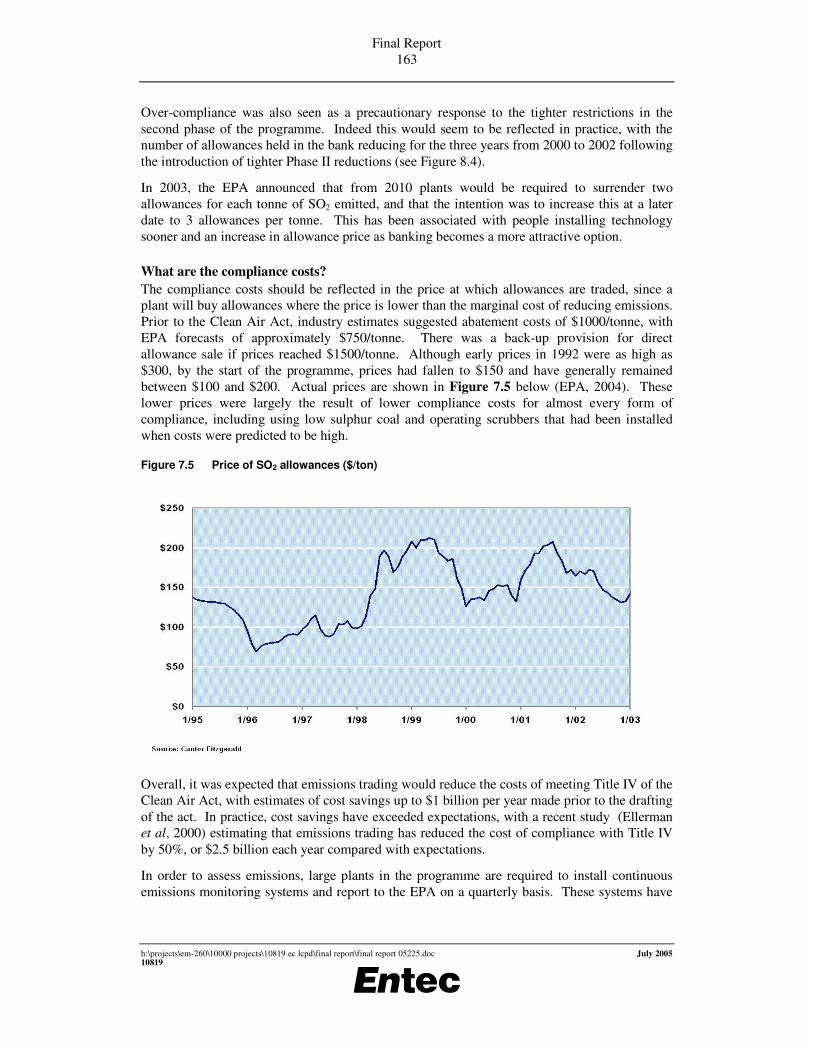
Final Report 163
h:\projects\em-260\10000 projects\10819 ec lcpd\final report\final report 05225.doc July 2005 10819
Over-compliance was also seen as a precautionary response to the tighter restrictions in the second phase of the programme. Indeed this would seem to be reflected in practice, with the number of allowances held in the bank reducing for the three years from 2000 to 2002 following the introduction of tighter Phase II reductions (see Figure 8.4).
In 2003, the EPA announced that from 2010 plants would be required to surrender two allowances for each tonne of SO2 emitted, and that the intention was to increase this at a later date to 3 allowances per tonne. This has been associated with people installing technology sooner and an increase in allowance price as banking becomes a more attractive option.
What are the compliance costs? The compliance costs should be reflected in the price at which allowances are traded, since a plant will buy allowances where the price is lower than the marginal cost of reducing emissions. Prior to the Clean Air Act, industry estimates suggested abatement costs of $1000/tonne, with EPA forecasts of approximately $750/tonne. There was a back-up provision for direct allowance sale if prices reached $1500/tonne. Although early prices in 1992 were as high as $300, by the start of the programme, prices had fallen to $150 and have generally remained between $100 and $200. Actual prices are shown in Figure 7.5 below (EPA, 2004). These lower prices were largely the result of lower compliance costs for almost every form of compliance, including using low sulphur coal and operating scrubbers that had been installed when costs were predicted to be high.
Figure 7.5 Price of SO2 allowances ($/ton)
Overall, it was expected that emissions trading would reduce the costs of meeting Title IV of the Clean Air Act, with estimates of cost savings up to $1 billion per year made prior to the drafting of the act. In practice, cost savings have exceeded expectations, with a recent study (Ellerman et al, 2000) estimating that emissions trading has reduced the cost of compliance with Title IV by 50%, or $2.5 billion each year compared with expectations.
In order to assess emissions, large plants in the programme are required to install continuous emissions monitoring systems and report to the EPA on a quarterly basis. These systems have

Final Report 164
h:\projects\em-260\10000 projects\10819 ec lcpd\final report\final report 05225.doc July 2005 10819
an initial capital cost of just over $700,000 and annual operating costs of just under $50,000. The National Center for Environmental Economics (2001) calculated that on an annual basis, these costs suggested an average of $125,000 per year or $0.16 per kilowatt of installed capacity per year for a typical plant. Smaller plants can use estimation techniques. With this arrangement, 36% of units use CEMS, but these units account for approximately 96% of emissions.
There has been little non-compliance, largely because of the high penalties imposed. These were initially set at $2,000/t SO2, and have risen in line with inflation to $2,849/t in 2002. In 2002 only one unit was short of permits (by 33 allowances, leading to a penalty of over $90,000). Offset allowances were taken from its 2003 allocation to compensate for this.
For NOx, the EPA estimates that reductions in Phase I cost an average of $227 per tonne of NOx reduced, with reductions in Phase II costing only fractionally more ($229/tonne).
To what degree has the policy achieved its objectives? The Acid Rain Program has exceeded expectations, reducing emissions beyond requirements at half the expected cost. This is largely a result of the flexibility incorporated into the programme, one element of which is emissions trading. However, there is ongoing debate about the extent to which emissions trading should be credited with all of the success.
One key measure of success of the Acid Rain Programme is the extent to which it has reduced SO2 emissions from electricity generating sources. The reduction from sources included in the programme is given in Figure 7.6 below (EPA, 2003b). This shows a reduction from 17.3 million tonnes in 1980 to 10.2 million tonnes in 2002.
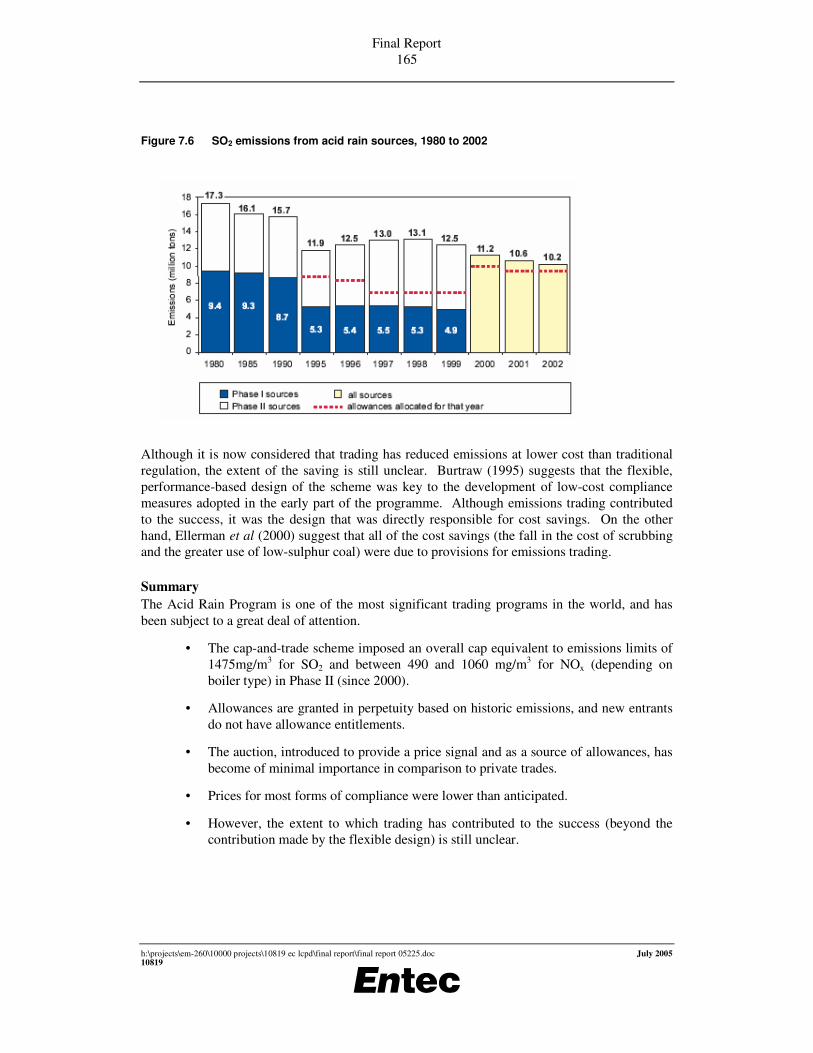
Final Report 165
h:\projects\em-260\10000 projects\10819 ec lcpd\final report\final report 05225.doc July 2005 10819
Figure 7.6 SO2 emissions from acid rain sources, 1980 to 2002
Although it is now considered that trading has reduced emissions at lower cost than traditional regulation, the extent of the saving is still unclear. Burtraw (1995) suggests that the flexible, performance-based design of the scheme was key to the development of low-cost compliance measures adopted in the early part of the programme. Although emissions trading contributed to the success, it was the design that was directly responsible for cost savings. On the other hand, Ellerman et al (2000) suggest that all of the cost savings (the fall in the cost of scrubbing and the greater use of low-sulphur coal) were due to provisions for emissions trading.
Summary The Acid Rain Program is one of the most significant trading programs in the world, and has been subject to a great deal of attention.
• The cap-and-trade scheme imposed an overall cap equivalent to emissions limits of 1475mg/m3 for SO2 and between 490 and 1060 mg/m3 for NOx (depending on boiler type) in Phase II (since 2000).
• Allowances are granted in perpetuity based on historic emissions, and new entrants do not have allowance entitlements.
• The auction, introduced to provide a price signal and as a source of allowances, has become of minimal importance in comparison to private trades.
• Prices for most forms of compliance were lower than anticipated.
• However, the extent to which trading has contributed to the success (beyond the contribution made by the flexible design) is still unclear.
Final Report 166
h:\projects\em-260\10000 projects\10819 ec lcpd\final report\final report 05225.doc July 2005 10819
7.4.3 Market-based instrument case study 2: Ozone Transport Commission (OTC) NOx Budget Program and NOx SIP Call Trading Program
The NOx Budget Program was implemented in the north east states during the summer, and aimed to improve ground level ozone. It ran from 1995 to 2003, when it was replaced with the NOx SIP Call.
Key elements of the approach The NOx Budget Program focused on NOx emissions between May and September from electric utilities and large industrial boilers in Maine, New Hampshire, Vermont, Massachusetts, Connecticut, Rhode Island, New York, New Jersey, Pennsylvania, Maryland, Delaware, and the District of Columbia.
The overall objective of the program was to reduce summertime NOx emissions as part of the effort to meet the National Ambient Air Quality Standards (NAAQS) for ground level ozone. The program included all fossil fuel fired boilers and indirect heat exchangers with a maximum rated heat input capacity of 250 MMBtu/hour or more, and all electric generating facilities with a rated output of 15MW or more, although states could include more units within the program, and additional facilities can opt-in on an individual basis.
The program was implemented in three phases. In the first phase, plants were required to install reasonably available control technology (RACT). The second and third phases developed regulations to reduce emissions, and included a regional cap on emissions. From May 1999, the region-wide budget was 219,000 tons. In May 2003, the number of permits was reduced to 143,000 tons.
In each phase, units were allocated by state governments, with each permit allowing the emission of one ton of NOx during the control period (May to September), with units allowed to trade and bank permits. However, regardless of the number of permits held, all sources were required to meet other federal and state limits (i.e. New Source Performance Standards, Title IV of the Clean Air Act (Acid Rain Program), and installation of reasonably available control technology (RACT) for NOx under previous OTC efforts). In addition, the program did not include any consideration of other programs affecting the same sources; for example, compliance with the Acid Rain Program does not indicate compliance with the OTC NOx Budget Program.
In order to prevent excessive use of banked permits in any single compliance period, Progressive Flow Control (PFC) requirements called for plants using more than a percentage of their banked allowances to surrender allowances at a rate of two to one. As a result, some benefits of a banking system were maintained, although current year permits were much more valuable than banked permits.
Towards the end of the OTC NOx Budget Program, many OTC states became more acutely aware that sufficient reductions in ozone would only be possible through reductions in emissions from upwind states. Many of these states petitioned the EPA for reductions in upwind states under Section 126 of the Clean Air Act. Partly in response to this, the EPA developed a regional trading program with these states under the NOx State Implementation Plan (SIP) Call, which has now replaced the NOx Budget Program. Table 7.4 summarises the programs and the emissions reduction targets associated with both.

Final Report 167
h:\projects\em-260\10000 projects\10819 ec lcpd\final report\final report 05225.doc July 2005 10819
Table 7.4 Emission reduction requirements for OTC NOx Budget Program
Phase Geographic Distinctions
Emissions Reduction Target (Note 1)
Ozone Season Emission Levels
1990 Baseline Not applicable Not applicable 473,000 tons (approx. baseline level)
Phase I: RACT requirements beginning May 1, 1995
All areas Approximate 40% reduction 290,000 tons (approx., no budget applies)
Inner Zone 65% or 0.20 lb/mmBtu (245mg/m3) (based on 1990 heat input)
Phase II: Trading program beginning May 1, 1999
Outer Zone 55% or 0.20 lb/mmBtu (245mg/m3) (based on 1990 heat input)
219,000 tons (budget level)
Inner & Outer Zones 75% or 0.15 lb/mmBtu (185mg/m3) (based on 1990 heat input)
Phase III: Trading program beginning May 1, 2003, but...
Northern Zone 55% or 0.20 lb/mmBtu (245mg/m3) (based on 1990 heat input)
143,000 tons (budget level)
Phase III replaced by NOx SIP Call Trading Program on May 1, 2003
No zones, but excludes ME, NH,
and VT
0.15 lb/mmBtu (185mg/m3) (based on 1995 or 1996 baseline heat input
with growth factor)
141,000 tons (budget level)
Note
1 1 lb/mmBtu of heat input corresponds to approximately 1.5 tonnes / kWh (thermal input)
Under the NOx SIP Call Trading Program, state NOx emission budgets for large power plants were based on limiting NOx emission rates to an average of 0.15 lb/mmBtu of fuel input (185mg/m3). States were free to devise their own strategies for obtaining the required reductions and were encouraged to use market-based approaches. Moreover, the EPA encouraged affected states to establish a multi-state allowance trading program to further enhance compliance flexibility and reduce overall compliance costs.
The NOx emissions limit used by the EPA to calculate NOx SIP call budgets represents an approximately 85% reduction from uncontrolled NOx emissions for most large coal fired power plants (NESCAUM, 2003). Hence, it has generally been assumed that advanced control technologies, notably SCR, would need to be installed at a significant number of facilities to achieve NOx SIP call budgets.
How have plants responded? What technologies are used? Under Phase I of the program, all plants covered were required to install reasonably available control technology (RACT). These rules were comparable to, and in some cases went further than, controls for existing coal-fired boilers required by the EPA under the Acid Rain Program. An assessment of technology used in complying with RACT in Maryland (Maryland PPRP, 1999) found that the requirement had primarily been interpreted as low NOx burners and overfire air. Because of the considerations of cost-effectiveness included in the definition, only larger electricity power generating units installed these technologies, while smaller units were only required to optimise combustion.
Under Phase III of the program (NOx SIP Call Trading Program, commenced on May 1, 2003) there has been a significant shift towards the fitting of SCR. At least 66GW of capacity is committed to fitting SCR, representing at least 115 individual units (NESCAUM, 2003). Only a

Final Report 168
h:\projects\em-260\10000 projects\10819 ec lcpd\final report\final report 05225.doc July 2005 10819
handful of SCR systems had been installed at US power plants at the time the NOx SIP call was issued.
Compared with the average state-wide required NOx reduction of approximately 85%, it is reported (NESCAUM, 2003) that NOx emissions reductions in excess of 90% can be expected to be consistently delivered by actual SCR systems, with the allowance trading component of the NOx SIP call providing an incentive for units to over-control if additional tons can be reduced at less cost than the market price of NOx allowances. For example, it is claimed that the SCR unit at AES’s ‘New Madrid’ plant will achieve 93% NOx reductions. NOx rates as low as 0.05 lb/mmBtu (62mg/m3) (equating to approximately 95% NOx reduction) are reported to have been achieved at retrofitted units such as AES’s ‘Somerset’ plant.
In addition to SCR, some units committed to other technologies, including rotating overfire air and reburn technology.
What are the compliance costs? Compliance costs can be represented by the prices at which allowances trade. In the case of the NOx Budget Program, after an initial spike in 1999, prices for current year allowances have stabilised at around $750 (approximately �630) (OTC, 2003).
To what degree has the policy achieved its objectives? There has been a significant reduction in emissions of NOx from sources covered by the OTC Budget Program. Emissions by state are shown in Table 7.5 below. Overall, covered units reduced emissions by 59% from the 1990 baseline by 2002. The annual emissions are approximately 10% below allocation.
Table 7.5 OTC NOx Budget Program state allocations and emissions (tons)
State Baseline (1990) emissions 2002 allocation 2002 emissions
Connecticut 11,130 5,866 2,953
Delaware 13,510 6,142 5,582
District of Columbia 576 481 611
Maryland 54,991 22,881 29,171
Massachusetts 41,330 18,146 12,673
New Hampshire 14,589 5,119 2,528
New Jersey 46,963 17,340 17,084
New York 85,642 47,016 38,317
Pennsylvania 203,181 93,558 84,224
Rhode Island 1,099 626 250
Total 473,011 207,756 193,393
There has been some concern that implementing a regional control program will transfer pollution outside of the region, and this concern was increased with data that showed that generation from large Acid Rain Program units declined between 1997 and 2001 as a proportion

Final Report 169
h:\projects\em-260\10000 projects\10819 ec lcpd\final report\final report 05225.doc July 2005 10819
of electricity demand. Although it has since been shown that this reduction is more than compensated for by an increase in generation from nuclear fuel within the region, exporting emissions remains an underlying concern.
The extent to which the NOx Budget Program has contributed to a reduction in ozone concentrations is much harder to determine. In particular, the substantial reductions achieved by the Program have been partially offset by increase in emissions from mobile sources, notably transport.
Summary The OTC NOx Budget Program was introduced to address regional NOx emissions and ozone formation.
• The program was required to undertake action and achieve objectives within constraints of pre-existing policies including New Source Performance Standards and the Acid Rain Programme.
• The first phase of the program required installation of reasonably available control technology (RACT), conceptually similar to BAT under the IPPC Directive. For larger plant this has required low NOx burners and overfire air.
• In moving to the NOx SIP Call that has replaced the OTC program, many plants (at least 66GW of capacity) have committed to installing SCR to comply with the tighter emissions reduction targets. These require an average state-wide reduction of approximately 85% from uncontrolled NOx emissions at coal fired power plants, equivalent to 185mg/m3. The compliance period, however, is only during the ozone season (1 May to 30 Sept).
• In practice, it is reported that SCR systems are over-complying in comparison to the NOx SIP Call targets, with actual emissions abatement performance in excess of 90%.
• Due to the regional focus of the scheme, an underlying concern remains that electricity production would be transferred out of the region.
7.4.4 Market-based instrument case study 3: Regional Clean Air Markets Initiative (RECLAIM)
Which sectors and which pollutants are covered? The Regional Clean Air Markets Initiative (RECLAIM) was adopted by the South Coast Air Quality Management District and established a cap-and-trade scheme in the South Coast Air Basin. In particular, the scheme aimed to reduce the cost associated with an emissions reduction of 80% by 2003. The scheme started on the 1st January 1994 to address emissions of nitrogen oxide (NOx) and sulphur oxide (SOx). Stationary sources that had emitted in excess of 4 tons of NOx or SOx in any year since 1990 were included in the scheme. There are over 350 facilities participating in the NOx market and about 40 in the SOx market.
The scheme replaced previous efforts to reduce emissions, which had been ongoing since the issue of local air pollution in Southern California was first taken serious note of in the early 1940s. These previous efforts had relied on regulating for the development and application of cleaner technologies, and there had been success using these to reduce levels of emissions.

Final Report 170
h:\projects\em-260\10000 projects\10819 ec lcpd\final report\final report 05225.doc July 2005 10819
Under the RECLAIM program, facilities are issued with permits based on their historical activity levels and applicable emission control levels or in the local Air Quality Management Plan. The initial allocation was established by applying an emission factor to the maximum annual throughput that had occurred at the plant between 1989 and 1992 inclusive. A further emission calculation was made for 2000 based on reduced emissions factors. Allocations for the interim years were made by applying a constant reduction to achieve the rate calculated for 2000. Further reductions were assumed between 2000 and 2003 in order to achieve the target for 2003 assumed in the 1991 Air Quality Management Plan.
Plants can choose to comply over financial or calendar years, although this has reduced the transparency of activities and reduces ability of regulators and environmental groups to assess companies’ performance.
There was only limited banking incorporated into the design of the RECLAIM scheme through the use of a two-cycle market. In retrospect, banking would have exacerbated the problems experienced in 2000, and analysis suggests that banking could have resulted in complete collapse of the market at that time.
In general, the electricity power industry producers have been the largest purchaser of NOx credits and the petroleum industry has been the largest purchaser of SO2 credits.
How have plants responded? What technologies are used? A review of the effects of RECLAIM suggested that although most large companies attempt to weight the price of credits and the marginal cost of compliance in considering whether to install control technology, uncertainty over the price of credits limits the investment in reductions. Therefore, companies have tended to favour technologies with short payback periods and have installed controls to stay in compliance rather than to reduce emissions beyond requirements. In addition, the long term planning undertaken by small and medium sized enterprises has tended to relate to their market strategy rather than environmental compliance. Overall, companies have tended to be fairly conservative, installing technologies that are thoroughly tested, with only a few organisations employing more innovative approaches.
In the early years of the program, there was an excess of permits available on the market, so that the low price of credits encouraged firms to comply by buying permits rather than reducing emissions. Regulated facilities reduced their actions to control emissions. For example, under the previous regulations, power producers would have been required to install technologies such as SCR (as the Best Available Control Technology) by 1999. However, many facilities cancelled orders for SCR when the RECLAIM program was introduced. Since then, there has been some debate over whether actions taken exceed those that would have been achieved by regulation. The majority of environmental and regulatory stakeholders believe that the lag in introducing technology caused by the excess of permits has resulted in lower overall reductions than would have been achieved through traditional regulation. However industry participants have argued that since the increase in price of permits in 2000, the overall level of control is equal to or greater than would have otherwise occurred. In addition, they argue that smaller sources that would not have been covered by traditional regulations have installed significantly more controls than would otherwise have been the case.
What are the compliance costs? As with other trading programs, it is assumed that the compliance costs for affected facilities are indicated by allowance prices. This would suggest that there were minimal costs of compliance
Final Report 171
h:\projects\em-260\10000 projects\10819 ec lcpd\final report\final report 05225.doc July 2005 10819
during the period in which there were excess allowances (1994-1999), but the costs of compliance increased significantly after that period. In terms of installing monitoring equipment, some facilities have installed continuous emissions monitoring systems (CEMS), although many still rely on emissions factors to estimate pollution levels.
There have also been costs for the regulator associated with monitoring the program, and the money needed to determine facility compliance and resolve disputes has been more than envisaged and more than required for the traditional regulations. In addition, there were initial costs associated with retraining inspectors.
To what degree has the policy achieved its objectives? Although the RECLAIM program reduced the costs of emissions initially, this has been attributed to the lower efforts made to control emissions, resulting in higher emissions of both NOx and SOx. Most notably, the price of credits rose dramatically during 2000, triggering changes to be made to the operation of the program.
In the first three years of the RECLAIM program, there was limited trading, with most emissions traded for zero price. From 1997-1999, more trading occurred, with prices of $1500-$3000 per ton, although the majority of credits were still traded at zero price. These prices were still significantly lower than those expected when the program was adopted, with models predicting prices rising from $577 per ton in 1994 to $11,257 in 1999. In 2000, however, there was a significant change in the credit market. As discussed in the White Paper on Stabilisation of NOx RECLAIM Trading Credit (RTC) prices,
“Beginning June 2000, RECLAIM program participants experienced a sharp and sudden increase in NOx [RECLAIM Trading Credits] prices for both 1999 and 2000 compliance years. The average price of 1999 NOx RTCs traded in 2000 was $15,377 per ton, which was almost ten times higher than the average price of $1,827 per ton of NOx RTCs traded in 1999 for the same compliance year. More significantly, the average price of NOx RTCs for compliance year 2000, traded in the year 2000 increased sharply to over $45,000 per ton compared to the average price of $4,284 per ton traded in 1999.”
The increase in prices is attributed to three main factors (EPA, 2002). Firstly, the energy market was deregulated, increasing the demand for power generation. This caused a significant increase in the purchase of permits by this sector, reducing the availability of permits for other facilities. Secondly, there was a crossover point at this time, from a surplus to a shortfall in the supply of permits relative to demand. This can be seen in Figures 7.7 and 7.8 below. Related to this point, power plants and other participants had generally been delaying installation of technologies to reduce emissions.
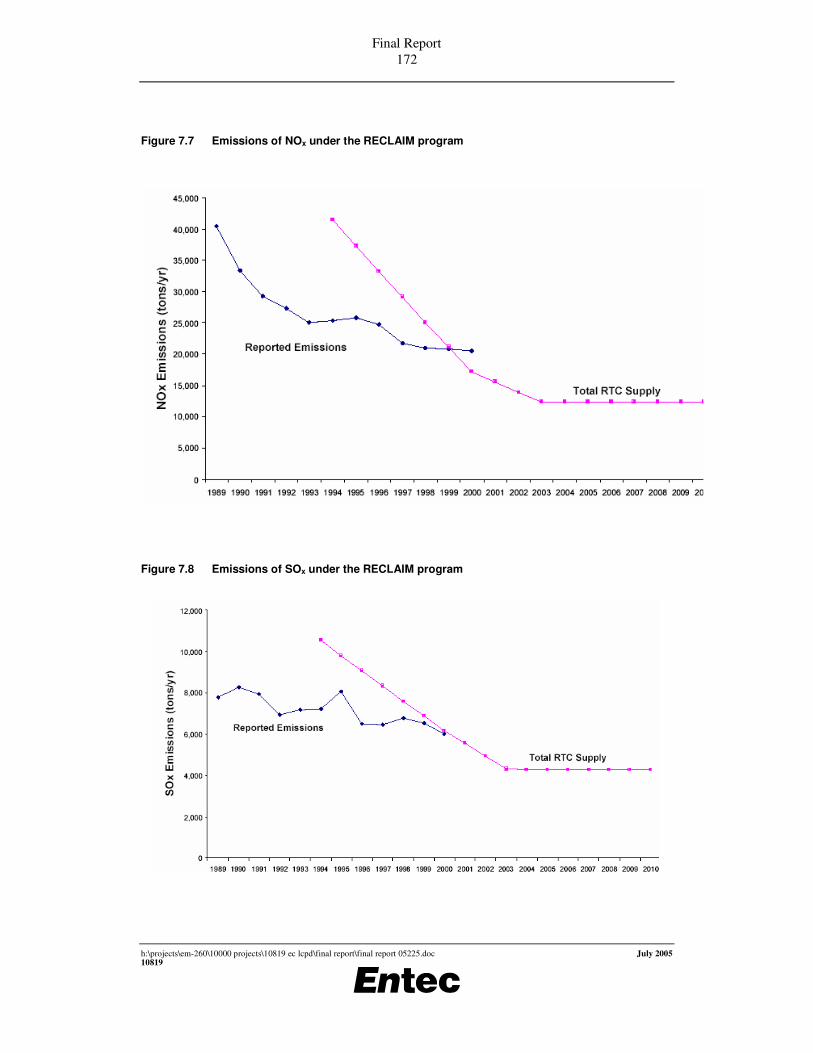
Final Report 172
h:\projects\em-260\10000 projects\10819 ec lcpd\final report\final report 05225.doc July 2005 10819
Figure 7.7 Emissions of NOx under the RECLAIM program
Figure 7.8 Emissions of SOx under the RECLAIM program
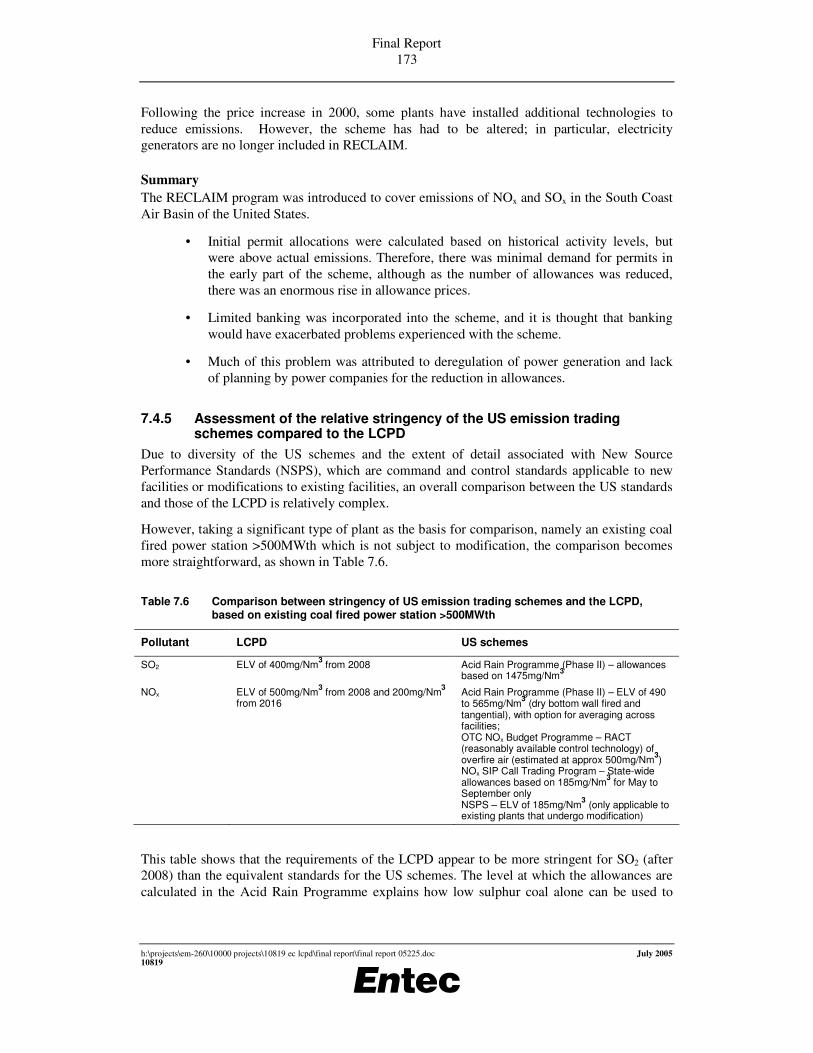
Final Report 173
h:\projects\em-260\10000 projects\10819 ec lcpd\final report\final report 05225.doc July 2005 10819
Following the price increase in 2000, some plants have installed additional technologies to reduce emissions. However, the scheme has had to be altered; in particular, electricity generators are no longer included in RECLAIM.
Summary The RECLAIM program was introduced to cover emissions of NOx and SOx in the South Coast Air Basin of the United States.
• Initial permit allocations were calculated based on historical activity levels, but were above actual emissions. Therefore, there was minimal demand for permits in the early part of the scheme, although as the number of allowances was reduced, there was an enormous rise in allowance prices.
• Limited banking was incorporated into the scheme, and it is thought that banking would have exacerbated problems experienced with the scheme.
• Much of this problem was attributed to deregulation of power generation and lack of planning by power companies for the reduction in allowances.
7.4.5 Assessment of the relative stringency of the US emission trading schemes compared to the LCPD
Due to diversity of the US schemes and the extent of detail associated with New Source Performance Standards (NSPS), which are command and control standards applicable to new facilities or modifications to existing facilities, an overall comparison between the US standards and those of the LCPD is relatively complex.
However, taking a significant type of plant as the basis for comparison, namely an existing coal fired power station >500MWth which is not subject to modification, the comparison becomes more straightforward, as shown in Table 7.6.
Table 7.6 Comparison between stringency of US emission trading schemes and the LCPD, based on existing coal fired power station >500MWth
Pollutant LCPD US schemes
SO2 ELV of 400mg/Nm3 from 2008 Acid Rain Programme (Phase II) – allowances based on 1475mg/Nm3
NOx ELV of 500mg/Nm3 from 2008 and 200mg/Nm3 from 2016
Acid Rain Programme (Phase II) – ELV of 490 to 565mg/Nm3 (dry bottom wall fired and tangential), with option for averaging across facilities; OTC NOx Budget Programme – RACT (reasonably available control technology) of overfire air (estimated at approx 500mg/Nm3) NOx SIP Call Trading Program – State-wide allowances based on 185mg/Nm3 for May to September only NSPS – ELV of 185mg/Nm3 (only applicable to existing plants that undergo modification)
This table shows that the requirements of the LCPD appear to be more stringent for SO2 (after 2008) than the equivalent standards for the US schemes. The level at which the allowances are calculated in the Acid Rain Programme explains how low sulphur coal alone can be used to
Final Report 174
h:\projects\em-260\10000 projects\10819 ec lcpd\final report\final report 05225.doc July 2005 10819
achieve compliance. For example, the use of coal in the range 0.6 to 0.7% sulphur may be sufficient in order to comply with the SO2 allowances in the Acid Rain Programme, without the need for FGD.
For NOx, the requirements of the LCPD from 2008 appear broadly similar to the Acid Rain Programme ELVs and RACT under the OTC NOx Budget Programme. The allowances under the NOx SIP Call Trading Programme are broadly similar to the requirements of the LCPD from 2016, although this trading programme is only operational from May to September each year, whereas the LCPD ELV is applicable all year round.
Therefore, the LCPD appears relatively stringent in comparison to the current requirements of the US schemes, with greater similarities in standards for NOx than SO2. The scope for achieving additional emissions reductions beyond those expected under the LCPD is discussed separately in Section 4.
7.5 Screening level analysis of feasibility and desirability of market based instruments for SO2 and NOx in the EU LCP sector
7.5.1 Rationale for introducing trading or taxation Command and control
Traditionally, environmental regulation has been based on ‘command and control’ (CAC) regulations. CAC is characterised by the setting of explicit or implicit environmental standards on emissions or ambient quality. Explicit emission standards take the form of a total constraint on emissions or a relative constraint (eg, emissions per unit of economic activity). Explicit ambient standards take the form of a limit on the concentration of a pollutant relative to the receiving environment (eg, parts per million, micrograms per cubic metre, etc). Implicit CAC standards are generally technology-based: constrained emission levels are set by whatever the (environmentally) ‘best’ technology is (eg ‘best available techniques’, or BAT). Explicit CAC standards permit the polluter some flexibility in meeting the standards (ie, some choice exists on how to reduce emissions). Implicit technology-based standards (which are true CAC measures since they limit both the amount emitted and the means of reducing emissions) offer no such flexibility. Moreover, technology-based standards are set plant by plant, so that polluters cannot substitute more environmentally efficient technology in plant A for less efficient technology in plant B.
Market-based instruments
Market-based instruments (MBIs) approach regulation from the standpoint of setting an explicit or implicit price for emissions.
An explicit price takes the form of a tax or levy. A direct form of a tax is a tax on the emissions or on the ambient quality damage done. An indirect form of a tax is on the product embodying the pollution—a ‘product’ tax. The form of tax matters since these options are not equally efficient in terms of delivering environmental goals. Thus, the first issue in tax design that needs to be addressed is the target of the tax—ie, where in the product life cycle the tax is located.

Final Report 175
h:\projects\em-260\10000 projects\10819 ec lcpd\final report\final report 05225.doc July 2005 10819
An implicit price emerges from the setting of permits or quotas for emissions (or resource use generally) and by then allowing for those quotas to be exchanged, or traded. Thus, each unit of pollution is associated with a given quantity-based permit (eg, a permit might be for 1 tonne of NOx). The tradability of the permits is what distinguishes the implicit price approach from CAC emissions-based standards. Emitters with high costs of reducing emissions (high abatement costs) will find it financially more difficult to reduce emissions than will low-cost emitters. The potential for trade exists if the low-cost emitters can reduce emissions beyond their set quota of permits (over-compliance) and sell their excess permits to those who under-comply. The trade in permits will produce a market price for permits that is related to the abatement costs of the emitters.
There are numerous other forms of MBIs and ‘quasi-MBIs’, including, for example:
• voluntary and negotiated contracts/agreements which involve agreements between regulators and emitters to ‘self-regulate’ with or without some back-up threat of other regulatory action;
• liability regulations which result in an insurance market as emitters take out insurance against the liability;
• emitter or consumer information provision (eg, eco-labelling, pollution registry) which may result in voluntary action to reduce emissions or alter consumer purchasing behaviour away from polluting products;
• mixed tax-subsidy schemes;
• hybrid MBIs which, for example, may combine trading and taxation;
• explicit subsidies for environmentally beneficial behaviour; and
• ‘market creation’ whereby emitters, who may have the property rights, are paid by beneficiaries (or their agents, usually the government) to reduce pollution.
The focus here is on trading and taxation as the main forms of MBI that have been introduced in a number of countries as complements to CAC measures. When they are combined, the balance between CAC and MBIs varies across countries and according to the issue being addressed. In general, however, the policy profile of MBIs has increased significantly in the past decade.
Advantages and disadvantages of MBIs over CAC
• In principle, both permit trading and taxes help to minimise the cost of compliance with the desired environmental standard. Cost-minimisation is important in order (a) to avoid unnecessary impacts on the competitiveness of the industries targeted by the MBI, (b) to prevent creation of an industrial lobby against further environmental measures; and (c) to minimise the consumer price rises that may result from the additional costs borne by emitters. The degree of this benefit of MBIs depends on the existence of variability of the abatement cost of different emitters—the greater the variability, the greater the cost-minimising benefit of MBIs.
• The price changes associated with MBIs are comprehensive. This means that their incentive effect extends to (a) changing the technology used to generate the polluting product—cleaner technology reduces emissions which then attract less tax

Final Report 176
h:\projects\em-260\10000 projects\10819 ec lcpd\final report\final report 05225.doc July 2005 10819
or generate more surplus permits; (b) changing the product mix of the firm away from polluting to less polluting products; (c) raising awareness among polluters that pollution affects production costs; and (d) encouraging consumers to switch from polluting products to less polluting ones due to the higher price of the former. Effects (b) and (c) may be present with CAC measures although, in practice, cost increases tend to be less visible and transparent.
• Taxes and auctioned permits generate revenues to the regulator/government. Depending on the view taken and the design of the MBI ‘package’, revenues may be used to reduce other distortionary taxes in the economy, especially labour taxes, and part of the revenues may be used to create environmental funds that are then targeted at specific environmental goals, such as R&D. This ‘double dividend’ argument, which involves a ‘green dividend’ of encouraging reduced pollution and a ‘blue dividend’ of reducing deadweight inefficiency costs in the economy, has been widely used to justify revenue-raising MBIs. The current consensus is that, while the existence of a green dividend is confirmed, the interaction of the environmental tax and existing taxes—the ‘tax interaction effect’—produces ambiguous net effects (ie, the blue dividend is disputed and the net effects may not be beneficial).
• The price increases associated with MBIs may stimulate technological change in emissions abatement (eg further advances in ‘primary’ NOx abatement measures). The price impact is continuous because the effect applies to all emissions. In contrast, CAC measures using standards contain no incentive to control emissions up to the level set by the standard. This is the ‘dynamic’ effect of MBIs, which is generally absent in CAC.
• There is probably greater regulatory flexibility with MBIs since the total allowable permits or the size of the tax can be changed at regular intervals to reflect changed information on environmental goals and achievements. It may be more difficult to change standards, especially technology-based standards. However, this flexibility may be seen as a disadvantage by emitters who seek certainty in the policy context affecting their investment decisions. They may also fear that governments will use environmental taxes as a conventional tax base for raising revenue unrelated to environmental needs.
• The degree of emissions reduction varies by location with MBIs and this may produce ‘hot spots’ where, for example, permit holders have purchased permits rather than abating emissions. Technology-based CAC avoids this locational effect, which may be undesirable for distributional reasons, since all plants adopt the same technology. In practice, however, the potential for such ‘hot spots’ should be minimised by the effect of the Air Quality Daughter Directives, as well as underlying CAC policies including the requirement to comply with BAT under the IPPCD.
• More generally, the advantages of MBIs are clearest where pollutants are uniformly mixed—ie, environmental damage done is not significantly affected by the location of the source of emissions. This is the case for all greenhouse gases. The efficiency of MBIs is less when pollutants are not mixed, as with SOX and NOX. More detail on the use of MBIs when emission location matters is given later.
Final Report 177
h:\projects\em-260\10000 projects\10819 ec lcpd\final report\final report 05225.doc July 2005 10819
• The informational requirements of MBIs tend to be less, assuming that the goal of policy is an economically efficient level of pollution (one where the net benefits of control are maximised). CAC and MBIs require knowledge of aggregate abatement cost and benefit (avoided damage) functions, but CAC also requires knowledge of individual emitters’ abatement cost functions.
The choice between taxes and permit trading
Where the case for MBIs is accepted, the following considerations arise when choosing between taxes and tradable permits:
• The revenue-raising advantages are absent if tradable permits are allocated free of charge to emitters (‘grandfathering’) and this may favour the tax option. Typically, tradable permit systems have been dominated by grandfathering, with some allowance for auctions to encourage new entrants to the industry who might otherwise be deterred by the need to buy permits from existing polluters, who in turn may hoard them to prevent competitive entry. (The US sulphur trading scheme has an auction provision, as has the EU Emissions Trading Scheme for carbon).
• There is greater environmental certainty with a tradable permit scheme than with a tax. This is because trading works with an aggregate quota of permits equal to the overall desired level of emissions, and the price of permits results from this overall constraint. With taxes, the final level of emissions depends on the level of demand responsiveness, technology switching, etc, which is generally not known in advance. For the tax option, then, regulators must be prepared to change the tax until such times that the environmental goal is met. Put another way, regulatory adjustment is likely to be higher with a tax than a permit system. Such adjustments may instil uncertainty and suspicion among emitters.
• In the context of uncertainty about ‘true’ abatement costs, the choice between tradable permits and taxes can depend, in part, on the steepness of the curve showing the relationship between emissions and extra control cost (the marginal abatement cost curve) and that of the curve showing how extra damages vary with emissions (the marginal damage cost curve). If the slope of the cost curve is less than the slope of the damage curve, permits may be preferred to taxes. If the slope of the cost curve is greater than the slope of the damage curve, taxes may be preferred. The rationale for these preferences is that if damages rise very steeply with emissions, then it may be considered important to set a ceiling on the quantity of emissions to avoid an escalation of damages. On the other hand, if damages rise gradually with emissions, then it may be better not to limit the quantity emitted (ie, a tax instrument is preferred), so that the freedom of the polluter to choose their quantity of emissions is preserved.
• In the context of uncertainty about damages there are no implications for the choice of permits over taxes. Where uncertainty is extensive, more precautionary measures may be required—ie, the case for MBIs may be lessened.
The general conclusion is that MBIs have a number of advantages over conventional CAC regulation, especially in respect of the potential for continuous technological change, compliance cost minimisation and revenue-raising. These advantages are not unqualified, however, and hence there has to be a process of careful design to suit specific circumstances, especially where the pollutants are not uniformly mixed, as with SO2 and NOx.
Final Report 178
h:\projects\em-260\10000 projects\10819 ec lcpd\final report\final report 05225.doc July 2005 10819
7.5.2 Introducing trading or taxation in addition to existing CAC regulation The experience of actual environmental policy is that no single approach to meeting environmental targets is adopted. CAC measures may be mixed with MBI measures in various ways, and, even where CAC prevails, different types of CAC policies may be adopted. In part, this reflects the need for policies to adjust over time to changing demands for environmental quality and new scientific information about environmental damage and its causes. In part, it reflects the fact that there are often existing policy instruments in place—there will usually be an entire history of legislative measures at least some of which cannot be changed.
A number of issues arise when considering the role that MBIs may play in a context where CAC regulations already exist and where it is unlikely that they will be replaced wholesale by an MBI. In what follows, we assume that the environmental goals are the same regardless of whether MBIs or CAC is adopted.
• Where the CAC measures take the form of technology-based standards, as is the case with much European environmental policy, the gains from adding in MBIs may be limited. This is because the CAC measure imposes a standard technology on each plant. MBIs only work when abatement costs vary from plant to plant since it is this variation that enables emissions control to be concentrated in low-cost plant. But if each plant is already operating with the ‘best’ technology and no plant is allowed to operate with less than this technology, there is no flexibility in costs to exploit the advantages of MBIs. This suggests that close inspection of the technology standards is required to identify the potential for ‘gains from trade’. By and large, variations in abatement costs in the large combustion plant sector under Integrated Pollution Prevention and Control (IPPC) appear to permit such gains to be secured. Hence, MBIs can ‘fine-tune’ the IPPC system.
• As noted above, trading and taxation may result in the existence of high abatement cost ‘hot spots’ where it is cheaper to buy permits or pay the tax than reduce pollution. Such effects are likely to be undesirable from an environmental policy standpoint because local populations will be adversely affected compared with populations where abatement is cheaper than the tax or the permit price (ie, environmental quality will be unevenly distributed). This issue of non-uniformly mixed pollution is of central importance and is directly relevant to sulphur and nitrogen emissions. However, as mentioned before, the realistic potential for such ‘hot spots’ should be minimised by the effect of the Air Quality Daughter Directives, as well as underlying CAC policies including the requirement to comply with BAT under the IPPCD.
• If there remained a potential hot spots problem, despite the effect of the abovementioned and other policies, the potential solutions are several. The first is to abandon MBIs in favour of technology-based solutions to ensure that environmental quality is reasonably evenly distributed. Any permits to emit must then be non-transferable. There is thus a clear trade-off between the distributional goal of environmental quality and aggregate compliance costs. The second is to ‘zone’ emissions by locating new sources away from hot spots and encouraging existing firms to relocate. This will usually not be feasible. The third is to introduce location-specific taxes, which implies that the information needed to set such taxes would be the same as that for optimal CAC regulations—knowledge of each firm’s abatement costs would be required. Non-uniform taxes thus lose most of the

Final Report 179
h:\projects\em-260\10000 projects\10819 ec lcpd\final report\final report 05225.doc July 2005 10819
advantages of the tax solution—informational requirements have not improved over CAC, and the advantages of a single tax rate have been lost. The fourth option is to allocate permits by location in such a way that environmental quality achieved is the same everywhere. This will require locational restrictions on permit trading—ie, trades will tend to take place within regions. Trades that affect environmental quality outside a region will be subject to a side constraint that environmental quality should not deteriorate in those receptor regions. These are ambient-based tradable permit schemes. Rather than working via ambient-based limits, the Large Combustion Plant Directive is emissions-based, but with emissions reductions varying by Member State according to various considerations.
• The informational demands of an ambient-based tradable permit scheme may still be less than under CAC. This is because the regulator still does not need to know each and every firm’s abatement costs. Nonetheless, for such a scheme to work well, it can be seen that the informational demands would be substantially greater than for a scheme that assumes sulphur and nitrogen emissions are akin to uniformly mixed pollutants.
• The problem outlined above has direct parallels in practical experience. For example, the UNECE Long-Range Transboundary Air Pollution Second Sulphur Protocol of 1994 ‘enables’ trading in sulphur across the UNECE region. But no such trades have taken place precisely because there is a ‘third party’ condition to the effect that no trade should worsen the sulphur deposition loads in any area not subject to the trade. The US trading scheme operates in two stages: first, by leaving the third-party impacts to one side when determining efficient trades, and then by allowing any third party with a grievance to use the law to object to the trade affecting them.
• The other problem noted above with a tradable permit scheme is the potential for the exercise of market power by those in possession of permits. Where CAC and a tradable permit scheme co-exist, new entrants will have to meet the CAC standards and may also need to buy permits. Reservation of a fraction of allowances for an auction helps to avoid the problem of barriers to entry. One cause for comfort is that new entrants may well be those with more up-to-date technology, which should mean that they are lower-cost entrants with less need to purchase permits.
The previous considerations apply to a world in which the CAC and MBI goal is the same. But it is possible that when the two schemes are mixed, the goals could be different; for example, the cap in a tradable permit scheme could be different to the CAC emission limits. Trading may still deliver least cost abatement if the emissions cap is set below the emissions expected under command and control regulations alone. Similarly, taxation may deliver least cost abatement if the tax rate is set above the marginal cost of abatement under command and control regulation. If the tax rate is set too low, it will not stimulate any new abatement.
Therefore trading or taxation may be appropriate where the command and control regulation sets the safety net or minimum threshold of emissions performance and the allowance cap sets a more ambitious desired level. It may not just be appropriate but may also be preferable to use trading to achieve a more ambitious desired level of emissions where there is uncertainty in the costs of abatement, and taxation may be preferred where there is concern that the cost of abatement could be excessive if a cap is imposed.

Final Report 180
h:\projects\em-260\10000 projects\10819 ec lcpd\final report\final report 05225.doc July 2005 10819
Where CAC regulation is applied in a discretionary way to individual plant or firms (for example, under the Integrated Pollution Prevention and Control Directive individual Member States can determine BAT at a site level), a tradable allowance system may help to smooth out the uneven financial impact of discretionary regulatory decisions. It can do so provided the allocation of allowances is not linked to the CAC decision. So, for example, if two firms are given the same volume of allowances, but firm A is required to achieve a much lower level of emissions than firm B under command and control regulation, then A will be compensated by being able to sell more allowances (or not having to buy so many) than B within the trading scheme. However, if firms C and D are required to abate by the same amount under the command and control regulations, even though C has higher marginal abatement costs than D, firm C would not be compensated by a trading scheme unless the allocation made to C is deliberately increased in compensation.
Thus trading has the potential to compensate for variations in abatement targets imposed by CAC regulation, but not for variations in the marginal costs of abatement between firms. It is not the trading itself that creates the compensation but the way in which the allocation of grandfathered allowances is made.
7.5.3 Hybrid tax and permit trading schemes Just as CAC and MBI measures may co-exist, so might permit trading and taxation. An example might be the UK Climate Change Levy, which comprises an energy tax on industry but with 80% tax exemption for major emitters of CO2 if they agree to a Climate Change Agreement which requires them to reduce emissions by an agreed amount relative to a ‘business as usual’ path. Parties to the Agreements that over-comply with their agreed targets then generate credits which may be entered into the UK Emissions Trading Scheme, a tradable permits scheme for CO2. Thus, a tax, a negotiated agreement, and trading all co-exist.
Hybrid tax permit schemes have their justification in the discussion above on the context in which there is uncertainty about the aggregate abatement cost of firms. In such a context, a tradable permit scheme might be introduced with the level of permits equal to the ‘optimal’ level of emissions, where this optimum is what the regulator believes to be the optimum, but where there is uncertainty. A tax is introduced in addition to the trading scheme. If abatement costs turn out to be above the level originally anticipated then firms may pay the tax rather than buy permits at a price above the tax level. Effectively, the tax sets a cap on the price of permits, which cannot rise above the tax rates. Generally, the ‘cap price’ will be above the level of tax if the tax alone were used to control emissions, depending on the degree of uncertainty about the abatement cost curve. The existence of the cap provides ‘comfort’ to polluters who may fear the effects of a trading scheme with no potential limits on the permit price, and effectively reduces the efficiency losses arising from permits or taxes alone when abatement costs are uncertain. Hybrid systems, which place a tax ceiling on, and possibly a subsidy floor under, the permit price are more efficient than the pure application of either a tax or a permit trading system. The reason is that if permits are scarce and abatement costs high, the market would only be in equilibrium if permit prices are high, and, for the purpose of this example, higher than the marginal damage cost. Thus, capping the price at a ceiling prevents prices from reaching inefficiently high levels. There is an important observation that the ceiling should be set at a level higher than the estimated optimal tax to reflect the uncertainty around the optimal level. A sliding-scale system can be used to refine this efficiency advantage by putting in additional intermediate subsidy or tax thresholds, leading to a permit price path that approximates the marginal damage curve more precisely.

Final Report 181
h:\projects\em-260\10000 projects\10819 ec lcpd\final report\final report 05225.doc July 2005 10819
These features are especially important if, for some reason, there is a temptation to issue highly demanding emissions reductions under a tradable permit scheme. However, designing such a hybrid scheme to ensure that it is as close as possible to an efficient solution is far from simple.
Other hybrid schemes can be devised. An example is a scheme where the cap on the permit price is set by a tax in the manner described above, but a lower bound is also set by a subsidy. Firms with permits in excess of their emissions receive the subsidy and those with permits below their emissions pay the tax. The literature shows that the hybrid scheme with a tax cap alone can be devised so as to ‘mimic’ approximately the marginal damage function (which is what is required for an efficient system), but a scheme with a tax and a subsidy may provide an even closer approximation of the damage function. In short, trading with upper and lower tax/subsidy bounds is efficient. While there are schemes in existence that have features of these hybrid schemes (eg, the UK Climate Change Levy combines a tax and trading, and various European trading schemes in renewable energy certificates combine trading with an upper limit to the permit price), the more ideal the scheme becomes in terms of economic efficiency, the more complex it is to design, monitor and enforce. Overall, then, it seems likely that any practical scheme will at best approximate optimal schemes.
The presence of a tax element in a hybrid scheme also introduces revenue generation into the policy instrument. Where tax and subsidy elements are present, the revenue effect depends on the net effect of the tax and subsidy. Where net revenues are generated, all the options for hypothecation exist.
7.5.4 The potential need for further reductions in EU SO2 and NOx emissions beyond business as usual reductions
The potential need for further reductions in EU SO2 and NOx emissions beyond business as usual reductions will be under future investigation within other projects as the CAFÉ programme develops further. Such work would be expected to take advantage of the various emissions / environmental modelling systems that have been developed for this purpose (eg RAINS / EMEP). As such, it is not possible within the scope of this project to comment on the potential need for further reductions.
Assuming that a need for further reductions is confirmed, then the LCP sector will be just one of a number of candidate sectors within which such reductions could be achieved. Relevant issues here include the cost-effectiveness and quantified costs and benefits of such reductions.
7.5.5 The technical feasibility of achieving further SO2 and NOx emissions reductions in the EU LCP sector beyond business as usual reductions
From the analysis in Section 4, it is expected to be technically feasible to achieve further SO2 and NOx emission reductions in the EU LCP sector in comparison to the techniques that are expected to be implemented to comply with the LCPD. Further key business as usual commitments include the IPPC Directive, although at the time of writing it is not clear what exactly BAT is expected to mean for individual plants, partly as the BREF is still at a draft stage and partly because BAT considerations are site specific.
Examples of techniques that could be applied to some LCPs in the EU25 to achieve further SO2 and NOx emission reductions are shown in Table 7.7:

Final Report 182
h:\projects\em-260\10000 projects\10819 ec lcpd\final report\final report 05225.doc July 2005 10819
Table 7.7 Examples of additional measures to achieve further reductions in SO2 and NOx emissions from the LCP sector
Pollutant Fuel / process Additional abatement measure
SO2 Coal / lignite boilers Low S coal (reduce from BAU levels to, say, 0.8%, assuming a switch to a widely available internationally traded coal), with FGD
SO2 Coal / lignite boilers Very low S coal (reduce from BAU levels to, say 0.4%, assuming a switch to a less widely available internationally traded coal), with FGD
SO2 Coal / lignite boilers
Improvement in FGD abatement efficiency
SO2 Coal boilers Fitting of dry sorbent injection FGD for industrial boiler plant, that may be able to comply with the LCPD using low sulphur coal
SO2 Petroleum refining Use of LPG (or natural gas) in lieu of fuel oil
SO2 Petroleum refining Hydrotreatment of liquid refinery fuels
NOx Coal / lignite boilers (<500MWth) Boosted overfire air (OFA) (in addition to LNB)
NOx Coal / lignite boilers (<500MWth) Reburn (in addition to LNB)
NOx Coal boilers SCR (in addition to OFA & LNB) (Before 2016 for >500MWth plants)
NOx Gas fired CCGT (land based) SCR (in addition to DLN)
NOx New gas turbines (offshore) DLN
Therefore there is expected to be a variety of additional measures suitable for achieving further emissions reductions in SO2 and NOx. The marginal costs of these are expected to vary from site to site (due to unique site circumstances) and between the techniques themselves.
7.5.6 Preliminary considerations of key design issues for trading schemes The previous discussion on the relative merits of policy instruments, together with the description of experience with actual instruments in various countries, enables some of the key instrument design issues to be highlighted below. The discussion deals with the issues in outline only.
Lessons from the US trading schemes
Lessons from the US experience that should be considered in any LCP trading scheme include the following.
• While 100% auctions of allowances might be preferred in an ‘ideal’ system, the dominance of grandfathering is likely to remain if industry is to accept a trading scheme.
• The temptation for regulators to ‘over-design’ schemes—ie, to formulate rules and regulations covering all aspects of the trading mechanism—should be resisted. The US has succeeded in its trading schemes by setting only the basic framework and allowing emitters to design the details. This fits the notion of ‘asymmetric information’, whereby emitters can generally be assumed to possess more information than do regulators.
• While not something that will automatically be repeated, the US schemes found that realised permit prices were way below anticipated prices. This again reflected

Final Report 183
h:\projects\em-260\10000 projects\10819 ec lcpd\final report\final report 05225.doc July 2005 10819
asymmetric information, in that emitters adopted a wider range of options for reducing emissions than the technologies (FGD plant) assumed in projections of permit prices. Such a finding again suggests that over-design is to be resisted, and perhaps also encourages firms that trading schemes may not be as expensive as might be thought.
• An auction system, at least for new entrants, should be included rather than adopting different rules for them, such as relative targets, although the latter have been used. Auctions help to make the scheme transparent in terms of allowance prices, sending signals to existing firms as to the costs of abatement. Otherwise, the firms’ perception of the costs of trades may produce the wrong decisions on investment in abatement technology. Trades need to be as public as possible, subject to concerns about commercial confidentiality.
• Where possible, provisions should be included for banking of allowances as in the US SO2 trading scheme (banking is not permitted under RECLAIM). In the US Acid Rain Program, around 30 % of allowances in the 1995–99 period were banked, despite there being over-compliance with the cap for that period. This reflects the increased stringency of the cap is the later period (2000 plus). However, allowing for banking may be difficult in the LCPD context (see below). Banking substantially reduces the risk of over-compliance which otherwise generates emission gains that cannot be translated into economic value. The combination of banking and severe non-compliance penalties is perhaps the single most important factor explaining over-compliance in the US system. Banking is also important for smoothing permit price volatility: while permit prices have been lower than expected, they have nonetheless been volatile, and volatility may well have been even higher without banking. Volatility matters in terms of giving assurance to emitters with regard to their investment decisions—otherwise, investments that are profitable but irreversible at one point in time may appear unprofitable at another point in time. Overlapping compliance periods, as in RECLAIM and the Dutch NOX scheme, also help reduce volatility. Trading schemes that do not have banking provisions have often experienced ‘spikes’ in prices as traders rush to comply with the annual limits.
• Ensuring that non-compliance attracts major penalties. In the US schemes this involves a large financial penalty plus surrender of some allowances. Those adopted in the US Acid Rain Programme averaged around ten times the price of allowances resulting in 100% compliance (EPA, 2001).
• The RECLAIM programme suggests that some form of zoning for trades can work.
• The US SO2 trading system has successfully combined trading with ambient standards, whilst the OTC NOx budget program required technology based standards (reasonably available control technology, RACT) as its first level of control, underlining the feasibility of hybrid MBI–CAC schemes. This is directly relevant to the LCPD case.
The LCP sector’s suitability for trading: setting a cap
There appears to be no problem in setting a trading cap for potential LCP trading. This is demonstrated in the national emission reduction plan option that Member States could have
Final Report 184
h:\projects\em-260\10000 projects\10819 ec lcpd\final report\final report 05225.doc July 2005 10819
chosen for existing LCPs. In these plans, total emissions should not exceed the multiple of emission limit values (ELVs) and activity data. In other words, the cap would be whatever level of emissions would have resulted had ELVs been applied to all eligible emitting plant. Hence, a trading cap set equal to this level would be consistent with the LCPD. A ‘sliding cap’ could also be adopted (ie, the cap can be made stricter over time).
Auctions versus grandfathering
The allocation of allowances has direct distributional impact between the participants of a trading scheme. It can also affect conduct in the market if it distorts competition because of differential treatment of incumbents and new entrants, and it can change abatement behaviour if future allocations are tied to current or future emissions or future plant operation (ie, whether the plant is open or closed).
The least distortionary method of allocation is an auction. In it, all participants are treated equally. The next least distortionary method is by allocation on an historical basis and in perpetuity, where the recipient cannot influence the number of allowances he or she will receive. While competition law should give new entrants protection from predatory behaviour, in practice, governments are often concerned not to disadvantage new entrants, so make allowances available to them for free. Governments do generally use an historical basis for allocations, although they are quite reluctant to grant emissions rights in perpetuity. The US SO2 trading scheme is unusual in that the administration granted rights in perpetuity and offers no free allocation to new entrants.
To a lesser extent, variation in allocation rules applied by different Member States under the same trading scheme could also create opportunity for market distortion. A very generous allocation strengthens the balance sheet of a firm, whereas a miserly allocation would not. If firms use the strength of their balance sheet to fund the acquisition of market share, the consequences could be a reduction in competition. If they use it to fund investment or to return earnings to shareholders, the consequences could be beneficial or merely neutral.
In practice, 100% auctions are very unlikely due to industry resistance to the transfer of ‘rents’ from them to government. A mix of allocation methods, with grandfathering being dominant, is more likely to result. Within that mix, it will be important to ensure that competitiveness between EU Member States is not impaired by allowing too wide a variation in national schemes of allocation.
The unit of account in a trading scheme: absolute and relative targets
The most straightforward trading scheme involves allowances that relate directly to the absolute quantity of emissions (eg, tonnes of NOX and tonnes of SOX). In turn, tonnes are ‘timeless’—once a tonne allowance is used, it is retired from the system. Firms emitting fewer emissions than their allowances are entitled to sell the surplus. Industry may, however, have a strong preference for relative targets (ie, targets expressed in terms of tonnes of pollutant per unit of output). In this case, firms that reduce their relative emissions below the target can sell a volume of permits equal to their total output, multiplied by the difference between their target emissions ratio and the ratio they actually achieve. Total emissions will be constant only if the rate of growth of output is offset by the rate of change in the (reduced) emissions ratio. Otherwise allowances, and hence total emissions, will grow as output expands and an absolute environmental quality standard would be threatened. On the other hand, relative targets offer less of a constraint to output expansion, and, hence may be more likely to favour the competitiveness prospects of the affected industry.
Final Report 185
h:\projects\em-260\10000 projects\10819 ec lcpd\final report\final report 05225.doc July 2005 10819
There are advantages and disadvantages of relative target schemes. First, they do encourage emissions efficiency (ie, continuous reductions in the emissions-to-output ratio). Second, such schemes are more attractive to industry and hence face less opposition. Third, as noted, unless emissions efficiency increases faster than output, emissions will rise and government may find it has to ratchet up the relative target to maintain a constant or achieve a declining emissions level. This may engender opposition to the scheme that, combined with opposition to absolute target schemes, may make the introduction of trading of any kind difficult. Fourth, models simulating absolute and relative schemes show that, while firm-level emissions may be similar, industry-wide emissions are higher under the relative scheme.
These gains and losses have to be considered on a case-by-case basis. If, for example, the relative targets scheme is thought to be politically feasible, while the absolute scheme is not, a comparison will be needed between the relative scheme and use of some CAC instrument, or a tax. As in the Dutch NOX scheme, some effort can be made to estimate emissions efficiency gains, and this may be compared with projections of output growth to see if total emissions will rise or fall. Emissions improvement potential will in turn reflect current technology—some countries have higher rates of industrial emissions performance than others. Those with the lowest levels of performance can be judged to have high improvement potential and hence a relative scheme is more likely to achieve the environmental target. Countries (or sectors) with high comparative performance are more likely to fail an environmental target if a relative scheme is introduced. One option is to adopt relative schemes for sectors exposed to international trade—ie, sectors where competition is more an issue—but to insist on absolute targets for non-trade sectors. The complication that arises is that the extent of trade between the relative and absolute sectors has to be determined. It is usual for some kind of condition or ‘gateway’ to be placed on such trades.
Experience with some relative-target schemes (eg, the UK Climate Change Agreements) suggests that emissions efficiency gains can be substantial and above output growth rates. However, there is a debate over whether these are ‘genuine’ gains in efficiency compared with a business-as-usual path. In other words, the baseline path may already embody many of those efficiency gains that are not therefore attributable to the trading scheme.
Time-limiting of allowances
A balance exists between short and long term allowances for the validity of permits. The shorter the time they are valid, the less likely it is that participants will engage in the market for them. The longer the validity of permits, the less flexibility the regulator has in changing the overall emissions level as time progresses. It seems likely that emission caps will be tightened over time as the demand for environmental quality grows, so this flexibility is potentially important. Similarly, rate-based systems (those with relative targets) are likely to require more regulatory adjustment than absolute systems.
Banking
The US experience (above) suggests that banking is very important. But the example of the LCPD national plan requires that emissions be limited in each year rather than over some average of years. Hence, there is an obstacle to banking30 in a LCP trading scheme. An option 30 And for borrowing—ie, using a future allowance to cover an emission now. Borrowing is usually not included in ideal schemes because of the risk of non-compliance by the borrowing agent, who may subsequently cease operations when it comes to the compliance period, without redress by the regulator.
Final Report 186
h:\projects\em-260\10000 projects\10819 ec lcpd\final report\final report 05225.doc July 2005 10819
for circumventing this problem would be making the trading cap smaller than the overall emissions limit under the LCPD and permitting banking within the trading cap, provided the overall limit is met. But this option may generate some inefficiencies since it will limit the market for permits and hence reduce the cost-saving potential.
Liquidity concerns
Liquidity relates to the frequency of trading and the scale of individual trades. The more liquid the market, the more likely it is that demand and supply for permits will be easily matched in the market. In turn, the resulting price signals will then more accurately represent the true abatement costs, so that the market conveys correct information to participants. ‘Thin’ markets, where the number of transactions is small, may convey inaccurate information in this respect, leading to non-optimal decisions on the part of participants and hence economic inefficiency. Overall, then, liquidity is a requirement for cost minimisation.
Mechanisms to encourage liquidity include the following.
• Although used in only a few cases, participants may be paid to take part in a voluntary scheme (as in the UK ETS for carbon), but the public cost of doing this is best considered to be an argument against voluntariness of trading.
• Liquidity is also encouraged by making the tradable commodity a small quantity of emissions (eg, 1 tonne of SO2 and/or NOX), and by shortening the period in which ‘reconciliation’ of accounts occurs (ie, the period over which emissions and allowances must be made ‘equalised’, in which allowances must be equal to or exceed emissions).
• Provision of information to potential participants on the advantages of trading to them and general persuasion.
Revenue hypothecation
A trading system allows one firm to pay another to abate on its behalf. In this way, abatement is funded partly by the abating firm and partly by the non-abating firm. If the allowances were distributed to participants through grandfathering, it is easy to see how this compensation takes place. If, instead, the allowances are auctioned then revenue is raised centrally (by government). The allowance price achieved in the auction is the same as the allowance price in the trading market under grandfathered allowances. However, there may be much less redistribution of allowances via trading after the auction. This is because firms are likely to buy only the allowances they need in an auction, and would only need to trade to the extent that they misjudged the quantity they would need, or to the extent that they had bought allowances in the auction speculatively.
While one firm may have paid another to abate under grandfathered allowances, under an auction the same transfer is not so explicit; rather, one firm buys fewer allowances than another. That firm spends less in the auction than the other, so that, relative to each other, the firms are just as well off as under grandfathering, but in absolute terms they are both less well off. If the revenue from the auction is hypothecated back to the sector, there is an opportunity to correct this income effect to create the same situation as would have been reached through grandfathering. This can be achieved by hypothecating the revenue on the same basis as the allocation under grandfathering. Also, there is an opportunity to create a different effect: hypothecation in the form of abatement incentives (such as grants) would create additional

Final Report 187
h:\projects\em-260\10000 projects\10819 ec lcpd\final report\final report 05225.doc July 2005 10819
incentive effects for abatement. Insofar as the offer of additional abatement incentives enhances the overall incentives to abate from the scheme, it is likely to cause a fall in the allowance price such that the combined hypothecated incentive and allowance price is just sufficient to induce the target level of abatement. The result of a lower allowance price is a reduced distributional impact on all firms. Hence, an element of revenue-neutral auction as part of a trading scheme is potentially attractive. The problem is that this is likely to be more administratively complex to operate since it will involve the dispensing of grants to individual firms when they undertake abatement, and these might have to be assessed on a case-by-case basis.
Since the reality is that a full auction of permits is unlikely to be accepted by emitters, the minimum role played by auctions is one of ensuring that new entrants are not deterred. Where revenues are raised, they may be hypothecated in various ways: (a) they might be returned to the industry in proportion to environmental performance, further stimulating emission reduction, as discussed above; (b) they might contribute to a central fund for R&D in environmental technology and information; (c) they might be used to reduce other taxes in an effort to secure ‘double dividend’ gains (see above). Approach (c) is feasible only if revenue generation is significant.
Monitoring and enforcement
Monitoring of emissions must be accurate and based on measures of actual or predicted emissions, the latter being based on fuel input data. Allowance data must similarly be stored centrally in a Registry, with each allowance being clearly identifiable and traceable. Since there is considerable practical experience with accounting mechanisms under the various existent trading schemes, the details are not of significance here. There are major advantages to ensuring that the accounting system is electronic to facilitate wide access and rapid recording of transactions.
As noted above, the US trading systems embody high costs for non-compliance. The penalties can be determined by comparing the costs to emitters of non-compliance (the penalty) and the benefits to them of non-compliance. In the US SO2 system, this ratio of non-compliance to compliance costs is probably a factor of ten. There are likely to be issues regarding the legality of any fine system, but what is essential that such a system exists in each Member State, and that each Member State is encouraged to adopt a similar penalty multiplier in order to avoid competitive distortions.
7.5.7 Preliminary considerations of key design issues for tax schemes Many of the design issues considered under trading also apply to taxation. This section therefore highlights only some of the additional issues that need to be considered.
Revenue hypothecation
The issue of revenue hypothecation will figure more prominently for tax solutions, given that trading schemes are likely to be dominated by grandfathering of permits, which raises no revenue.
Taxation and thin markets
Where emitters embraced by a trading scheme are relatively few in number, a trading scheme may risk being inefficient (see above). Thin markets are not serious for tax options, however, since there is no requirement for emitters to engage in a market. Hence a crucial issue is the
Final Report 188
h:\projects\em-260\10000 projects\10819 ec lcpd\final report\final report 05225.doc July 2005 10819
judgement about the liquidity of a trading market. If it is judged to be risky, a tax system may be preferred.
Taxation and competition
One advantage of trading is that a precedent exists for an EU-wide trading scheme, namely the EU Emission Trading Scheme for CO2 introduced in 2005. This allows for some variation in approaches within the National Allocation Plans by separate Member States. However, EU-wide common environmental taxation is more problematic and is currently limited to the Directive on Energy Products Taxation adopted in 2003. A similar approach might be adopted for sulphur/nitrogen taxation—ie, the setting of a framework for the harmonisation of an emissions tax system across Member States. The issue arises as to whether emission taxes under LCPD are simply measures that Member States might adopt as part of national policies, or whether wider harmonisation of tax rates would be required under the subsidiarity principle.
Taxes and transaction costs
The transaction costs of trading schemes could be high, and this may confer a relative advantage to tax schemes.
Taxes and technological innovation
Some of the literature finds that incentives for innovation are greater under an emissions tax than under free (eg, grandfathered) emissions permits, and higher still under auctioned emissions permits. These results are driven by two primary effects.
First, as innovation reduces marginal abatement costs, this induces more emissions abatement under a tax. In contrast, under permit trading, the industry-level amount of emissions will remain constant (by design of the aggregate cap on emissions). Since firms reduce emissions by a larger amount under the tax, they will pay for innovations that reduce abatement costs. Second, innovation will reduce the equilibrium permit price. If firms have to purchase permits, for example in an auction, they benefit from lower permit prices. Falling permit prices will lessen the incentive to reduce emissions. This effect does not operate under a (fixed) emissions tax or with auctioned permits. This second effect may be sufficient to raise the overall incentives for innovation under auctioned permits above those under the emissions tax. If fully auctioned permits are not feasible, the tax remains superior to a grandfathered permit system.
7.5.8 Cost-effectiveness of MBIs for the EU LCP sector compared with tightening CAC legislation
Apart from all the issues of feasible design considered above, the choice between tightening the CAC system currently in place for the LCP sector and introducing an MBI system will depend critically on the degree of variation in marginal abatement costs in the sector. Unless abatement costs vary significantly plant by plant, the efficiency benefits that may be obtained by trading or taxation relative to CAC measures will not be realised. National trading schemes can be expected to contain less cost variation than an EU-wide scheme, especially in light of the enlarged EU.
There is, however, a further consideration with respect to emissions trading that may limit its effectiveness relative to further CAC measures. The environmental efficiency of trading schemes will depend on the extent to which trading in emissions is constrained by limits on local depositions. As noted earlier, the LCPD operates with emissions limits and is not ambient-
Final Report 189
h:\projects\em-260\10000 projects\10819 ec lcpd\final report\final report 05225.doc July 2005 10819
based. Technically, an ambient-based trading scheme is required in order to allow for the non-uniformly mixed nature of SO2 and NOx emissions (environmental damage is sensitive to the location of emissions). But ambient-based schemes have not been introduced in practice, nor have side constraints on depositions been introduced other than by some zonally limiting trading under RECLAIM. By and large this is because of the problems of having to run an air quality model for each trade, making transactions costs very high. If approximations to ambient-based trading schemes cannot be made for these reasons, the issue becomes one of comparing stricter CAC with single-zone emissions trading. The practical experience, noted earlier, is that cost savings from single zone emissions trading are significant. What is less obvious is the relative environmental efficiency of CAC and emissions trading for SO2 and NOx. If there is no wide disparity in environmental effectiveness then the cost-savings argument is fairly decisive, institutional problems of design to one side. But the environmental effects are less certain in this respect.
One option entertained in the literature and which tries to combine the cost-efficiency of emissions trading with the environmental requirement of avoiding undesirable deposition effects is to adopt emissions trading with ‘exchange rates’.31 The notion of an exchange rate is simple. For any buyer of a unit, say 1 tonne, of SO2 (say), the seller must reduce their emissions by 1 tonne multiplied by the exchange rate. Thus, the seller may have to reduce emissions by less, more or the same as 1 tonne. The exchange rates are determined by the regulator and, of course, have to be acceptable to all parties. In turn, the regulator sets the exchange rates according to a model of emissions and deposition, the exchange rates taking account of the location-specific environmental effects of increased emissions in any one location (the allowance buying party) and the reduced emissions in the other location (the selling party). Such models exist for the wider Europe (eg, RAINS and EMEP). However, available simulations (Klaassen 1996) suggest that, whereas cost savings under single zone emissions trading are potentially large, cost savings under emissions trading with deposition-related exchange rates are comparatively modest.
7.5.9 Summary While there are numerous options for the introduction of MBIs to control SO2 and NOx emissions in the EU, the most likely options are (a) a tax, (b) an emissions permit trading scheme and (c) some hybrid permit trading scheme with upper, or upper and lower, limits to permit prices set by a tax and subsidy.
Relative to CAC measures, MBIs offer the potential for compliance cost savings, both in a static (current) sense and dynamically through time due to the stimulus to technological innovation. Auctioned permits and taxes also generate government revenues which can be hypothecated to various uses, but notably to reducing other distortionary taxes and to encouraging further environmental improvement. The scale of the ‘double dividend’ associated with the former option is currently debated. Overall, while MBIs will not always secure efficiency gains over CAC, the general rule is that they will.
While, in principle, optimally designed taxes and tradable permit schemes secure the same cost-efficient outcomes, various practical issues affect the choice between them:
31 See Klaassen (1996).
Final Report 190
h:\projects\em-260\10000 projects\10819 ec lcpd\final report\final report 05225.doc July 2005 10819
(a) where tradable permits are given freely, there is no government revenue effect; and (b) in the context of uncertainty about abatement costs, the choice between them depends on the relative steepness of the damage and abatement cost curves.
As far as tradable permit schemes are concerned, it will be essential to ensure that:
• variations in abatement costs by emitters are sufficient to secure the cost reductions from trading;
• there are sufficient participants in the market to signal the right information about cost savings. On the broader scale, ensuring that there is adequate liquidity in the market;
• an emissions trading scheme does not generate ‘hot spots’ of unacceptable environmental quality. In practice, the potential for such ‘hot spots’ should be minimised by the effect of the Air Quality Daughter Directives, as well as the requirement to comply with BAT under the IPPCD. However, it may be necessary for any scheme to operate with side constraints on deposition effects or ‘exchange rates’;
• permits do not become concentrated in the hands of a few polluters;
• there is a provision for banking permits (reserving them for future use) in order to reduce risks associated with over-compliance;
• the schemes are not ‘over-designed’ by central authorities, leaving industry to promote trading rules within the overall environmental constraint;
• new entrants are not seriously disadvantaged, either by allocating free permits or enabling part of the cap to be auctioned;
• an effective monitoring and compliance system is in place—especially an effective penalty system for non-compliance or misreporting.
As far as a tax solution is concerned, the following issues also need to be addressed:
• devising an effective system for the use of revenues, including analysis of the relative merits of reducing other taxes and recycling of revenues to industry in proportion to environmental achievement;
• as with a trading scheme, ensuring that sectoral competitiveness is preserved.
A hybrid trading/tax scheme can be more efficient than a tax or tradable permit scheme alone if it is carefully designed to have a tax rate setting an upper limit to the permit price and a subsidy setting a lower limit.
Additional comments in the LCPD context include:
• while an emissions cap is consistent with the LCPD, as illustrated by the national emission reduction plan option for existing plants, the LCPD caps under these plans are annual and hence would not permit banking. This suggests setting a cap for any trading scheme lower than the total emissions cap - a ‘cap within a cap’;
Final Report 191
h:\projects\em-260\10000 projects\10819 ec lcpd\final report\final report 05225.doc July 2005 10819
• while it is well known that pure emissions trading secures potentially significant cost reductions, they have the potential to give rise to unacceptable locational pollution. In the context of LCPs, however, the likelihood for this should be minimised by the requirement to comply with pre-existing policies including the Air Quality Daughter Directives; BAT under the IPPC Directive; and the requirements of the current LCPD. Additional options to address this potential issue, however, appear limited. For example movement towards a theoretically desirable ambient-based trading scheme is limited because of high transaction costs; and one option is to adopt an ‘exchange rate’ approach, although some of the evidence suggests that this will severely limit cost savings;
• at the practical level, setting common tax rates may be more politically difficult than devising a trading scheme.
7.6 References Burtraw, D. (1995), Cost Savings Sans Allowance Trades? Evaluating the SO2 Emissions Trading Program to Date, Resources for the Future, Discussion Paper No.95-30
Dekker, C. (Dutch Ministry of the Environment) (12th November 2004), “Emissions trading to Control NOx in the Netherlands”, paper presented at Joint CAFE/NEBEI conference, Brussels
Ellerman, A.D. (Massachusetts Institute of Technology) (12th November 2004), “Policy Mix or Evolution?”, paper presented at Joint CAFE/NEBEI conference, Brussels
Ellerman, A.D., P.L. Joskow, J-P Montero, R. Schmalensee, and E.M. Bailey (2000), Markets for Clean Air: The U.S. Acid Rain Program, Cambridge University Press
ENDS Daily (10th November 2004), “Netherlands Moves Towards NOx Emissions Trading”, Issue 1765
EPA (2004), “Allowance Prices (1995-2002)”, http://www.epa.gov/airmarkets/trading/so2market/alprices.html
EPA (United States Environmental Protection Agency) (2003a), Tools of the Trade: A Guide to Designing and Operating a Cap and Trade Program for Pollution Control, EPA430-B-03-002
EPA (2003b), Acid Rain Program 2002 Progress Report, November 2003, http://www.epa.gov/airmarkets/cmprpt/arp02/2002report.pdf
EPA (2002), An Evaluation of the South Coast Air Quality Management District’s Regional Clean Air Incentives Market- Lessons in Environmental Markets and Innovation, November 2002
EPA (2001), The united States Experience with Economic Incentives for Protecting the Environment, January 2001.
Joskow, P., R. Schmalensee and E. Bailey (1998), “The Market for Sulfur Dioxide Emissions”, American Economic Review, Vol.88, No.4, pp.669-685
Klaassen G. (1996), .Acid Rain and Environmental Degradation: The Economics of Emission Trading, Cheltenham, Edward Elgar.
Final Report 192
h:\projects\em-260\10000 projects\10819 ec lcpd\final report\final report 05225.doc July 2005 10819
Labandeira, X. (University of Vigo) (12th November 2004), “Regional Air Pollution Taxes in Spain”, paper presented at Joint CAFE/NEBEI conference, Brussels
Lindgren, M. (Swedish Environmental Portection Agency) (13th November 2004), Experience and Development of the NOx Charge in Sweden”, paper presented at Joint CAFE/NEBEI conference, Brussels
Maryland Power Plant Research Program (PPRP) (1999), Maryland Utility NOx RACT Update Report, January 1999
Milieu Ltd., the Danish National Environmental Research Institute, and the Center for Clean Air Policy (2004), Case Study 1: Comparison of the EU and US Approaches towards Acidification, Eutrophication and Ground Level Ozone, October 2004
Milliman, S.R. and Prince, R. (1989), “Firm Incentives to Promote Technological Change in Pollution Control”, Journal of Environmental Economics and Management, Vol.17, pp.247-265
Millock, K., C. Nauges and T. Sterner (2004), “Environmental Taxes: A Comparison of French and Swedish Experience from Taxes on Industrial Air Pollution”, CESifo DICE Report, 1/2004, Spring 2004
National Center for Environmental Economics (2001), The United States Experience with Economic Incentives for Protecting the Environment, EPA-240-R-01-001, January 2001
Northeast States for Co-ordinated Air Use Management (NESCAUM) (2003), Power Companies’ Efforts to Comply with the NOx SIP Call and Section 126, Firm Standards + Innovation = Success, Progress Report
OXERA (2003), ‘Analysis of the Interactions and Combinations of Tax and Permit-trading Instruments, with an Application to Climate and Waste Policy’, published by the Environment Agency of England and Wales.
Ozone Transport Commission (2003), NOx Budget Program, 1999-2002 Progress Report
Swedish Environmental Protection Agency (2000), The Swedish charge on nitrogen oxides - cost-effective emission reduction.

Final Report
h:\projects\em-260\10000 projects\10819 ec lcpd\final report\final report 05225.doc July 2005 10819