preparation, characterization and thermo-chromic ... · the prepared vo2 powder was mixed with ......
TRANSCRIPT

materials
Article
Preparation, Characterization and Thermo-ChromicProperties of EVA/VO2 Laminate Films for SmartWindow Applications and Energy Efficiencyin Building
Onruthai Srirodpai 1, Jatuphorn Wootthikanokkhan 1,2,*, Saiwan Nawalertpanya 2,3,Kitti Yuwawech 1 and Vissanu Meeyoo 2,4
1 School of Energy, Environment and Materials, King Mongkut’s University of Technology Thonburi (KMUTT),Bangkok 10140, Thailand; [email protected] (O.S.); [email protected] (K.Y.)
2 Nanotec–KMUTT Center of Excellence on Hybrid Nanomaterials for Alternative Energy,King Mongkut’s University of Technology (KMUTT), Thonburi, Bangkok 10140, Thailand;[email protected] (S.N.); [email protected] (V.M.)
3 Department of Chemical Engineering, Faculty of Engineering, King Mongkut’s University of TechnologyThonburi (KMUTT), Bangkok 10140, Thailand
4 Department of Chemical Engineering, Mahanakorn University of Technology, Bangkok 10530, Thailand* Correspondence: [email protected]; Tel.: +66-2-4708-6559 (ext. 316)
Academic Editor: Massimo LazzariReceived: 1 December 2016; Accepted: 3 January 2017; Published: 11 January 2017
Abstract: Thermochromic films based on vanadium dioxide (VO2)/ethylene vinyl acetate copolymer(EVA) composite were developed. The monoclinic VO2 particles was firstly prepared viahydrothermal and calcination processes. The effects of hydrothermal time and tungsten doping agenton crystal structure and morphology of the calcined metal oxides were reported. After that, 1 wt % ofthe prepared VO2 powder was mixed with EVA compound, using two different mixing processes.It was found that mechanical properties of the EVA/VO2 films prepared by the melt process weresuperior to those of which prepared by the solution process. On the other hand, percentage visiblelight transmittance of the solution casted EVA/VO2 film was greater than that of the melt processedcomposite film. This was related to the different gel content of EVA rubber and state of dispersionand distribution of VO2 within the polymer matrix phase. Thermochromic behaviors and heatreflectance of the EVA/VO2 film were also verified. In overall, this study demonstrated that it waspossible to develop a thermochromic film using the polymer composite approach. In this regard,the mixing condition was found to be one of the most important factors affecting morphology andthermo-mechanical properties of the films.
Keywords: thermochromic; VO2; smart windows; EVA; composite
1. Introduction
It has been reported that energy use for heating and air conditioning (HVAC) accounted for48%, 55% and 52% of buildings’ energy consumption in the USA, UK and Spain [1], respectively.To reduce the energy consumption in buildings, there has been a considerable interest in a developmentof so called “energy efficient windows” or “smart windows”. This effect can be achieved byseveral approaches including by coating chromic material onto glass substrate. In general, differenttypes of chromic materials are available, depending on the types of external stimulus such aslight (photo-chromic), heat (thermo-chromic), and electricity (electro-chromic). In this regard,thermo-chromic smart windows have received particular interest due to the fact that they can
Materials 2017, 10, 53; doi:10.3390/ma10010053 www.mdpi.com/journal/materials
Materials 2017, 10, 53 2 of 20
be responded to the environmental temperature and yet the visible light transparency of thethermo-chromic smart windows remains almost unchanged.
Transition metal oxides such as Ti2O3, V2O3, and VO2 are known to be capable of exhibitingthermo-chromic behavior. These materials are basically semi-conductors at low temperature andchange to a metallic state at a temperature above its critical transition temperature. Among thesemetal oxides, VO2 has received interest and is being considered as a promising candidate for thistechnology. Upon heating to above its critical transition temperature (Tc, 68 ◦C), the material exhibitsa structural change from a monoclinic to a tetragonal phase. This brings about some changes in opticaland electrical properties of the material. Specifically, above Tc, the material is capable of reflecting thenear infrared (NIR) light. Besides this, the transition temperature of the material can be further reducedusing doping agents such as tungsten [2]. In this regard, the higher the molar percentage of dopants,the lower the transition temperature [3]. In addition, Wang et al. [4] reported that co-doping of VO2
with tungsten (W) and magnesium (Mg) could provide a synergistic effect in which both transitiontemperature and luminous transmittance of the VO2 film can be improved.
It is of noteworthy that, as single crystal, VO2 lattice cannot resist to the stress received duringphase transformation and will crack after undergoing only some transition cycle. Prepared as thin filmcoated on selected substrate, VO2 film can stand more transition cycle and would be more effective forsmart window application.
Progress in the developments of VO2 for smart thermo-chromic coatings has been recentlyreviewed by Wang et al. [5]. Various aspects related to the development of the materials have beendiscussed, including the fabrication process of VO2 films, strategies for improving thermo-chromicproperties, and the future research directions. In terms of the fabrication processes, various methodscan be used to prepare the VO2 thermo-chromic coating glass, including sol-gel [6], sputteringdeposition [7] and chemical vapor deposition [8]. The gas phase techniques are superior in termof the precise control of process parameters and film features (thickness, microstructure). However,complex equipment is usually required. On the other hand, the sol-gel method is of low cost andfeasible for metal doping. Recently, an alternative solution-based process for preparing VO2 thin film,namely the “polymer-assisted deposition (PAD) process” has been developed [9–11]. VO2 film witha greater transparency (40%–84%) has been claimed. This technique is interesting and might be used tofabricate smart glass at a laboratory scale. However, to fabricate larger-sized smart glass for industrialuse, a different manufacturing process needs to be developed.
In this study, to avoid the above limitations, a different approach was proposed for fabricatingan energy efficient window. Rather than coating thermo-chromic material onto the glass substrate,the thermo-chromic material in a powder form was directly incorporated into a polymer matrix prior tofabricating the laminated glasses. In this regard, the VO2 in a powder form has to be prepared. This canbe done by using methods such as spray pyrolysis [12] and hydrothermal [13,14]. Chemicals used asprecursor for preparing the VO2 include V2O5 [15,16], and NH4VO3 [17,18]. However, the synthesis ofmonoclinic vanadium dioxide (VO2(M)) via the hydrothermal process is not straight forward. This isdue to the facts that vanadium oxide (VOx) comprise of up to 20 stable phases and the reaction isvery sensitive to many parameters such as the calcination temperature [19] and the size and designof the reactor, which was in turn affecting the heat flow and the actual residence time. In this study,the effects of hydrothermal time and concentration of the tungsten doping agent on micro-structure ofthe synthesized VOx were studied and reported.
The VO2(M) powder has been utilized by mixing with some polymers. Shi et al. [19] forexample, investigated structure-properties of glass coating, based on an acrylic polymer composite.The polymer was firstly mixed with VO2 via a solution process, using xylene as a solvent. Resultsfrom the Vis/NIR transmittance spectra at 15 ◦C and 40 ◦C indicate that the coating exhibited a goodthermo-chromic performance. It was also found that XRD (X-ray powder diffraction) patterns andDSC (differential scanning calorimetry) thermograms of the W-doped VO2 changed with the size ofVO2 particles, which was controlled by the grinding process. Similarly, Suzuki et al. [20] prepared
Materials 2017, 10, 53 3 of 20
VO2 coated SiO2 nanoparticles. The co-metal oxides were then mixed with poly(lactic acid) (PLA)using N,N-dimethylholmamid as solvent and the composite film was fabricated via a solvent castingtechnique. From FTIR spectra of the composite, it was found that percentage transmittance of thepeaks recorded at 80 ◦C was lower than that of which recorded at a room temperature. This wasclaimed as evidence supporting the thermo-chromic behavior of the system.
As aforementioned, it is rather clear that thermo-chromic behaviors of the neat VO2(M) stillexist once after the material has been incorporated into the polymer films. These properties are alsodependent with morphology of the polymer/VO2 composites. This was, in turn, affected by themixing process and the mixing conditions. In relation to our present study, the ethylene-vinyl acetatecopolymer (EVA), commonly used as a binder film for the laminated glass industry, was selected asa matrix for mixing with the VO2 particles Normally, the commercial EVA film for either solar cellmodule or laminated glass is prepared via a polymer melted process such as an extrusion. In relationto this study, it is of unfortunate that a study on structure-properties of the EVA/VO2 film prepared bymelted mixing process has been seldom reported in any open literature. In our opinion, this is an aspectdeserving a consideration, taking into account that structure and properties of the EVA/VO2 compositeprepared via a melt mixing could have been different to those of which prepared via a solution basedprocess. Therefore, the primary aim of this work was to investigate the effect of monoclinic VO2
particles on heat reflectance, thermo-chromic behavior, optical transparency, and mechanical propertiesof the EVA based films. Comparisons on properties of the EVA/VO2 films prepared by two differentmixing and fabrication techniques, which are a melted mixing process and a solution mixing process,were also of our interest.
2. Results and Discussion
2.1. Crystal Structures of VO2
Figure 1 shows XRD patterns of the products obtained from the hydrothermal and calcinationprocesses. The characteristic XRD peaks at 2 theta of 27.11◦, 34.49◦, 39.59◦, and 56.33◦, representingthe VO2(B) phase, can be observed after the hydrothermal treatment. These correspond to the (−311),(−312), (−222), and (−531) planes of the metal oxide crystal. Besides, additional peaks at 35.58◦
and 61.13◦ also exist. These are attributed to the (602) and (306) plane of V4O9, which could bean intermediate product of the process (see Equations (1)–(3)). However, by further treating thesematerials through the calcination process, the above XRD peaks disappeared whereas those of whichrepresenting the characteristic pattern of monoclinic vanadium dioxide (VO2(M)) immerged. The latterinclude the peaks at 2θ of 27.86◦, 37.05◦, 42.23◦, 55.53◦, 57.53◦, 65.00◦ and 70.44◦, corresponding tothe crystal planes of (011), (200), (210), (220), (022), (013) and (202) of VO2(M), respectively [17,21].Furthermore, by analyzing the XRD peak of (011) plane with the Scherrer’s equation, crystal size ofthe VO2(M) can be calculated. The value obtained was 26.9 nm which is close to that was reported byJi et al. (17.8 nm) [22] and Chen et al. (25 nm) [18].
2V2O5(s) + N2H4·HCl(s) + 7HCl(l)→ 4VOCl2(aq) + N2(g) + 6H2O(g) (1)
2VOCl2(aq) ——–hydrothermal process—–> 2VO2(B)(s) + 2Cl2(aq) (2)
VO2(B)(s) —-annealing process—-> VO2(M)(s) (3)
Noteworthy, the XRD patterns significantly changes with hydrothermal time used. The XRDpeak at 2θ = 27.11◦, representing the VO2(B) intermediate was observed when the sample was treatedby the hydrothermal process for about 5–12 h. However, an intensity of the above peak tended todecrease with time and eventually disappeared after treated by the hydrothermal process for 48 h.Likewise, intensity of the XRD peak representing the VO2(M) phase increased with time, suggestingthat a sufficient time is needed for the VO2(B) phase to be completely converted into the VO2(M)phase [13,23,24]. The optimum time for achieving the completed formation of VO2(M) from this study

Materials 2017, 10, 53 4 of 20
is shorter than that was reported by Lv et al. [15] and Cao et al. [25]. In those cases, the hydrothermaltime required to achieve a complete formation of VO2(M) was about 3–7 days, which is much longerthan herein. In our opinion, the above discrepancies can be attributed to the different hydrothermalconditions used. A one step hydrothermal process was used in the literature work whereas two stepsprocess was used in this study.
Materials 2017, 10, 53 4 of 19
conditions used. A one step hydrothermal process was used in the literature work whereas two steps process was used in this study.
Figure 1. XRD patterns of the products from hydrothermal and calcination processes.
The similar XRD patterns were obtained when the VO2 was doped with 0.5 at % of tungsten (W) (see Figure 2). By further increasing the W content to 1% and 2% atom, additional peaks at 2θ of 25.47° and 27.11° which represent the meta stable tetragonal structure of VO2(A) and VO2(B) phases were also noted. The intensity values of both peaks tend to increase with the percentage atom of tungsten used. This was probably due to the differences in energy required for the formation of VO2(M), VO2(B) and VO2(A), which are −7.18 eV, −6.66 eV and −7.14 eV, respectively [26]. In this case, it was possible that the formation of VO2(A) and VO2(B) became more favorable, especially when the amount of tungsten used are sufficiently high.
From the enlarged XRD patterns (Figure 3), it was noted that the peaks, representing VO2(M) (2θ = 27°–29°) and those of which representing the tungsten doped VO2 (V1−xWxO2) (2θ = 24°–26° ) slightly shifted downward after doping. This can be related to an increase of inter-planar distance or d-spacing of the crystal. Since the radius of tungsten cation (W6+) is greater than that of the vanadium cation (V4+) [15,18,27], it was possible that the replacement of V4+ by W6+ in the crystal structure of VO2 contributed to the increase of d-spacing. In addition, by using the data from (011) plane of VO2 in combination with the Scherrer’s equation, the sizes of the VO2(M) and V1−xWxO2 crystal were calculated and summarized in Table 1. It was found that crystal size of the doped VO2 decreased as compared to that of the normal VO2(M). This could be attributed to the capability of W6+ in inhibiting growth process of the crystal. However, as the concentration of tungsten dopant was further increased above 0.5 at %, sizes of the crystals increased again. The above trend is contradicted to that was observed by Xiao et al. [27] whereby crystal size of the tungsten doped VO2 linearly decreased with the dopant concentration. In our opinion, the above discrepancy could be attributed to the facts that different type of reactors and calcination conditions were used. Consequently, the VO2(A) by-product was obtained in this study. The formation of VO2(A) could compete with the growth process of VO2. This led to the non-linear relationship between crystal size and the dopant concentration. It was worth mentioning that the above XRD pattern lacks the presence of peaks belonging to the neat tungsten oxide [18,24,28].
Figure 1. XRD patterns of the products from hydrothermal and calcination processes.
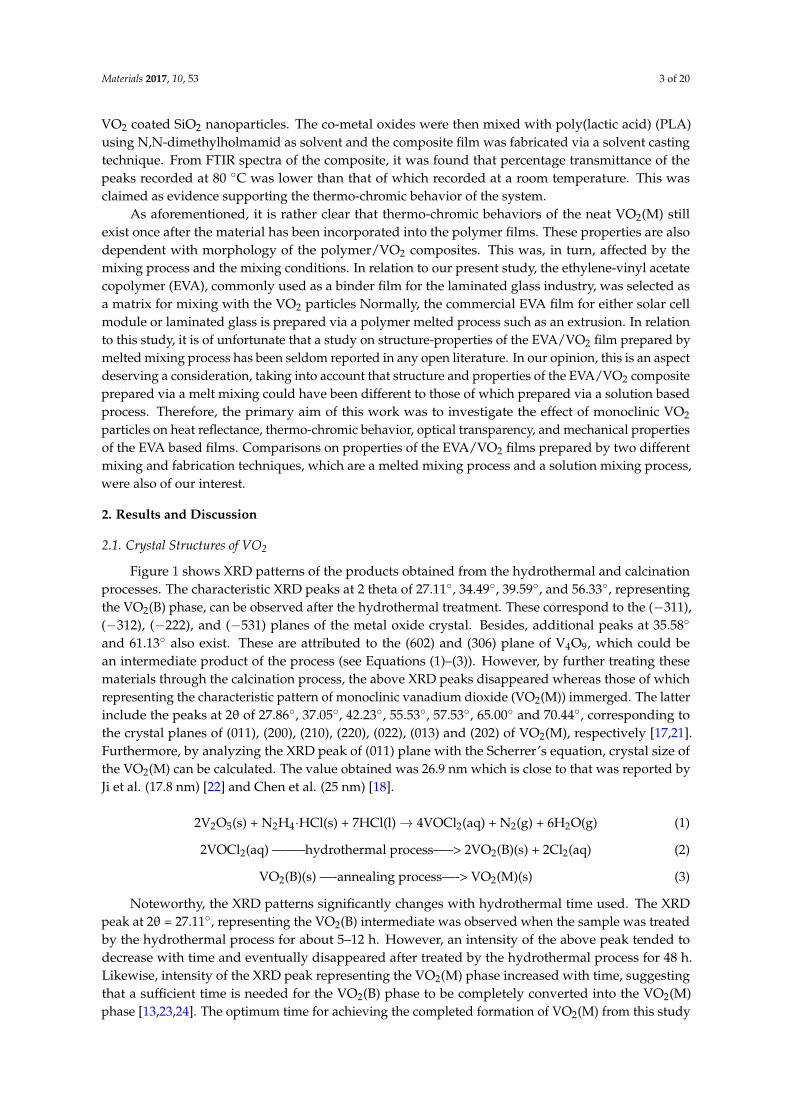
The similar XRD patterns were obtained when the VO2 was doped with 0.5 at % of tungsten (W)(see Figure 2). By further increasing the W content to 1% and 2% atom, additional peaks at 2θ of 25.47◦
and 27.11◦ which represent the meta stable tetragonal structure of VO2(A) and VO2(B) phases werealso noted. The intensity values of both peaks tend to increase with the percentage atom of tungstenused. This was probably due to the differences in energy required for the formation of VO2(M), VO2(B)and VO2(A), which are −7.18 eV, −6.66 eV and −7.14 eV, respectively [26]. In this case, it was possiblethat the formation of VO2(A) and VO2(B) became more favorable, especially when the amount oftungsten used are sufficiently high.
From the enlarged XRD patterns (Figure 3), it was noted that the peaks, representing VO2(M)(2θ = 27◦–29◦) and those of which representing the tungsten doped VO2 (V1−xWxO2) (2θ = 24◦–26◦ )slightly shifted downward after doping. This can be related to an increase of inter-planar distance ord-spacing of the crystal. Since the radius of tungsten cation (W6+) is greater than that of the vanadiumcation (V4+) [15,18,27], it was possible that the replacement of V4+ by W6+ in the crystal structure ofVO2 contributed to the increase of d-spacing. In addition, by using the data from (011) plane of VO2
in combination with the Scherrer’s equation, the sizes of the VO2(M) and V1−xWxO2 crystal werecalculated and summarized in Table 1. It was found that crystal size of the doped VO2 decreased ascompared to that of the normal VO2(M). This could be attributed to the capability of W6+ in inhibitinggrowth process of the crystal. However, as the concentration of tungsten dopant was further increasedabove 0.5 at %, sizes of the crystals increased again. The above trend is contradicted to that wasobserved by Xiao et al. [27] whereby crystal size of the tungsten doped VO2 linearly decreased withthe dopant concentration. In our opinion, the above discrepancy could be attributed to the facts thatdifferent type of reactors and calcination conditions were used. Consequently, the VO2(A) by-productwas obtained in this study. The formation of VO2(A) could compete with the growth process of VO2.This led to the non-linear relationship between crystal size and the dopant concentration. It was worth
Materials 2017, 10, 53 5 of 20
mentioning that the above XRD pattern lacks the presence of peaks belonging to the neat tungstenoxide [18,24,28].Materials 2017, 10, 53 5 of 19
Figure 2. XRD patterns of VO2(M) and the varied tunsten doped VO2 (V1−xWxO2) obtained from the calcination process.
Table 1. Inter-planar distance or d-spacing of the (011) plane and size of the VO2(M) and (V1−xWxO2) crystals which were prepared by using various concentration of tungsten dopant.
Tungsten (% Atom) d-Spacing (nm)
Crystal Size (nm) From XRD From TEM
0 0.3199 0.3550 26.9 0.5 0.3209 0.3586 22.2 1.0 0.3202 n/a 25.6 2.0 0.3209 0.2460 28.1
Figure 3. The enlarged XRD patterns (24°–29°) of VO2(M) and the doped metal oxides (V1−xWxO2) obtained by applying various concentration of the dopant (W).
Figure 2. XRD patterns of VO2(M) and the varied tunsten doped VO2 (V1−xWxO2) obtained from thecalcination process.
Materials 2017, 10, 53 5 of 19
Figure 2. XRD patterns of VO2(M) and the varied tunsten doped VO2 (V1−xWxO2) obtained from the calcination process.
Table 1. Inter-planar distance or d-spacing of the (011) plane and size of the VO2(M) and (V1−xWxO2) crystals which were prepared by using various concentration of tungsten dopant.
Tungsten (% Atom) d-Spacing (nm)
Crystal Size (nm) From XRD From TEM
0 0.3199 0.3550 26.9 0.5 0.3209 0.3586 22.2 1.0 0.3202 n/a 25.6 2.0 0.3209 0.2460 28.1
Figure 3. The enlarged XRD patterns (24°–29°) of VO2(M) and the doped metal oxides (V1−xWxO2) obtained by applying various concentration of the dopant (W). Figure 3. The enlarged XRD patterns (24◦–29◦) of VO2(M) and the doped metal oxides (V1−xWxO2)
obtained by applying various concentration of the dopant (W).
Table 1. Inter-planar distance or d-spacing of the (011) plane and size of the VO2(M) and (V1−xWxO2)crystals which were prepared by using various concentration of tungsten dopant.
Tungsten (% Atom)d-Spacing (nm)
Crystal Size (nm)From XRD From TEM
0 0.3199 0.3550 26.90.5 0.3209 0.3586 22.21.0 0.3202 n/a 25.62.0 0.3209 0.2460 28.1
Materials 2017, 10, 53 6 of 20
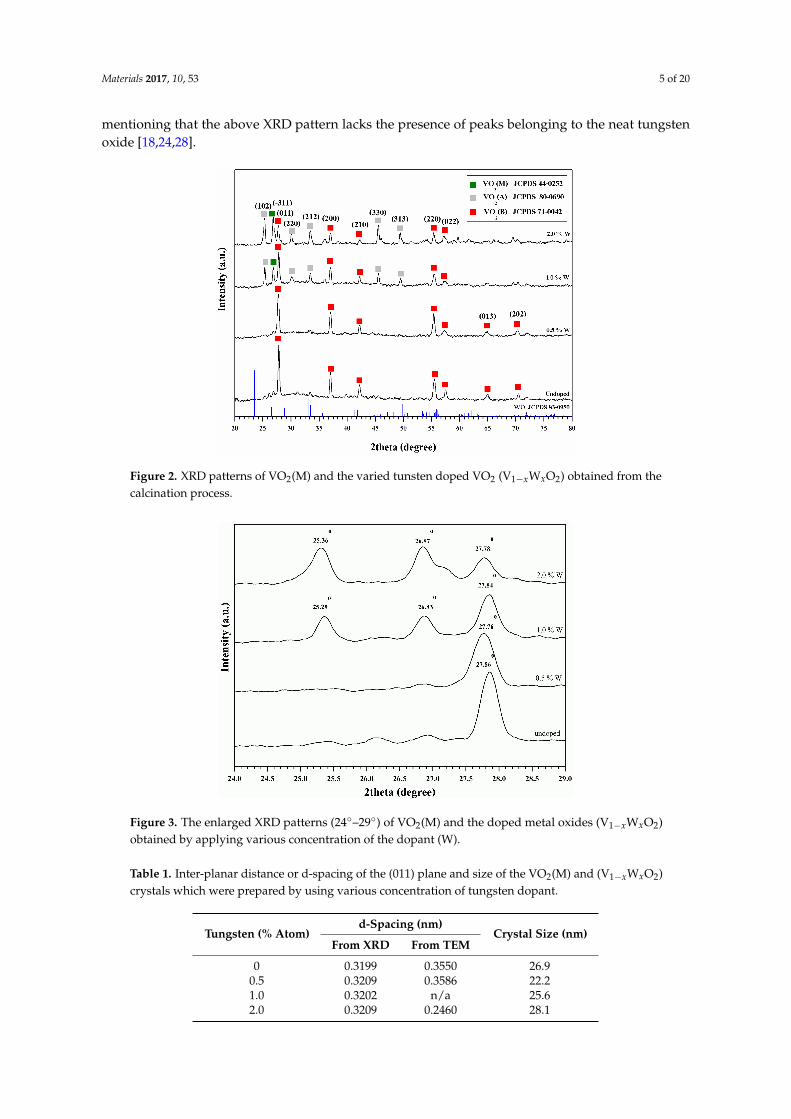
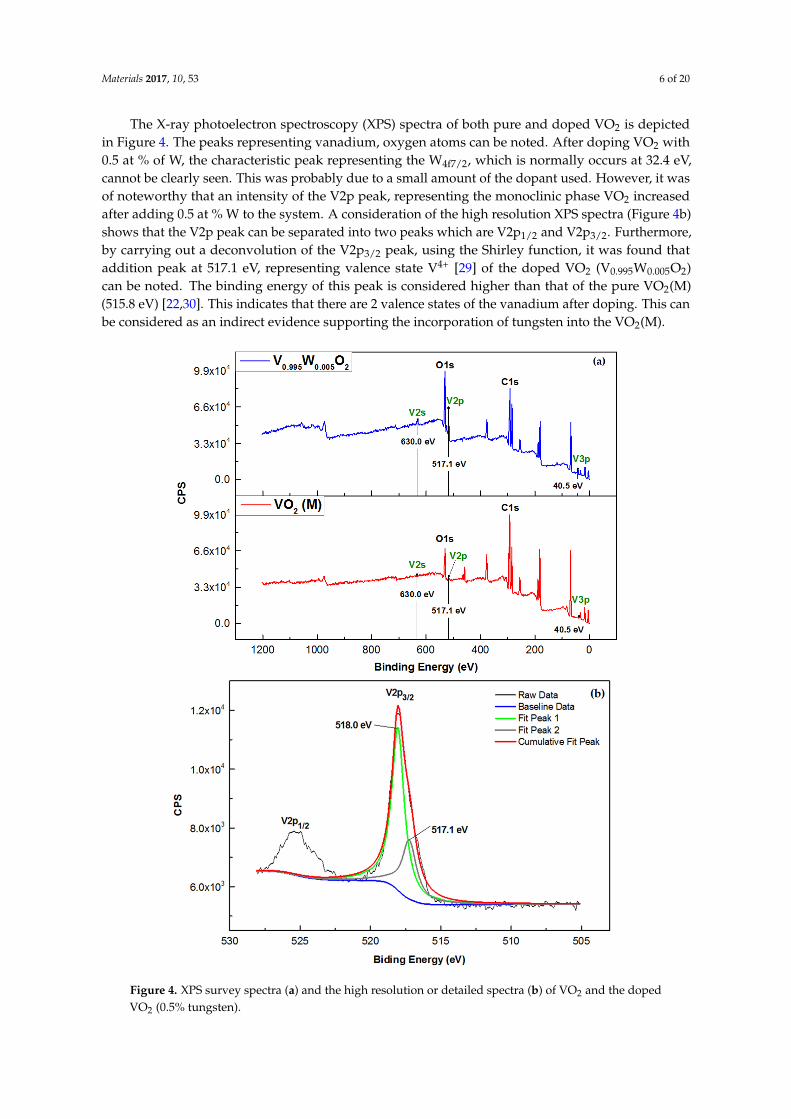
The X-ray photoelectron spectroscopy (XPS) spectra of both pure and doped VO2 is depictedin Figure 4. The peaks representing vanadium, oxygen atoms can be noted. After doping VO2 with0.5 at % of W, the characteristic peak representing the W4f7/2, which is normally occurs at 32.4 eV,cannot be clearly seen. This was probably due to a small amount of the dopant used. However, it wasof noteworthy that an intensity of the V2p peak, representing the monoclinic phase VO2 increasedafter adding 0.5 at % W to the system. A consideration of the high resolution XPS spectra (Figure 4b)shows that the V2p peak can be separated into two peaks which are V2p1/2 and V2p3/2. Furthermore,by carrying out a deconvolution of the V2p3/2 peak, using the Shirley function, it was found thataddition peak at 517.1 eV, representing valence state V4+ [29] of the doped VO2 (V0.995W0.005O2)can be noted. The binding energy of this peak is considered higher than that of the pure VO2(M)(515.8 eV) [22,30]. This indicates that there are 2 valence states of the vanadium after doping. This canbe considered as an indirect evidence supporting the incorporation of tungsten into the VO2(M).
Materials 2017, 10, 53 6 of 19
The X-ray photoelectron spectroscopy (XPS) spectra of both pure and doped VO2 is depicted in Figure 4. The peaks representing vanadium, oxygen atoms can be noted. After doping VO2 with 0.5 at % of W, the characteristic peak representing the W4f7/2, which is normally occurs at 32.4 eV, cannot be clearly seen. This was probably due to a small amount of the dopant used. However, it was of noteworthy that an intensity of the V2p peak, representing the monoclinic phase VO2 increased after adding 0.5 at % W to the system. A consideration of the high resolution XPS spectra (Figure 4b) shows that the V2p peak can be separated into two peaks which are V2p1/2 and V2p3/2. Furthermore, by carrying out a deconvolution of the V2p3/2 peak, using the Shirley function, it was found that addition peak at 517.1 eV, representing valence state V4+ [29] of the doped VO2 (V0.995W0.005O2) can be noted. The binding energy of this peak is considered higher than that of the pure VO2(M) (515.8 eV) [22,30]. This indicates that there are 2 valence states of the vanadium after doping. This can be considered as an indirect evidence supporting the incorporation of tungsten into the VO2(M).
Figure 4. XPS survey spectra (a) and the high resolution or detailed spectra (b) of VO2 and the doped VO2 (0.5% tungsten).
Figure 4. XPS survey spectra (a) and the high resolution or detailed spectra (b) of VO2 and the dopedVO2 (0.5% tungsten).

Materials 2017, 10, 53 7 of 20
2.2. Morphology
Figure 5 show the SEM images of the products obtained from hydrothermal and calcinationprocesses. The tretrahedral prism shape, corresponding to the VO2(B) phase, was obtained afterthe hydrothermal. The above morphology changed to granular shape particles after calcination,some of which are being agglomerated. This corresponds to the VO2(M) phase. Similarly, the calcinedvanadium dioxide which was doped with 0.5 wt % of tungsten exhibited a kind of an irregular shapemorphology. However, by increasing the concentration of the dopant, SEM images of V0.99W0.01O2
and V0.98W0.02O2 shows the presence of a rod-like structure. This was attributed to the presence ofVO2(A) by-product [26,31–33]. The above result is in a good agreement with the XRD results, indicatedthat the presence of VO2(A) by-product became more apparent at the high concentration of W dopant.
Materials 2017, 10, 53 7 of 19
2.2. Morphology
Figure 5 show the SEM images of the products obtained from hydrothermal and calcination processes. The tretrahedral prism shape, corresponding to the VO2(B) phase, was obtained after the hydrothermal. The above morphology changed to granular shape particles after calcination, some of which are being agglomerated. This corresponds to the VO2(M) phase. Similarly, the calcined vanadium dioxide which was doped with 0.5 wt % of tungsten exhibited a kind of an irregular shape morphology. However, by increasing the concentration of the dopant, SEM images of V0.99W0.01O2 and V0.98W0.02O2 shows the presence of a rod-like structure. This was attributed to the presence of VO2(A) by-product [26,31–33]. The above result is in a good agreement with the XRD results, indicated that the presence of VO2(A) by-product became more apparent at the high concentration of W dopant.
Figure 5. SEM images of VO2 obtained from hydrothermal (a); and calcination (b); and the doped VO2(M); V0.995W0.005O2 (c); and V0.98 W0.02O2 (d).
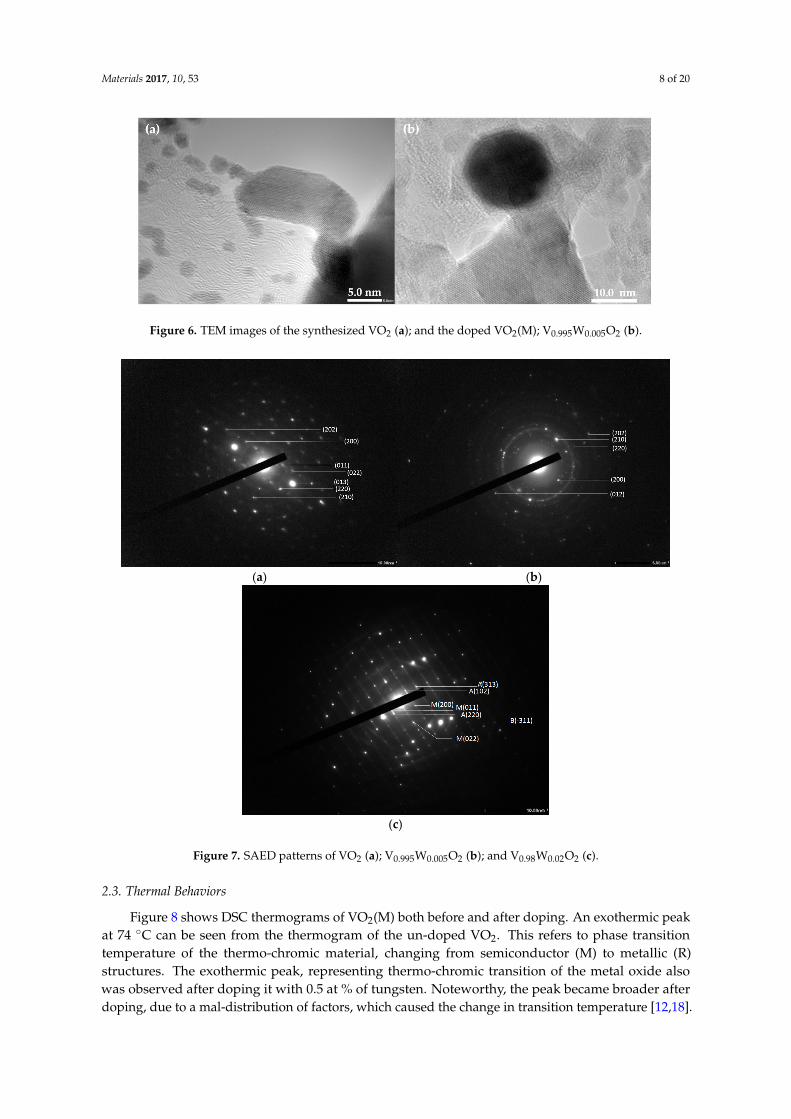
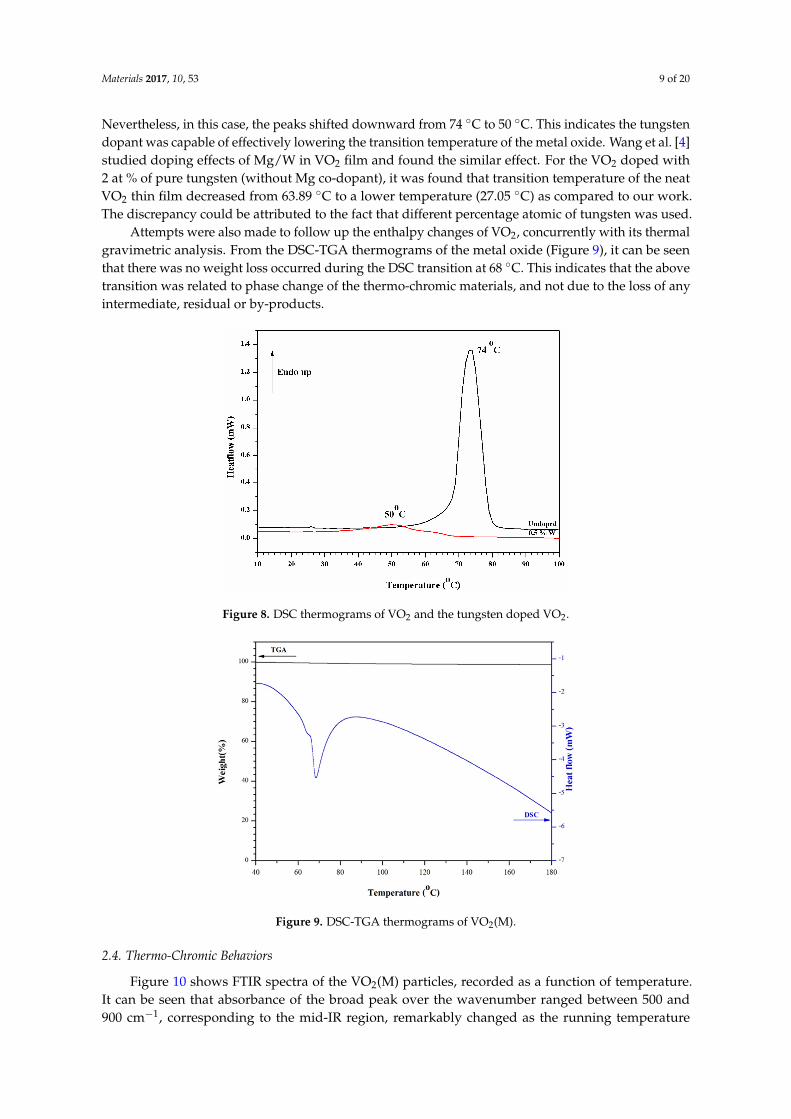
Figure 6 shows lattice fringe in the higher resolution TEM images of the normal VO2 and the doped VO2 (0.5 at % W). Granular shape particles were observed for both cases. This is consistent with that was observed from the SEM image. Size of the un-doped VO2 particles ranges 59 nm increased to 72 nm after doping. Similarly, Liu et al. [34] examined morphology of VO2/Si-Al gel by TEM and found that particle size of the composite was in the range of 20 nm. Attempts were also made to determine the d-spacing of the VO2, The results summarized in Table 1 shows that the values from both techniques are comparable, excepting the VO2 doped with 2 at % in which the lattice fringe in the TEM image was overlapped and unclear. In addition, SAED patterns of the VO2 (Figure 7) show the presence of various crystal planes, indicating that VO2 is polycrystalline. The similar patterns were observed from the 0.5 at % doped VO2. However, as the concentration of W dopant was further increased to 2 at %, the SAED pattern shows the presence of other planes corresponding to the additional VO2(B) and VO2(A) phases. The above results are in good agreement with those were obtained from the XRD patterns (Figure 2).
Figure 5. SEM images of VO2 obtained from hydrothermal (a); and calcination (b); and the dopedVO2(M); V0.995W0.005O2 (c); and V0.98 W0.02O2 (d).
Figure 6 shows lattice fringe in the higher resolution TEM images of the normal VO2 and thedoped VO2 (0.5 at % W). Granular shape particles were observed for both cases. This is consistent withthat was observed from the SEM image. Size of the un-doped VO2 particles ranges 59 nm increased to72 nm after doping. Similarly, Liu et al. [34] examined morphology of VO2/Si-Al gel by TEM and foundthat particle size of the composite was in the range of 20 nm. Attempts were also made to determine thed-spacing of the VO2, The results summarized in Table 1 shows that the values from both techniquesare comparable, excepting the VO2 doped with 2 at % in which the lattice fringe in the TEM imagewas overlapped and unclear. In addition, SAED patterns of the VO2 (Figure 7) show the presenceof various crystal planes, indicating that VO2 is polycrystalline. The similar patterns were observedfrom the 0.5 at % doped VO2. However, as the concentration of W dopant was further increased to2 at %, the SAED pattern shows the presence of other planes corresponding to the additional VO2(B)and VO2(A) phases. The above results are in good agreement with those were obtained from the XRDpatterns (Figure 2).
Materials 2017, 10, 53 8 of 20Materials 2017, 10, 53 8 of 19
Figure 6. TEM images of the synthesized VO2 (a); and the doped VO2(M); V0.995W0.005O2 (b).
(a) (b)
(c)
Figure 7. SAED patterns of VO2 (a); V0.995W0.005O2 (b); and V0.98W0.02O2 (c).
2.3. Thermal Behaviors
Figure 8 shows DSC thermograms of VO2(M) both before and after doping. An exothermic peak at 74 °C can be seen from the thermogram of the un-doped VO2. This refers to phase transition temperature of the thermo-chromic material, changing from semiconductor (M) to metallic (R) structures. The exothermic peak, representing thermo-chromic transition of the metal oxide also was observed after doping it with 0.5 at % of tungsten. Noteworthy, the peak became broader after doping, due to a mal-distribution of factors, which caused the change in transition temperature [12,18]. Nevertheless, in this case, the peaks shifted downward from 74 °C to 50 °C. This indicates the
Figure 6. TEM images of the synthesized VO2 (a); and the doped VO2(M); V0.995W0.005O2 (b).
Materials 2017, 10, 53 8 of 19
Figure 6. TEM images of the synthesized VO2 (a); and the doped VO2(M); V0.995W0.005O2 (b).
(a) (b)
(c)
Figure 7. SAED patterns of VO2 (a); V0.995W0.005O2 (b); and V0.98W0.02O2 (c).
2.3. Thermal Behaviors
Figure 8 shows DSC thermograms of VO2(M) both before and after doping. An exothermic peak at 74 °C can be seen from the thermogram of the un-doped VO2. This refers to phase transition temperature of the thermo-chromic material, changing from semiconductor (M) to metallic (R) structures. The exothermic peak, representing thermo-chromic transition of the metal oxide also was observed after doping it with 0.5 at % of tungsten. Noteworthy, the peak became broader after doping, due to a mal-distribution of factors, which caused the change in transition temperature [12,18]. Nevertheless, in this case, the peaks shifted downward from 74 °C to 50 °C. This indicates the
Figure 7. SAED patterns of VO2 (a); V0.995W0.005O2 (b); and V0.98W0.02O2 (c).
2.3. Thermal Behaviors
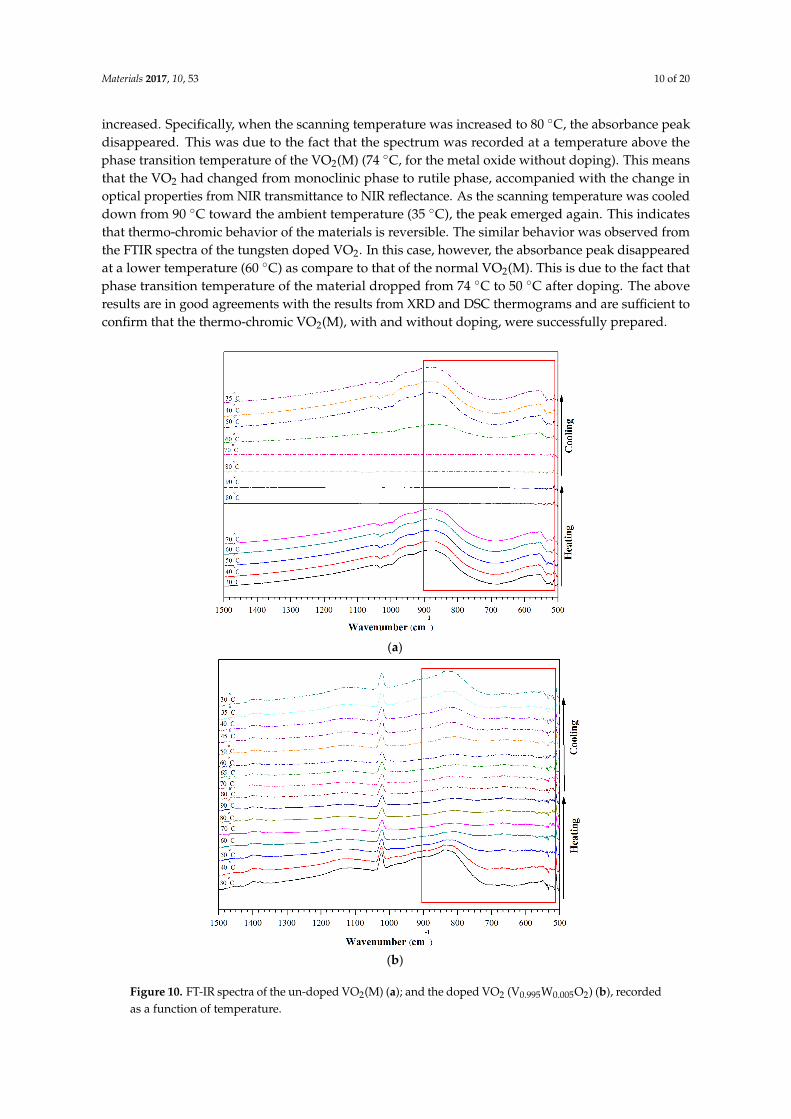
Figure 8 shows DSC thermograms of VO2(M) both before and after doping. An exothermic peakat 74 ◦C can be seen from the thermogram of the un-doped VO2. This refers to phase transitiontemperature of the thermo-chromic material, changing from semiconductor (M) to metallic (R)structures. The exothermic peak, representing thermo-chromic transition of the metal oxide alsowas observed after doping it with 0.5 at % of tungsten. Noteworthy, the peak became broader afterdoping, due to a mal-distribution of factors, which caused the change in transition temperature [12,18].
Materials 2017, 10, 53 9 of 20
Nevertheless, in this case, the peaks shifted downward from 74 ◦C to 50 ◦C. This indicates the tungstendopant was capable of effectively lowering the transition temperature of the metal oxide. Wang et al. [4]studied doping effects of Mg/W in VO2 film and found the similar effect. For the VO2 doped with2 at % of pure tungsten (without Mg co-dopant), it was found that transition temperature of the neatVO2 thin film decreased from 63.89 ◦C to a lower temperature (27.05 ◦C) as compared to our work.The discrepancy could be attributed to the fact that different percentage atomic of tungsten was used.
Attempts were also made to follow up the enthalpy changes of VO2, concurrently with its thermalgravimetric analysis. From the DSC-TGA thermograms of the metal oxide (Figure 9), it can be seenthat there was no weight loss occurred during the DSC transition at 68 ◦C. This indicates that the abovetransition was related to phase change of the thermo-chromic materials, and not due to the loss of anyintermediate, residual or by-products.
Materials 2017, 10, 53 9 of 19
tungsten dopant was capable of effectively lowering the transition temperature of the metal oxide. Wang et al. [4] studied doping effects of Mg/W in VO2.film and found the similar effect. For the VO2 doped with 2 at % of pure tungsten (without Mg co-dopant), it was found that transition temperature of the neat VO2 thin film decreased from 63.89 °C to a lower temperature (27.05 °C) as compared to our work. The discrepancy could be attributed to the fact that different percentage atomic of tungsten was used.
Attempts were also made to follow up the enthalpy changes of VO2, concurrently with its thermal gravimetric analysis. From the DSC-TGA thermograms of the metal oxide (Figure 9), it can be seen that there was no weight loss occurred during the DSC transition at 68 °C. This indicates that the above transition was related to phase change of the thermo-chromic materials, and not due to the loss of any intermediate, residual or by-products.
Figure 8. DSC thermograms of VO2 and the tungsten doped VO2.
Figure 9. DSC-TGA thermograms of VO2(M).
2.4. Thermo-Chromic Behaviors
Figure 10 shows FTIR spectra of the VO2(M) particles, recorded as a function of temperature. It can be seen that absorbance of the broad peak over the wavenumber ranged between 500 and 900
Figure 8. DSC thermograms of VO2 and the tungsten doped VO2.
Materials 2017, 10, 53 9 of 19
tungsten dopant was capable of effectively lowering the transition temperature of the metal oxide. Wang et al. [4] studied doping effects of Mg/W in VO2.film and found the similar effect. For the VO2 doped with 2 at % of pure tungsten (without Mg co-dopant), it was found that transition temperature of the neat VO2 thin film decreased from 63.89 °C to a lower temperature (27.05 °C) as compared to our work. The discrepancy could be attributed to the fact that different percentage atomic of tungsten was used.
Attempts were also made to follow up the enthalpy changes of VO2, concurrently with its thermal gravimetric analysis. From the DSC-TGA thermograms of the metal oxide (Figure 9), it can be seen that there was no weight loss occurred during the DSC transition at 68 °C. This indicates that the above transition was related to phase change of the thermo-chromic materials, and not due to the loss of any intermediate, residual or by-products.
Figure 8. DSC thermograms of VO2 and the tungsten doped VO2.
Figure 9. DSC-TGA thermograms of VO2(M).
2.4. Thermo-Chromic Behaviors
Figure 10 shows FTIR spectra of the VO2(M) particles, recorded as a function of temperature. It can be seen that absorbance of the broad peak over the wavenumber ranged between 500 and 900
Figure 9. DSC-TGA thermograms of VO2(M).
2.4. Thermo-Chromic Behaviors
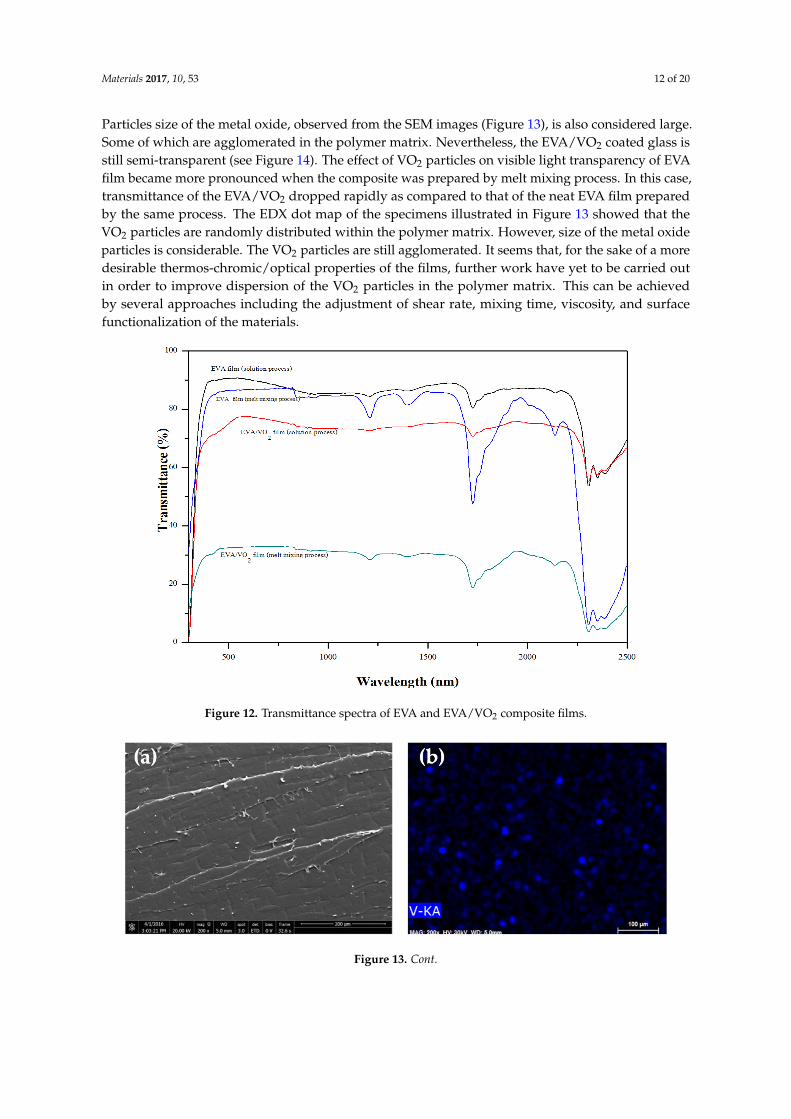
Figure 10 shows FTIR spectra of the VO2(M) particles, recorded as a function of temperature.It can be seen that absorbance of the broad peak over the wavenumber ranged between 500 and900 cm−1, corresponding to the mid-IR region, remarkably changed as the running temperature
Materials 2017, 10, 53 10 of 20
increased. Specifically, when the scanning temperature was increased to 80 ◦C, the absorbance peakdisappeared. This was due to the fact that the spectrum was recorded at a temperature above thephase transition temperature of the VO2(M) (74 ◦C, for the metal oxide without doping). This meansthat the VO2 had changed from monoclinic phase to rutile phase, accompanied with the change inoptical properties from NIR transmittance to NIR reflectance. As the scanning temperature was cooleddown from 90 ◦C toward the ambient temperature (35 ◦C), the peak emerged again. This indicatesthat thermo-chromic behavior of the materials is reversible. The similar behavior was observed fromthe FTIR spectra of the tungsten doped VO2. In this case, however, the absorbance peak disappearedat a lower temperature (60 ◦C) as compare to that of the normal VO2(M). This is due to the fact thatphase transition temperature of the material dropped from 74 ◦C to 50 ◦C after doping. The aboveresults are in good agreements with the results from XRD and DSC thermograms and are sufficient toconfirm that the thermo-chromic VO2(M), with and without doping, were successfully prepared.
Materials 2017, 10, 53 10 of 19
cm−1, corresponding to the mid-IR region, remarkably changed as the running temperature increased. Specifically, when the scanning temperature was increased to 80 °C, the absorbance peak disappeared. This was due to the fact that the spectrum was recorded at a temperature above the phase transition temperature of the VO2(M) (74 °C, for the metal oxide without doping). This means that the VO2 had changed from monoclinic phase to rutile phase, accompanied with the change in optical properties from NIR transmittance to NIR reflectance. As the scanning temperature was cooled down from 90 °C toward the ambient temperature (35 °C), the peak emerged again. This indicates that thermo-chromic behavior of the materials is reversible. The similar behavior was observed from the FTIR spectra of the tungsten doped VO2. In this case, however, the absorbance peak disappeared at a lower temperature (60 °C) as compare to that of the normal VO2(M). This is due to the fact that phase transition temperature of the material dropped from 74 °C to 50 °C after doping. The above results are in good agreements with the results from XRD and DSC thermograms and are sufficient to confirm that the thermo-chromic VO2(M), with and without doping, were successfully prepared.
(a)
(b)
Figure 10. FT-IR spectra of the un-doped VO2(M) (a); and the doped VO2 (V0.995W0.005O2) (b), recorded as a function of temperature.
Figure 10. FT-IR spectra of the un-doped VO2(M) (a); and the doped VO2 (V0.995W0.005O2) (b), recordedas a function of temperature.

Materials 2017, 10, 53 11 of 20
2.5. Structure-Properties of EVA/VO2 Composites
Figure 11 shows stress-strain curves of EVA and the EVA/VO2 composite films. Tensile propertiesof the various samples were also summarized in Table 2. The ultimate stress, strain at break and initialslope of the EVA hardly changed after applying 1 wt % of the VO2 particles into the polymer film.However, it was noted that the tensile properties significantly affected by the mixing process. The filmsprepared via the melt mixing process are stronger than those of which prepared by the solution mixingprocess. The discrepancies can be related to the lower gel content values of the solution casted films(Table 2) as compared to those of which prepared by the melt mixing process. This was, in turn, owingto some differences between the two processes, in terms of the actual curing conditions. Specifically,the melt mixed film was prepared by an internal mixer followed by curing in a hydraulic compressionmolding under high pressure. On the other hand, the solution casted film was mixed by solutionbefore curing in a hot air oven without any pressure. In this regard, the shear rate, heat transfer andthe actual temperature of the two processes could be different. These factors might promote the greatergel content and mechanical properties of the films prepared by the melt process.
Materials 2017, 10, 53 11 of 19
2.5. Structure-Properties of EVA/VO2 Composites
Figure 11 shows stress-strain curves of EVA and the EVA/VO2 composite films. Tensile properties of the various samples were also summarized in Table 2. The ultimate stress, strain at break and initial slope of the EVA hardly changed after applying 1 wt % of the VO2 particles into the polymer film. However, it was noted that the tensile properties significantly affected by the mixing process. The films prepared via the melt mixing process are stronger than those of which prepared by the solution mixing process. The discrepancies can be related to the lower gel content values of the solution casted films (Table 2) as compared to those of which prepared by the melt mixing process. This was, in turn, owing to some differences between the two processes, in terms of the actual curing conditions. Specifically, the melt mixed film was prepared by an internal mixer followed by curing in a hydraulic compression molding under high pressure. On the other hand, the solution casted film was mixed by solution before curing in a hot air oven without any pressure. In this regard, the shear rate, heat transfer and the actual temperature of the two processes could be different. These factors might promote the greater gel content and mechanical properties of the films prepared by the melt process.
Figure 11. Stress-strain curves of EVA and EVA/VO2 composite films.
Table 2. Tensile, physical and optical properties of EVA and EVA/VO2 composite films.
Properties EVA Films EVA/VO2 (1 wt %) Films
Melt Mixing Solution Mixing Melt Mixing Solution MixingModulus (MPa) 14.29 (±0.99) 4.70 (±0.73) 13.12 (±1.23) 5.31 (±0.34)
Ultimate tensile Stress (MPa) 29.75 (±3.75) 13.63 (±2.00) 32.25 (±1.39) 13.89 (±0.76) Strain (%) 604 (±37) 802 (±17.81) 696 (±9) 745 (±14.72)
Toughness (J) 6.20 (±0.87) 7.14 (±0.59) 7.58 (±0.39) 6.10 (±0.49) Gel content (%) 83.62 (±3.49) 45.90 (±1.11) 93.25 (±1.89) 34.80 (±2.20)
Visible light transmittance (%) 85.98 (±0.97) 89.95 (±0.54) 31.60 (±0.73) 73.73 (±0.56)
Figure 12 shows the overlaid UV/Vis spectra of the various EVA films and the average visible light transmittance of the EVA films are summarized in Table 2. Regardless of the mixing processes, light transmittance in the visible range of the EVA was about 86%–89.95%. After mixing VO2 particles with EVA by a solution process, visible light transmittance of the solution casted film slightly decreased to 73.73%. This was due to the presence of the metal oxide particles which is inherently
Figure 11. Stress-strain curves of EVA and EVA/VO2 composite films.
Table 2. Tensile, physical and optical properties of EVA and EVA/VO2 composite films.
PropertiesEVA Films EVA/VO2 (1 wt %) Films
Melt Mixing Solution Mixing Melt Mixing Solution Mixing
Modulus (MPa) 14.29 (±0.99) 4.70 (±0.73) 13.12 (±1.23) 5.31 (±0.34)Ultimate tensile Stress (MPa) 29.75 (±3.75) 13.63 (±2.00) 32.25 (±1.39) 13.89 (±0.76)
Strain (%) 604 (±37) 802 (±17.81) 696 (±9) 745 (±14.72)Toughness (J) 6.20 (±0.87) 7.14 (±0.59) 7.58 (±0.39) 6.10 (±0.49)
Gel content (%) 83.62 (±3.49) 45.90 (±1.11) 93.25 (±1.89) 34.80 (±2.20)Visible light transmittance (%) 85.98 (±0.97) 89.95 (±0.54) 31.60 (±0.73) 73.73 (±0.56)
Figure 12 shows the overlaid UV/Vis spectra of the various EVA films and the average visiblelight transmittance of the EVA films are summarized in Table 2. Regardless of the mixing processes,light transmittance in the visible range of the EVA was about 86%–89.95%. After mixing VO2 particleswith EVA by a solution process, visible light transmittance of the solution casted film slightly decreasedto 73.73%. This was due to the presence of the metal oxide particles which is inherently opaque.
Materials 2017, 10, 53 12 of 20
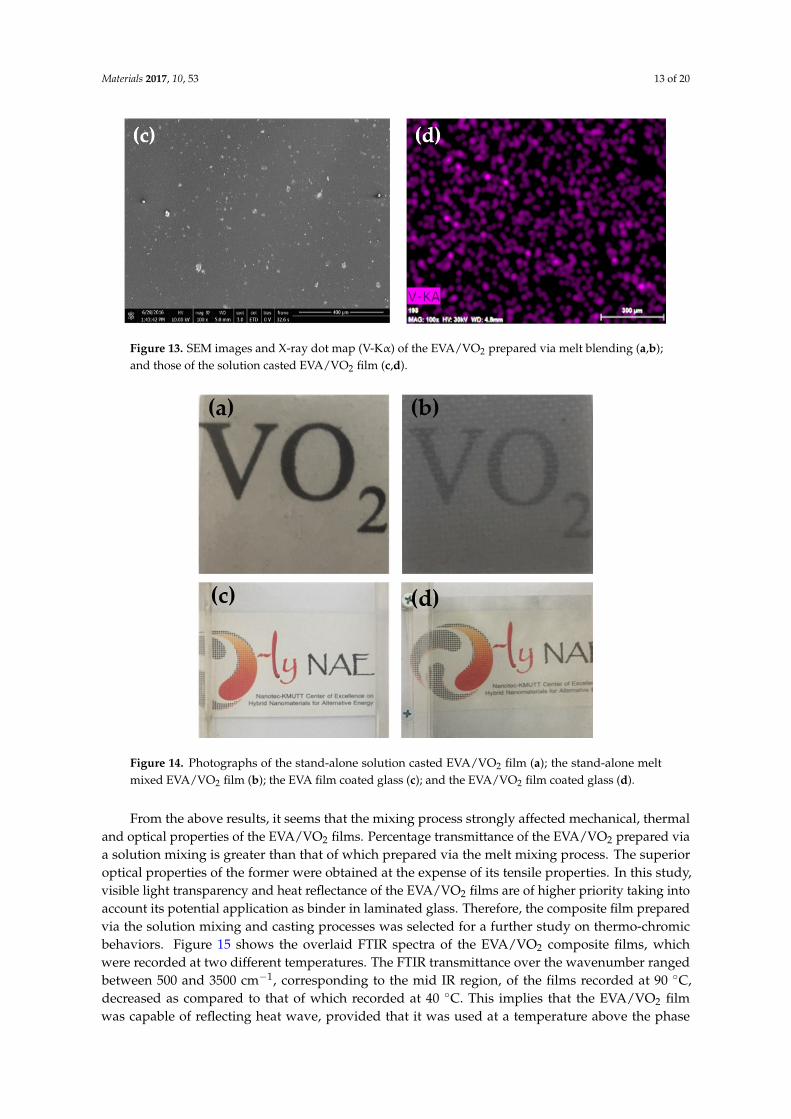
Particles size of the metal oxide, observed from the SEM images (Figure 13), is also considered large.Some of which are agglomerated in the polymer matrix. Nevertheless, the EVA/VO2 coated glass isstill semi-transparent (see Figure 14). The effect of VO2 particles on visible light transparency of EVAfilm became more pronounced when the composite was prepared by melt mixing process. In this case,transmittance of the EVA/VO2 dropped rapidly as compared to that of the neat EVA film preparedby the same process. The EDX dot map of the specimens illustrated in Figure 13 showed that theVO2 particles are randomly distributed within the polymer matrix. However, size of the metal oxideparticles is considerable. The VO2 particles are still agglomerated. It seems that, for the sake of a moredesirable thermos-chromic/optical properties of the films, further work have yet to be carried outin order to improve dispersion of the VO2 particles in the polymer matrix. This can be achievedby several approaches including the adjustment of shear rate, mixing time, viscosity, and surfacefunctionalization of the materials.
Materials 2017, 10, 53 12 of 19
opaque. Particles size of the metal oxide, observed from the SEM images (Figure 13), is also considered large. Some of which are agglomerated in the polymer matrix. Nevertheless, the EVA/VO2 coated glass is still semi-transparent (see Figure 14). The effect of VO2 particles on visible light transparency of EVA film became more pronounced when the composite was prepared by melt mixing process. In this case, transmittance of the EVA/VO2 dropped rapidly as compared to that of the neat EVA film prepared by the same process. The EDX dot map of the specimens illustrated in Figure 13 showed that the VO2 particles are randomly distributed within the polymer matrix. However, size of the metal oxide particles is considerable. The VO2 particles are still agglomerated. It seems that, for the sake of a more desirable thermos-chromic/optical properties of the films, further work have yet to be carried out in order to improve dispersion of the VO2 particles in the polymer matrix. This can be achieved by several approaches including the adjustment of shear rate, mixing time, viscosity, and surface functionalization of the materials.
Figure 12. Transmittance spectra of EVA and EVA/VO2 composite films.
Figure 12. Transmittance spectra of EVA and EVA/VO2 composite films.
Materials 2017, 10, 53 12 of 19
opaque. Particles size of the metal oxide, observed from the SEM images (Figure 13), is also considered large. Some of which are agglomerated in the polymer matrix. Nevertheless, the EVA/VO2 coated glass is still semi-transparent (see Figure 14). The effect of VO2 particles on visible light transparency of EVA film became more pronounced when the composite was prepared by melt mixing process. In this case, transmittance of the EVA/VO2 dropped rapidly as compared to that of the neat EVA film prepared by the same process. The EDX dot map of the specimens illustrated in Figure 13 showed that the VO2 particles are randomly distributed within the polymer matrix. However, size of the metal oxide particles is considerable. The VO2 particles are still agglomerated. It seems that, for the sake of a more desirable thermos-chromic/optical properties of the films, further work have yet to be carried out in order to improve dispersion of the VO2 particles in the polymer matrix. This can be achieved by several approaches including the adjustment of shear rate, mixing time, viscosity, and surface functionalization of the materials.
Figure 12. Transmittance spectra of EVA and EVA/VO2 composite films.
Figure 13. Cont.
Materials 2017, 10, 53 13 of 20Materials 2017, 10, 53 13 of 19
Figure 13. SEM images and X-ray dot map (V-Kα) of the EVA/VO2 prepared via melt blending (a,b); and those of the solution casted EVA/VO2 film (c,d).
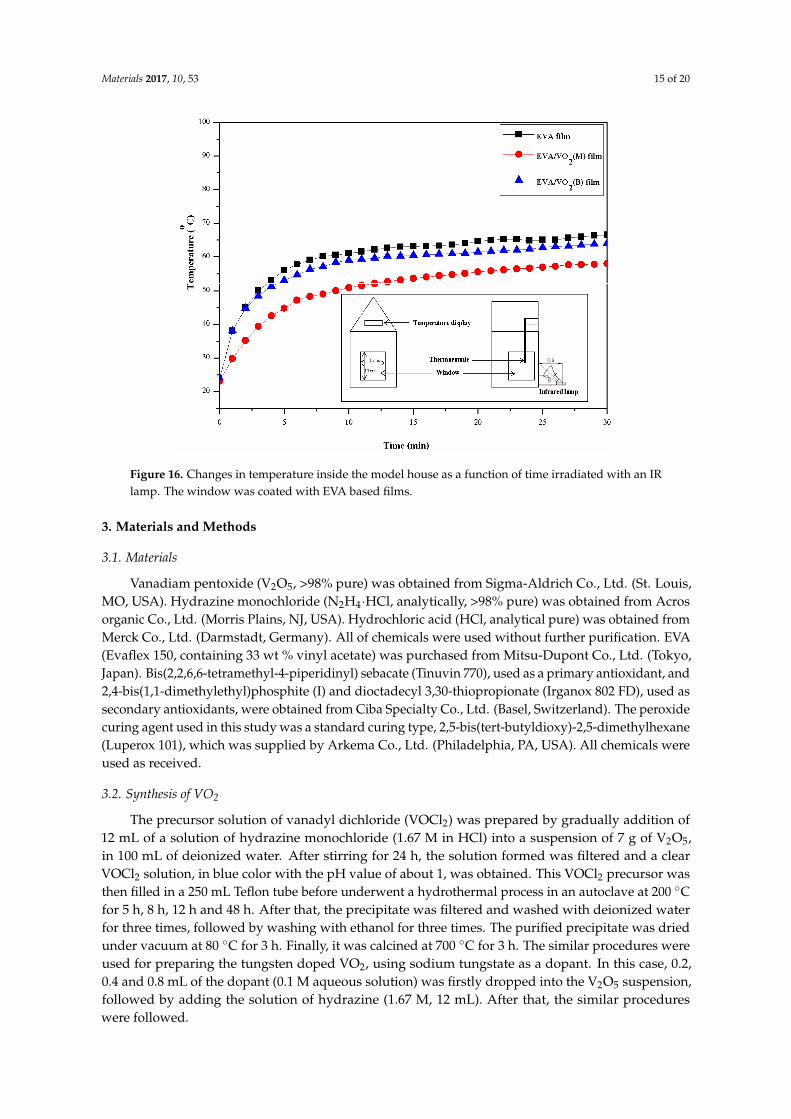
Figure 14. Photographs of the stand-alone solution casted EVA/VO2 film (a); the stand-alone melt mixed EVA/VO2 film (b); the EVA film coated glass (c); and the EVA/VO2 film coated glass (d).
From the above results, it seems that the mixing process strongly affected mechanical, thermal and optical properties of the EVA/VO2 films. Percentage transmittance of the EVA/VO2 prepared via a solution mixing is greater than that of which prepared via the melt mixing process. The superior optical properties of the former were obtained at the expense of its tensile properties. In this study, visible light transparency and heat reflectance of the EVA/VO2 films are of higher priority taking into account its potential application as binder in laminated glass. Therefore, the composite film prepared via the solution mixing and casting processes was selected for a further study on thermo-chromic behaviors. Figure 15 shows the overlaid FTIR spectra of the EVA/VO2 composite films, which were recorded at two different temperatures. The FTIR transmittance over the wavenumber ranged between 500 and 3500 cm−1, corresponding to the mid IR region, of the films recorded at 90 °C, decreased as compared to that of which recorded at 40 °C. This implies that the EVA/VO2 film was capable of reflecting heat wave, provided that it was used at a temperature above the phase transition temperature of VO2(M). The similar results was observed Suzuki et al. [20] in the VO2-SiO2
Figure 13. SEM images and X-ray dot map (V-Kα) of the EVA/VO2 prepared via melt blending (a,b);and those of the solution casted EVA/VO2 film (c,d).
Materials 2017, 10, 53 13 of 19
Figure 13. SEM images and X-ray dot map (V-Kα) of the EVA/VO2 prepared via melt blending (a,b); and those of the solution casted EVA/VO2 film (c,d).
Figure 14. Photographs of the stand-alone solution casted EVA/VO2 film (a); the stand-alone melt mixed EVA/VO2 film (b); the EVA film coated glass (c); and the EVA/VO2 film coated glass (d).
From the above results, it seems that the mixing process strongly affected mechanical, thermal and optical properties of the EVA/VO2 films. Percentage transmittance of the EVA/VO2 prepared via a solution mixing is greater than that of which prepared via the melt mixing process. The superior optical properties of the former were obtained at the expense of its tensile properties. In this study, visible light transparency and heat reflectance of the EVA/VO2 films are of higher priority taking into account its potential application as binder in laminated glass. Therefore, the composite film prepared via the solution mixing and casting processes was selected for a further study on thermo-chromic behaviors. Figure 15 shows the overlaid FTIR spectra of the EVA/VO2 composite films, which were recorded at two different temperatures. The FTIR transmittance over the wavenumber ranged between 500 and 3500 cm−1, corresponding to the mid IR region, of the films recorded at 90 °C, decreased as compared to that of which recorded at 40 °C. This implies that the EVA/VO2 film was capable of reflecting heat wave, provided that it was used at a temperature above the phase transition temperature of VO2(M). The similar results was observed Suzuki et al. [20] in the VO2-SiO2
Figure 14. Photographs of the stand-alone solution casted EVA/VO2 film (a); the stand-alone meltmixed EVA/VO2 film (b); the EVA film coated glass (c); and the EVA/VO2 film coated glass (d).
From the above results, it seems that the mixing process strongly affected mechanical, thermaland optical properties of the EVA/VO2 films. Percentage transmittance of the EVA/VO2 prepared viaa solution mixing is greater than that of which prepared via the melt mixing process. The superioroptical properties of the former were obtained at the expense of its tensile properties. In this study,visible light transparency and heat reflectance of the EVA/VO2 films are of higher priority taking intoaccount its potential application as binder in laminated glass. Therefore, the composite film preparedvia the solution mixing and casting processes was selected for a further study on thermo-chromicbehaviors. Figure 15 shows the overlaid FTIR spectra of the EVA/VO2 composite films, whichwere recorded at two different temperatures. The FTIR transmittance over the wavenumber rangedbetween 500 and 3500 cm−1, corresponding to the mid IR region, of the films recorded at 90 ◦C,decreased as compared to that of which recorded at 40 ◦C. This implies that the EVA/VO2 filmwas capable of reflecting heat wave, provided that it was used at a temperature above the phase

Materials 2017, 10, 53 14 of 20
transition temperature of VO2(M). The similar results was observed Suzuki et al. [20] in the VO2-SiO2
particle/PLA composite, using the FTIR spectrophotometer to record the transmittance over thewavelength range between 2.5 µm and 8.5 µm (corresponding to the mid IR region). In that case,transmittance of the composite recorded at a high temperature (80 ◦C) was 10% lower than that ofwhich recorded at a room temperature. However, PLA resin is inherently brittle, moisture sensitive,and expensive. In this regard, the application of VO2/PLA composite as coating for smart windowmight not be practical. It is also worth mentioning that changes in spectral transmittances of theVO2, recoded by FTIR, are less obvious as compared to those of which recorded by Zhou et al. [35].In that case, solar modulation (∆Tsol) of the VO2/hydrogel hybrid, recorded over the wavelengthrange from 500 to 2500 nm, as high as 34.7% was observed. Similarly, Shi et al. [19] found that NIRtransmittance, at 2500 nm, of the acrylic resin/W doped VO2 coating decreased by up to 23% afterincreasing a temperature to above its transition.
Materials 2017, 10, 53 14 of 19
particle/PLA composite, using the FTIR spectrophotometer to record the transmittance over the wavelength range between 2.5 µm and 8.5 µm (corresponding to the mid IR region). In that case, transmittance of the composite recorded at a high temperature (80 °C) was 10% lower than that of which recorded at a room temperature. However, PLA resin is inherently brittle, moisture sensitive, and expensive. In this regard, the application of VO2/PLA composite as coating for smart window might not be practical. It is also worth mentioning that changes in spectral transmittances of the VO2, recoded by FTIR, are less obvious as compared to those of which recorded by Zhou et al. [35]. In that case, solar modulation (∆Tsol) of the VO2/hydrogel hybrid, recorded over the wavelength range from 500 to 2500 nm, as high as 34.7% was observed. Similarly, Shi et al. [19] found that NIR transmittance, at 2500 nm, of the acrylic resin/W doped VO2 coating decreased by up to 23% after increasing a temperature to above its transition.
Figure 15. FTIR spectra of the solution casted EVA/VO2 (1 wt %) film recorded at 40 and 90 °C.
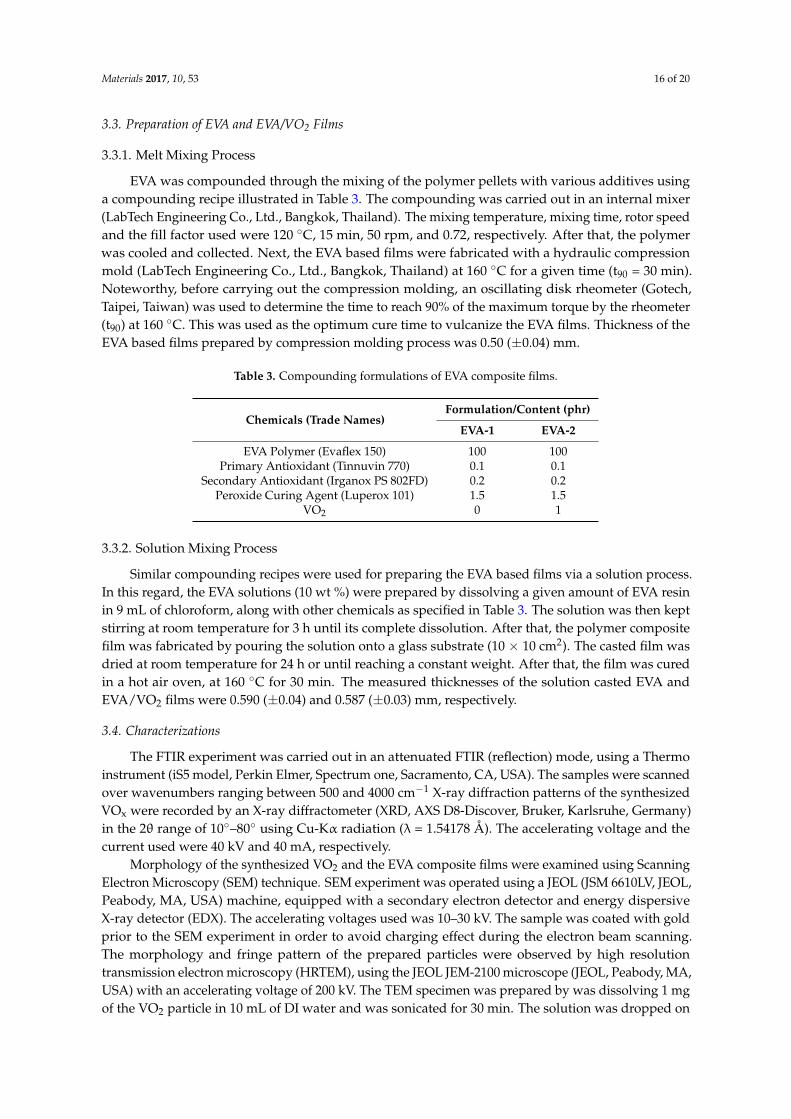
Last but not least, the above results were confirmed by considering the demo system, containing EVA and EVA/VO2 films coated on a window of a model house (see Figure 16; inset). An infrared lamp (PHILIPS, R125 IR R 150 W) was used as a heat source to activate phase change and thermo-chromic behavior of the VO2. The actual temperature in front of the window, measure by thermocouple was 100 ± 1 °C. This is well above the transition temperature of the VO2. Figure 16 shows changes in indoor temperature behind the windows as a function of irradiation time. It can be seen that the temperature linearly increased with time and reached a plateau after about 10 min. The equilibrium temperature behind the window coated with the normal EVA film was approximately 62 °C. The similar profiles were observed when the EVA film was replaced with either EVA/VO2(M) or EVA/VO2(B) composite films. Some discrepancies were noted, however, for these cases. The equilibrium temperature behind the window coated with EVA/VO2(M) was about 53 °C, which is significantly much lower than that of the control system (the use of a window with the normal EVA film). The above effect was not the case when EVA/VO2(B) film was used. Again, the difference can be ascribed to the fact that the VO2(M) is a kind of thermo-chromic material whereas the VO2(B) was not. This reflects that the main factor attributing to the decrease of temperature inside the model house is heat reflectance of the thermo-chromic VO2(M) particles, and not due to light scattering effect.
Figure 15. FTIR spectra of the solution casted EVA/VO2 (1 wt %) film recorded at 40 and 90 ◦C.
Last but not least, the above results were confirmed by considering the demo system, containingEVA and EVA/VO2 films coated on a window of a model house (see Figure 16; inset). An infrared lamp(PHILIPS, R125 IR R 150 W) was used as a heat source to activate phase change and thermo-chromicbehavior of the VO2. The actual temperature in front of the window, measure by thermocouple was100± 1 ◦C. This is well above the transition temperature of the VO2. Figure 16 shows changes in indoortemperature behind the windows as a function of irradiation time. It can be seen that the temperaturelinearly increased with time and reached a plateau after about 10 min. The equilibrium temperaturebehind the window coated with the normal EVA film was approximately 62 ◦C. The similar profileswere observed when the EVA film was replaced with either EVA/VO2(M) or EVA/VO2(B) compositefilms. Some discrepancies were noted, however, for these cases. The equilibrium temperature behindthe window coated with EVA/VO2(M) was about 53 ◦C, which is significantly much lower than thatof the control system (the use of a window with the normal EVA film). The above effect was notthe case when EVA/VO2(B) film was used. Again, the difference can be ascribed to the fact that theVO2(M) is a kind of thermo-chromic material whereas the VO2(B) was not. This reflects that the mainfactor attributing to the decrease of temperature inside the model house is heat reflectance of thethermo-chromic VO2(M) particles, and not due to light scattering effect.
Materials 2017, 10, 53 15 of 20Materials 2017, 10, 53 15 of 19
Figure 16. Changes in temperature inside the model house as a function of time irradiated with an IR lamp. The window was coated with EVA based films.
3. Materials and Methods
3.1. Materials
Vanadiam pentoxide (V2O5, >98% pure) was obtained from Sigma-Aldrich Co., Ltd. (St. Louis, MO, USA). Hydrazine monochloride (N2H4·HCl, analytically, >98% pure) was obtained from Acros organic Co., Ltd. (Morris Plains, NJ, USA). Hydrochloric acid (HCl, analytical pure) was obtained from Merck Co., Ltd. (Darmstadt, Germany). All of chemicals were used without further purification. EVA (Evaflex 150, containing 33 wt % vinyl acetate) was purchased from Mitsu-Dupont Co., Ltd. (Tokyo, Japan). Bis(2,2,6,6-tetramethyl-4-piperidinyl) sebacate (Tinuvin 770), used as a primary antioxidant, and 2,4-bis(1,1-dimethylethyl)phosphite (I) and dioctadecyl 3,30-thiopropionate (Irganox 802 FD), used as secondary antioxidants, were obtained from Ciba Specialty Co., Ltd. (Basel, Switzerland). The peroxide curing agent used in this study was a standard curing type, 2,5-bis(tert-butyldioxy)-2,5-dimethylhexane (Luperox 101), which was supplied by Arkema Co., Ltd. (Philadelphia, PA, USA). All chemicals were used as received.
3.2. Synthesis of VO2
The precursor solution of vanadyl dichloride (VOCl2) was prepared by gradually addition of 12 mL of a solution of hydrazine monochloride (1.67 M in HCl) into a suspension of 7 g of V2O5, in 100 mL of deionized water. After stirring for 24 h, the solution formed was filtered and a clear VOCl2 solution, in blue color with the pH value of about 1, was obtained. This VOCl2 precursor was then filled in a 250 mL Teflon tube before underwent a hydrothermal process in an autoclave at 200 °C for 5 h, 8 h, 12 h and 48 h. After that, the precipitate was filtered and washed with deionized water for three times, followed by washing with ethanol for three times. The purified precipitate was dried under vacuum at 80 °C for 3 h. Finally, it was calcined at 700 °C for 3 h. The similar procedures were used for preparing the tungsten doped VO2, using sodium tungstate as a dopant. In this case, 0.2, 0.4 and 0.8 mL of the dopant (0.1 M aqueous solution) was firstly dropped into the V2O5 suspension, followed by adding the solution of hydrazine (1.67 M, 12 mL). After that, the similar procedures were followed.
Figure 16. Changes in temperature inside the model house as a function of time irradiated with an IRlamp. The window was coated with EVA based films.
3. Materials and Methods
3.1. Materials
Vanadiam pentoxide (V2O5, >98% pure) was obtained from Sigma-Aldrich Co., Ltd. (St. Louis,MO, USA). Hydrazine monochloride (N2H4·HCl, analytically, >98% pure) was obtained from Acrosorganic Co., Ltd. (Morris Plains, NJ, USA). Hydrochloric acid (HCl, analytical pure) was obtained fromMerck Co., Ltd. (Darmstadt, Germany). All of chemicals were used without further purification. EVA(Evaflex 150, containing 33 wt % vinyl acetate) was purchased from Mitsu-Dupont Co., Ltd. (Tokyo,Japan). Bis(2,2,6,6-tetramethyl-4-piperidinyl) sebacate (Tinuvin 770), used as a primary antioxidant, and2,4-bis(1,1-dimethylethyl)phosphite (I) and dioctadecyl 3,30-thiopropionate (Irganox 802 FD), used assecondary antioxidants, were obtained from Ciba Specialty Co., Ltd. (Basel, Switzerland). The peroxidecuring agent used in this study was a standard curing type, 2,5-bis(tert-butyldioxy)-2,5-dimethylhexane(Luperox 101), which was supplied by Arkema Co., Ltd. (Philadelphia, PA, USA). All chemicals wereused as received.
3.2. Synthesis of VO2
The precursor solution of vanadyl dichloride (VOCl2) was prepared by gradually addition of12 mL of a solution of hydrazine monochloride (1.67 M in HCl) into a suspension of 7 g of V2O5,in 100 mL of deionized water. After stirring for 24 h, the solution formed was filtered and a clearVOCl2 solution, in blue color with the pH value of about 1, was obtained. This VOCl2 precursor wasthen filled in a 250 mL Teflon tube before underwent a hydrothermal process in an autoclave at 200 ◦Cfor 5 h, 8 h, 12 h and 48 h. After that, the precipitate was filtered and washed with deionized waterfor three times, followed by washing with ethanol for three times. The purified precipitate was driedunder vacuum at 80 ◦C for 3 h. Finally, it was calcined at 700 ◦C for 3 h. The similar procedures wereused for preparing the tungsten doped VO2, using sodium tungstate as a dopant. In this case, 0.2,0.4 and 0.8 mL of the dopant (0.1 M aqueous solution) was firstly dropped into the V2O5 suspension,followed by adding the solution of hydrazine (1.67 M, 12 mL). After that, the similar procedureswere followed.
Materials 2017, 10, 53 16 of 20
3.3. Preparation of EVA and EVA/VO2 Films
3.3.1. Melt Mixing Process
EVA was compounded through the mixing of the polymer pellets with various additives usinga compounding recipe illustrated in Table 3. The compounding was carried out in an internal mixer(LabTech Engineering Co., Ltd., Bangkok, Thailand). The mixing temperature, mixing time, rotor speedand the fill factor used were 120 ◦C, 15 min, 50 rpm, and 0.72, respectively. After that, the polymerwas cooled and collected. Next, the EVA based films were fabricated with a hydraulic compressionmold (LabTech Engineering Co., Ltd., Bangkok, Thailand) at 160 ◦C for a given time (t90 = 30 min).Noteworthy, before carrying out the compression molding, an oscillating disk rheometer (Gotech,Taipei, Taiwan) was used to determine the time to reach 90% of the maximum torque by the rheometer(t90) at 160 ◦C. This was used as the optimum cure time to vulcanize the EVA films. Thickness of theEVA based films prepared by compression molding process was 0.50 (±0.04) mm.
Table 3. Compounding formulations of EVA composite films.
Chemicals (Trade Names)Formulation/Content (phr)
EVA-1 EVA-2
EVA Polymer (Evaflex 150) 100 100Primary Antioxidant (Tinnuvin 770) 0.1 0.1
Secondary Antioxidant (Irganox PS 802FD) 0.2 0.2Peroxide Curing Agent (Luperox 101) 1.5 1.5
VO2 0 1
3.3.2. Solution Mixing Process
Similar compounding recipes were used for preparing the EVA based films via a solution process.In this regard, the EVA solutions (10 wt %) were prepared by dissolving a given amount of EVA resinin 9 mL of chloroform, along with other chemicals as specified in Table 3. The solution was then keptstirring at room temperature for 3 h until its complete dissolution. After that, the polymer compositefilm was fabricated by pouring the solution onto a glass substrate (10 × 10 cm2). The casted film wasdried at room temperature for 24 h or until reaching a constant weight. After that, the film was curedin a hot air oven, at 160 ◦C for 30 min. The measured thicknesses of the solution casted EVA andEVA/VO2 films were 0.590 (±0.04) and 0.587 (±0.03) mm, respectively.
3.4. Characterizations
The FTIR experiment was carried out in an attenuated FTIR (reflection) mode, using a Thermoinstrument (iS5 model, Perkin Elmer, Spectrum one, Sacramento, CA, USA). The samples were scannedover wavenumbers ranging between 500 and 4000 cm−1 X-ray diffraction patterns of the synthesizedVOx were recorded by an X-ray diffractometer (XRD, AXS D8-Discover, Bruker, Karlsruhe, Germany)in the 2θ range of 10◦–80◦ using Cu-Kα radiation (λ = 1.54178 Å). The accelerating voltage and thecurrent used were 40 kV and 40 mA, respectively.
Morphology of the synthesized VO2 and the EVA composite films were examined using ScanningElectron Microscopy (SEM) technique. SEM experiment was operated using a JEOL (JSM 6610LV, JEOL,Peabody, MA, USA) machine, equipped with a secondary electron detector and energy dispersiveX-ray detector (EDX). The accelerating voltages used was 10–30 kV. The sample was coated with goldprior to the SEM experiment in order to avoid charging effect during the electron beam scanning.The morphology and fringe pattern of the prepared particles were observed by high resolutiontransmission electron microscopy (HRTEM), using the JEOL JEM-2100 microscope (JEOL, Peabody, MA,USA) with an accelerating voltage of 200 kV. The TEM specimen was prepared by was dissolving 1 mgof the VO2 particle in 10 mL of DI water and was sonicated for 30 min. The solution was dropped on

Materials 2017, 10, 53 17 of 20
copper grid and was dried under room temperature. In addition to the TEM images, the attachment ofselected area electron diffraction (SAED) of JEM-2100 was used to get the crystallographic information.
3.4.1. Thermal Analysis
Phase transition temperatures of the synthesized VO2, with and without doping, as well as glasstransition temperature (Tg) and melt transition temperature values of the polymer composites wereinvestigated by using a DSC technique. Typically, about 15 mg of the sample was used and the DSCexperiment was carried out with a NETZSCH (DSC 204, NETZSCH, Watertown, MA, USA) instrumentunder a nitrogen atmosphere at a heating rate of 10 ◦C/min over temperatures ranging between 0 and200 ◦C. Percentage crystallinity (Xc) of the samples was calculated according to Equation (4):
(Xc) = (∆Hf /∆Hf*) × 100 (4)
where ∆Hf* is the enthalpy of fusion of the perfect polyethylene (PE) crystal; ∆Hf is the enthalpy offusion of the EVA samples, respectively. The value of ∆Hf* for PE is 277.1 J/g [36].
In addition, the weight composition and thermal stability of the EVA composite films wereconcurrently determined along with the DSC experiment, using a DSC/thermal gravimetric analysis(TGA) techniques. In this regard, the DSC/TGA experiment was carried out with a NETZSCH(TGA 209 model). Approximately 8 mg of each sample was used and the TGA experiment wasscanned over temperatures ranging between 25 ◦C and 900 ◦C under nitrogen gas and a heating rateof 10 ◦C/min.
3.4.2. Testing of the EVA Based Films
The mechanical properties of the various EVA films were evaluated by tensile test, using Lloyd(LR 50 K, West Sussex, UK) instrument. Dumbbell-shaped specimens were prepared by cutting thedried films with a die, in accordance with the ASTM D638 standard. The gauge length used was50 mm and the tensile test was carried out at a crosshead speed of 500 mm·min−1, using the 1 kN loadcell. At least five specimens were tested for each sample and the average values of Young’s modulus,tensile strength at break, and elongation at break were calculated using standard equations. Tensiletoughness was also calculated by using the area underneath the stress-strain curve.
Gel content of the cured EVA film was tested in accordance with the ASTM D-2765 standardmethod. About 1 g of the cured EVA films was immersed in xylene and then refluxed for 12 h.The specimens were then dried at 110 ◦C for 10 h before weighing. Gel content was evaluated usingthe following Equation (5):
Gel content = (W1/W2) × 100 (5)
where W1 = the swollen weight of the specimen after an immersion in xylene; W2 = the dried weightof the specimen.
UV/Visible absorption spectra of various samples were recorded on a Shimadzu UV-3100spectrophotometer (Shimadzu, Tokyo, Japan) over wavelengths ranging between 200 and 1000 nm.Visible light transmittance was determined in accordance with ISO 9050 standard method. Specifically,transmission of light through the polymer film was integrated over the wavelength range of 400–700 nm.Total reflectance measurements were obtained in the solar spectrum from 300 to 2500 nm at an incidentangle of 15 degrees. The spectral data was integrated against Air Mass 1.5 global spectrum (ASTM E891)to yield weighted ordinates over the total spectral bandwidth. Five measurements were made of eachsample and the weight averaged values were reported.
4. Conclusions
Monoclinic VO2 particles, with and without doping were successfully prepared. The resultswere confirmed by XRD and DSC techniques. Thermo-chromic behaviors of the metal oxides weredemonstrated by the changes in FTIR absorbance as a function of temperature. After mixing the VO2(M)

Materials 2017, 10, 53 18 of 20
particles with EVA, thermo-chromic and heat reflectance behaviors of the composite materials still exist.The presence of VO2 (1 wt %) in EVA did not significantly affected physical and thermo-mechanicalproperties of the polymer films, regardless of the mixing processes used. On the other hand, type andconditions of the mixing processes strongly affected mechanical, thermal and optical properties of theEVA/VO2 films. The results summarized in Table 3 shows that tensile strength and modulus of theEVA based films prepared via the melt process was greater than those of which prepared by a solutionprocess. Better properties of the former system were obtained at the expense of its percentage lighttransmittance. For the sake of better optical and thermo-chromic properties of the EVA/VO2 films,dispersion of the metal oxide in the polymer matrix has yet to be further improved. The optimumconcentration of VO2 in the EVA based film also need to be investigated.
Acknowledgments: This work has been supported by the Nanotechnology Center (NANOTEC), NSTDA,Ministry of Science and Technology, Thailand, through its program of Center of Excellence Network. The authorsacknowledge the financial support provided by King Monkut’s University of Technology Thonburi through the“KMUTT 55th Anniversary Commemorative Fund”.
Author Contributions: In this study, the concepts and design for the experiment are planned byJatuphorn Wootthikanokkhan. Onruthai Srirodpai is responsible for the synthesis and characterizations ofVO2 whereas Kitti Yuwawech is in charge for the compounding, fabrication and testing of EVA/VO2 compositefilms. The results obtained including FTIR, XPS, TEM, DSC-TGA were discussed by Saiwan Nawalertpanya,Vissanu Meeyoo and Jatuphorn Wootthikanokkhan.
Conflicts of Interest: The authors declare no conflict of interest.
References
1. Pérez-Lombard, L.; Ortiz, J.; Pout, C. A review on buildings energy consumption information. Energy Build.2008, 40, 394–398. [CrossRef]
2. Miyazaki, H.; Kusumoto, N.; Sasaki, S.; Sakamoto, N.; Wakiya, N.; Suzuki, H. Thermochromic tungstendoped VO2-SiO2 nano-particle synthesized by chemical solution deposition technique. J. Ceram. Soc. Jpn.2009, 117, 970–972. [CrossRef]
3. Miyazaki, H.; Yoshida, K.; Sasaki, S.; Sakamoto, N.; Wakiya, N.; Suzuki, H.; Ota, T. Fabrication of transitiontemperature controlled W-doped VO2 nano particles by aqueous solution. J. Ceram. Soc. Jpn. 2011, 119,522–524. [CrossRef]
4. Wang, N.; Liu, S.; Zeng, X.T.; Magdassi, S.; Long, Y. Mg/W-codoped vanadium dioxide thin films withenhanced visible transmittance and low phase transition temperature. J. Mater. Chem. C 2015, 3, 6771–6777.[CrossRef]
5. Wang, S.; Liu, M.; Kong, L.; Long, Y.; Jiang, X. Recent progress in VO2 smart coatings: Strategies to improvethe thermochromics properties. Prog. Mater. Sci. 2016, 81, 1–54. [CrossRef]
6. Takahashi, I.; Hibino, M.; Kudo, T. Thermochromic properties of double-doped VO2 thin films prepared bya wet coating method using polyvanadate-based sols containing W and Mo or W and Ti. Jpn. J. Appl. Phys.2001, 40, 1391–1395. [CrossRef]
7. Burkhardt, W.; Christmann, T.; Meyer, B.K.; Niessner, W.; Schalch, D.; Scharmann, A. W- and F-doped VO2
films studied by photoelectron spectrometry. Thin Solid Films 1999, 345, 229–235. [CrossRef]8. Barreca, D.; Depero, L.E.; Franzato, E.; Rizzi, G.A.; Sangaletti, L.; Tondello, E.; Vettori, U. Vanadyl precursors
used to modify the properties of vanadium oxide thin films obtained by chemical vapor deposition.J. Electrochem. Soc. 1999, 146, 551–558. [CrossRef]
9. Guinneton, F.; Sauques, L.; Valmalette, J.C.; Cros, F.; Gavarri, J.R. Optimized infrared switching properties inthermochromic vanadium dioxide thin films: Role of deposition process and microstructure. Thin Solid Films2004, 446, 287–295. [CrossRef]
10. Kang, L.T.; Gao, Y.F.; Luo, H.J. A novel solution process for the synthesis of VO2 thin films with excellentthermochromic properties. ACS Appl. Mater. Interface 2009, 1, 2211–2218. [CrossRef] [PubMed]
11. Kalagi, S.S.; Dalavi, D.S.; Pawar, R.C.; Tarwal, N.L.; Mali, S.S.; Patil, P.S. Polymer assisted deposition ofelectrochromic tungsten oxide thin films. J. Alloys Compd. 2010, 493, 335–339. [CrossRef]
12. Peng, Z.; Jiang, W.; Liu, H. Synthesis and electrical properties of tungsten-doped vanadium dioxidenanopowders by thermolysis. J. Phys. Chem. C 2007, 111, 1119–1122. [CrossRef]

Materials 2017, 10, 53 19 of 20
13. Zhang, Y.; Zhang, J.; Zhang, X.; Deng, Y.; Zhong, Y.; Huang, C.; Liu, X.; Liu, X.; Mo, S. Influence of differentadditives on the synthesis of VO2 polymorphs. Ceram. Int. 2013, 39, 8363–8376. [CrossRef]
14. Zhou, J.; Gao, Y.; Liu, X.; Chen, Z.; Dai, L.; Cao, C.; Luo, H.; Kanahira, M.; Sun, C.; Yan, L. Mg-dopedVO2 nanoparticles: Hydrothermal synthesis, enhanced visible transmittance and decreased metal-insulatortransition temperature. Phys. Chem. Chem. Phys. 2013, 15, 7505–7511. [CrossRef] [PubMed]
15. Lv, W.; Huang, D.; Chen, Y.; Qiu, Q.; Luo, Z. Synthesis and characterization of Mo–W co-doped VO2(R)nano-powders by the microwave-assisted hydrothermal method. Ceram. Int. 2014, 40, 12661–12668.[CrossRef]
16. Popuri, S.R.; Miclau, M.; Artemenko, A.; Labrugere, C.; Villesuzanne, A.; Pollet, M. Rapid hydrothermalsynthesis of VO2(B) and its conversion to thermochromic VO2(M1). Inorg. Chem. 2013, 52, 4780–4785.[CrossRef] [PubMed]
17. Zhang, C.; Cheng, J.; Zhang, J.; Yang, X. Simple and facile synthesis W-doped VO2(M) powder based onhydrothermal Pathway. Int. J. Electrochem. 2015, 10, 6014–6019.
18. Chen, L.; Huang, C.; Xu, G.; Miao, L.; Shi, J.; Zhou, J.; Xiao, X. Synthesis of thermochromic W-Doped VO2
(M/R) nanopowders by a simple solution-based process. J. Nanomater. 2012, 2012. [CrossRef]19. Shi, J.; Zhou, S.; You, B.; Wu, L. Preparation and thermochromic property of tunsten-doped vanadium
dioxide particle. Sol. Energy Mater. Sol. Cells 2007, 91, 1856–1862. [CrossRef]20. Suzuki, H.; Yamaguchi, K.; Miyazaki, H. Fabrication of thermochromic composite using monodispersed
VO2 coated SiO2 nanoparticles prepared by modified chemical solution deposition. Compos. Sci. Technol.2007, 67, 3487–3490. [CrossRef]
21. Valmalette, J.C.; Gavarri, J.R. High efficiency thermochromic VO2(R) resulting from the irreversibletransformation of VO2(B). Mater. Sci. Eng. B 1998, 54, 168–173. [CrossRef]
22. Ji, S.; Zhang, F.; Jin, P. Preparation of high performance pure single phase VO2 nanopowder byhydrothermally reducing the V2O5 gel. Sol. Energy Mater. Sol. Cells 2011, 95, 3520–3526. [CrossRef]
23. Ji, S.; Zhao, Y.; Zhang, F.; Jin, P. Direct formation of single crystal VO2(R) nanorods by one-step hydrothermaltreatment. J. Cryst. Growth 2010, 312, 282–286. [CrossRef]
24. Zhang, Y.; Zhang, J.; Zhang, X.; Mo, S.; Wu, W.; Niu, F.; Zhong, Y.; Liu, X.; Huang, C.; Liu, X. Directpreparation and formation mechanism of belt-like doped VO2(M) with rectangular cross sections by one-stephydrothermal route and their phase transition and optical switching properties. J. Alloys Compd. 2013, 570,104–113. [CrossRef]
25. Cao, C.; Gao, Y.; Luo, H. Pure single-crystal rutile vanadium dioxide powders: Synthesis, mechanism andphase-transformation property. J. Phys. Chem. 2008, 112, 18810–18814. [CrossRef]
26. Zhang, S.; Shang, B.; Yang, J.; Yan, W.; Wei, S.; Xie, Y. From VO2(B) to VO2(A) nanobelts: First hydrothermaltransformation, spectroscopic study and first principles calculation. Phys. Chem. 2011, 13, 15873–15881.[CrossRef] [PubMed]
27. Xiao, X.; Zhang, H.; Chai, H.; Sun, Y.; Yang, T.; Cheng, H.; Chen, L.; Miao, L.; Xu, G. A cost-effective processto prepare VO2(M) powder and films with superior thermochromic properties. Mater. Res. Bull. 2014, 51,6–12. [CrossRef]
28. Whittaker, L.; Wu, T.; Patridge, J.; Sambandamurthy, G.; Banerjee, S. Distinctive finite size effects on thephase diagram and metal–insulator transitions of tungsten-doped vanadium (IV) oxide. J. Mater. Chem. 2011,21, 5580–5592. [CrossRef]
29. Suchorski, Y.; Rihko-Struckmann, L.; Klose, F.; Ye, Y.; Alandjiyska, M.; Sundmacher, K.; Weiss, H. Evolutionof oxidation states in vanadium-based catalysts under conventional XPS conditions. Appl. Surf. Sci. 2005,249, 231–237. [CrossRef]
30. Zhang, J.M.; Zhang, Y.; Xu, K.W.; Ji, V. General compliance transformation relation and applications foranisotropic cubic metals. Mater. Lett. 2008, 62, 1328–1332. [CrossRef]
31. Popuri, S.R.; Artemenko, A.; Labrugere, C.; Miclau, M.; Villesuzanne, A.; Pollet, M. VO2(A): Reinvestigationof crystal structure, phase transition and crystal growth mechanisms. J. Solid State Chem. 2014, 213, 79–86.[CrossRef]
32. Oka, Y.; Ohtani, T.; Yamamoto, N.; Takada, T. Phase Transition and Electrical Properties of VO2 (A).Nippon Seramikkusu Kyokai Gakujutsu Ronbunshi 1989, 97, 1134–1137. [CrossRef]
33. Li, M.; Kong, F.; Li, L.; Zhang, Y.; Chen, L.; Yan, W.; Li, G. Synthesis, field-emission and electric properties ofmetastable phase VO2(A) ultra-long nanobelts. Dalton Trans. 2011, 40, 10961–10965. [CrossRef] [PubMed]
Materials 2017, 10, 53 20 of 20
34. Liu, C.; Cao, X.; Kamyshny, A.; Law, J.W.; Magdassi, S.; Long, Y. VO2/Si–Al gel nanocompositethermochromic smart foils: Largely enhanced luminous transmittance and solar modulation. J. ColloidInterface Sci. 2014, 427, 49–53. [CrossRef] [PubMed]
35. Zhou, Y.; Cai, Y.; Hu, X.; Long, Y. VO2/hydrogel hybrid nanothermochromic material with ultra-high solarmodulation and luminous transmission. J. Mater. Chem. A 2015, 3, 1121–1126. [CrossRef]
36. Brandrup, J.; Immergut, E.H.; Grulke, E.A. Polymer Handbook; Wiley-Interscience: New York, NY, USA, 1989.
© 2017 by the authors; licensee MDPI, Basel, Switzerland. This article is an open accessarticle distributed under the terms and conditions of the Creative Commons Attribution(CC-BY) license (http://creativecommons.org/licenses/by/4.0/).