preparation and characterization of fe-doped tio powders ... 15 03.pdf · light response and...
TRANSCRIPT

21
Processing and Application of Ceramics 6 [1] (2012) 21–36
Preparation and characterization of Fe-doped TiO2 powders for solar light response and photocatalytic applicationsIbram Ganesh*, Polkampally P. Kumar, Abhishek K. Gupta, Panakati S.C. Sekhar, Kalathur Radha, Gadhe Padmanabham, Govindan SundararajanLaboratory for Photoelectrochemical (PEC) Cells and Advanced Ceramics, International Advanced Research Centre for Powder Metallurgy and New Materials (ARCI), Balapur PO, Hyderabad-500005, A.P., IndiaReceived 22 October 2011; received in revised form 30 December 2011; accepted 7 February 2012
AbstractDifferent amounts of Fe-doped TiO2 (with 0.1 to 10 wt.% Fe) powders were prepared at temperatures in the range of 400 and 800 °C following a conventional co-precipitation technique and were thoroughly charac-terized by means of X-ray diffraction (XRD), Fourier-transform infrared (FT-IR), Fourier-transform Raman (FT-Raman), diffuse reflectance spectroscopy (DRS), BET surface area, zeta potential and flat band potential measurements. Photocatalytic ability of Fe-doped TiO2 powders was evaluated by means of methylene blue (MB) degradation experiments conducted under the irradiation of simulated solar light. Characterization re-sults suggested that as a dopant Fe stabilized TiO2 in the form of anatase phase, reduced its band gap energy and adjusted its flat band potentials in such a way that these powders can be employed for photoelectrolysis of water into hydrogen and oxygen in photoelectrochemical (PEC) cells. The 0.1 wt.% Fe-doped TiO2 exhibited highest activity in the photocatalytic degradation of MB. The kinetic studies revealed that the MB degradation reaction follows the Langmuir-Hinshelwood first order reaction rate.
Keywords: titania, doping, photocatalysis, band gap energy, semiconductor
I. IntroductionRecently, the photoelectrochemical (PEC) con-
version of CO2 to methanol and the photo-electroly-sis of water into hydrogen and oxygen have received a great deal of attention from the scientific communi-ty as these two reactions can indeed harvest solar en-ergy in the form of chemical energy [1–5]. These reac-tions are popularly called as artificial photosynthesis reactions, which require thermodynamic energy inputs of 1.5 and 1.23 eV, respectively [4–9]. Greater energy inputs are required to make up for losses due to band bending (necessary in order to separate charge at the semiconductor surface), resistance losses, and over-voltage potentials. The most frequently studied mate-rial for photoelectrode is TiO2 [6,7]. Despite its high band gap energy of 3 eV, TiO2 is the most preferred photo-electrode owing to its high photo-corrosion re-
sistance in aqueous media, chemical stability, low cost and non-toxicity. Given its indirect band gap transi-tion, the anatase in comparison to rutile and brookite phases of TiO2 is the most preferred phase for photo-electrode applications. The maximum value obtained for the photovoltage of a PEC cell equipped with a TiO2 photoanode is ~0.7–0.9 eV [10]. This implies that the PEC cell containing TiO2 based single photoelec-trode requires some amount of an external bias volt-age to perform water oxidation reaction [1–10]. It is known that as long as external bias voltage or ener-gy that is generated from fossil fuels is involved the artificial photosynthesis process performed in a PEC cell cannot be declared successful [11,12]. However, for the first time, Nozik [11,12] successfully photoox-idized water into hydrogen and oxygen by utilizing si-multaneously n-type TiO2 as photoanode and p-GaP as photocathode without employing any external bias voltage in a PEC cell. Although Nozik’s process was not successful commercially as p-GaP undergoes pho-tocorrosion in aqueous based PEC cells, it demonstrat-
* Corresponding author: tel: +91 40 24442699,e-mail: [email protected]

22
I. Ganesh et al. / Processing and Application of Ceramics 6 [1] (2012) 21–36
ed that given a stable p-type semi-conducting material with suitable band gap energy and band edges (i.e., flat band potentials), the water oxidation reaction (i.e., the energy consuming, endothermic, uphill and light re-action of natural photosynthesis) can be performed in a PEC cell without the need of any external bias volt-age [11,12]. Since, TiO2 is an excellent photoelectrode material with band edges suitable for water oxidation reaction, several efforts were made to convert n-type semi-conducting behaviour of TiO2 into p-type, and also to reduce its band gap energy and the recombina-tion of its photogenerated electron-hole pairs so that it can absorb a larger portion of sunlight that reaches the surface of the earth [4,8,13–23]. Thus, synthesis of p-type semi-conducting TiO2 is of great importance from the point of view of artificial photosynthesis.
The p-type semi-conducting behaviour has been observed for TiO2 that was doped with certain metal ions such as, Fe3+, Co3+, Ni2+, Cu+, etc. [4,8,13–23]. The change in the nature of semi-conducting behaviour of TiO2 has been attributed to the hetero-unions formed between n-type TiO2 and p-type doped metal oxide [4,8,13–23]. Among the various p-type semi-conduct-ing materials, the Fe2O3 has been identified as a prom-ising one as it possesses a considerably low band gap energy (Ebg = 2.2 eV) and the ionic radius of Fe3+ (0.64 Å) is quite comparable to that of Ti4+ (0.68 Å). Howev-er, Fe2O3 was found to be more prone to photocorrosion and the lifetime of its photogenerated minority carriers was found to be quite short [24]. In order to bring to-gether the beneficial properties of Fe2O3 and TiO2, the composites of these two semi-conducting oxides were prepared [16–23] and employed for photoassisted re-duction of dinitrogen to ammonia, and the photoas-sisted degradation of waste materials in environment treatment [25,26]. The increase of Fe concentration from 0.2 to 0.5% in TiO2 has resulted in the increased photocatalytic activity of the latter material prepared at 500 °C. However, when Fe content and calcination temperatures were further increased, the photocatalyt-ic activity was found to decrease. This decrease was at-tributed to the limited solubility of Fe in TiO2 (anatase or rutile), which is less than 1 wt.%. Furthermore, the hematite (α-Fe2O3) or pseudobrookite (Fe2TiO5) phas-es formed upon doping of >1 wt.% Fe were found to be responsible for the transfer of photogenerated charge carriers from TiO2 to Fe2O3 (or Fe2TiO5) that result-ed in the decreased photocatalytic activity [16–23]. In 1995, Tsodikov et al. [21] reported the formation of solid solutions of Fex(Ti)1−0.75xO2-δ; 0.01<x<0.14. In an-other study, Wang, et al. [22] prepared Fe-doped TiO2 (with 0.5 to 20 wt.% Fe) nanoparticles under differ-ent pH conditions following a hydrothermal method and found several differences in the structure and mor-phology of the resultant powders. At pH 1.8, anatase, brookite and trace of hematite together with a non-uni-
formly distributed Fe in the powder particles were not-ed upon doping with 0.5 wt.% Fe. This non-uniformi-ty was attributed to the differences in the hydrolysing pH conditions of Fe and Ti precursors involved. Fur-ther, Fe was not detected in smaller particles as it could have been entered into the solid solutions of Fe-Ti ox-ides besides forming α-Fe2O3 particles. At pH 3.6, the phases of products were similar to those formed at pH 1.8, but the Fe distribution was slightly different from the previous one. In the samples prepared at pH 1.8, Fe was not detected in smaller particles, while in the sam-ples prepared at pH 3.6, a plenty of Fe was detected, in-dicating that the distribution of Fe was more uniform at pH=3.6 conditions. At pH=6.0, the results showed only anatase phase for those powders doped with 20 wt.% Fe and a uniform solid solution of Fe-Ti oxides. The measurement of photocurrent at different electrode po-tentials showed the phenomena of p-n photoresponse coexistence. For higher contents of Fe doped samples, the smaller was the photocurrent, and the more posi-tive was the conversion potential for samples prepared at pH=6.0. On the other hand, at higher pH, the larg-er was the photocurrent and the more positive was the conversion potential for powders containing the same amount of Fe. Yet in another study, Ranjit and Viswa-nathan [27] prepared Fe (0.11 to 1.76 wt.%) doped TiO2 powders at 550 °C for 24 h following a conven-tional co-precipitation and the sol-gel technique. The anatase to rutile phase transformation was found to be dependant on the nature of the precursor involved. Sol-gel-derived Fe-doped TiO2 catalysts showed the pres-ence of rutile and pseudobrookite phases, whereas, the coprecipitated catalysts showed only the anatase phase. The role of the dopant ion was primarily to improve the charge separation of the photoproduced electron-hole pairs via a permanent electric field. The photocat-alytic activity of the Fe-doped TiO2 catalysts has been explained in terms of the heterojunction formed be-tween the Fe/TiO2 and α-Fe2O3 phases for the sol-gel-derived catalyst. An increase in dopant ion content was found to favour the electron-hole separation and there-fore the photoactivity. However, beyond a certain lev-el, the space charge layer became thicker, and the prob-ability of carrier recombination increased. Thus, there is an optimal value at which the photoactivity reaches a maximum.
In some other studies, the structural and electrical properties of Fe-doped TiO2 thin films have also been studied [16–22]. In a study, Ballyy et al. [23] prepared different amounts of Fe-doped TiO2 thin films under identical conditions. Doping of Fe has induced a struc-tural transformation from anatase at low Fe concen-tration to rutile for the concentrations of >0.32 at.% Fe. The electrical and thermoelectric power measure-ments indicated that the electrical conduction changed from n-type conduction for undoped TiO2 to p-type
23
I. Ganesh et al. / Processing and Application of Ceramics 6 [1] (2012) 21–36
conduction for heavily doped TiO2, and demonstrated that Fe atoms behaved as an acceptor impurities. Even at high Fe concentration, thin films remained transpar-ent. The highest p-type conductivity reached at room temperature was about 10−6 S/m [23]. The dispersion of the permittivity with frequency indicated that the electrical conduction of the thin films was inhomoge-neous. The influence of the Fe atom was found to de-pend on the crystal structure of the oxide. It was also found that the introduction of Fe generated more oxy-gen vacancies in anatase than in rutile. A large fraction of the acceptors created by the Fe atoms were found to be compensated by the oxygen vacancies created by the same Fe atoms. In addition to these, it was also found that pure rutile and Fe-doped TiO2 had higher p-type conductivity than mixed, anatase/rutile TiO2 thin films doped with Fe. Yet in another study, Singh et. al. [28] prepared nanostructured Fe-doped TiO2 thin films by sol-gel spin coating method for photoelectrochem-ical studies. XRD study showed that the films were polycrystalline with the photoactive anatase phase of TiO2. Doping of Fe in TiO2 resulted in a shift of ab-sorption edge towards the visible region of solar spec-trum. The observed band gap energy decreased from 3.3 to 2.89 eV on increasing the Fe doping concentra-tion from 0 to 0.2 at.%. The 0.2 at.% Fe-doped TiO2 exhibited the highest photocurrent density of about 0.92 mA/cm2 at zero external bias. Flat band potential and donor density determined from the Mott–Schott-ky plots were found to vary with doping concentration from −0.54 to −0.92 V/SCE and 1.7 × 10¹⁹ to 4.3 × 1019 cm−3, respectively. Although, many published articles deal with Fe-doped TiO2 materials, there is contradict-ing information as far as the effect of Fe-doping on photo-current and photo-catalytic behaviour of TiO2 is concerned [16–23]. Further, the information on photo-current and flat band potential properties of Fe-doped TiO2 materials is not sufficiently reported. Further-more, the structure-property-performance correlation of Fe-doped TiO2 powders is hardly presented and dis-cussed in the literature and the information pertaining to degradation of methylene blue (MB) over Fe-doped TiO2 powders under the irradiation of the light that is equivalent to the solar light reaching the surface of the earth is not available.
In view of the above, different amounts of Fe-doped TiO2 powders were prepared following a con-ventional co-precipitation method, calcined in air and were characterized following various techniques such as, XRD, SEM, EDAX, FT-IR, FT-Raman, DRS, BET surface area, zeta potential, flat band potential, pho-tocatalytic activity, band gap energy value measure-ments, etc., and thus obtained results are presented and discussed in this paper to reveal the effects of Fe-dop-ing on solar light induced response and photocatalytic behaviour of TiO2.
II. Experimental
2.1 Synthesis of Fe-doped TiO2 powdersDifferent amounts of Fe-doped TiO2 (with 0,
0.1, 0.2, 0.3, 0.4, 0.5, 0.6, 0.7, 0.8, 0.9, 1, 2, 3, 4, 5, 6, 7, 8, 9 and 10 wt.% Fe) powders were prepared by following a conventional co-precipitation technique using ammonium hydroxide as an hydrolyzing agent [29,30]. The concentration of Fe in the prepared powders is expressed in terms of atomic weight percent in throughout this paper unless otherwise mentioned. In a typical experiment, cold titanium tetrachloride (TiCl4, Fluka, AR grade) was first digested in cold concentrated HCl (AR Grade, Loba Chemie, Mumbai, India) and was subsequently diluted with deionized water. To this solution, the requisite amount of iron nitrate (Fe(NO3)2×6H2O, AR Grade, Loba Chemie, Mumbai, India) was added after dissolving separately in deionized water. The resultant solution was hydrolyzed by adding the 50% diluted solution of ammonium hydroxide drop by drop until the complete precipitate (at pH≈9) was obtained. This precipitate was heated for about 12 h at 90 °C to facilitate the aging process. The resultant precipitate was filtered off and washed thoroughly with doubly distilled water until no chloride ions could be detected with Ag+ ions in the filtrate. Thus obtained Fe(OH)3–Ti(OH)4 coprecipitate was then oven dried at 120 °C for 24 h and calcined at 550 °C for 6 h in an open-air atmosphere using an electrical muffle furnace. Some portions of the dried precipitates were also separately calcined at 400, 500, 600, 700 and 800 °C for 6 h in order to evaluate the thermal stability of these powders.2.2 Photocatalytic activity evaluation
The photocatalytic activity of Fe-doped TiO2 pow-ders was evaluated by performing methylene blue (MB) (Loba-Chemie, Mumbai, India) degradation ex-periments under the irradiation of a simulated solar light. In a typical experiment, about 200 mL of 0.01, 0.02 or 0.03 mM aqueous MB solution and 0.24 g fine powder catalyst were taken in a glass dish of 150 mm diameter × 75 mm height (Borosil, India) and was ex-posed to simulated solar light (Osram 1000 W Xenon short arc display/optic lamp, XBO, Germany, installed in a light-condensing lamp housing, Model No.: SS-1K, Sciencetech Inc., Canada) for different time inter-vals (up to 4 h). Before irradiation the incident light was passed through an AM1.5G air-mass filter so that the intensity of the incident light measured about 44.42 mW/cm2 [31]. The reaction mixture solution was initially stirred for about 2 h in the dark in order to reach the adsorption equilibrium. During light irradia-tion, the reaction mixture was continuously stirred us-ing a magnetic stirrer (Model: 5MLH, Remi, Mum-bai, India) and aliquots of the reaction mixtures were collected at regular time intervals to monitor the re-
24
I. Ganesh et al. / Processing and Application of Ceramics 6 [1] (2012) 21–36
action progress. The leftover MB concentration in the reaction mixtures was estimated with the help of UV-Vis spectrophotometer (Lambda 650, Perkin Elmer, Massachusetts, USA). The maximum absorption peak (λmax) of MB at about 666 nm was considered to esti-mate the remaining concentration of MB [31].2.3 Flat band potential measurement
The electron energy states of quasi-Fermi levels (nEF*) of Fe-doped TiO2 (with 0.1, 0.5, 1, 5, and 10 wt.% Fe) powders were measured using methylviolo-gen dichloride (MV2+, Ered = –0.445 V vs. normal hy-drogen electrode, NHE) as a pH-independent redox system [32,33]. The estimated pH0 values were con-verted to the Fermi potentials (i.e., flat band poten-tials) at pH=7 by the equation *EF(pH=7) = –0.445 + 0.059·(pH0 – 7). Reproducibility of the pH0 values was better than 0.1 pH units. In a typical experiment, 30 mg of catalyst powder and 6 mg of MV2+ were sus-pended in a specially designed glass reactor cell hav-ing a flat quartz window (~75 mL of 0.1 M KNO3). A platinum flag of 1 cm2 area and Ag/AgCl were served as working and reference electrodes, respectively, and a pH meter was used for recording the proton con-centration. Prior to measurements, the solutions were purged with argon gas (>200 mL/min) for >2 h and continued the same during voltage measurements. Ini-tially, the pH of the solution was adjusted to pH=1–2 prior to recording the voltage readings using a solu-tion of HNO3 (0.1 M). The light source was a Xenon arc lamp of 500 W (Solar Simulator, Oriel 91160) hav-ing AM 1.5G filter and a monochromator (Newport-74125 model) with a bandwidth of 5 nm. Stable photo-voltages were recorded after about 30 min of changing the pH value using a multi-meter (Agilent, Singapore) [32,33]. All the potentials presented here are against NHE reference.2.4 Characterization
A Gemini Micromeritics analyzer (Micromeritics, Norcross, USA) was used for Brunauer-Emmett-Tell-er (BET) surface area measurements. The BET surface area was measured by nitrogen physisorption at liquid nitrogen temperature (–196 °C) by considering 0.162 nm2 as the area of cross section of N2 molecule. Prior to measurements, the samples were evacuated (up to 1×10⁻³ Torr) at 180 °C for 2 h. Phase analysis, crys-tallite size and lattice parameter values of the pow-ders were determined by X-ray diffraction (Bruker’s D8 advance system, Bruker’s AXS, GmbH, Germa-ny) using Cu Kα radiation source. To obtain quanti-tative information of phases, the most intense peak of the individual phase was taken into consideration. The peak heights of all the phases were summed up and the percentage concentration of a particular phase was estimated from the ratio of the strongest peak of that phase to the sum of various phases present in a sys-
tem [34,35]. The crystallite sizes of the powders were estimated with the help of Debye-Scherrer equation (<L>hkl = K·λ/βhkl cosθ; where K is a constant taken as 1 and β is the integral breadth that depends on the width of the particular hkl plane; λ = 1.5406 Å, the wave-length of the Cu Kα source; and θ is the Bragg’s an-gle) using the XRD data of the strongest reflection of the major phase [34,35]. The lattice parameter values were determined using equation 1/d(hkl)
2 = (h2+k2)/a2 + l2/c2 (where the value of d(hkl), for an XRD peak, was determined from Bragg’s law, 2d(hkl)·sinθ = n·λ). Here, hkl is the crystal plane indices, d(hkl) is the distance be-tween crystal planes of (hkl), and a, c are the lattice parameters (for tetragonal anatase and rutile phases of TiO2: a = b ≠ c). The planes, (101) and (200) for anatase (ICDD File No.: 03-065-5714), and the (110) and (211) for rutile (ICDD File No.: 03-065-1118) were considered while calculating the lattice param-eters values. The content ratio of the anatase to rutile phase in titanium dioxide was roughly estimated using the following equations [36,37]:
CA = 100 / (1 + 1.265 IA/IR) (1)
CR = 1−100 / (1 + 1.265 IA/IR) (2)
where CA is content ratio of anatase (%) and CR content ratio of rutile (%).
The micrographs of the powders were exam-ined using a scanning electron microscope (JSM–5410, JEOL, Japan) with an energy dispersive scan-ning (Sigma 3.42 Quaser, Kevex, USA) attachment for qualitative and quantitative micro analysis. The FT-IR spectra were recorded on an FT-IR 1650 Perkin–El-mer Spectrometer (4000–200 cm–1) using KBr pel-lets. The FT-Raman spectra were recorded on a triple subtractive Jobin Yvon T64000 Raman spectrometer equipped with a liquid-nitrogen-cooled charge-cou-pled device (CCD) detector. Diffuse reflectance spec-tra (DRS) of the powders were recorded on a Shimad-zu UVPC 3101 spectrophotometer equipped with an integration sphere. The powder samples were direct-ly placed into a cylindrical sample port holder (3 cm diameter, 1 mm deep). The zeta-potentials of powders in 10–3 M KCl aqueous solutions were measured on a Zeta meter (Zeta Meter Inc., USA). The band gap energies of Fe-doped TiO2 powders were calculated using the absorbance data obtained from DRS study following the Tauc’s relation [(α·h·ν) = C(h·ν – Eg)
n], where C is a constant, α is absorption coefficient, Eg is the average band gap of the material and n depends on type of transition (2 for indirect band gap and ½ for di-rect band gap), h is the Plank’s constant (6.626 × 10⁻³⁴ J·s), v is the frequency of photons [38,39]. The direct and indirect average band gap transition energies were estimated from the intercepts of linear portion of the (α·h·ν)2 or (α·h·ν)1/2 vs. h·ν of plots, respectively.

25
I. Ganesh et al. / Processing and Application of Ceramics 6 [1] (2012) 21–36
III. Results and discussionX-ray diffraction patterns of the Fe-doped TiO2
(with 0 to 0.9, and 1 to 10 wt.% Fe) powders formed at 550 °C for 6 h are presented in Fig. 1. For sake of an easy interpretation, the XRD patterns reported in ICDD files for anatase TiO2 (ICDD File No.: 03-065-5714) and rutile TiO2 (ICDD File No.: 03-065-1118) are also presented in these figures. It can be seen that, in general, all the powders are well crystalline materials. The pure un-doped TiO2 is in the form of rutile and all the Fe-doped TiO2 powders are mainly in anatase phase togeth-er with some minor phases including α-Fe2O3, TiFeO3, and Fex(Ti)1−0.75xO2−δ; 0.01<x<0.14 [16–22]. Even 0.1 wt.% Fe-doping was sufficient to completely transform TiO2 from rutile to anatase phase. Anatase is the only phase in the powders doped with Fe up to a concen-tration of 3.0 wt.%, and in the case of powders doped with 4 to 10 wt.%, in addition to anatase phase, the ap-pearance of some minor XRD lines belong to hema-tite (α-Fe2O3) (2θ =28.585o), (006) plane and ilmenite, TiFeO3 (2θ =32.529o), (003) plane are also seen [16]. The intensity of lines belonging to hematite is higher than that of ilmenite phase. The intensity of a XRD peak at 2θ =32.529o belong to TiFeO3 was neither increased nor decreased linearly with the increasing concentra-tion of Fe in TiO2. The reason for this anomalous be-haviour is yet to be fully understood. Even the 10 wt.% Fe doping could not transform TiO2 completely from anatase to rutile phase even though the excess doped Fe
was converted into small amounts of hematite and il-menite phases. However, these results are contradicting with one reported by Ballyy et al. [23]. In their study, even 0.32 wt.% Fe doping caused the transformation of TiO2 from anatase to rutile phase in thin films. In an-other study, Ranjit and Viswanathan [27] noted the for-mation of rutile and pseudobrookite titania phases upon doping 0.11 to 1.76 wt.% Fe in TiO2 formed by a sol-gel route. However, they have noted only anatase phase for the same amounts of Fe-doped TiO2 powders formed in a conventional co-precipitation method. The differ-ent preparation methods and conditions adopted could be the reasons for observing such contradicting phase transformation results.
Figure 2 depicts the XRD patterns of the 5 wt.% Fe-doped TiO2 powders formed at different temperatures ranging from 400 to 800 °C for 6 h. The powders formed at 400 and 500 °C are in the form of poorly crystalline anatase phase, whereas, the one formed at 600 °C is in a highly crystalline anatase phase. The powder formed at the latter temperature also contains some small amounts of hematite in addition to anatase phase. On further in-crease of calcination temperature to 700 °C, some amount of anatase phase was transformed into rutile phase. Af-ter calcination at 800 °C, about 95% of the powder was transformed into rutile phase. It is interesting to see that the powder formed at 800 °C does not contain any free hematite indicating that Fe could have been entered com-pletely into TiO2 crystal structure leading to the forma-
Figure 1. XRD patterns of Fe-doped TiO2 powders (with 0 to 0.9 wt.% Fe (a), and 1 to 10 wt.% Fe (b)) formed at 550 °C for6 h (rutile TiO2: ICDD File No.: 03-065-1118; anatase TiO2: ICDD File No.: 03-065-5714)
a) b)

26
I. Ganesh et al. / Processing and Application of Ceramics 6 [1] (2012) 21–36
tion of a solid-solution of Fe3+ in TiO2 or it was highly dispersed as iron oxide on the surface of TiO2. The al-most similar ionic radius of Fe3+ (0.64 Å) to that of Ti4+ (0.68 Å) could be the reason for stabilizing TiO2 in the form of anatase phase by replacing some portion of Ti4+ ions in TiO2 lattice by Fe3+ [4,8,13−23]. Tsodikov et al. [21] also observed the formation of similar solid solu-tions of Fex(Ti)1−0.75xO2−δ; 0.01<x<0.14.
The thermogravimetry (TG) and differential scan-ning calorimetry (DSC) profiles of Fe(OH)3−Ti(OH)4 formed from the precursor mixtures of 0, 0.5, 1, 5 and
10 wt.% Fe-doped TiO2 powders are presented in Fig. 3. A close look into these profiles reveals that all the weight losses occurred are associated with their corre-sponding thermal (exothermic or endothermic) events. From ambient to 400 °C there are two major weight losses with corresponding thermal events, which are at-tributed to the loss of physically adsorbed moisture and conversion of hydroxides into amorphous oxides, re-spectively. After 400 °C none of the materials under-went > 5% weight loss. Furthermore, with the increase of Fe-content in TiO2, there is a gradual increase in the weight loss and in the corresponding endothermic na-ture below 400 °C. These events suggest that Fe-doping causes the increased absorption/adsorption of moisture by TiO2 powders. Furthermore, these results unequivo-cally suggest that all the iron-doped TiO2 powders are thermally quite stable between 400 and 1000 °C.
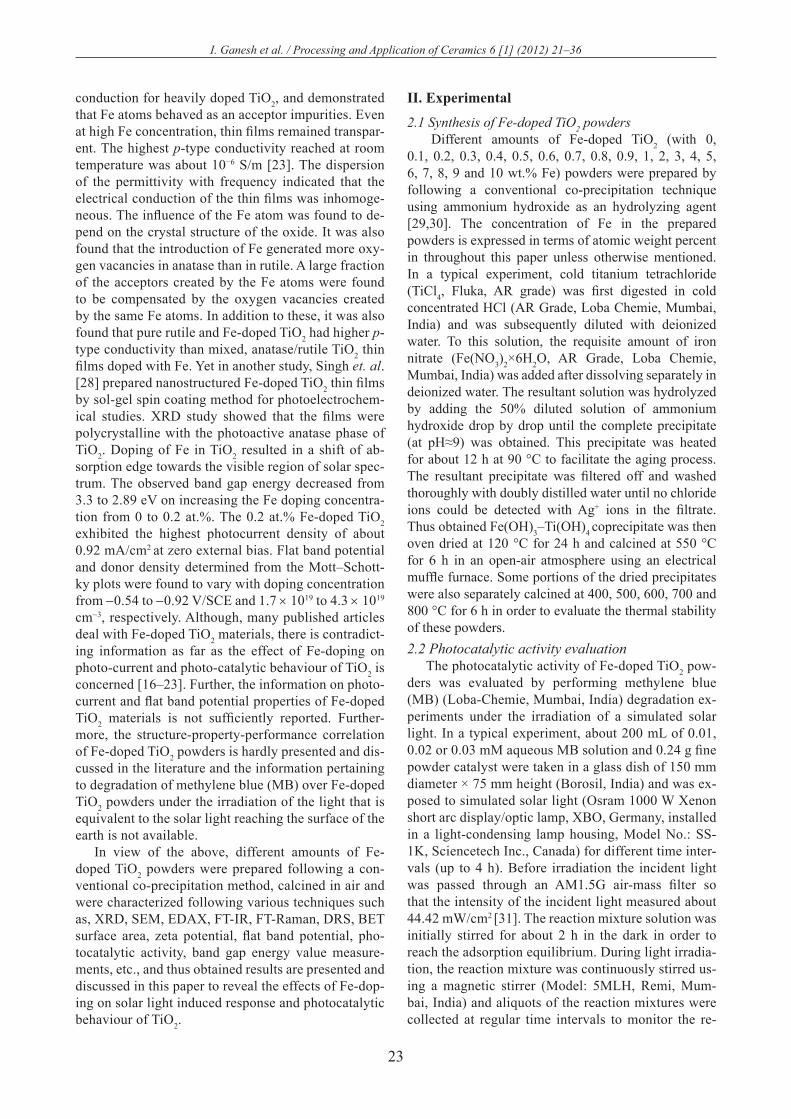
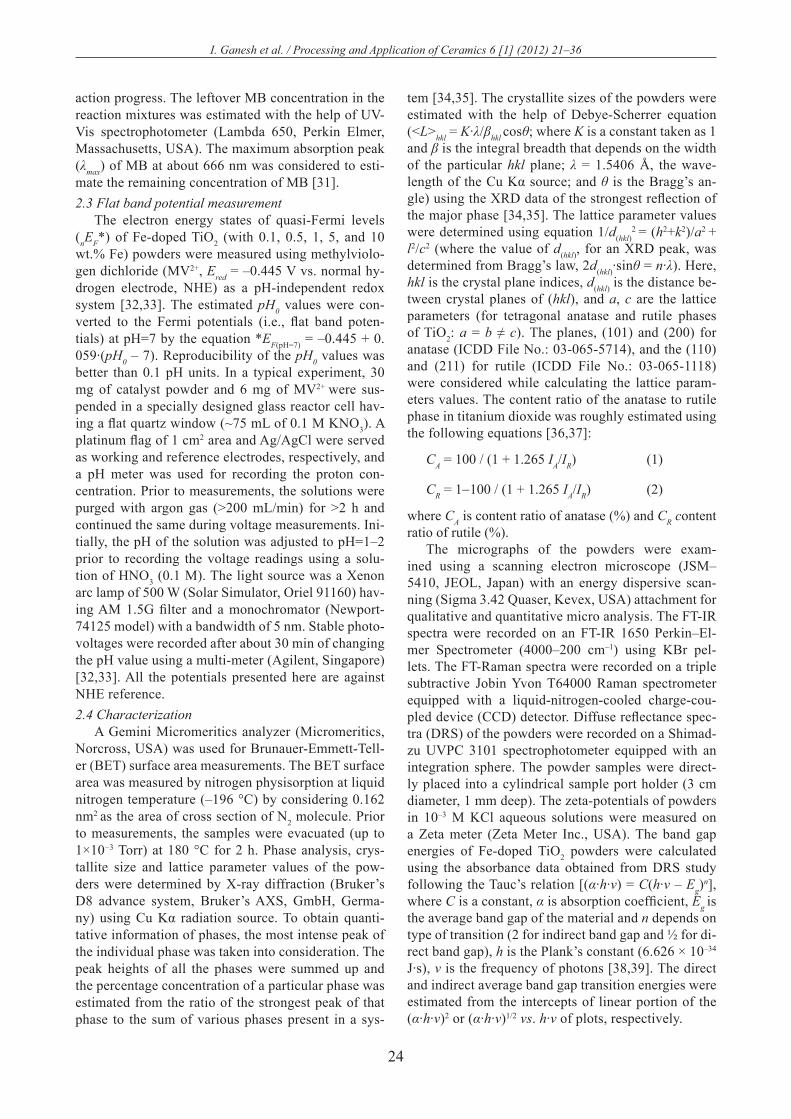
The values of BET surface area, crystallite size and lattice parameters of the Fe-doped TiO2 (with 0, 0.1, 0.5, 1, 5, and 10 wt.% Fe) powders formed at 550 °C for 6 h are presented in Table 1. The average crystallite size and surface area of the undoped rutile TiO2 powder are 17.82 nm and 23.25 m2/g, respectively. Upon dop-ing with 0.1 wt.% Fe the crystallite size value decreased to 15.87 nm and the surface area increased to 65.92 m2/g. When dopant concentration was further increased gradually from 0.1 to 10 wt.%, both crystallite size and BET surface area values are gradually decreased reach-ing the values of 13.24 nm and 48.82 m2/g, respective-ly, for the 10 wt.% Fe-doped TiO2. The decrease of crys-tallite size with the increase of Fe concentration in TiO2 is quite expected as the ionic radius of Fe (0.64 Å) is relatively smaller than that of Ti (0.68 Å). On the oth-er hand, the decrease of BET surface area with the in-crease of Fe in TiO2 could be attributed to the increased particle size (i.e. agglomeration) of the powder. The in-crease of agglomeration with the increase of Fe in TiO2 could be attributed to many reasons including the rela-
Figure 2. XRD patterns of 5 wt.% Fe-doped TiO2 powder formed at 400 to 800 °C for 6 h (rutile TiO2: ICDD File No.:
03-065-1118; anatase TiO2: ICDD File No.: 03-065-5714)
Figure 3. The profiles of: a) thermogravimetry, TG and b) differential scanning calorimetry, DSC, of hydroxides formed out from precursor mixtures of 0, 0.5, 1, 5 and 10 wt.% Fe-doped TiO2 powders
a) b)
27
I. Ganesh et al. / Processing and Application of Ceramics 6 [1] (2012) 21–36
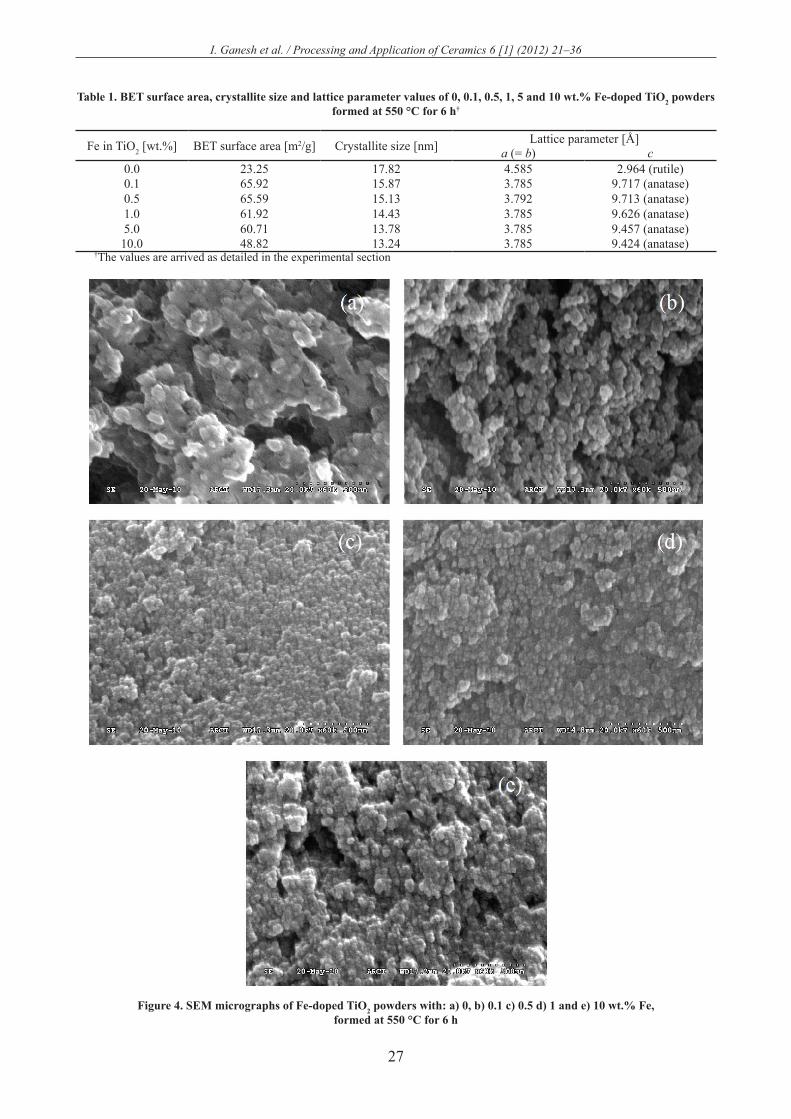
Figure 4. SEM micrographs of Fe-doped TiO2 powders with: a) 0, b) 0.1 c) 0.5 d) 1 and e) 10 wt.% Fe, formed at 550 °C for 6 h
Table 1. BET surface area, crystallite size and lattice parameter values of 0, 0.1, 0.5, 1, 5 and 10 wt.% Fe-doped TiO2 powders formed at 550 °C for 6 h†
Fe in TiO2 [wt.%] BET surface area [m2/g] Crystallite size [nm] Lattice parameter [Å]a (= b) c
0.0 23.25 17.82 4.585 2.964 (rutile)0.1 65.92 15.87 3.785 9.717 (anatase)0.5 65.59 15.13 3.792 9.713 (anatase)1.0 61.92 14.43 3.785 9.626 (anatase)5.0 60.71 13.78 3.785 9.457 (anatase)
10.0 48.82 13.24 3.785 9.424 (anatase)†The values are arrived as detailed in the experimental section
I. Ganesh et al. / Processing and Application of Ceramics 6 [1] (2012) xxx–xxx
xx
Table 1. BET surface area, crystallite size and lattice parameter values of 0, 0.1, 0.5, 1, 5 and 10 wt.% Fe-doped TiO2 powders formed at 550 °C for 6 h†
Lattice parameter [Å] Fe in TiO2
[wt. %] BET surface area
[m2/g] Crystallite size [nm] a (= b) c 0.0 23.25 17.82 4.585 2.964 (rutile) 0.1 65.92 15.87 3.785 9.717 (anatase) 0.5 65.59 15.13 3.792 9.713 (anatase) 1.0 61.92 14.43 3.785 9.626 (anatase) 5.0 60.71 13.78 3.785 9.457 (anatase)
10.0 48.82 13.24 3.785 9.424 (anatase) †The values are arrived as detailed in the experimental section
Figure 4. SEM micrographs of Fe-doped TiO2 powders with: a) 0, b) 0.1 c) 0.5 d) 1 and e) 10 wt.% Fe, formed at 550 °C for 6 h

28
I. Ganesh et al. / Processing and Application of Ceramics 6 [1] (2012) 21–36
tively lower melting point of Fe2O3 (1566 °C) than that of TiO2 (1843 °C). The a and c lattice constant values estimated for undoped TiO2 are 4.585 Å and 2.964 Å, respectively, whereas those estimated for anatase pow-ders (i.e. for TiO2 powders doped with 0.1, 0.5, 1, 5 and 10 wt.% Fe) are not varied much with the increase of Fe dopant concentration in TiO2. The value noted for a pa-rameter is 3.785 Å for all the powders, whereas, the c parameter value changed from 9.717 to 9.424 Å when iron concentration was increased from 0.1 to 10 wt.%. These lattice parameter values suggest that Fe-doping causes the decrease of TiO2 crystallite size along c-ax-is as the ionic radii of Fe (0.64 Å) is relatively smaller than that of Ti (0.68 Å). Nevertheless, these estimated lattice parameter values are well comparable with those reported for rutile TiO2 (ICDD File No.: 03-065-1118),
anatase TiO2 (ICDD File No.: 03-065-5714), and Fe-doped TiO2 powders [4,8,13−23].
The SEM micrographs of the Fe-doped TiO2 (with 0, 0.1, 0.5, 1 and 10 wt.% Fe) powders formed at 550 °C for 6 h are presented in Fig. 4. It can be seen that the morphology of the undoped TiO2 powder is complete-ly different from those of Fe-doped TiO2 powders. In general, all the Fe-doped TiO2 powders consist of nano-sized primary particles with spherical shape in agglom-erated powder particles, whereas, the pure TiO2 pow-der consists of relatively larger (micron size) chunks of powder particles. The primary particles of the 0.1 and 0.5 wt.% Fe-doped TiO2 powders are finer (~50 nm) than those estimated for the 1 and 10 wt.% Fe-doped TiO2 powders. The pure undoped TiO2 powder consists of 1−3 µm sized agglomerates with almost fused prima-ry particles of about 200 to 500 nm size. A close look into these powders’ micrographs reveals that the de-gree of agglomeration initially decreased with the dop-ing of 0.1 wt.% Fe into TiO2 and after that it is gradu-ally increased with the further increase of Fe content in TiO2. In order to establish the achievement of the tar-geted chemical composition in the synthesized pow-ders, the 5 wt.% Fe-doped TiO2 powder was examined by EDAX analysis as depicted in Fig. 5. The chemical composition observed in EDAX analysis confirms that the targeted chemical composition (within allowed ex-perimental errors) was achieved in the powders formed in a conventional co-precipitation method.
The FT-IR spectra of Fe-doped TiO2 (with 0, 0.1, 0.5, 1, 5, and 10 wt.% Fe) powders calcined for 6 h at 550 °C are presented in Fig. 6. The presence of some weak transmittance bands between 3400 and 3600 cm−1
, at 1627 cm−1 and at 1377 cm−1 are seen, which are grad-ually decreased with the increase of Fe concentration in TiO2. These bands are attributed to the stretching vibra-tions of the O-H groups and the bending vibrations of the adsorbed water molecules, respectively [4,8,13−23]. A band between 650 and 830 cm−1 is seen which is attrib-uted to different vibrational modes of TiO2. Anatase and rutile phases of TiO2 exhibit certain strong FT-IR ab-sorption bands in the regions of 850−650 and 800−650 cm−1, respectively [29,30]. The broad intense band seen below 1200 cm−1 is due to Ti-O-Ti vibrations [13−23]. These results match very well with those reported in the literature for Fe-doped TiO2 powders and for anatase and rutile phases of TiO2 [4,8,13−23].
Figure 7 shows the Raman scattering spectra of Fe-doped TiO2 (with 0, 0.1, 0.5, 1, 5 and 10 wt.% Fe) pow-ders formed for 6 h at 550 °C. The tetragonal rutile struc-ture possesses two TiO2 molecules in the unit cell with the space group D4h(P42/mnm) and the lattice constants of a = 0.4594 and c = 0.2958 nm [40]. There are six at-oms in the unit cell, implying a total of 15 (= 3N – 3) vibrational modes. The group theoretical analysis sug-gests that these 15 modes have the following irreduc-
Figure 6. FT-IR spectra of Fe-doped TiO2 (with 0, 0.1, 0.5,1, 5 and 10 wt.% Fe) powders formed at 550 °C for 6 h
Figure 5. EDAX spectra of 5 wt.% Fe-doped TiO2 powder formed at 550 °C for 6 h
I. Ganesh et al. / Processing and Application of Ceramics 6 [1] (2012) xxx–xxx
xx
Figure 5. EDAX spectra of 5 wt.% Fe-doped TiO2 powder
formed at 550 °C for 6 h
Figure 6. FT-IR spectra of Fe-doped TiO2 (with 0, 0.1, 0.5,
1, 5 and 10 wt.% Fe) powders formed at 550 °C for 6 h wt.% Fe-doped TiO2. The decrease of crystallite size with the increase of Fe concentration in TiO2 is quite expected as the ionic radius of Fe (0.64 Å) is relatively smaller than that of Ti (0.68 Å). On the other hand, the decrease of BET surface area with the increase of Fe in TiO2 could be attributed to the increased particle size (i.e. agglomeration) of the powder. The increase of agglomeration with the increase of Fe in TiO2 could be attributed to many reasons including the relatively lower melting point of Fe2O3 (1566 °C) than that of TiO2 (1843 °C). The a and c lattice constant values estimated for undoped TiO2 are 4.585 Å and 2.964 Å, respectively, whereas those estimated for anatase powders (i.e. for TiO2 powders doped with 0.1, 0.5, 1, 5 and 10 wt.% Fe) are not varied much with the increase of Fe dopant concentration in TiO2. The value
noted for a parameter is 3.785 Å for all the powders, whereas, the c parameter value changed from 9.717 to 9.424 Å when iron concentration was increased from 0.1 to 10 wt.%. These lattice parameter values suggest that Fe-doping causes the decrease of TiO2 crystallite size along c-axis as the ionic radii of Fe (0.64 Å) is relatively smaller than that of Ti (0.68 Å). Nevertheless, these estimated lattice parameter values are well comparable with those reported for rutile TiO2 (ICDD File No.: 03-065-1118), anatase TiO2 (ICDD File No.: 03-065-5714), and Fe-doped TiO2 powders [4,8,1323].
The SEM micrographs of the Fe-doped TiO2 (with 0, 0.1, 0.5, 1 and 10 wt.% Fe) powders formed at 550 °C for 6 h are presented in Fig. 4. It can be seen that the morphology of the undoped TiO2 powder is completely different from those of Fe-doped TiO2 powders. In general, all the Fe-doped TiO2 powders consist of nano-sized primary particles with spherical shape in agglomerated powder particles, whereas, the pure TiO2 powder consists of relatively larger (micron size) chunks of powder particles. The primary particles of the 0.1 and 0.5 wt.% Fe-doped TiO2 powders are finer (~50 nm) than those estimated for the 1 and 10 wt.% Fe-doped TiO2 powders. The pure undoped TiO2 powder consists of 13 µm sized agglomerates with almost fused primary particles of about 200 to 500 nm size. A close look into these powders’ micrographs reveals that the degree of agglomeration initially decreased with the doping of 0.1 wt.% Fe into TiO2 and after that it is gradually increased with the further increase of Fe content in TiO2. In order to establish the achievement of the targeted chemical composition in the synthesized powders, the 5 wt.% Fe-doped TiO2 powder was examined by EDAX analysis as depicted in Fig. 5. The chemical composition observed in EDAX analysis confirms that the targeted chemical composition (within allowed experimental errors) was achieved in the powders formed in a conventional co-precipitation method.
The FT-IR spectra of Fe-doped TiO2 (with 0, 0.1, 0.5, 1, 5, and 10 wt.% Fe) powders calcined for 6 h at 550 °C are presented in Fig. 6. The presence of some weak transmittance bands between 3400 and 3600 cm1
, at 1627 cm1 and at 1377 cm1 are seen, which are gradually decreased with the increase of Fe concentration in TiO2. These bands are attributed to the stretching vibrations of the O-H groups and the bending vibrations of the adsorbed water molecules, respectively [4,8,1323]. A band between 650 and 830 cm1 is seen which is attributed to different vibrational modes of TiO2. Anatase and rutile phases of TiO2 exhibit certain strong FT-IR absorption bands in the regions of 850650 and 800650 cm1, respectively [29,30]. The broad intense band seen below 1200 cm1 is due to Ti-O-Ti vibrations [1323]. These results match very well with those reported in the literature
14

29
I. Ganesh et al. / Processing and Application of Ceramics 6 [1] (2012) 21–36
ible representations: A1g + A2g + A2u + B1g + B2g + 2B1u + Eg + 3Eu. In which, the four modes, A1g + B1g + B2g + Eg, are Raman active and four modes, A2u + 3Eu, are infra-red active. The other three modes, A2g + 2B1u, are nei-ther Raman active nor infrared active. The frequencies of the Raman bands noted for pure rutile powder (i.e. for un-doped TiO2) are at 141−157, 181−290, 415−479, 585−650 cm−1 (Fig. 7). Balachandran and Eror [40] re-ported six frequencies at 144, 235, 320-360, 448, 612, and 827 cm−1 for rutile titania. On the other hand, the conventional crystallographic unit cell of anatase TiO2
is body centred tetragonal (space group D4h, I41/amd, with an elongated cell having a = 0.3783 and c = 0.951 nm) and contains two primitive unit cells, each of which contains two formula units of TiO2 [40]. According to the factor group analysis, six modes of anatase TiO2, A1g + 2B1g + 3Eg are Raman active and three modes, A2u + 2Eu, are infrared active. One vibration, B2u, will be inactive in both infrared and Raman spectra. All of these modes account for the 15 normal modes of vi-bration. Thus, group theory predicts six Raman active modes for the tetragonal anatase phase: three Eg modes centred around 145, 197, and 639 cm−1; two B1g modes at 399 and 519 cm−1; and one A1g mode at 513 cm−1 [41].
The frequencies of the Raman bands noted for anatase TiO2 (in the powders doped with 0.1, 0.5, 1, and 5 wt.% Fe) are at 108−188, 205, 387−425, 512−543, 625−670 cm−1 (Fig. 7). In the literature Raman bands report-ed for anatase TiO2 are at 146, 198, 320, 398,448, 515, 640, and 796 cm−1 [40]. As mentioned above, the band at about 146 cm−1 is the strongest of all the observed bands, and the bands at 198, and 640 cm−1 are assigned to the Eg modes and the one at 401 cm−1 to the B1g mode. The doublet band at 522 cm−1 is assigned to A1g and B1g modes [40]. These results are comparable with those re-ported for anatase and rutile phases of TiO2 in the liter-ature [42]. The α-Fe2O3 and TiFe3O4 seems to have ex-hibited no prominent Raman bands as the TiO2 powders containing these phases did not reveal any other addi-tional Raman peaks or bands.
The UV-Vis diffuse reflectance spectra (DRS) of the Fe-doped TiO2 (with 0, 0.1, 0.2, 0.3, 0.4, 0.5, 0.6, 0.7, 0.8 and 0.9, and 1, 2, 3, 4, 5, 6, 7, 8, 9 and 10 wt.% Fe) powders calcined at 550 °C for 6 h are presented in Fig. 8. It can be seen that pure undoped (rutile) and the 0.1 wt.% Fe-doped TiO2 powders (Fig. 8a) show absorption spectra consisting a single broad intense absorption at around 400 nm (i.e. in the UV range) occurred due to the charge-transfer (CT) from the valence band (mainly formed by 2p orbitals of the oxide anions) to the conduc-
Figure 8. UV-Vis diffuse reflectance spectra (DRS) of: a) 0 to 0.9 wt.% and b) 0 to 10 wt.% Fe-doped TiO2 powders formed at 550 °C for 6 h
Figure 7. FT-Raman spectra of Fe-doped TiO2 (with 0, 0.1, 0.5, 1, 5 and 10 wt.% Fe) powders
formed at 550 °C for 6 h
14
a) b)

30
I. Ganesh et al. / Processing and Application of Ceramics 6 [1] (2012) 21–36
tion band (mainly formed by 3d t2g orbitals of the Ti4+ cat-ions) [43]. The 0.1 wt.% Fe-doped TiO2 powder exhib-ited the spectra just like the one exhibited by P-25 TiO2 (Degussa) powder [43]. The DRS spectra of 7 to 10 wt.% Fe-doped TiO2 powders revealed three absorption bands in the wavelength ranges of 400−475 nm, 475−550 nm and 800−1100 nm (visible region) with three λmax peaks at about 433 nm, 512 nm and 900 nm, respectively. The degree of absorbance of these latter peaks increased with the increase of Fe-content in TiO2. The powders doped with >5 wt.% Fe exhibited the higher amounts of light absorbance (Fig. 8b). It has been reported that the doping of various transitional metal ions into TiO2 could shift its optical absorption edge from UV into visible light range (i.e., red shift) [44]. Thus, these UV-Vis DRS results are in good agreement with those reported for Fe-doped TiO2 powders in the literature [4,8,13−23,40−44].
In order to establish the type of band-to-band tran-sition in the 0.1, 0.5, 1, 5 and 10 wt.% Fe-doped TiO2 powders formed at 550 °C for 6 h, the absorbance data of DRS spectra was fitted into equations for both indi-rect and direct band gap transitions [39,40]. Figure 9a shows the [F(R∞)E]2 vs. Ephot plot for direct transition and Fig. 9b shows the [F(R∞)E]1/2 vs. Ephot plot for in-direct transition. The Kubelka-Munk function F(R∞) is equivalent to absorbance in these UV-Vis DRS spectra
and Ephot is the photon energy, Ephot = (1239/λ) eV, where λ is the wavelength in nm [33]. The value of Ephot extrap-olated to F(R∞)E = 0, which gives an absorption ener-gy, corresponds to a band gap Ebg [32,33,38,39]. A close look at these graphs reveals that all these powders pos-sess direct band gap transitions. The calculated Ebg val-ues of these powders are presented in Table 2. It can be seen that as the Fe concentration increased in TiO2, the band gap energy is gradually decreased, which is consist-ent with the red shift of absorption edge observed in DRS spectra (Fig. 8). These red shifts can be attributed to the charge transfer transitions between the metal ion d elec-trons and the conduction or valence band of TiO2. Based on Ebg and absorption edge values noted, the pure TiO2 is expected to be active under UV irradiation, whereas, the Fe-doped TiO2 (with 0.1, 0.5, 1, 5 and 10 wt.% Fe) pow-ders under visible light [8].
In order to find out whether a shift of the valence or conduction band edge is responsible for the decrease of the band gap energy of TiO2 with the increase of Fe-dop-ing concentration, the position of the quasi-Fermi level of electrons (nEF*) (i.e., the flat-band potential values, Ufb) were determined by measuring the photovoltages of Fe-doped TiO2 powders as a function of the suspension pH value (Fig. 10). From the pH value of the inflection point (pH0), the quasi-Fermi level at pH=7 could be calculated
Table 2. Photoelectrochemical and band gap energy data of 0.1, 0.5, 1, 5 and 10 wt.% Fe-doped TiO2 powders formed at 550 °C for 6 h†
Fe in TiO2[wt.%]
Zeta potential(mV) at pH~7 pH0
[a] Ebg [eV][b] Ufb (vs. NHE)[a] calculated for pH~7 [V][c]Direct Indirect
0.1 −40.1±3.90 6.6 3.214 2.871 −0.26960.5 −48.8±2.78 5.5 3.198 2.687 −0.33451 −49.5±4.06 4.4 3.098 1.823 −0.39945 −49.8±2.95 3.6 2.904 1.233 −0.446610 −52.9±2.95 2.7 2.205 1.571 −0.4997
†The values are arrived as detailed in the experimental section. [a] Measured according to ref. [32,33]. [b] These values measured for powders by following DRS spectra, and the reproducibilitywas better than ±0.01 eV. [c] Reproducibility was better than ±0.01 V.
Figure 9. Transformed diffuse reflectance spectra of Fe-doped TiO2 (with 0, 0.1, 0.5, 1, 5 and 10 wt.% Fe) powders formed at 550 °C for 6 h showing: a) direct band gap and b) indirect band gap energy values
a) b)

31
I. Ganesh et al. / Processing and Application of Ceramics 6 [1] (2012) 21–36
(Table 2) [32,33]. An increase in Fe-dopant concentration has caused an increasing trend in the flat band potentials (Ufb). These values increased from −0.2696 V for the 0.1 wt.% Fe-doped TiO2 to −0.4997 V for the 10 wt.% Fe-doped TiO2. This change in the flat band potential could be attributed to the various modifications such as, change in the crystallite size and specific surface area, the for-mation of certain additional secondary phases, etc., oc-curred to the TiO2 powders upon doping with Fe. A value of −0.52 V for TiO2 at pH=7 measured by slurry meth-
od [33], −0.58 V for an anatase single crystal measured by Mott-Schottky method [45] and −0.47 V for anatase powder also measured by slurry method [46] were re-ported in the literature. The values measured in the pres-ent study are slightly different from those values reported in the literature already [32,33]. These differences could be attributed to the presence of Fe in TiO2 and to the dif-ferences in their methods of preparation. Assuming that the distance between the quasi-Fermi level of electrons and the conduction band edge is decreasing with the in-crease of Fe in TiO2, one could locate the position of the valence band edge by adding the band gap energy to the quasi-Fermi level value [32,33]. Potential values of 2.944, 2.863, 2.758, 2.457, and 1.705 V (vs. NHE) for the 0.1, 0.5, 1, 5, and 10 wt.% Fe-doped TiO2 powders could be calculated at pH=7 (Fig. 11). These measured flat band potentials and band gap energy values suggest that these synthesized Fe-doped TiO2 powders are proba-ble candidate members of choice for artificial photosyn-thesis reactions (i.e., for photo-electrolysis of water into hydrogen and oxygen gases).
Table 2 also lists the measured values of zeta poten-tials (ζ) of the 0.1, 0.5, 1, 5 and 10 wt.% Fe-doped TiO2 powders formed at 550 °C for 6 h. It can be seen that there is a gradual increase in the zeta-potential values of TiO2 from −40.1 ± 3.90 mV to −52.9 ± 2.95 mV with the increase of Fe-dopant concentration from 0.1 to 10 wt.% in TiO2. The iso-electric point of TiO2 lies in pH less than 6.8 [46,47]. The solution at pH=7 renders TiO2 powder surface a negative charge, resulting in negative ζ values. The change of ζ values with increase of Fe-con-tent suggests that the isoelectric point of TiO2 powder is changing with the increase of Fe concentration in it. De-velopment of charge on TiO2 powder surface in aqueous medium can be shown with equations (3) and (4):
Ti-OH + H+ ↔ Ti-OH2+ (3)
Ti-OH + -OH– ↔ Ti-O– + H2O (4)
It is generally accepted that the surface of the TiO2 powder exists in the form of TiOH groups. These hy-droxyl groups dissociate into water and confer to the particles a surface charge as shown in equations (3) and (4). These equations further suggest that the solution pH also possesses a strong influence on the surface catalyt-ic reactions of TiO2 powders in aqueous medium. Since, these powders possess negative zeta potentials, it is ex-pected that the reactions of organic molecules/reactants having positive charge would be higher on the surfaces of these Fe-doped TiO2 powders [46,47].
The methylene blue (MB) degradation experiments in water under the irradiation of simulated solar light were conducted to assess the photocatalytic efficiency of 0.1, 0.5, 1, 5 and 10 wt.% Fe-doped TiO2 powders. Figure 12 shows the C/C0 of 0.01, 0.02 and 0.03 mM aqueous MB solutions, respectively, irradiated with simulated so-
Figure 10. Dependence of photovoltage (V vs. Ag/AgCl) of Fe-doped TiO2 (with 0.1, 0.5, 1, 5 and 10 wt.% Fe) powders
formed at 550 °C for 6 h on pH of electrolyte
Figure 11. The electrochemical potentials (vs. NHE) of band edges of Fe-doped TiO2 (with 0.1, 0.5, 1, 5 and 10 wt.% Fe)
powders (formed at 550 °C for 6 h) at pH 7

32
I. Ganesh et al. / Processing and Application of Ceramics 6 [1] (2012) 21–36
lar light over different amounts of Fe-doped TiO2 pow-ders as a function of reaction time. It can be seen that among the five powders tested, only the 0.1 wt.% Fe-doped TiO2 powder showed the highest photocatalytic activity and as the concentration of Fe increased in TiO2, the photocatalytic efficiency was gradually decreased. Furthermore, the photocatalytic efficiency of these cat-alysts was also decreased with the increase of MB con-centration in the aqueous reaction solution. The UV-vis-ible spectra revealing the degradation behaviour of 0.03 mM MB solution over the 1 wt.% Fe-doped TiO2 powder as a function of reaction time is shown in Fig. 13. In or-der to assess the rate of photocatalytic degradation of MB over the 0.1, 0.5, 1, 5 and 10 wt.% Fe-doped TiO2 pow-ders, the observed MB degradation results were kineti-cally analyzed by following Langmuir-Hinshelwood rate constant equations [14,48]. Langmuir-Hinshelwood (Eq. (5)) described the relationship between the initial degra-dation rate (r) and the initial concentration (C) of the or-ganic substrate for heterogeneous photocatalytic degra-dation [14,48]. The model can be written as follows:
(5)
where: (6)
(7)
(8)
Co (ppm) is the initial concentration of MB, Ct (ppm) is the remaining concentration after t (h) time irra-diation, Kads is the Langmuir-Hinshelwood adsorption
Figure 12.Effect of the concentration of methylene blue (MB) on photocatalytic ability of Fe-doped TiO2
(with 0.1, 0.5, 1, 5 and 10 wt.% Fe) powders formedat 550 °C for 6 h. (a) 0.01 mM; (b) 0.02 mM and
(c) 0.03 mM MB solutions
Figure 13. The UV-visible spectra of 0.03 mM MB solution irradiated with simulated solar light of 44 mW/cm2 over 1 wt.% Fe-doped TiO2 powder for different time intervals
a)
b)
c)
I. Ganesh et al. / Processing and Application of Ceramics 6 [1] (2012) xxx–xxx
xx
a) b)
c)
Figure 12.Effect of the concentration of methylene blue (MB) on photocatalytic ability of Fe-doped TiO2 (with 0.1, 0.5, 1, 5 and 10 wt.% Fe) powders formed at 550 °C for 6 h. (a) 0.01 mM; (b) 0.02 mM and (c) 0.03 mM MB solutions
Figure 13. The UV-visible spectra of 0.03 mM MB solution irradiated with simulated solar light of 44 mW/cm2 over 1 wt.% Fe-doped TiO2 powder for different time intervals
changing with the increase of Fe concentration in it. Development of charge on TiO2 powder surface in aqueous medium can be shown with equations (3) and (4):
Ti-OH + H+ Ti-OH2+ (3)
Ti-OH + -OH– Ti-O– + H2O (4)
It is generally accepted that the surface of the TiO2 powder exists in the form of TiOH groups. These hydroxyl groups dissociate into water and confer to the particles a surface charge as shown in equations (3) and (4). These equations further suggest that the solution pH also possesses a strong influence on the surface catalytic reactions of TiO2 powders in aqueous medium. Since, these powders possess negative zeta potentials, it is expected that the reactions of organic molecules/reactants having positive charge would be higher on the surfaces of these Fe-doped TiO2 powders [46,47].
=
+=
−=
CKCkK
dtdCr
ads
ads
1Ckobs
CK
kK
ads
ads
+=
1kobs
kC
kKk adsobs
+=11
kobs=−CoCtln t

33
I. Ganesh et al. / Processing and Application of Ceramics 6 [1] (2012) 21–36
Figure 14. Linear transforms: –ln (Ct/Co) versus irradiation time for methylene blue (MB) under simulated solar light over Fe-doped TiO2 (with 0.1, 0.5, 1, 5 and 10 wt.% Fe) powders formed at 550 °C for 6 h. (a) 0.01 mM; (b) 0.02 mM and
(c) 0.03 mM MB solutions
Table 3. The initial concentrations and the pseudo-first order rate constant (k) of methylene blue degradation under theirradiation of simulated solar light over 0.1, 0.5, 1, 5 and 10 wt.% Fe-doped TiO2 powders formed at 550 °C for 6 h†
Fe in TiO2[wt.%]
C0 of MB [ppm]
kobs [h−1] (±0.020) Kads
k [ppm h−1] (×10−2)
0.13.198 (0.01 mM) 0.494
0.266 5.8656.397 (0.02 mM) 0.0179.595 (0.03 mM) 0.009
0.53.198 0.352
0.274 2.5906.397 0.0159.595 0.004
13.198 0.331
0.291 2.5886.397 0.0119.595 0.004
53.198 0.291
0.369 1.3096.397 0.0099.595 0.002
103.198 0.086
1.082 1.2886.397 0.0039.595 0.002
†The values are arrived as detailed in the experimental section
a) b)
c)

34
I. Ganesh et al. / Processing and Application of Ceramics 6 [1] (2012) 21–36
equilibrium constant (ppm−1), and k is the pseudo-first order rate constant relating to TiO2 surface reaction (ppm h−1).
The k observed (kobs) values for each initial concen-tration were estimated from the slopes of straight line obtained by plotting –ln(Ct/C0) vs. irradiation time as shown in Fig. 14 and Table 3. By plotting initial con-centrations vs. 1/kobs, the rate constant (k) and the ad-sorption equilibrium constant Kads were calculated. Equation (7) can be identified as Y = m·X + C, where, C = 1/(k·Kads), m = 1/k, Y = 1/kobs and X is the initial concentration (C0) of MB. By using the Eq. (5) and the data of Table 3, the initial degradation rates (r) of MB over Fe-doped TiO2 powders were calculated. It can be clearly seen that the Langmuir-Hinshelwood adsorp-tion equilibrium constant and the rate constant values suggest that the 0.1 wt.% Fe-doped TiO2 powder shows the highest photo-catalytic activity for MB degrada-tion under the irradiation of simulated solar light. The data of Figs. 12 and 14 suggests that the TiO2 powder doped with 0.1 wt.% Fe exhibits the highest photocat-alytic ability for MB degradation under the irradiation of simulated solar light.
IV. ConclusionsThe following conclusions can be drawn from the
above study: Chemically homogeneous and fully crystalline Fe-1. doped TiO2 (with 0 to 10 wt.% Fe) powders can be prepared following a co-precipitation method. The TiO2 powder formed from TiCl4 in a co-pre-cipitation route exists in the form of crystal pure rutile phase, whereas, the TiO2 powder doped with Fe (up to 10 wt.%) exists in the form of anatase phase. Even 0.1 wt.% Fe is sufficient to transform TiO2. 2 from fully rutile to fully anatase phase and to en-hance TiO2 powders specific surface area from 23.25 to 65.92 m2/g. The Fe-dopant confers a red shift to light absorbing capability of TiO2 and re-duces its band gap energy considerably. Both undoped and Fe-doped TiO3. 2 powders pos-sess direct band gap energy transitions. Among various Fe-doped TiO4. 2 powders, the one doped with 0.1 wt.% Fe shows the highest pho-tocatalytic activity for methylene blue (MB) deg-radation under the irradiation of simulated so-lar light. The Fe-doped TiO2 powders follow the Langmuir-Hinshelwood first order reaction rate constant relationship in the photocatalytic MB degradation reactions. The Fe-doped TiO5. 2 powders possess flat band po-tentials suitable for artificial photosynthesis reac-tions. Though, Fe2O3 is a p-type semi-conducting material, the Fe-doped TiO2 materials exhibit n-type semi-conducting behaviour.
Acknowledgements: Authors would like to express their gratitude to their colleagues at ARCI for their kind contributions to this study.
ReferencesM. Halmann, “Photoelectrochemical reduction of 1. aqueous carbon-dioxide on p-type gallium-phosphi-de in liquid junction solar cells”, Nature, 275 (1978) 115–116. E.E. Barton, D.M. Rampulla, A.B. Bocarsly, “Selec-2. tive solar-driven reduction of CO2 to methanol using a catalyzed p-GaP based photoelectrochemical cell”, J. Am. Chem. Soc., 130 [20] (2008) 6342–6344.K.W. Jr. Frese, S.C. Leach, D.P. Summers, “Elec-3. trochemical reduction of aqueous carbon dioxide to methanol”, U.S. Patent No. 4,609,441, dated: 2nd September 1986.A. Fujishima, K. Honda, “Electrochemical photoly-4. sis of water at a semiconductor electrode”, Nature, 238 (1972) 37–40.M. Gratzel, “Photoelectrochemical cells”,5. Nature, 414 [6861] (2001) 338–344.K. Ohashi, J. Mc Cann, J.O.M. Bockris, “Stable 6. photoelectrochemical cells for splitting of water”, Nature, 266 [5603] (1977) 610–611. S. Licht, “A description of energy-conversion in 7. photoelectrochemical solar-cells”, Nature, 330 [6144] (1987) 148–151.T. Bak, J. Nowotny, M. Rekas, C.C. Sorrell, “Re-8. view article: Photo-electrochemical hydrogen gen-eration from water using solar energy: materials-re-lated aspects”, Inter. J. Hydrogen Energy, 27 (2002) 991–1022.I. Ganesh, “Conversion of carbon dioxide to metha-9. nol using solar energy – a brief review”, Mater. Sci. Applic., 2 [10] (2011) 1407–1415.I. Ganesh, “An opinion on conversion of carbon di-10. oxide to methanol using solar energy”, Curr. Sci., 101 [6] (2011) 731–733.A.J. Nozik, “p-n photoelectrolysis cell”11. , Appl. Phys. Lett., 29 (1976) 150–153.A.J. Nozik, “Photochemical diodes”, 12. US Patent No.: 4,094,751, June 13, 1978.Y.J. Lin, Y.H. Chang, W.D. Yang, B.S. Tsai, “Syn-13. thesis and characterization of ilmenite NiTiO3 and CoTiO3 prepared by a modified Pechini method”, J. Non-Crystal. Solids, 352 (2006) 789–794.I. Ganesh, A.K. Gupta, P.P. Kumar, P.S.C. Sekhar, K. 14. Radha, G. Padmanabham, G. Sundararajan, “Prep-aration and characterization of Ni-doped TiO2 ma-terials for photocurrent and photocatalytic applica-tions”, Sci. World J., in press, 2012.I. Ganesh, A.K. Gupta, P.P. Kumar, P.S.C. Sekhar, K. 15. Radha, G. Padmanabham, G. Sundararajan, “Prep-aration and characterization of Co-doped TiO2 ma-terials for solar light induced current and photocat-alytic applications”, Mater. Chem. Phys., in press, 2012.

35
I. Ganesh et al. / Processing and Application of Ceramics 6 [1] (2012) 21–36
S. Kumari, Y.S. Chaudhary, S.A. Agnihotry, C. Trip-16. athi, A. Vermac, D. Chauhan, R. Shrivastav, S. Dass, V.R. Satsangia, “A photoelectrochemical study of nano-structured Cd-doped titanium oxide”, Inter. J. Hydrogen Energy, 32 (2007) 1299–1302.J.A. Navio, M. Macias, M. Gonzalez-Catalan, A. Jus-17. to, “Bulk and surface characterization of powder iron-doped titania photocatalysts”, J. Mater. Sci., 27 (1992) 3036–3042.M.I. Litter, J.A. Navio, “Photocatalytic properties of 18. iron-doped titania semiconductors”, J. Photochem. Photobiol. A Chem., 98 [3] (1996) 171–181.R.I. Bickley, J.S. Lees, R.J.D. Tilley, L. Palmisano, M. 19. Schiavello, “Characterization of iron/titanium oxide photocatalysts: part 1 - structural and magnetic studies”, J. Chem. Soc., Faraday Trans., 88 (1992) 377–383.D. Cordishi, N. Burriesci, F.D. Alba, M. Petrera, G. 20. Polizzotti, M. Schiavello, “Structural characterization of Fe/Ti oxide photocatalysts by X-ray, ESR, and Mossbau-er methods”, J. Solid State Chem., 56 (1985) 182–190.M.V. Tsodikov, O.V. Bukhtenko, O.G. Ellert, V.M. 21. Shcherbakov, D.I. Kochubey, “Low-temperature for-mation mechanism of double oxides FexZr(Ti)1–075xO2–δ prepared from alkoxides and acetylacetonates”, J. Mater. Sci., 30 [4] (1995) 1087–1094.Y. Wang, H. Cheng, Y. Hao, J. Ma, W. Li, S. Cai, 22. “Preparation, characterization and photoelectrochem-ical behaviours of Fe (III)-doped TiO2 nanoparticles”, J. Mater. Sci., 34 (1999) 3721–3729.A.R. Ballyy, E.N. Korobeinikova, P.E. Schmid, F. 23. Levy, F. Bussy, “Structural and electrical properties of Fe-doped TiO2 thin films”, J. Phys. D: Appl. Phys., 31 (1998) 1149–1154.U. Jorskten, J. Moser, M. Gratzel, “Photoelectrochem-24. ical studies on nanocrystalline hematite films”, Chem. Mater., 6 (1994) 858–863. G.S. Nahor, L.C.T. Shoute, P. Neta, A. Harriman, “Re-25. duction of dinitrogen to ammonia in aqueous solution mediated by colloidal metals”, J. Chem. Soc., Fara-day Trans., 86 (1990) 3927–3933.V. Augugliaro, A. Laurucella, L. Rizzuti, M. Schiavel-26. lo, A. Sclafani, “Conversion of solar energy to chem-ical energy by photoassisted processes. I: Preliminary results on ammonia production over doped titanium dioxide catalysts in a fluidized bed reactor”, Int. J. Hy-drogen Energy, 7 [11] (1982) 845–849.K.T. Ranjit, B. Vishwanathan, “Synthesis, character-27. ization and photocatalytic properties of iron-doped TiO2 catalysts”, J. Photochem. Photobio. A: Chem., 108 (1997) 79–84.A.P. Singh, S. Kumari, R. Shrivastav, S. Dass, V.R. 28. Satsangi, “Iron doped nanostructured TiO2 for photo-electrochemical generation of hydrogen”, Int. J. Hy-drogen Energy, 33 (2008) 5363–5368.B.M. Reddy, I. Ganesh, “Characterization of La29. 2O3–TiO2 and V2O5/La2O3–TiO2 catalyst and their activi-ty for synthesis of 2,6-dimethylphenol”, J. Mol. Catal. A: Chemical, 169 (2001) 207–223.
B.M. Reddy, I. Ganesh, E.P. Reddy, A. Fernández, 30. P.G. Smirniotis, “Surface characterization of Ga2O3-TiO2 and V2O5/Ga2O3-TiO2 catalysts”, J. Phys. Chem. B, 105 (2001) 6227–6235.R.J. Tayade, T.S. Natarajan, H.C. Bajaj, “Photocata-31. lytic degradation of methylene blue dye using ultravi-olet light emitting diodes”, Ind. Eng. Chem. Res., 48 (2009) 10262–10267.A.M. Roy, G.C. De, N. Sasmal, S.S. Bhattacharyya, 32. “Determination of the flat band potential of semicon-ductor particles in suspension by photovoltage mea-surement”, Int. J. Hydrogen Energy, 20 (1995) 627–630.H. Kisch, S. Sakthivel, M. Janczarek, D. Mitoraj, “A 33. low-bandgap, nitrogen modified titania visible light photocatalyst”, J. Phys. Chem. C, 111 (2007) 11445–11449.W.D. Kingery, H.K. Bowen, D.R. Uhlman, 34. Introduc-tion to Ceramics, 2nd ed. Wiley, New York, 1976.H.P. Klug, L.E. Alexander, “X-ray diffraction proce-35. dures for polycrystalline and amorphous materials”, J. Appl. Crystallogr., 8 (1975) 573–574.P. Jones, J.A. Hockey, “Infra-red studies of rutile sur-36. faces: part 1”, Trans Faraday Soc., 67 (1971) 2669–2678.H.P. Boem, “Chemical identification of surface 37. groups”, Adv. Cat., 16 (1966) 179–274.J. Tauc, 38. Amorphous and Liquid Semiconductors. Ed. J. Tauc, Plenum Press, New York, 1976, 609–705.J. Tauc, A. Menth, “State in the gap”, 39. J. Non Crystal. Solids, 8-10 (1972) 569–585.U. Balachandran, N.G. Eror, “Raman spectra of tita-40. nium dioxide”, J. Solid State Chem., 42 (1982) 276–282.M. Mikami, S. Nakamura, O. Kitao, H. Arakawa, 41. “Lattice dynamics and dielectric properties of TiO2 anatase: a first-principles study”, Phys. Rev. B: Con-densed Matter Mater. Phys., 66 (2002) 155–213.M.I. Baraton, G. Busca, M.C. Prieto, G. Ricchiardi, 42. V.S. Escribano, “On the vibrational spectra and struc-ture of FeCrO3 and of the ilmenite-type compounds CoTiO3 and NiTiO3”, J. Solid State Chem., 112 (1994) 9–14.N. Venkatachalam, M. Palanichamy, V. Murugesan, 43. “Sol-gel preparation and characterization of nanosize TiO2: its photocatalytic performance”, Mater. Chem. Phys., 104 [2-3] (2007) 454–459.J.C.S. Wu, C.H. Chen, “A visible-light response vana-44. dium-doped titania nanocatalyst by sol-gel method”, J. Photochem. Photobiol. A, 163 (2004) 509–515.C.A. Hogarth, Z.T. Al-Dhhan, “Optical absorption in 45. thin films of cerium dioxide and cerium dioxide con-taining silicon monoxide”, Phys. Status Sol. B, 137 (1986) K157–K160.L. Kavan, M. Gratzel, S.E. Gilbert, C. Klemenz, H.J. 46. Scheel, “Electrochemical and photoelectrochemical investigation of single-crystal anatase”, J. Am. Chem. Soc., 118 [28] (1996) 6716–6723.

36
I. Ganesh et al. / Processing and Application of Ceramics 6 [1] (2012) 21–36
M.D. Ward, J.R. White, A.J. Bard, “Electrochemical 47. investigation of the energetics of particulate titanium dioxide photocatalysts: the methyl viologen-acetate system”, J. Am. Chem. Soc., 105 [1] (1983) 27–31.
G.J. Cunningham, G. Al-Sayyed, S. Srijaranai, 48. Aquat-ic and Surface Photochemistry. Eds. G.R. Helz, R.G. Zepp, D.G. Grosby, Lewis Publisher, Boca Raton, 1994, p. 317.