premature birth report card tennessee 2015
TRANSCRIPT
7/24/2019 Premature Birth Report Card Tennessee 2015
http://slidepdf.com/reader/full/premature-birth-report-card-tennessee-2015 1/2
Disparity index
State rank
marchofdimes.org/reportcard
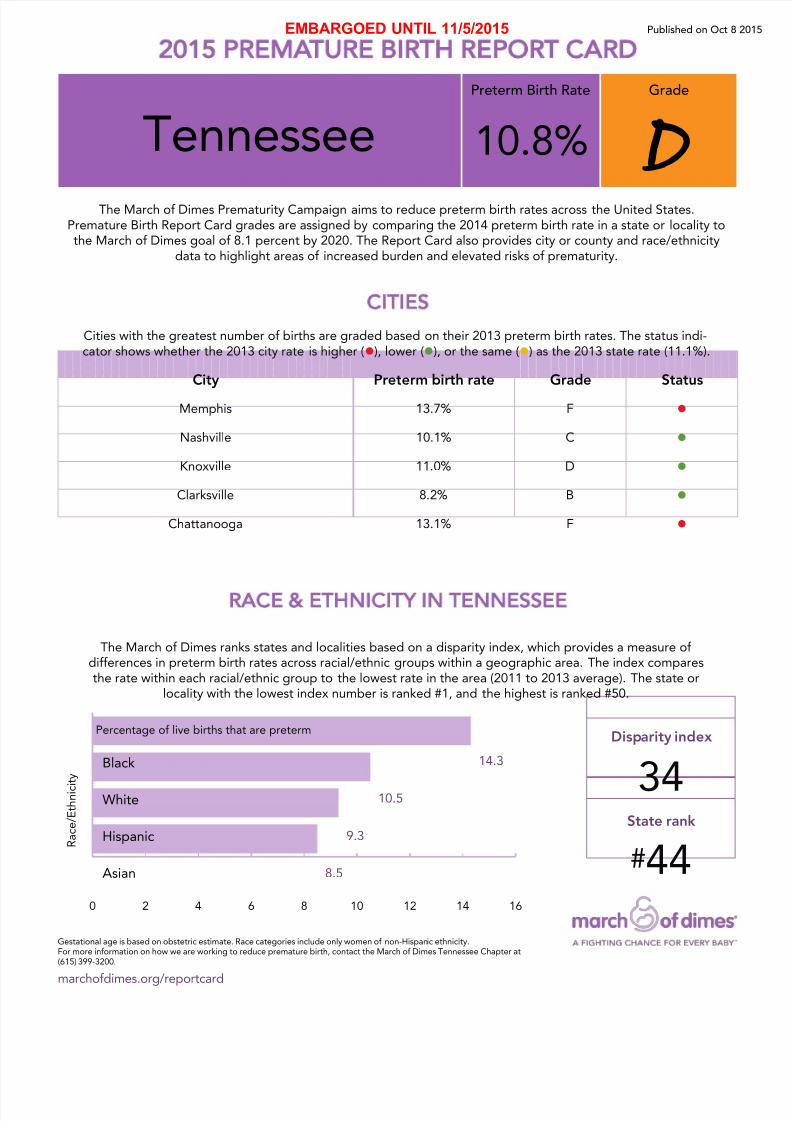
EMBARGOED UNTIL 11/5/2015
2015 PREMATURE BIRTH REPORT CARD
Tennessee 10.8%
Preterm Birth Rate
D
Grade
The March of Dimes Prematurity Campaign aims to reduce preterm birth rates across the United States.Premature Birth Report Card grades are assigned by comparing the 2014 preterm birth rate in a state or locality tothe March of Dimes goal of 8.1 percent by 2020. The Report Card also provides city or county and race/ethnicity
data to highlight areas of increased burden and elevated risks of prematurity.
CITIES
Cities with the greatest number of births are graded based on their 2013 preterm birth rates. The status indi-cator shows whether the 2013 city rate is higher (l), lower (l), or the same (l) as the 2013 state rate (11.1%).
RACE ETHNICITY IN TENNESSEE
The March of Dimes ranks states and localities based on a disparity index, which provides a measure ofdifferences in preterm birth rates across racial/ethnic groups within a geographic area. The index comparesthe rate within each racial/ethnic group to the lowest rate in the area (2011 to 2013 average). The state or
locality with the lowest index number is ranked #1, and the highest is ranked #50.
34#44
Gestational age is based on obstetric estimate. Race categories include only women of non-Hispanic ethnicity.For more information on how we are working to reduce premature birth, contact the March of Dimes Tennessee Chapter at(615) 399-3200.
Published on Oct 8 2
City Preterm birth rate Grade Status
Memphis 13.7% F l
Nashville 10.1% C l
Knoxville 11.0% D l
Clarksville 8.2% B l
Chattanooga 13.1% F l
8.5
9.3
10.5
14.3
0 2 4 6 8 10 12 14 16
Percentage of live births that are preterm
R a c e / E t h n i c i t y
Black
White
Hispanic
Asian

7/24/2019 Premature Birth Report Card Tennessee 2015
http://slidepdf.com/reader/full/premature-birth-report-card-tennessee-2015 2/2
PRETERM BIRTH: DEFINITION AND SOURCEPremature or preterm birth is birth less than 37 weeks gestation based on the obstetric estimate of gestational age. Data used in thisreport card come from the National Center for Health Statistics (NCHS) natality files, as compiled from data provided by the 57 vital
statistics jurisdictions through the Vital Statistics Cooperative Program. This national data source is used so that data are comparablefor each state- and jurisdiction-specific premature birth report card. Therefore, data provided on the report card may differ from dataobtained directly from state or local health departments and vital statistics agencies, due to timing of data submission and handling ofmissing data. The preterm birth rate used to assign the grade shown at the top of the report card is from the NCHS 2014 final natalitydata. The city or county preterm birth rates and grades are calculated from the NCHS 2013 final natality data, while the preterm birthrates by race/ethnicity are calculated from the NCHS 2011-2013 final natality data. Preterm birth rates are calculated as the number ofpreterm births divided by the number of live births with known gestational age multiplied by 100.
PRETERM BIRTH BY RACE/ETHNICITY OF THE MOTHERRace and Hispanic ethnicity are reported separately on the birth certificate. Rates for Hispanic women include all racial categories(white, black, Native American, Asian). Rates for non-Hispanic women are classified according to race. The Native American categoryincludes American Indian or Alaska Native. The Asian category includes Asian or Pacific Islander and Native Hawaiian. In order toprovide stable rates, three years of data were aggregated (2011-2013) and a numerator of 20 in each year (2011, 2012, 2013) wasrequired for a category to appear on the report card. Preterm birth rates for not stated/unknown race are not shown on the reportcard.
GradePreterm birth rate range
Scoring criteria
APreterm birth rate less than or equal to 8.1%
Score less than or equal to 0.0
BPreterm birth rate of 8.2% to 9.2%
Score greater than 0.0, but less than or equal to 1.
CPreterm birth rate of 9.3% to 10.3%
Score greater than 1.0, but less than or equal to 2.
DPreterm birth rate of 10.4% to 11.4%
Score greater than 2.0, but less than or equal to 3.
FPreterm birth rate greater than or equal to 11.5%
Score greater than 3.0
GRADING METHODOLOGY Grade ranges were established in 2015 based on standarddeviations of final 2014 state and District of Columbia pretermbirth rates away from the March of Dimes goal of 8.1% by2020. Grades were determined using the following scoring
formula: (preterm birth rate of each jurisdiction – 8.1%) /standard deviation of final 2014 state and District of Columbiapreterm birth rates. The resulting scores were rounded to onedecimal place and assigned a grade. See Table.
marchofdimes.org/reportcard
© 2015 March of Dimes Foundation
2015 PREMATURE BIRTH REPORT CARD
SELECTION OF CITIES AND COUNTIESReport cards for jurisdictions with at least three cities ofpopulation of 100,000 or more, as defined in the 2013 NCHSnatality file, display preterm birth rates for up to six cities.The cities shown represent those with the largest number of livebirths in that state, and are ordered accordingly. For statesthat do not have at least three cities with a population of 100,000or more, up to six counties with the largest number of live birthsare displayed. Grades are assigned based on criteria described
above.
PRETERM BIRTH DISPARITY INDEX AND RANK The March of Dimes index of racial/ethnic disparity (“disparity index”) in preterm birth provides a measure of the differences, ordisparities, in preterm birth rates across racial/ethnic groups within a geographic area. The index was developed by the March ofDimes Perinatal Data Center and is calculated for each U.S. state with adequate numbers, the District of Columbia and the total
United States.
To calculate the disparity index, the lowest preterm birth rate among the displayed racial/ethnic groups is identified for a geographicarea and used as the comparison rate. The percent difference between the preterm birth rate and the comparison rate is calculatedfor each of the remaining racial/ethnic groups. The percent differences are then averaged to produce the index number, displayed asan integer. The disparity index number can be 0 or greater, with 0 representing no difference between groups. The unrounded indexnumber for each geographic area is ranked against all other geographic areas, with the rank of #1 indicating the least disparity.
CALCULATIONSAll calculations were conducted by the March of Dimes Perinatal Data Center.
TECHNICAL NOTES