preliminary study of emilia (may 20 2012) …€¦ · preliminary study of emilia (may 20th 2012)...
TRANSCRIPT

PR E L I M IN A R Y ST UD Y O F
E M I L I A (M A Y 20th 2012)
E A R T H Q U A K E G R O UND
M O T I O N R E C O RDS V1.0
Eugenio Chioccarelli, Flavia De Luca, and Iunio Iervolino.
[email protected]; [email protected]; [email protected] Dipartimento di Ingegneria Strutturale, Università degli Studi di Napoli F ederico II.
Index
1. Introduction .................................................................................................................................. 2
2. Geographic Information ............................................................................................................... 3
3. Peak and integral parameters of the uncorrected waveforms ...................................................... 8
4. Comparison of the data with Bindi et al. GMPE predictions, PGA, PGV and Sa(T). ............... 17
5. Direct spectral comparison of the data registered within 70km ................................................. 24
6. Comparison of the data with Sabetta and Pugliese and Iervolino et al GMPE predictions, IA and ID .................................................................................................................................................. 30
7. Comparison with Italian hazard data ......................................................................................... 30
References .......................................................................................................................................... 32
Cite as: E. Chioccarelli, F. De Luca, I. Iervolino (2012), Preliminary study of Emilia (May 20th 2012) earthquake ground motion records V1.0, available at http://www.reluis.it.

2
1. Introduction
On the 20th of May 2012, at 02:0.3:53 (UTC), (04:03:53 Italian time), Emilia region (Northern
Italy) was struck by a Magnitude, ML 5.9 (INGV), Mw 6.0 (USGS) earthquake, (lat 44.89, long
11.23, depth 6.3 km). The mainshock was preceded by a 4.1 event on the 19th of May and followed
by relevant aftershocks. (Report 1, Dolce et al, 2012) The seismic sequence covered a large area
between the provinces of Modena, Ferrara, Rovigo and Mantova. The number of daily earthquakes
registered between the 16th of May and the 1st of June is shown in Figure 1 (http://www.ingv.it/primo-
piano/comunicazione/2012/05200508/).
Figure 1. Number of daily earthquakes, update 06/01 (8.00, Italian time), [http://www.ingv.it/primo-
piano/comunicazione/2012/05200508/].
The mainshock was registered by 139 stations of the Italian strong motion network (RAN),
managed by the National Civil Protection, ranging from 16 km up to 650 km epicentral distance.
In the following a preliminary overview of peak and integral parameters at each station is
provided. All the data are referred to the uncorrected waveforms. Peak Ground Acceleration (PGA),
Peak Ground Velocity (PGV) are calculated for the two horizontal direction and for the vertical one.
Arias Intensity (IA), Cosenza and Manfredi Index (ID), evaluated according to Cosenza et al.
(1993), and Housner Intensity (H50) are the integral parameters computed for each waveform for the
three registered componets. Housner intensity (H50) is evaluated as the integral of the pseudo
velocity spectrum in the range 0.2- 2.0 seconds. Durations computed for each record are: Significant
3
Duration (Sd) and Bracketed Duration (Bd), the former estimated between 5% and 95% of the IA,
the latter assuming as reference value 0.05 PGA.
The analysis of peak and integral values is made by a comparison with different ground motion
attenuation relationships (GMPE). Bindi et al. (2011) GMPE was employed for the comparison in
term of PGA, PGV and elastic spectral acceleration at given spectral ordinates, Sa(T). IA attenuation
relationship by Sabetta and Pugliese (1996) and Iervolino et al. (2010) attenuation law in term of ID
have been employed. Sabetta and Pugliese and Iervolino et al GMPEs are based on epicentral
distance (Repi) as distance measure, while Bindi et al. (2011) GMPE employs the epicentral distance
(Repi), for WM < 5.5 events, and the closest distance to fault projection or Joyner and Boore
distance, Rjb (Joyner and Boore, 1981), for stronger earthquakes. Given the lack of information on
the fault, at the moment, an approximate conversion law was employed to switch form the distance
data in terms of Repi to that in terms of Rjb. Equation (1) shows the expression used for the
conversion according to (Gruppo di Lavoro INGV, 2004). 23.5525 0.8845 1 0.95jb epiR R R (1)
2. G eographic Information
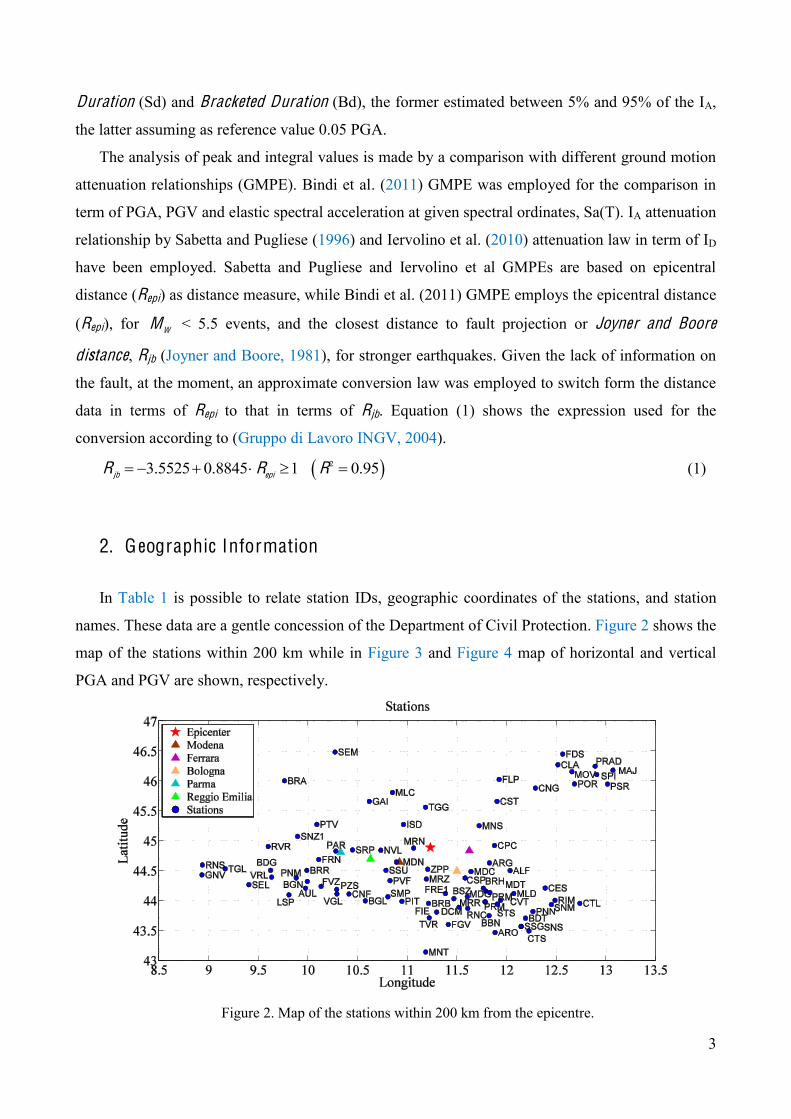
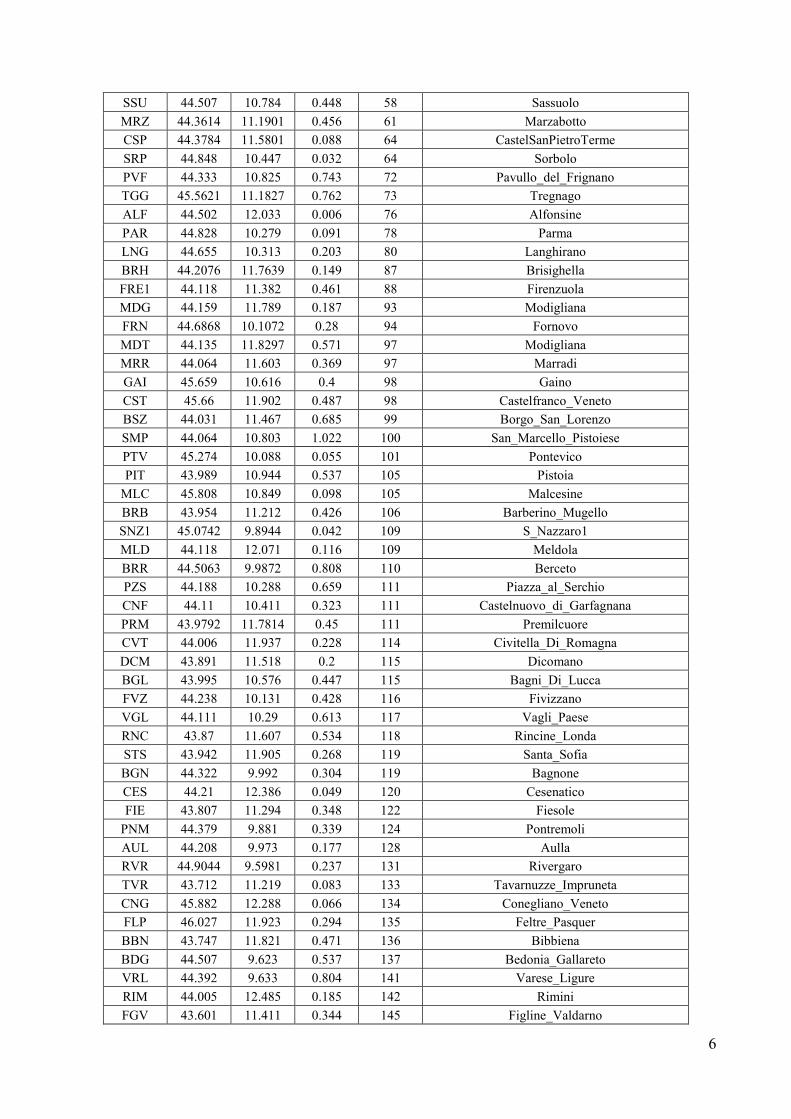
In Table 1 is possible to relate station IDs, geographic coordinates of the stations, and station
names. These data are a gentle concession of the Department of Civil Protection. Figure 2 shows the
map of the stations within 200 km while in Figure 3 and Figure 4 map of horizontal and vertical
PGA and PGV are shown, respectively.
Figure 2. Map of the stations within 200 km from the epicentre.

4
Figure 3. Peak Ground Acceleration (PGA) maps at the stations within 200 km. PGAh is the geometrical
mean of the registered horizontal components, PGAv is the vertical component.

5
Figure 4. Peak Ground Velocity (PGV) maps at the stations within 200 km. PGVh is the geometrical
mean of the registered horizontal components, PGVv is the vertical component.
Table 1. Station ID, geographic coordinates, and station names.
Station ID Lat Lon elevation Repi Station Name
[km] [km] MRN 44.8782 11.0617 0.015 16 Mirandola MDN 44.646 10.889 0.08 41 Modena NVL 44.843 10.732 0.022 42 Novellara ZPP 44.524 11.204 0.069 43 Zola_Pedrosa_Piana ISD 45.273 10.96 0.04 47 Isola_Della_Scala CPC 44.921 11.876 0.008 49 Copparo_Coccanile MNS 45.2517 11.7221 0.014 53 Monselice ARG 44.63 11.825 0.045 54 Argenta MDC 44.486 11.64 0.026 56 Medicina
6
SSU 44.507 10.784 0.448 58 Sassuolo MRZ 44.3614 11.1901 0.456 61 Marzabotto CSP 44.3784 11.5801 0.088 64 CastelSanPietroTerme SRP 44.848 10.447 0.032 64 Sorbolo PVF 44.333 10.825 0.743 72 Pavullo_del_Frignano TGG 45.5621 11.1827 0.762 73 Tregnago ALF 44.502 12.033 0.006 76 Alfonsine PAR 44.828 10.279 0.091 78 Parma LNG 44.655 10.313 0.203 80 Langhirano BRH 44.2076 11.7639 0.149 87 Brisighella FRE1 44.118 11.382 0.461 88 Firenzuola MDG 44.159 11.789 0.187 93 Modigliana FRN 44.6868 10.1072 0.28 94 Fornovo MDT 44.135 11.8297 0.571 97 Modigliana MRR 44.064 11.603 0.369 97 Marradi GAI 45.659 10.616 0.4 98 Gaino CST 45.66 11.902 0.487 98 Castelfranco_Veneto BSZ 44.031 11.467 0.685 99 Borgo_San_Lorenzo SMP 44.064 10.803 1.022 100 San_Marcello_Pistoiese PTV 45.274 10.088 0.055 101 Pontevico PIT 43.989 10.944 0.537 105 Pistoia
MLC 45.808 10.849 0.098 105 Malcesine BRB 43.954 11.212 0.426 106 Barberino_Mugello SNZ1 45.0742 9.8944 0.042 109 S_Nazzaro1 MLD 44.118 12.071 0.116 109 Meldola BRR 44.5063 9.9872 0.808 110 Berceto PZS 44.188 10.288 0.659 111 Piazza_al_Serchio CNF 44.11 10.411 0.323 111 Castelnuovo_di_Garfagnana PRM 43.9792 11.7814 0.45 111 Premilcuore CVT 44.006 11.937 0.228 114 Civitella_Di_Romagna DCM 43.891 11.518 0.2 115 Dicomano BGL 43.995 10.576 0.447 115 Bagni_Di_Lucca FVZ 44.238 10.131 0.428 116 Fivizzano VGL 44.111 10.29 0.613 117 Vagli_Paese RNC 43.87 11.607 0.534 118 Rincine_Londa STS 43.942 11.905 0.268 119 Santa_Sofia BGN 44.322 9.992 0.304 119 Bagnone CES 44.21 12.386 0.049 120 Cesenatico FIE 43.807 11.294 0.348 122 Fiesole
PNM 44.379 9.881 0.339 124 Pontremoli AUL 44.208 9.973 0.177 128 Aulla RVR 44.9044 9.5981 0.237 131 Rivergaro TVR 43.712 11.219 0.083 133 Tavarnuzze_Impruneta CNG 45.882 12.288 0.066 134 Conegliano_Veneto FLP 46.027 11.923 0.294 135 Feltre_Pasquer BBN 43.747 11.821 0.471 136 Bibbiena BDG 44.507 9.623 0.537 137 Bedonia_Gallareto VRL 44.392 9.633 0.804 141 Varese_Ligure RIM 44.005 12.485 0.185 142 Rimini FGV 43.601 11.411 0.344 145 Figline_Valdarno

7
SNM 43.934 12.449 0.742 146 San_Marino LSP 44.096 9.807 0.107 146 La_Spezia PNN 43.818 12.263 0.525 146 Pennabilli BDT 43.706 12.188 0.795 154 Badia_Tebalda POR 45.952 12.681 0.022 158 Pordenone CTL 43.955 12.735 0.062 161 Cattolica SEL 44.265 9.403 0.076 163 Sestri_Levante SSG 43.57 12.146 0.347 165 Sansepolcro_Citta SNS 43.567 12.143 0.377 165 San_Sepolcro ARO 43.466 11.882 0.353 168 Arezzo BRA 46.004 9.762 0.815 169 Branzi TGL 44.533 9.165 1.035 171 Torriglia MOV 46.155 12.655 0.373 174 Montereale_Valcellina PSR 45.9493 13.0141 0.08 176 Passariano_Villa_Manin CTS 43.492 12.223 0.303 176 Citta_Di_Castello CLA 46.2713 12.5141 0.68 178 Claut LEC 45.861 9.412 0.231 179 Lecco SPI 46.108 12.905 0.18 182 Spilimbergo
RNS 44.595 8.936 0.437 187 Ronco_Scrivia SEM 46.485 10.271 1.466 192 Semogo GNV 44.431 8.932 0.419 192 Genova PRAD 46.2481 12.8888 0.52 192 Pradis MAJ 46.1822 13.0689 0.223 196 Majano_casa_di_riposo MNT 43.14 11.183 0.371 196 Monticiano FDS 46.451 12.562 1.795 197 ForniDiSopra UMB 43.254 12.256 0.628 202 Umbertide AVS 46.2946 13.0497 0.256 204 Avasinis
GEDE 46.254 13.1243 0.232 204 Gemona_Depuratore GESC 46.282 13.1404 0.32 207 Gemona_Scugelars TLM2 46.3814 12.9839 5190 208 Tolmezzo 2 OVD 44.636 8.642 0.235 209 Ovada CESC 46.3565 13.0572 0.355 209 Cesclans CVF 46.092 13.429 0.135 210 Cividale_del_Friuli
CARC 45.6527 13.77 0 210 Palazzo Carciotti Trieste TRI 45.709 13.7642 0.161 212 Trieste station
DST2 45.6587 13.8013 0.08 212 DST Trieste station VINO 46.256 13.281 0.608 213 Villanova MASA 46.177 13.4323 0.64 216 Masarolis SDV 45.628 13.897 0.488 218 San_Dorligo_Della_Valle
MOGG 46.4056 13.1893 0.387 220 Moggio SAS 44.483 8.486 0.415 224 Sassello
STOL 46.3614 13.3554 0.57 225 Stolvizza DRN 46.166 13.641 0.784 227 Drenchia AUP 46.5064 13.2563 0.905 231 Aupa ANB 43.592 13.507 0.056 237 Ancona2 TLN 43.215 13.258 0.412 252 Tolentino MCT 43.292 13.418 0.349 255 Macerata TNS 45.03 7.684 0.408 282 Torino_Superga CSC 42.719 13.012 0.683 286 Cascia TNO 45.1 7.633 0.324 286 Torino
8
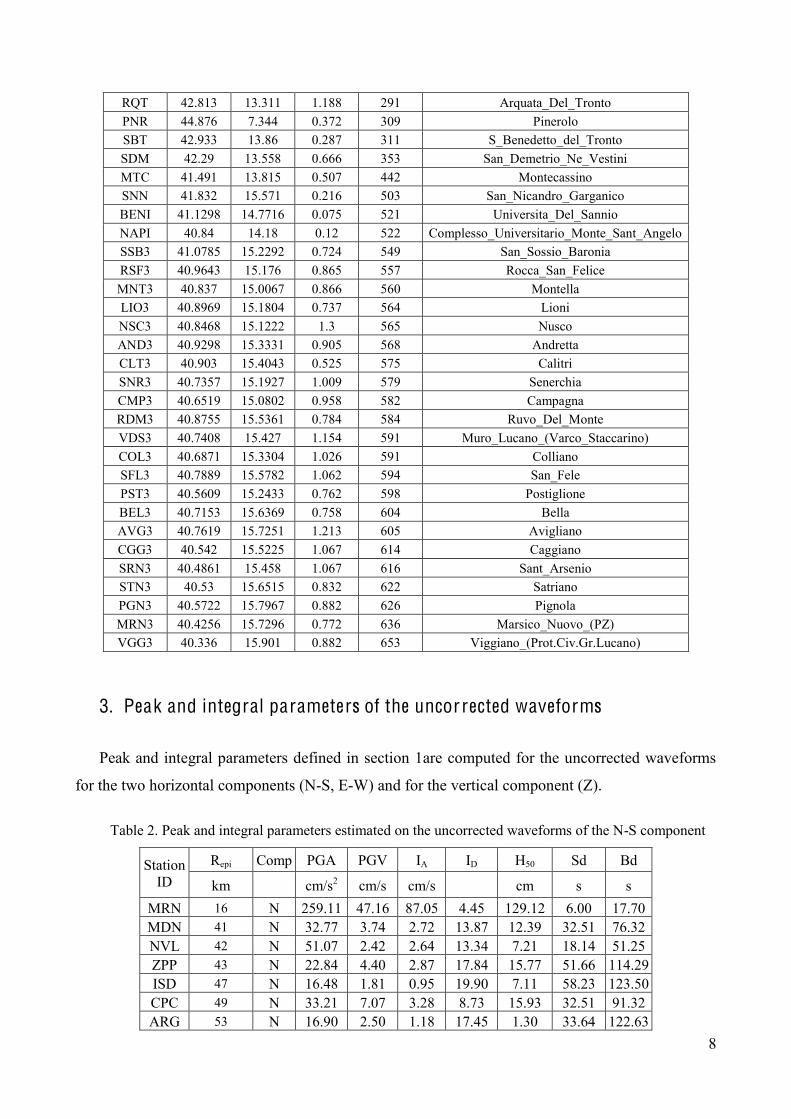
RQT 42.813 13.311 1.188 291 Arquata_Del_Tronto PNR 44.876 7.344 0.372 309 Pinerolo SBT 42.933 13.86 0.287 311 S_Benedetto_del_Tronto SDM 42.29 13.558 0.666 353 San_Demetrio_Ne_Vestini MTC 41.491 13.815 0.507 442 Montecassino SNN 41.832 15.571 0.216 503 San_Nicandro_Garganico BENI 41.1298 14.7716 0.075 521 Universita_Del_Sannio NAPI 40.84 14.18 0.12 522 Complesso_Universitario_Monte_Sant_Angelo SSB3 41.0785 15.2292 0.724 549 San_Sossio_Baronia RSF3 40.9643 15.176 0.865 557 Rocca_San_Felice MNT3 40.837 15.0067 0.866 560 Montella LIO3 40.8969 15.1804 0.737 564 Lioni NSC3 40.8468 15.1222 1.3 565 Nusco AND3 40.9298 15.3331 0.905 568 Andretta CLT3 40.903 15.4043 0.525 575 Calitri SNR3 40.7357 15.1927 1.009 579 Senerchia CMP3 40.6519 15.0802 0.958 582 Campagna RDM3 40.8755 15.5361 0.784 584 Ruvo_Del_Monte VDS3 40.7408 15.427 1.154 591 Muro_Lucano_(Varco_Staccarino) COL3 40.6871 15.3304 1.026 591 Colliano SFL3 40.7889 15.5782 1.062 594 San_Fele PST3 40.5609 15.2433 0.762 598 Postiglione BEL3 40.7153 15.6369 0.758 604 Bella AVG3 40.7619 15.7251 1.213 605 Avigliano CGG3 40.542 15.5225 1.067 614 Caggiano SRN3 40.4861 15.458 1.067 616 Sant_Arsenio STN3 40.53 15.6515 0.832 622 Satriano PGN3 40.5722 15.7967 0.882 626 Pignola MRN3 40.4256 15.7296 0.772 636 Marsico_Nuovo_(PZ) VGG3 40.336 15.901 0.882 653 Viggiano_(Prot.Civ.Gr.Lucano)
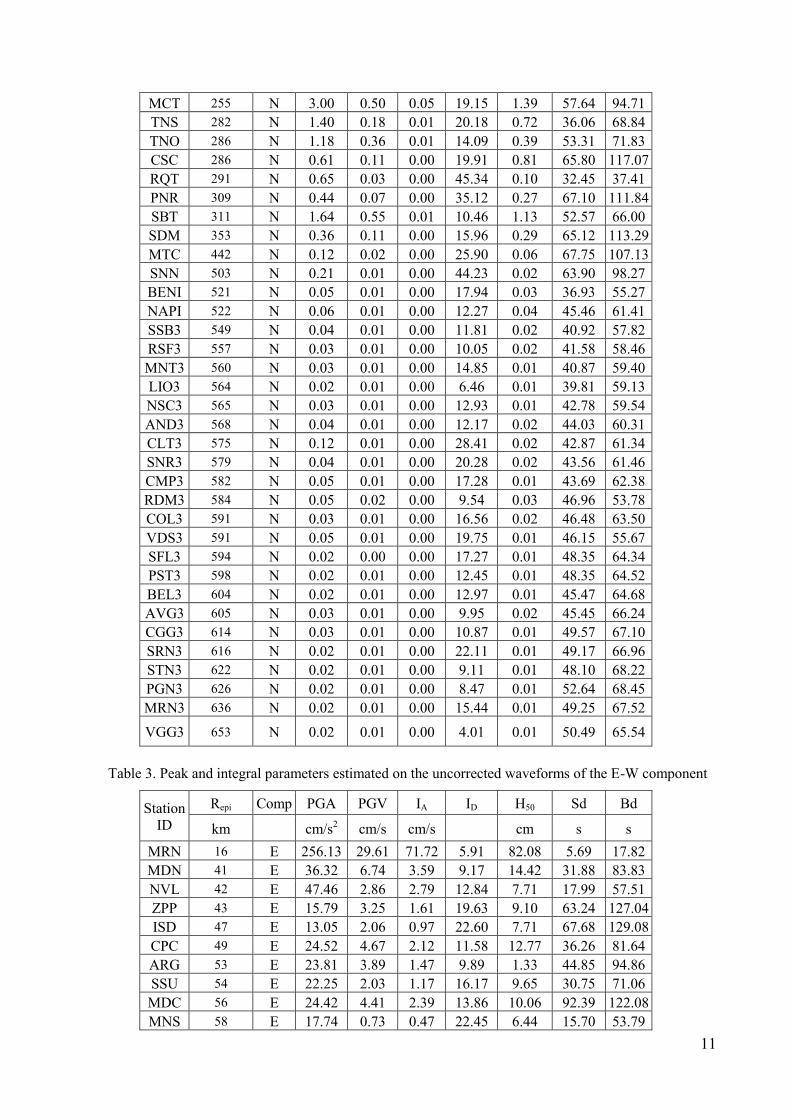
3. Peak and integral parameters of the uncorrected waveforms
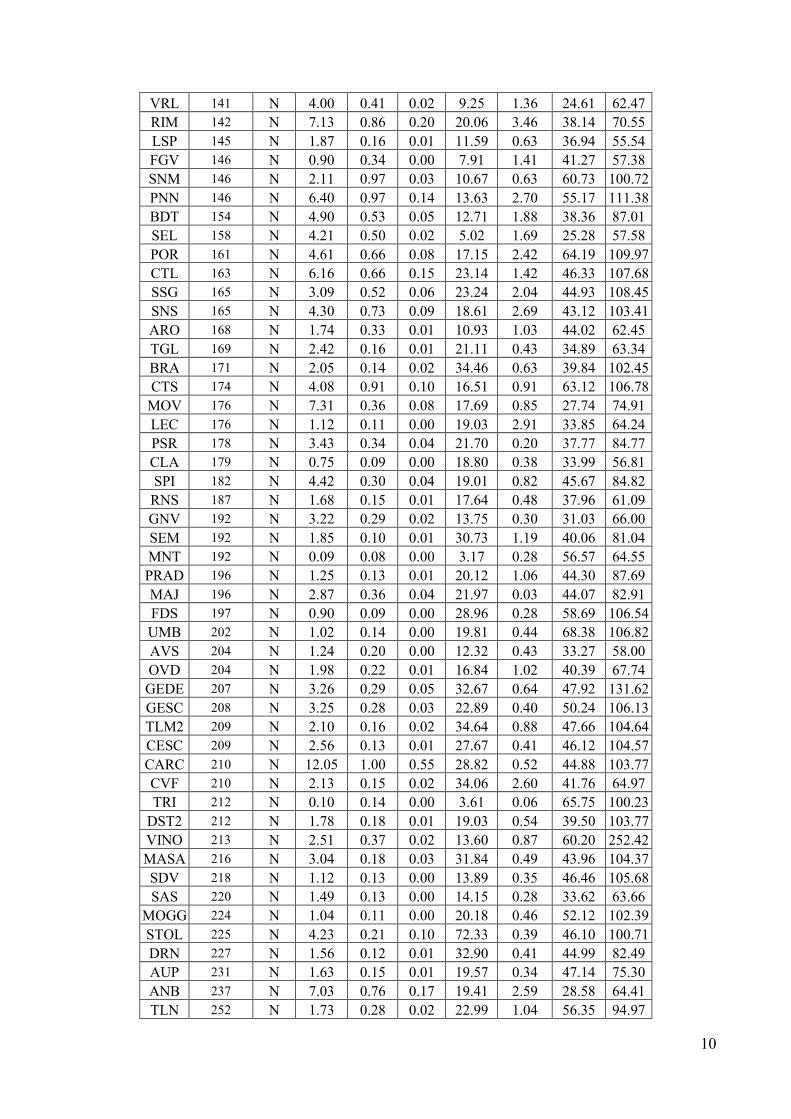
Peak and integral parameters defined in section 1are computed for the uncorrected waveforms
for the two horizontal components (N-S, E-W) and for the vertical component (Z).
Table 2. Peak and integral parameters estimated on the uncorrected waveforms of the N-S component
Station ID
Repi Comp PGA PGV IA ID H50 Sd Bd
km cm/s2 cm/s cm/s cm s s MRN 16 N 259.11 47.16 87.05 4.45 129.12 6.00 17.70 MDN 41 N 32.77 3.74 2.72 13.87 12.39 32.51 76.32 NVL 42 N 51.07 2.42 2.64 13.34 7.21 18.14 51.25 ZPP 43 N 22.84 4.40 2.87 17.84 15.77 51.66 114.29 ISD 47 N 16.48 1.81 0.95 19.90 7.11 58.23 123.50 CPC 49 N 33.21 7.07 3.28 8.73 15.93 32.51 91.32 ARG 53 N 16.90 2.50 1.18 17.45 1.30 33.64 122.63

9
SSU 54 N 16.44 1.70 0.90 20.13 7.03 32.03 81.34 MDC 56 N 38.90 5.37 3.14 9.38 13.16 68.25 111.77 MNS 58 N 16.43 0.57 0.49 32.39 5.66 15.96 58.57 MRZ 61 N 3.48 0.63 0.04 12.14 1.23 38.05 67.23 SRP 64 N 24.05 2.64 0.80 7.85 10.60 43.95 79.17 CSP 64 N 15.21 5.10 1.70 13.68 7.82 54.70 112.42 PVF 72 N 4.83 1.14 0.09 9.84 2.92 51.01 110.70 TGG 73 N 5.95 0.25 0.09 37.28 0.61 28.53 94.24 PAR 76 N 6.00 0.91 0.11 13.14 10.26 52.68 93.27 ALF 78 N 26.87 3.63 1.62 10.39 2.80 57.18 117.23 LNG 80 N 5.81 0.69 0.14 21.55 3.09 50.03 106.85 FRE1 87 N 6.60 0.80 0.17 19.48 3.24 28.83 64.24 BRH 88 N 11.24 1.05 0.31 16.14 2.70 39.27 93.92 FRN 93 N 0.00 0.00 0.00 21.89 1.77 138.06 153.12 MDG 94 N 10.44 0.93 0.15 9.94 0.00 35.94 69.54 MRR 97 N 7.09 0.40 0.09 18.58 3.11 26.84 53.85 MDT 97 N 8.16 1.09 0.23 16.17 1.24 41.77 96.59 BSZ 98 N 1.84 0.49 0.01 8.46 1.76 44.36 63.07 SMP 98 N 5.41 0.76 0.08 12.43 2.10 33.26 75.70 GAI 99 N 13.27 1.08 0.34 14.64 0.83 20.71 53.91 PTV 100 N 10.84 1.46 0.43 17.12 2.58 75.27 117.87 CST 101 N 10.52 0.66 0.22 19.84 4.48 37.41 100.68 PIT 105 N 4.05 0.44 0.04 12.62 1.19 35.99 67.72
BRB 105 N 4.38 0.52 0.04 12.30 1.24 44.22 73.10 MLC 106 N 10.47 0.45 0.30 39.93 1.58 27.91 75.09 SNZ1 109 N 11.91 1.20 0.27 11.60 4.26 71.09 114.00 BRR 109 N 5.57 0.31 0.05 19.55 5.28 28.53 70.33 PZS 110 N 4.07 0.64 0.06 15.06 1.44 25.23 67.03 CNF 111 N 2.72 0.47 0.02 9.09 2.85 34.44 65.13 MLD 111 N 20.04 1.66 0.72 13.47 1.43 23.55 48.84 PRM 111 N 2.61 0.49 0.02 11.28 1.25 58.89 118.43 BGL 114 N 4.02 0.49 0.04 12.02 1.53 30.00 65.95 CVT 115 N 6.57 0.63 0.08 12.68 2.23 33.52 50.92 DCM 115 N 3.39 0.73 0.03 6.49 1.61 35.61 61.76 FVZ 116 N 4.19 0.42 0.04 13.76 1.74 29.27 64.14 VGL 117 N 8.71 0.63 0.20 22.80 1.98 30.73 66.77 BGN 118 N 3.20 0.48 0.02 8.17 1.96 26.90 49.86 RNC 119 N 2.64 0.59 0.02 8.49 2.16 40.26 115.63 STS 119 N 4.34 0.65 0.07 15.14 1.35 26.57 50.44 CES 120 N 11.06 2.16 0.40 10.51 5.66 76.34 114.11 FIE 122 N 1.16 0.49 0.01 7.33 0.64 52.11 86.00
PNM 124 N 2.93 0.23 0.02 21.91 0.90 30.34 64.33 AUL 128 N 4.87 0.53 0.06 14.66 2.27 27.38 74.43 RVR 131 N 3.56 0.48 0.04 14.95 1.76 34.28 63.82 TVR 133 N 2.26 0.56 0.02 9.60 1.43 60.94 115.80 BDG 134 N 8.31 0.66 0.09 10.68 1.88 33.29 69.74 BBN 135 N 2.20 0.40 0.01 10.58 0.51 33.47 69.62 CNG 136 N 8.61 0.88 0.20 16.58 1.29 34.59 76.20 FLP 137 N 11.93 0.28 0.28 52.01 2.38 29.28 58.50
10
VRL 141 N 4.00 0.41 0.02 9.25 1.36 24.61 62.47 RIM 142 N 7.13 0.86 0.20 20.06 3.46 38.14 70.55 LSP 145 N 1.87 0.16 0.01 11.59 0.63 36.94 55.54 FGV 146 N 0.90 0.34 0.00 7.91 1.41 41.27 57.38 SNM 146 N 2.11 0.97 0.03 10.67 0.63 60.73 100.72 PNN 146 N 6.40 0.97 0.14 13.63 2.70 55.17 111.38 BDT 154 N 4.90 0.53 0.05 12.71 1.88 38.36 87.01 SEL 158 N 4.21 0.50 0.02 5.02 1.69 25.28 57.58 POR 161 N 4.61 0.66 0.08 17.15 2.42 64.19 109.97 CTL 163 N 6.16 0.66 0.15 23.14 1.42 46.33 107.68 SSG 165 N 3.09 0.52 0.06 23.24 2.04 44.93 108.45 SNS 165 N 4.30 0.73 0.09 18.61 2.69 43.12 103.41 ARO 168 N 1.74 0.33 0.01 10.93 1.03 44.02 62.45 TGL 169 N 2.42 0.16 0.01 21.11 0.43 34.89 63.34 BRA 171 N 2.05 0.14 0.02 34.46 0.63 39.84 102.45 CTS 174 N 4.08 0.91 0.10 16.51 0.91 63.12 106.78
MOV 176 N 7.31 0.36 0.08 17.69 0.85 27.74 74.91 LEC 176 N 1.12 0.11 0.00 19.03 2.91 33.85 64.24 PSR 178 N 3.43 0.34 0.04 21.70 0.20 37.77 84.77 CLA 179 N 0.75 0.09 0.00 18.80 0.38 33.99 56.81 SPI 182 N 4.42 0.30 0.04 19.01 0.82 45.67 84.82
RNS 187 N 1.68 0.15 0.01 17.64 0.48 37.96 61.09 GNV 192 N 3.22 0.29 0.02 13.75 0.30 31.03 66.00 SEM 192 N 1.85 0.10 0.01 30.73 1.19 40.06 81.04 MNT 192 N 0.09 0.08 0.00 3.17 0.28 56.57 64.55 PRAD 196 N 1.25 0.13 0.01 20.12 1.06 44.30 87.69 MAJ 196 N 2.87 0.36 0.04 21.97 0.03 44.07 82.91 FDS 197 N 0.90 0.09 0.00 28.96 0.28 58.69 106.54 UMB 202 N 1.02 0.14 0.00 19.81 0.44 68.38 106.82 AVS 204 N 1.24 0.20 0.00 12.32 0.43 33.27 58.00 OVD 204 N 1.98 0.22 0.01 16.84 1.02 40.39 67.74 GEDE 207 N 3.26 0.29 0.05 32.67 0.64 47.92 131.62 GESC 208 N 3.25 0.28 0.03 22.89 0.40 50.24 106.13 TLM2 209 N 2.10 0.16 0.02 34.64 0.88 47.66 104.64 CESC 209 N 2.56 0.13 0.01 27.67 0.41 46.12 104.57 CARC 210 N 12.05 1.00 0.55 28.82 0.52 44.88 103.77 CVF 210 N 2.13 0.15 0.02 34.06 2.60 41.76 64.97 TRI 212 N 0.10 0.14 0.00 3.61 0.06 65.75 100.23
DST2 212 N 1.78 0.18 0.01 19.03 0.54 39.50 103.77 VINO 213 N 2.51 0.37 0.02 13.60 0.87 60.20 252.42 MASA 216 N 3.04 0.18 0.03 31.84 0.49 43.96 104.37 SDV 218 N 1.12 0.13 0.00 13.89 0.35 46.46 105.68 SAS 220 N 1.49 0.13 0.00 14.15 0.28 33.62 63.66
MOGG 224 N 1.04 0.11 0.00 20.18 0.46 52.12 102.39 STOL 225 N 4.23 0.21 0.10 72.33 0.39 46.10 100.71 DRN 227 N 1.56 0.12 0.01 32.90 0.41 44.99 82.49 AUP 231 N 1.63 0.15 0.01 19.57 0.34 47.14 75.30 ANB 237 N 7.03 0.76 0.17 19.41 2.59 28.58 64.41 TLN 252 N 1.73 0.28 0.02 22.99 1.04 56.35 94.97
11
MCT 255 N 3.00 0.50 0.05 19.15 1.39 57.64 94.71 TNS 282 N 1.40 0.18 0.01 20.18 0.72 36.06 68.84 TNO 286 N 1.18 0.36 0.01 14.09 0.39 53.31 71.83 CSC 286 N 0.61 0.11 0.00 19.91 0.81 65.80 117.07 RQT 291 N 0.65 0.03 0.00 45.34 0.10 32.45 37.41 PNR 309 N 0.44 0.07 0.00 35.12 0.27 67.10 111.84 SBT 311 N 1.64 0.55 0.01 10.46 1.13 52.57 66.00 SDM 353 N 0.36 0.11 0.00 15.96 0.29 65.12 113.29 MTC 442 N 0.12 0.02 0.00 25.90 0.06 67.75 107.13 SNN 503 N 0.21 0.01 0.00 44.23 0.02 63.90 98.27 BENI 521 N 0.05 0.01 0.00 17.94 0.03 36.93 55.27 NAPI 522 N 0.06 0.01 0.00 12.27 0.04 45.46 61.41 SSB3 549 N 0.04 0.01 0.00 11.81 0.02 40.92 57.82 RSF3 557 N 0.03 0.01 0.00 10.05 0.02 41.58 58.46 MNT3 560 N 0.03 0.01 0.00 14.85 0.01 40.87 59.40 LIO3 564 N 0.02 0.01 0.00 6.46 0.01 39.81 59.13 NSC3 565 N 0.03 0.01 0.00 12.93 0.01 42.78 59.54 AND3 568 N 0.04 0.01 0.00 12.17 0.02 44.03 60.31 CLT3 575 N 0.12 0.01 0.00 28.41 0.02 42.87 61.34 SNR3 579 N 0.04 0.01 0.00 20.28 0.02 43.56 61.46 CMP3 582 N 0.05 0.01 0.00 17.28 0.01 43.69 62.38 RDM3 584 N 0.05 0.02 0.00 9.54 0.03 46.96 53.78 COL3 591 N 0.03 0.01 0.00 16.56 0.02 46.48 63.50 VDS3 591 N 0.05 0.01 0.00 19.75 0.01 46.15 55.67 SFL3 594 N 0.02 0.00 0.00 17.27 0.01 48.35 64.34 PST3 598 N 0.02 0.01 0.00 12.45 0.01 48.35 64.52 BEL3 604 N 0.02 0.01 0.00 12.97 0.01 45.47 64.68 AVG3 605 N 0.03 0.01 0.00 9.95 0.02 45.45 66.24 CGG3 614 N 0.03 0.01 0.00 10.87 0.01 49.57 67.10 SRN3 616 N 0.02 0.01 0.00 22.11 0.01 49.17 66.96 STN3 622 N 0.02 0.01 0.00 9.11 0.01 48.10 68.22 PGN3 626 N 0.02 0.01 0.00 8.47 0.01 52.64 68.45 MRN3 636 N 0.02 0.01 0.00 15.44 0.01 49.25 67.52
VGG3 653 N 0.02 0.01 0.00 4.01 0.01 50.49 65.54
Table 3. Peak and integral parameters estimated on the uncorrected waveforms of the E-W component
Station ID
Repi Comp PGA PGV IA ID H50 Sd Bd
km cm/s2 cm/s cm/s cm s s MRN 16 E 256.13 29.61 71.72 5.91 82.08 5.69 17.82 MDN 41 E 36.32 6.74 3.59 9.17 14.42 31.88 83.83 NVL 42 E 47.46 2.86 2.79 12.84 7.71 17.99 57.51 ZPP 43 E 15.79 3.25 1.61 19.63 9.10 63.24 127.04 ISD 47 E 13.05 2.06 0.97 22.60 7.71 67.68 129.08 CPC 49 E 24.52 4.67 2.12 11.58 12.77 36.26 81.64 ARG 53 E 23.81 3.89 1.47 9.89 1.33 44.85 94.86 SSU 54 E 22.25 2.03 1.17 16.17 9.65 30.75 71.06 MDC 56 E 24.42 4.41 2.39 13.86 10.06 92.39 122.08 MNS 58 E 17.74 0.73 0.47 22.45 6.44 15.70 53.79

12
MRZ 61 E 3.21 0.46 0.03 11.41 0.83 38.84 66.94 SRP 64 E 40.75 3.96 1.31 5.05 6.15 40.04 96.60 CSP 64 E 10.49 3.92 0.92 13.94 11.51 63.25 121.19 PVF 72 E 3.49 0.95 0.07 12.57 2.47 71.03 106.85 TGG 73 E 9.53 0.38 0.22 38.03 0.77 24.62 70.76 PAR 76 E 7.72 1.11 0.15 10.59 11.33 48.54 96.93 ALF 78 E 33.05 4.05 1.87 8.71 3.93 62.39 116.21 LNG 80 E 4.62 0.93 0.12 17.79 2.86 59.86 105.59 FRE1 87 E 9.07 0.72 0.21 19.86 3.68 30.87 64.12 BRH 88 E 12.95 1.63 0.42 12.57 2.02 42.66 73.58 FRN 93 E 7.94 0.74 0.20 20.79 1.64 38.60 107.09 MDG 94 E 9.17 0.74 0.14 13.03 2.81 40.03 83.13 MRR 97 E 6.34 0.46 0.10 20.99 3.22 29.05 56.20 MDT 97 E 8.41 1.04 0.23 16.68 1.26 41.84 99.80 BSZ 98 E 1.53 0.35 0.01 9.62 2.71 48.14 62.63 SMP 98 E 4.07 0.55 0.05 14.94 1.83 31.67 79.12 GAI 99 E 23.76 0.94 0.68 18.99 0.61 16.67 49.35 PTV 100 E 9.71 1.49 0.42 18.01 1.81 77.71 117.13 CST 101 E 9.77 0.61 0.24 25.02 4.31 41.78 94.21 PIT 105 E 2.75 0.39 0.03 17.11 1.16 34.50 68.21
BRB 105 E 3.40 0.50 0.04 16.11 1.64 40.98 73.19 MLC 106 E 15.64 0.54 0.42 31.25 1.74 22.59 55.92 SNZ1 109 E 10.83 0.96 0.29 17.42 3.13 84.62 115.08 BRR 109 E 5.89 0.52 0.07 15.07 6.80 24.30 68.56 PZS 110 E 4.51 0.61 0.05 11.91 1.59 29.95 67.40 CNF 111 E 2.37 0.45 0.02 12.67 2.29 34.02 65.73 MLD 111 E 22.34 1.69 0.75 12.39 1.49 21.24 48.74 PRM 111 E 3.37 0.47 0.02 9.67 1.29 51.38 96.17 BGL 114 E 6.49 1.03 0.06 5.66 1.93 25.85 65.55 CVT 115 E 8.30 0.68 0.14 15.48 1.00 25.23 51.08 DCM 115 E 1.83 0.39 0.01 11.27 2.46 40.63 63.43 FVZ 116 E 4.10 0.32 0.04 19.39 1.05 31.00 65.10 VGL 117 E 0.17 0.07 0.00 4.33 0.04 37.17 89.53 BGN 118 E 2.31 0.28 0.01 13.12 1.35 31.84 50.08 RNC 119 E 2.02 0.35 0.01 11.77 1.77 61.92 108.00 STS 119 E 4.94 0.70 0.05 9.24 1.03 31.16 50.78 CES 120 E 10.71 2.36 0.60 14.83 8.49 72.97 113.01 FIE 122 E 1.66 0.36 0.01 7.61 1.04 37.12 58.46
PNM 124 E 2.91 0.21 0.03 29.20 0.93 32.31 65.19 AUL 128 E 4.37 0.66 0.08 17.21 1.96 29.81 74.51 RVR 131 E 6.98 0.66 0.07 9.65 2.21 33.46 63.27 TVR 133 E 2.35 0.54 0.02 9.18 1.75 58.61 112.84 BDG 134 E 6.05 0.57 0.08 15.15 1.77 32.71 85.19 BBN 135 E 2.58 0.54 0.02 8.05 0.55 35.18 67.67 CNG 136 E 8.43 0.73 0.16 15.83 1.67 39.64 76.36 FLP 137 E 15.13 0.29 0.29 41.06 2.14 32.04 62.13 VRL 141 E 3.26 0.34 0.03 15.75 1.27 29.87 63.75 RIM 142 E 5.95 0.86 0.14 17.66 3.49 35.10 69.29 LSP 145 E 1.45 0.28 0.01 9.78 0.87 34.64 56.18

13
FGV 146 E 1.28 0.35 0.01 7.12 2.62 33.16 56.14 SNM 146 E 3.49 1.19 0.08 11.40 0.81 65.00 99.67 PNN 146 E 5.96 0.84 0.17 20.75 2.44 52.31 112.51 BDT 154 E 2.62 0.41 0.03 18.21 1.41 48.99 88.69 SEL 158 E 2.75 0.30 0.01 7.73 1.55 32.98 60.41 POR 161 E 4.01 0.71 0.09 19.60 3.33 61.95 109.63 CTL 163 E 6.84 0.91 0.21 20.72 1.07 50.49 107.00 SSG 165 E 4.35 0.70 0.07 13.40 2.51 50.43 107.99 SNS 165 E 4.73 0.79 0.10 17.43 3.05 40.79 103.37 ARO 168 E 1.67 0.25 0.01 14.18 0.89 37.56 62.47 TGL 169 E 2.60 0.24 0.02 16.92 0.41 32.15 64.03 BRA 171 E 2.31 0.13 0.02 35.31 0.92 42.70 93.22 CTS 174 E 3.49 0.91 0.06 12.35 0.69 72.58 106.28
MOV 176 E 3.49 0.28 0.03 17.44 0.71 42.48 77.07 LEC 176 E 1.15 0.12 0.00 16.37 2.36 29.05 63.71 PSR 178 E 3.28 0.27 0.03 24.45 0.21 52.27 85.26 CLA 179 E 0.77 0.10 0.00 11.70 0.37 37.10 56.87 SPI 182 E 2.64 0.37 0.04 22.77 0.77 46.18 85.07
RNS 187 E 2.41 0.17 0.01 13.90 0.54 40.84 61.94 GNV 192 E 3.36 0.29 0.02 15.39 0.40 34.55 67.97 SEM 192 E 2.55 0.14 0.02 28.86 1.03 33.53 75.85 MNT 192 E 0.40 0.08 0.00 12.90 0.20 29.06 38.76 PRAD 196 E 1.13 0.10 0.00 22.28 1.05 48.56 87.28 MAJ 196 E 2.56 0.33 0.03 23.35 0.29 42.36 82.95 FDS 197 E 0.93 0.13 0.00 20.24 0.33 56.80 107.36 UMB 202 E 0.82 0.20 0.00 16.01 0.48 62.41 106.32 AVS 204 E 1.36 0.24 0.01 12.37 0.51 31.51 57.94 OVD 204 E 2.46 0.23 0.01 15.22 1.01 40.14 68.20 GEDE 207 E 2.77 0.36 0.04 24.91 0.77 50.54 134.50 GESC 208 E 3.24 0.27 0.04 25.75 0.48 52.56 104.85 TLM2 209 E 2.21 0.18 0.03 43.15 0.82 43.39 104.93 CESC 209 E 5.34 0.29 0.07 29.17 0.87 40.41 90.95 CARC 210 E 10.53 0.81 0.61 44.49 0.59 41.99 103.72 CVF 210 E 2.69 0.20 0.02 22.74 2.42 33.15 64.97 TRI 212 E 0.09 0.06 0.00 7.65 0.07 69.90 106.94
DST2 212 E 1.63 0.13 0.01 29.42 0.53 44.49 104.26 VINO 213 E 2.33 0.27 0.02 20.80 0.80 70.88 261.96 MASA 216 E 2.57 0.15 0.02 33.11 0.44 47.33 103.78 SDV 218 E 0.85 0.10 0.00 27.83 0.37 52.54 106.58 SAS 220 E 1.30 0.12 0.00 14.47 0.31 45.98 64.53
MOGG 224 E 1.14 0.14 0.01 22.56 0.41 49.06 102.74 STOL 225 E 3.77 0.18 0.07 61.30 0.38 48.57 102.52 DRN 227 E 2.10 0.15 0.02 29.95 0.48 41.77 82.27 AUP 231 E 1.98 0.13 0.01 26.25 0.35 47.01 74.57 ANB 237 E 7.51 0.64 0.14 18.81 2.30 30.67 64.06 TLN 252 E 2.62 0.43 0.03 19.21 1.66 53.79 94.84 MCT 255 E 3.30 0.43 0.06 27.04 1.79 60.45 94.60 TNS 282 E 1.19 0.17 0.01 22.72 0.66 36.36 68.98 TNO 286 E 1.01 0.32 0.01 15.38 0.40 47.99 71.94

14
CSC 286 E 0.63 0.17 0.00 13.55 0.71 61.33 122.54 RQT 291 E 0.60 0.05 0.00 24.95 0.11 33.05 37.14 PNR 309 E 0.57 0.08 0.00 26.06 0.34 55.03 93.24 SBT 311 E 1.81 0.51 0.02 12.58 1.07 51.31 66.00 SDM 353 E 0.49 0.13 0.00 14.53 0.43 60.65 88.80 MTC 442 E 0.14 0.05 0.00 11.72 0.07 64.16 107.14 SNN 503 E 0.33 0.02 0.00 32.47 0.02 62.16 88.80 BENI 521 E 0.06 0.01 0.00 17.09 0.04 37.42 54.82 NAPI 522 E 0.04 0.01 0.00 11.42 0.03 47.96 61.41 SSB3 549 E 0.03 0.01 0.00 9.78 0.02 41.88 58.06 RSF3 557 E 0.03 0.01 0.00 11.65 0.02 42.13 58.46 MNT3 560 E 0.02 0.00 0.00 17.72 0.01 43.29 59.42 LIO3 564 E 0.02 0.01 0.00 10.75 0.02 38.59 59.34 NSC3 565 E 0.02 0.01 0.00 12.44 0.02 42.31 59.58 AND3 568 E 0.05 0.01 0.00 13.34 0.03 42.53 60.27 CLT3 575 E 0.16 0.01 0.00 20.24 0.02 42.36 61.36 SNR3 579 E 0.03 0.01 0.00 11.73 0.01 42.76 61.46 CMP3 582 E 0.04 0.01 0.00 18.63 0.01 44.97 62.33 RDM3 584 E 0.06 0.02 0.00 7.68 0.04 46.64 55.48 COL3 591 E 0.06 0.01 0.00 12.64 0.02 45.91 63.50 VDS3 591 E 0.05 0.01 0.00 25.72 0.01 45.88 63.22 SFL3 594 E 0.03 0.01 0.00 12.78 0.02 45.66 64.26 PST3 598 E 0.03 0.00 0.00 24.89 0.01 47.83 64.50 BEL3 604 E 0.05 0.01 0.00 11.86 0.03 44.77 57.50 AVG3 605 E 0.03 0.01 0.00 8.89 0.02 47.63 66.30 CGG3 614 E 0.05 0.01 0.00 18.67 0.01 48.58 67.04 SRN3 616 E 0.02 0.00 0.00 18.91 0.01 47.29 66.66 STN3 622 E 0.02 0.01 0.00 10.02 0.01 48.91 68.24 PGN3 626 E 0.01 0.01 0.00 10.86 0.01 51.41 68.46 MRN3 636 E 0.02 0.01 0.00 8.23 0.01 50.20 67.52 VGG3 653 E 0.01 0.00 0.00 10.70 0.01 47.69 65.54
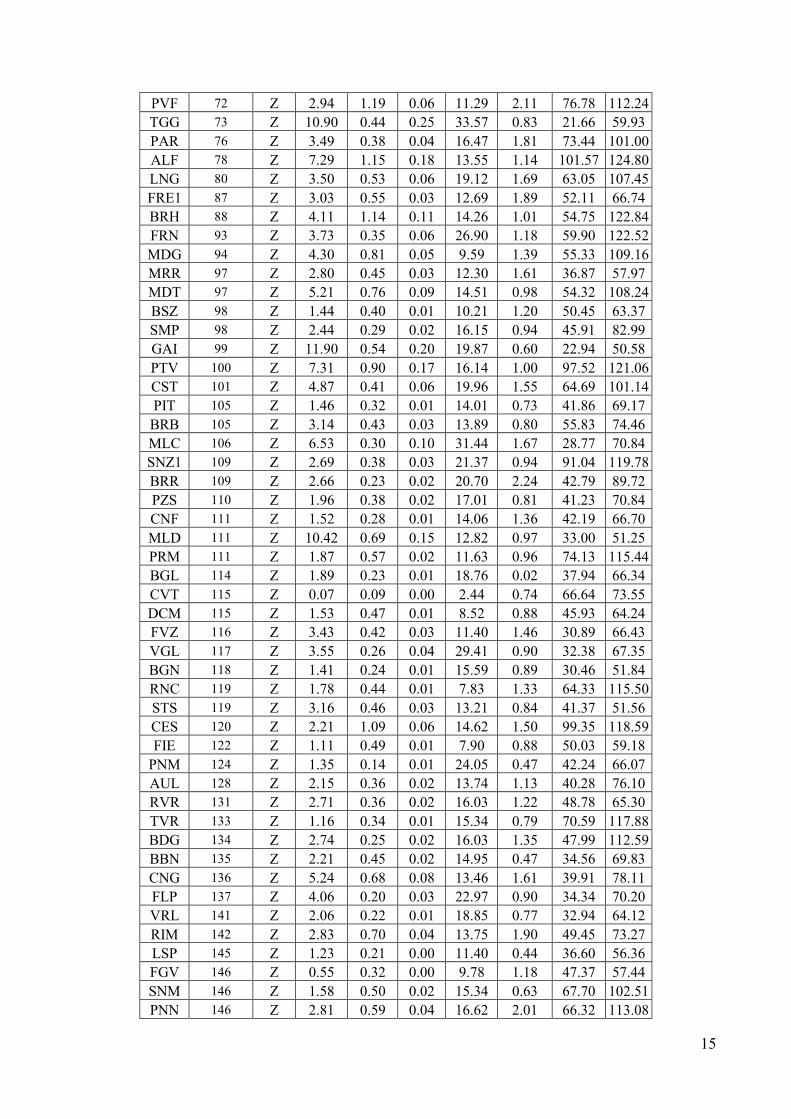
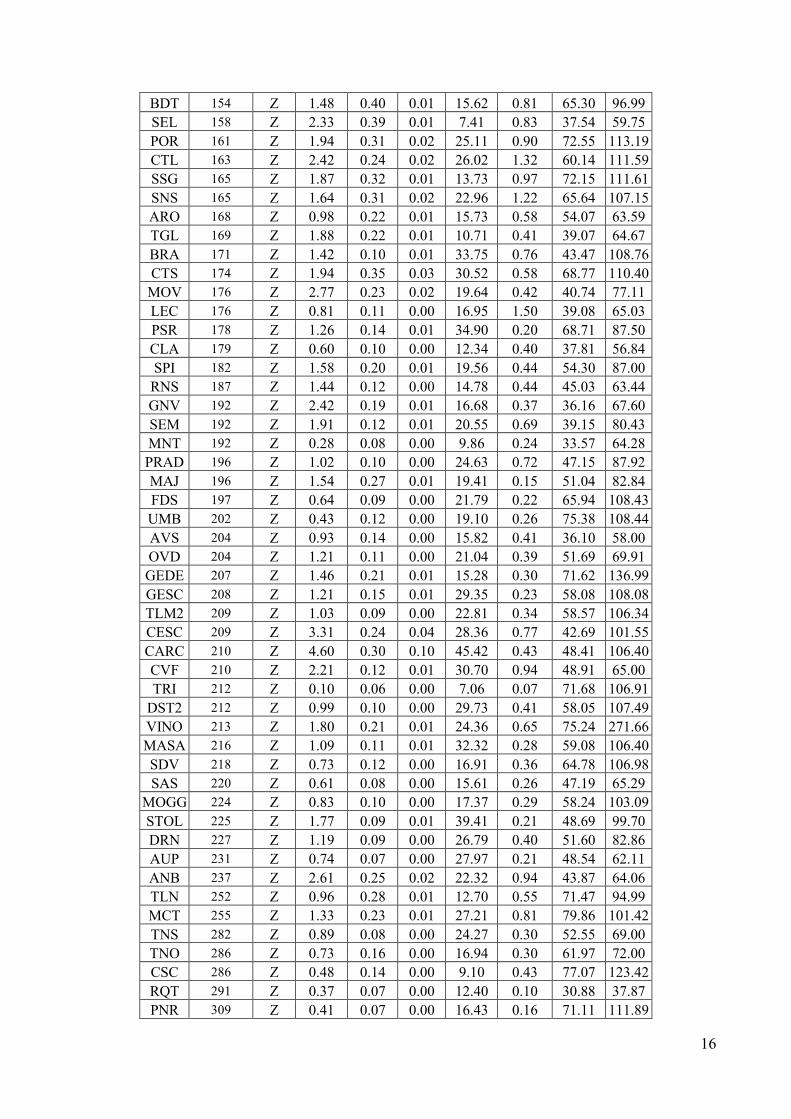
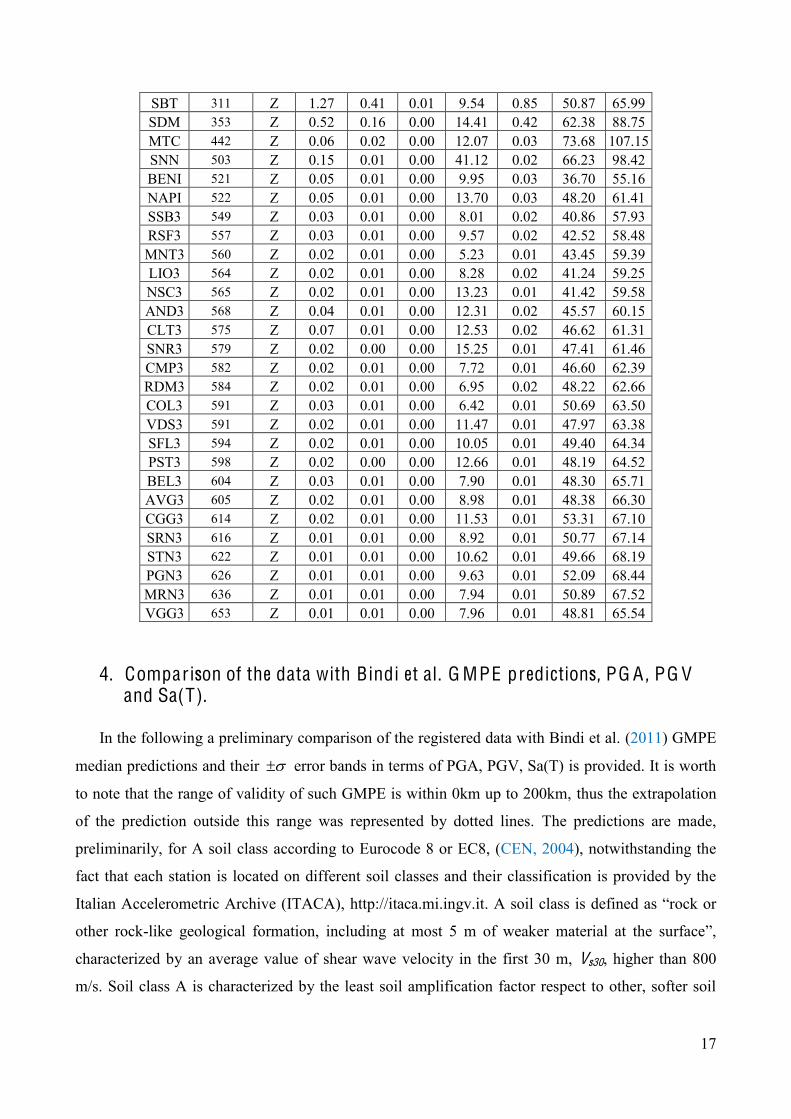
Table 4. Peak and integral parameters estimated on the uncorrected waveforms of the Z component.
Station name
Repi Comp PGA PGV IA ID H50 Sd Bd
km cm/s2 cm/s cm/s cm s s MRN 16 Z 303.30 5.96 49.93 17.26 16.25 5.77 11.85 MDN 41 Z 28.74 1.62 1.33 17.74 5.42 24.92 79.41 NVL 42 Z 28.72 0.98 0.93 20.71 1.69 20.61 44.91 ZPP 43 Z 19.64 2.04 0.90 13.93 4.69 49.74 89.14 ISD 47 Z 8.95 1.04 0.23 15.37 2.43 88.64 130.51 CPC 49 Z 11.24 1.18 0.31 14.69 1.92 62.95 122.43 ARG 53 Z 10.11 1.08 0.20 11.68 1.19 42.76 124.78 SSU 54 Z 11.39 1.23 0.35 15.78 2.49 32.79 67.38 MDC 56 Z 11.65 2.39 0.44 9.81 3.95 79.41 128.67 MNS 58 Z 10.41 0.51 0.15 18.03 3.43 21.27 58.83 MRZ 61 Z 2.33 0.69 0.02 9.20 0.99 49.38 68.41 SRP 64 Z 7.76 0.37 0.16 35.36 3.73 74.90 126.28 CSP 64 Z 6.63 1.89 0.33 16.56 1.29 66.20 126.62
15
PVF 72 Z 2.94 1.19 0.06 11.29 2.11 76.78 112.24 TGG 73 Z 10.90 0.44 0.25 33.57 0.83 21.66 59.93 PAR 76 Z 3.49 0.38 0.04 16.47 1.81 73.44 101.00 ALF 78 Z 7.29 1.15 0.18 13.55 1.14 101.57 124.80 LNG 80 Z 3.50 0.53 0.06 19.12 1.69 63.05 107.45 FRE1 87 Z 3.03 0.55 0.03 12.69 1.89 52.11 66.74 BRH 88 Z 4.11 1.14 0.11 14.26 1.01 54.75 122.84 FRN 93 Z 3.73 0.35 0.06 26.90 1.18 59.90 122.52 MDG 94 Z 4.30 0.81 0.05 9.59 1.39 55.33 109.16 MRR 97 Z 2.80 0.45 0.03 12.30 1.61 36.87 57.97 MDT 97 Z 5.21 0.76 0.09 14.51 0.98 54.32 108.24 BSZ 98 Z 1.44 0.40 0.01 10.21 1.20 50.45 63.37 SMP 98 Z 2.44 0.29 0.02 16.15 0.94 45.91 82.99 GAI 99 Z 11.90 0.54 0.20 19.87 0.60 22.94 50.58 PTV 100 Z 7.31 0.90 0.17 16.14 1.00 97.52 121.06 CST 101 Z 4.87 0.41 0.06 19.96 1.55 64.69 101.14 PIT 105 Z 1.46 0.32 0.01 14.01 0.73 41.86 69.17
BRB 105 Z 3.14 0.43 0.03 13.89 0.80 55.83 74.46 MLC 106 Z 6.53 0.30 0.10 31.44 1.67 28.77 70.84 SNZ1 109 Z 2.69 0.38 0.03 21.37 0.94 91.04 119.78 BRR 109 Z 2.66 0.23 0.02 20.70 2.24 42.79 89.72 PZS 110 Z 1.96 0.38 0.02 17.01 0.81 41.23 70.84 CNF 111 Z 1.52 0.28 0.01 14.06 1.36 42.19 66.70 MLD 111 Z 10.42 0.69 0.15 12.82 0.97 33.00 51.25 PRM 111 Z 1.87 0.57 0.02 11.63 0.96 74.13 115.44 BGL 114 Z 1.89 0.23 0.01 18.76 0.02 37.94 66.34 CVT 115 Z 0.07 0.09 0.00 2.44 0.74 66.64 73.55 DCM 115 Z 1.53 0.47 0.01 8.52 0.88 45.93 64.24 FVZ 116 Z 3.43 0.42 0.03 11.40 1.46 30.89 66.43 VGL 117 Z 3.55 0.26 0.04 29.41 0.90 32.38 67.35 BGN 118 Z 1.41 0.24 0.01 15.59 0.89 30.46 51.84 RNC 119 Z 1.78 0.44 0.01 7.83 1.33 64.33 115.50 STS 119 Z 3.16 0.46 0.03 13.21 0.84 41.37 51.56 CES 120 Z 2.21 1.09 0.06 14.62 1.50 99.35 118.59 FIE 122 Z 1.11 0.49 0.01 7.90 0.88 50.03 59.18
PNM 124 Z 1.35 0.14 0.01 24.05 0.47 42.24 66.07 AUL 128 Z 2.15 0.36 0.02 13.74 1.13 40.28 76.10 RVR 131 Z 2.71 0.36 0.02 16.03 1.22 48.78 65.30 TVR 133 Z 1.16 0.34 0.01 15.34 0.79 70.59 117.88 BDG 134 Z 2.74 0.25 0.02 16.03 1.35 47.99 112.59 BBN 135 Z 2.21 0.45 0.02 14.95 0.47 34.56 69.83 CNG 136 Z 5.24 0.68 0.08 13.46 1.61 39.91 78.11 FLP 137 Z 4.06 0.20 0.03 22.97 0.90 34.34 70.20 VRL 141 Z 2.06 0.22 0.01 18.85 0.77 32.94 64.12 RIM 142 Z 2.83 0.70 0.04 13.75 1.90 49.45 73.27 LSP 145 Z 1.23 0.21 0.00 11.40 0.44 36.60 56.36 FGV 146 Z 0.55 0.32 0.00 9.78 1.18 47.37 57.44 SNM 146 Z 1.58 0.50 0.02 15.34 0.63 67.70 102.51 PNN 146 Z 2.81 0.59 0.04 16.62 2.01 66.32 113.08
16
BDT 154 Z 1.48 0.40 0.01 15.62 0.81 65.30 96.99 SEL 158 Z 2.33 0.39 0.01 7.41 0.83 37.54 59.75 POR 161 Z 1.94 0.31 0.02 25.11 0.90 72.55 113.19 CTL 163 Z 2.42 0.24 0.02 26.02 1.32 60.14 111.59 SSG 165 Z 1.87 0.32 0.01 13.73 0.97 72.15 111.61 SNS 165 Z 1.64 0.31 0.02 22.96 1.22 65.64 107.15 ARO 168 Z 0.98 0.22 0.01 15.73 0.58 54.07 63.59 TGL 169 Z 1.88 0.22 0.01 10.71 0.41 39.07 64.67 BRA 171 Z 1.42 0.10 0.01 33.75 0.76 43.47 108.76 CTS 174 Z 1.94 0.35 0.03 30.52 0.58 68.77 110.40
MOV 176 Z 2.77 0.23 0.02 19.64 0.42 40.74 77.11 LEC 176 Z 0.81 0.11 0.00 16.95 1.50 39.08 65.03 PSR 178 Z 1.26 0.14 0.01 34.90 0.20 68.71 87.50 CLA 179 Z 0.60 0.10 0.00 12.34 0.40 37.81 56.84 SPI 182 Z 1.58 0.20 0.01 19.56 0.44 54.30 87.00
RNS 187 Z 1.44 0.12 0.00 14.78 0.44 45.03 63.44 GNV 192 Z 2.42 0.19 0.01 16.68 0.37 36.16 67.60 SEM 192 Z 1.91 0.12 0.01 20.55 0.69 39.15 80.43 MNT 192 Z 0.28 0.08 0.00 9.86 0.24 33.57 64.28 PRAD 196 Z 1.02 0.10 0.00 24.63 0.72 47.15 87.92 MAJ 196 Z 1.54 0.27 0.01 19.41 0.15 51.04 82.84 FDS 197 Z 0.64 0.09 0.00 21.79 0.22 65.94 108.43 UMB 202 Z 0.43 0.12 0.00 19.10 0.26 75.38 108.44 AVS 204 Z 0.93 0.14 0.00 15.82 0.41 36.10 58.00 OVD 204 Z 1.21 0.11 0.00 21.04 0.39 51.69 69.91 GEDE 207 Z 1.46 0.21 0.01 15.28 0.30 71.62 136.99 GESC 208 Z 1.21 0.15 0.01 29.35 0.23 58.08 108.08 TLM2 209 Z 1.03 0.09 0.00 22.81 0.34 58.57 106.34 CESC 209 Z 3.31 0.24 0.04 28.36 0.77 42.69 101.55 CARC 210 Z 4.60 0.30 0.10 45.42 0.43 48.41 106.40 CVF 210 Z 2.21 0.12 0.01 30.70 0.94 48.91 65.00 TRI 212 Z 0.10 0.06 0.00 7.06 0.07 71.68 106.91
DST2 212 Z 0.99 0.10 0.00 29.73 0.41 58.05 107.49 VINO 213 Z 1.80 0.21 0.01 24.36 0.65 75.24 271.66 MASA 216 Z 1.09 0.11 0.01 32.32 0.28 59.08 106.40 SDV 218 Z 0.73 0.12 0.00 16.91 0.36 64.78 106.98 SAS 220 Z 0.61 0.08 0.00 15.61 0.26 47.19 65.29
MOGG 224 Z 0.83 0.10 0.00 17.37 0.29 58.24 103.09 STOL 225 Z 1.77 0.09 0.01 39.41 0.21 48.69 99.70 DRN 227 Z 1.19 0.09 0.00 26.79 0.40 51.60 82.86 AUP 231 Z 0.74 0.07 0.00 27.97 0.21 48.54 62.11 ANB 237 Z 2.61 0.25 0.02 22.32 0.94 43.87 64.06 TLN 252 Z 0.96 0.28 0.01 12.70 0.55 71.47 94.99 MCT 255 Z 1.33 0.23 0.01 27.21 0.81 79.86 101.42 TNS 282 Z 0.89 0.08 0.00 24.27 0.30 52.55 69.00 TNO 286 Z 0.73 0.16 0.00 16.94 0.30 61.97 72.00 CSC 286 Z 0.48 0.14 0.00 9.10 0.43 77.07 123.42 RQT 291 Z 0.37 0.07 0.00 12.40 0.10 30.88 37.87 PNR 309 Z 0.41 0.07 0.00 16.43 0.16 71.11 111.89
17
SBT 311 Z 1.27 0.41 0.01 9.54 0.85 50.87 65.99 SDM 353 Z 0.52 0.16 0.00 14.41 0.42 62.38 88.75 MTC 442 Z 0.06 0.02 0.00 12.07 0.03 73.68 107.15 SNN 503 Z 0.15 0.01 0.00 41.12 0.02 66.23 98.42 BENI 521 Z 0.05 0.01 0.00 9.95 0.03 36.70 55.16 NAPI 522 Z 0.05 0.01 0.00 13.70 0.03 48.20 61.41 SSB3 549 Z 0.03 0.01 0.00 8.01 0.02 40.86 57.93 RSF3 557 Z 0.03 0.01 0.00 9.57 0.02 42.52 58.48 MNT3 560 Z 0.02 0.01 0.00 5.23 0.01 43.45 59.39 LIO3 564 Z 0.02 0.01 0.00 8.28 0.02 41.24 59.25 NSC3 565 Z 0.02 0.01 0.00 13.23 0.01 41.42 59.58 AND3 568 Z 0.04 0.01 0.00 12.31 0.02 45.57 60.15 CLT3 575 Z 0.07 0.01 0.00 12.53 0.02 46.62 61.31 SNR3 579 Z 0.02 0.00 0.00 15.25 0.01 47.41 61.46 CMP3 582 Z 0.02 0.01 0.00 7.72 0.01 46.60 62.39 RDM3 584 Z 0.02 0.01 0.00 6.95 0.02 48.22 62.66 COL3 591 Z 0.03 0.01 0.00 6.42 0.01 50.69 63.50 VDS3 591 Z 0.02 0.01 0.00 11.47 0.01 47.97 63.38 SFL3 594 Z 0.02 0.01 0.00 10.05 0.01 49.40 64.34 PST3 598 Z 0.02 0.00 0.00 12.66 0.01 48.19 64.52 BEL3 604 Z 0.03 0.01 0.00 7.90 0.01 48.30 65.71 AVG3 605 Z 0.02 0.01 0.00 8.98 0.01 48.38 66.30 CGG3 614 Z 0.02 0.01 0.00 11.53 0.01 53.31 67.10 SRN3 616 Z 0.01 0.01 0.00 8.92 0.01 50.77 67.14 STN3 622 Z 0.01 0.01 0.00 10.62 0.01 49.66 68.19 PGN3 626 Z 0.01 0.01 0.00 9.63 0.01 52.09 68.44 MRN3 636 Z 0.01 0.01 0.00 7.94 0.01 50.89 67.52 VGG3 653 Z 0.01 0.01 0.00 7.96 0.01 48.81 65.54
4. Comparison of the data with Bindi et al. G MPE predictions, PG A , PG V and Sa(T).
In the following a preliminary comparison of the registered data with Bindi et al. (2011) GMPE
median predictions and their error bands in terms of PGA, PGV, Sa(T) is provided. It is worth
to note that the range of validity of such GMPE is within 0km up to 200km, thus the extrapolation
of the prediction outside this range was represented by dotted lines. The predictions are made,
preliminarily, for A soil class according to Eurocode 8 or EC8, (CEN, 2004), notwithstanding the
fact that each station is located on different soil classes and their classification is provided by the
Italian Accelerometric Archive (ITACA), http://itaca.mi.ingv.it ock or
other rock-like geological formation, including at most 5 m of weaker material at the surface
characterized by an average value of shear wave velocity in the first 30 m, Vs30, higher than 800
m/s. Soil class A is characterized by the least soil amplification factor respect to other, softer soil
18
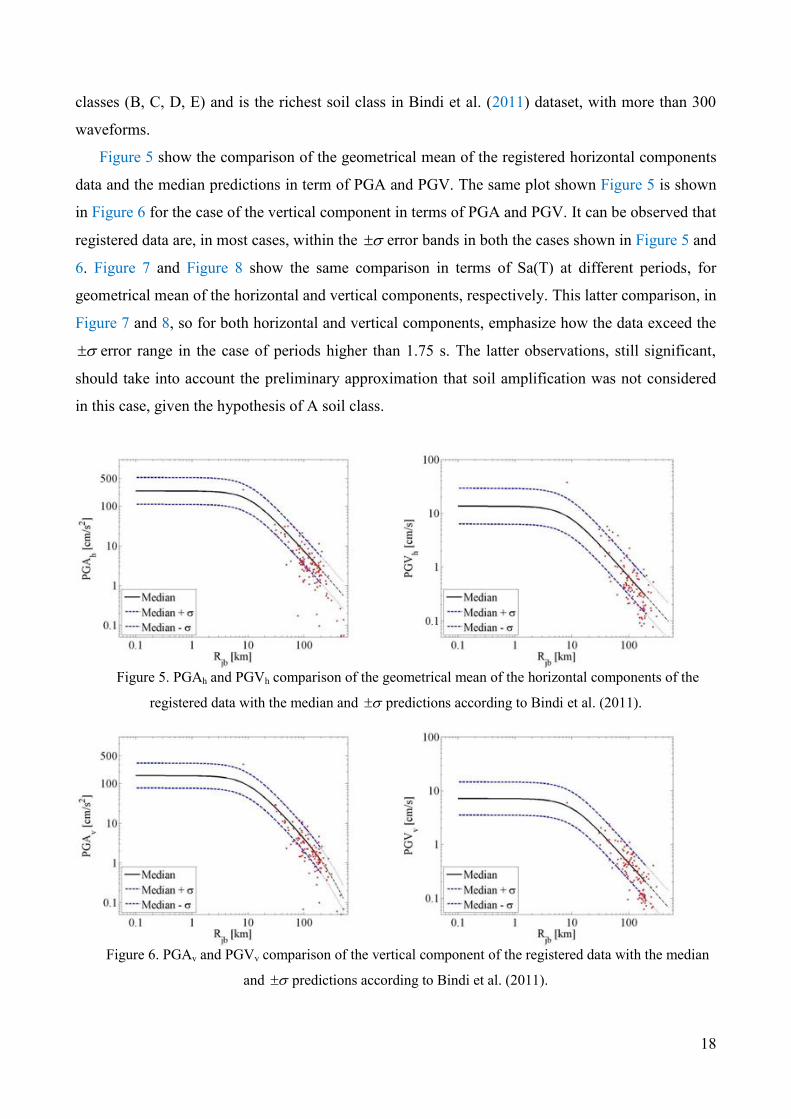
classes (B, C, D, E) and is the richest soil class in Bindi et al. (2011) dataset, with more than 300
waveforms.
Figure 5 show the comparison of the geometrical mean of the registered horizontal components
data and the median predictions in term of PGA and PGV. The same plot shown Figure 5 is shown
in Figure 6 for the case of the vertical component in terms of PGA and PGV. It can be observed that
registered data are, in most cases, within the error bands in both the cases shown in Figure 5 and
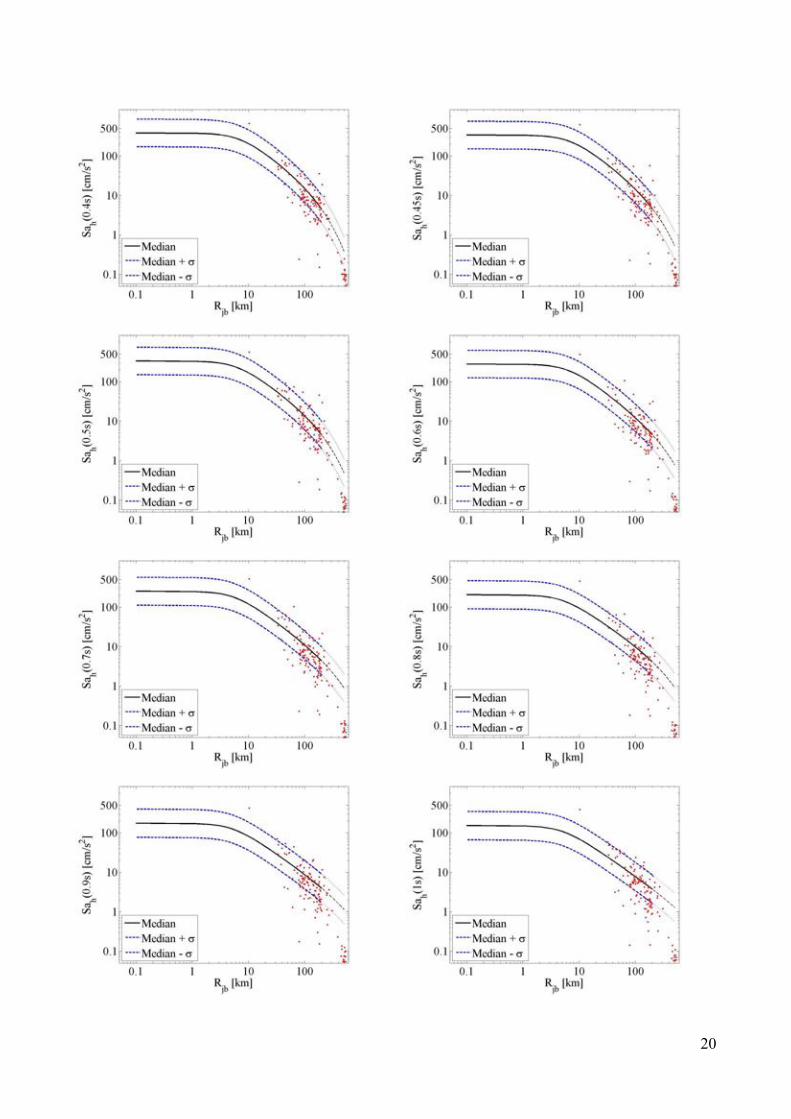
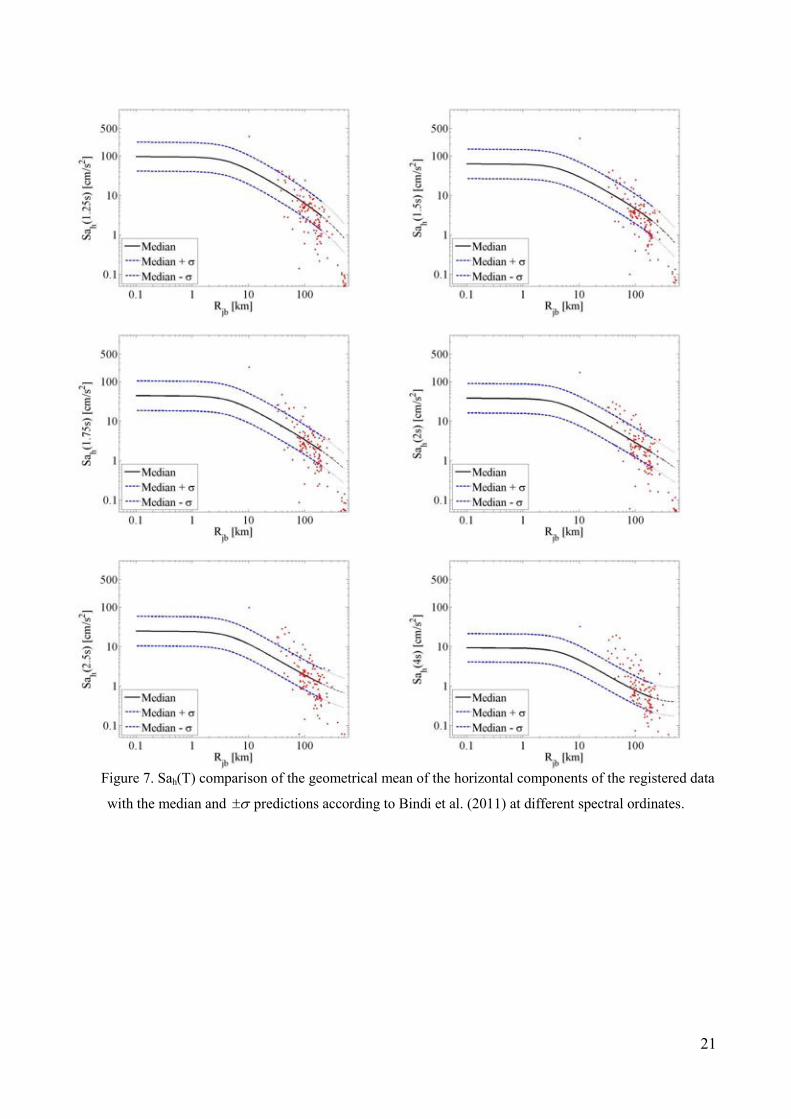
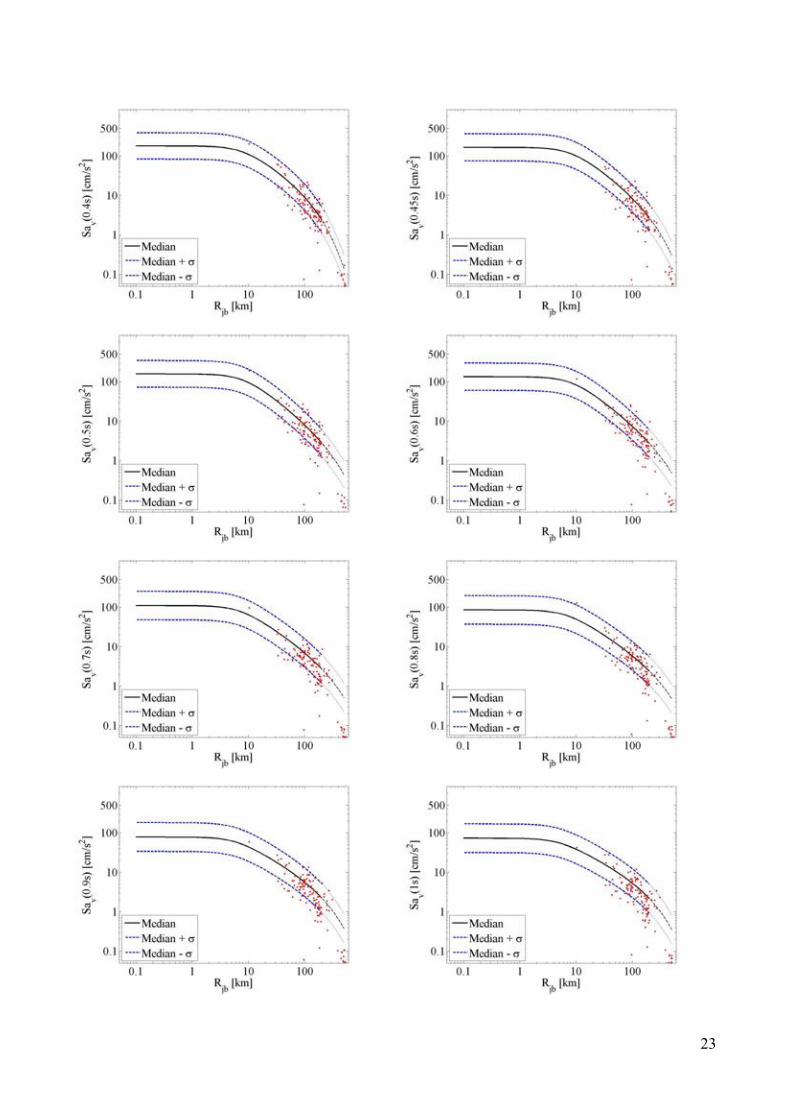
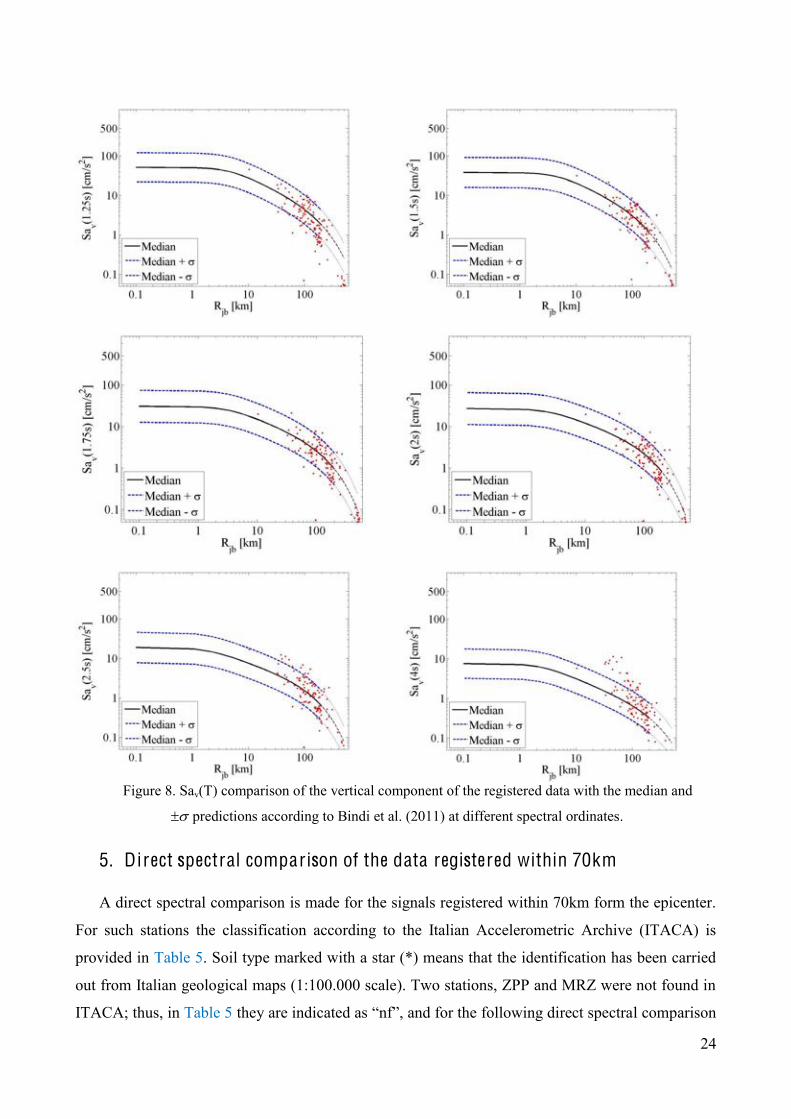
6. Figure 7 and Figure 8 show the same comparison in terms of Sa(T) at different periods, for
geometrical mean of the horizontal and vertical components, respectively. This latter comparison, in
Figure 7 and 8, so for both horizontal and vertical components, emphasize how the data exceed the
error range in the case of periods higher than 1.75 s. The latter observations, still significant,
should take into account the preliminary approximation that soil amplification was not considered
in this case, given the hypothesis of A soil class.
Figure 5. PGAh and PGVh comparison of the geometrical mean of the horizontal components of the
registered data with the median and predictions according to Bindi et al. (2011).
Figure 6. PGAv and PGVv comparison of the vertical component of the registered data with the median
and predictions according to Bindi et al. (2011).

19
20
21
Figure 7. Sah(T) comparison of the geometrical mean of the horizontal components of the registered data
with the median and predictions according to Bindi et al. (2011) at different spectral ordinates.

22
23
24
Figure 8. Sav(T) comparison of the vertical component of the registered data with the median and
predictions according to Bindi et al. (2011) at different spectral ordinates.
5. Direct spectral comparison of the data registered within 70km
A direct spectral comparison is made for the signals registered within 70km form the epicenter.
For such stations the classification according to the Italian Accelerometric Archive (ITACA) is
provided in Table 5. Soil type marked with a star (*) means that the identification has been carried
out from Italian geological maps (1:100.000 scale). Two stations, ZPP and MRZ were not found in
ITACA; thus, in Table 5 l comparison

25
such stations are considered on soil class A, in analogy with the hypothesis made in the previous
section. Table 5. Soil classification of the stations within 70 km from the epicentre.
Station ID Repi Station Name soil class
[km]
MRN 16 Mirandola C* (3)
MDN 41 Modena C (3)
NVL 42 Novellara C (3)
ZPP 43 Zola_Pedrosa_Piana nf
ISD 47 Isola_Della_Scala B*(2)
CPC 49 Copparo_Coccanile C*(3)
MNS 53 Monselice C*(3)
ARG 54 Argenta D (4)
MDC 56 Medicina C*(3)
SSU 58 Sassuolo A*(1)
MRZ 61 Marzabotto nf
CSP 64 CastelSanPietroTerme B*(2)
SRP 64 Sorbolo C*(3)
In Figure 9 to Figure 21 the direct comparison of the horizontal and vertical component
registered spectra with Bindi et al. (2011) GMPE is provided. Joyner Boore distance is evaluated
according to the approximate expression in Equation (1). The most of the registered spectra fall
within the error bands. The only exception is found in the closest waveform (MRN) in the N-S
component. In this latter case the spectra exceeds the prediction in the medium high-period range (T
> 0.5s).
Figure 9. Comparison of the registered spectra at MRN station for E-W and N-S components (on the left)
and vertical component (on the right) with the mean predictions according to Bindi et al. (2011).

26
Figure 10. Comparison of the registered spectra at MDN station for E-W and N-S components (on the
left) and vertical component (on the right) with the mean predictions according to Bindi et al. (2011).
Figure 11. Comparison of the registered spectra at NVL station for E-W and N-S components (on the
left) and vertical component (on the right) with the mean predictions according to Bindi et al. (2011).
Figure 12. Comparison of the registered spectra at ZPP station for E-W and N-S components (on the left)
and vertical component (on the right) with the mean predictions according to Bindi et al. (2011).

27
Figure 13. Comparison of the registered spectra at ISD station for E-W and N-S components (on the left)
and vertical component (on the right) with the mean predictions according to Bindi et al. (2011).
Figure 14. Comparison of the registered spectra at CPC station for E-W and N-S components (on the
left) and vertical component (on the right) with the mean predictions according to Bindi et al. (2011).
ith the mean predictions according to Bindi et al. (2011).
Figure 15. Comparison of the registered spectra at ARG station for E-W and N-S components (on the
left) and vertical component (on the right) with the mean predictions according to Bindi et al. (2011).

28
Figure 16. Comparison of the registered spectra at SSU station for E-W and N-S components (on the
left) and vertical component (on the right) with the mean predictions according to Bindi et al. (2011).
Figure 17. Comparison of the registered spectra at MDC station for E-W and N-S components (on the
left) and vertical component (on the right) with the mean predictions according to Bindi et al. (2011).
Figure 18. Comparison of the registered spectra at MNS station for E-W and N-S components (on the
left) and vertical component (on the right) with the mean predictions according to Bindi et al. (2011).

29
Figure 19. Comparison of the registered spectra at MRZ station for E-W and N-S components (on the
left) and vertical component (on the right) with the mean predictions according to Bindi et al. (2011).
Figure 20. Comparison of the registered spectra at SRP station for E-W and N-S components (on the left)
and vertical component (on the right) with the mean predictions according to Bindi et al. (2011).
Figure 21. Comparison of the registered spectra at CSP station for E-W and N-S components (on the left)
and vertical component (on the right) with the mean predictions according to Bindi et al. (2011).

30
6. Comparison of the data with Sabetta and Pugliese (1996) and Iervolino et al. (2010) G MPE predictions, I A and ID
The comparison of the registered data with the predictions of GMPEs is made also in term of
integral parameters. Figure 22 show the comparison of the registered data with the mean predictions
and the error bands of Arias intensity (IA) and Cosenza and Manfredi index (ID), respectively.
Both these attenuation relationship are valid within 100km and are computed as function of the
epicentral distance (Repi); thus, in this case no distance conversion was necessary. It is worth to note
that IA in Figure 22 is expressed in cm2/s3, so normalized by the constant factor 2g respect to the
values in Table 3 to 4, evaluated according to Equation (2) and expressed in cm/s. The GMPE
employed for IA is the one by Sabetta and Pugliese (1996), while for ID Iervolino et al. (2010)
GMPE was considered. Both the GMPEs considered provide the prediction of the highest
horizontal component; so, in this case, the registered data refer to the maximum between the two
registered horizontal components shown in Table 3 and 4.
2
02
Et
AI a t dtg
(2)
Figure 22. Comparison of the maximum horizontal component of the registered data with the median and
predictions according to Sabetta and Pugliese (1996) and Iervolino et al. (2010) GMPE predictions in
terms of IA and ID, respectively.
7. Comparison with Italian hazard data
A preliminary comparison of the closest waveform registered at MRN station (Repi = 16 km)
with Italian code prescription (CS. LL. PP., 2008) at the same site is shown in Figure 23. The N-S
and E-W spectra at MRN are compared with code spectra computed for both soil classes A and C

31
for two different return periods (Tr) equal to 475 and 2475 years. The horizontal spectra at the
station, whose soil is classified in ITACA as C, are almost within the code spectra computed
according to Italian code (CS. LL. PP., 2008) for soil class C and Tr 475 and 2475. In the medium-
high period range (0.5s < T < 2.5s), the N-S component exceeds the band identified by the two C
soil spectra a the two different return periods. The spectrum for the vertical component at MRN
station exceeds significantly the vertical code spectrum for Tr 2475 years with a peak that exceeds
1g in correspondence of the constant acceleration branch of the code spectrum. According to this
latter comparison it seems that the earthquake occurred can be considered within the prediction of
the Italian hazard map. Regarding this aspect two key issues should be observed:
- only afte
and its hazard map have become compulsory for design;
- according to obsolete building code regulations (up to 1980) the area struck by the
earthquake was not classified as seismically prone (Lai et al, 2009).
For MRN station geographical coordinates, the hazard disaggregation (Iervolino et al, 2011)
was computed for the PGA and Sa(T=1s) for the two Tr (475 and 2475 years) by means of Rexel v
3.3 (REXEL v 3.3, 2008-2011), as shown in Figure 24 and 25. The modal magnitude and distance
values ranges between 5 and 6, and 0-20km in all the cases considered with slight differences in
terms of contribution to the hazard.
Figure 23. Comparison of the horizontal code spectra for soil classes A and C (on the right) and vertical
code spectra (on the left) computed for the geographical coordinates at MRN station (lat 42.87, long 11.06),
Mirandola, for Tr equal to 475 and 2475 years, and compared with the spectra of the waveform registered at
MRN station.

32
Figure 24. Disaggregation PGA and Sa(1 s) hazard with Tr 475 yr in Mirandola.
Figure 25. Disaggregation PGA and Sa(1 s) hazard with Tr 2475 yr in Mirandola
References Bindi D, Pacor F, Luzi L, Puglia R, Massa M, Ameri G, Paolucci R, 2011. Ground motion prediction
equations derived from the Italian strong motion database, Bulletin of Earthquake Engineering, 9(6),
1899-1920.
Comité Européen de Normalisation (CEN), 2004. Eurocode 8 Design of Structures for earthquake resistance Part
1: General rules, seismic actions and rules for buildings. EN 1998-1, CEN, Brussels.
Cosenza E, Manfredi G, Ramasco R, 1993: The Use of Damage Functionals in Earthquake Engineering: A
Comparison between Different Methods. Earthquake Engineering and Structural Dynamics, 22 (10),
855-868.
CS.LL.PP; DM 14 Gennaio 2008: Norme tecniche per le costruzioni. Gazzetta Ufficiale della Repubblica
Italiana, 29. 4/2/2008 (In Italian).
Dolce M, Nicoletti M, Ammirati A, BInaconi R, Filippi L, Gorini A, Marcucci S, Palma F, Zambonelli E,
Lavecchia G, de Nardins R, Brozzetti F, Boncio P, Cirillo D, Romano A, Costa G, Gallo A, Tiberi L,
Zoppè G, Suhadolc P, Ponziani F, Formica A, 2012. The Emilia thrust earthquake of 20 May 2012
(Northern Italy): strong motion and geological observations Report 1. Available at
http://www.protezionecivile.gov.it/resources/cms/documents/Report_DPC_1_Emilia_EQSd.pdf
33
Gruppo di Lavoro (2004) Redazione della Mappa di Pericolosità Simica Prevista dall'Ordinanza PCM 3274
del 20 Marzo 2003, Rapporto conclusivo per il Dipartimento della Protezione Civile, INGV, Milano-
Roma, 65pp. (in Italian)
Iervolino I., Giorgio M., Galasso C., Manfredi G., 2010. Conditional hazard maps for secondary intensity
measures, Bulletin of Seismological Society of America, 100(6), 3312-3319.
Iervolino I, Chioccarelli E, Convertito V, 2011. Engineering design earthquakes from multimodal hazard
disaggregation. Soil Dynamics and Earthquake Engineering, 31, 1212-1231.
INGV Comunicato: aggiornamento del 01/06/2012 ore 05:48 UTC. Avialable at http://www.ingv.it/primo-
piano/comunicazione/2012/05200508/
Joyner WB, Boore DM, 1981. Peak horizontal acceleration and velocity from strong-motion records
including records from the1979 Imperial Valley, California, earthquake, Bulletin of Seismological
Society of America 71, 2011 2038.
Lai C, Foti S, Rota M, 2009. Input sismico e stabilità geotecnica dei siti in costruzione. IUSS Press, Pavia,
Italy.
Sabetta F, Pugliese A, 1996: Estimation of Response Spectra and Simulation of Nonstationary Earthquake
Ground Motion. Bulletin of the Seismological Society of America, 86, 337-352.
REXEL v.3.3, Iervolino I, Galasso C, Chioccarelli E, 2008-2011, available at www.reluis.it