preliminary results presentation - oxinst.com · business. oxford instruments plc preliminary...
TRANSCRIPT
Oxford Instruments plc Preliminary Results presentation 2018
Preliminary Results Presentation
Ian Barkshire
to 31st March 2018
Chief Executive
Gavin HillGroup Finance Director

Oxford Instruments plc Preliminary Results presentation 2018
Agenda
01: Highlights
02: Finance Review
03: Horizon Update
04: Operational Review
05: Summary and Outlook
2

Oxford Instruments plc Preliminary Results presentation 2018 3
Highlights
• Good progress with the early implementation of Horizon
• Transitioned to a more commercially focused, market driven Group
• Reported revenue in line with previous year
• Increased profitability and operating margin reflecting currency benefits
• Strong growth in orders and order book
• Strong growth in Materials & Characterisation
• Improved profitability in Service & Healthcare
• H2 improvement in Research & Discovery after weak first half
• Significant reduction in net debt
Oxford Instruments plc Preliminary Results presentation 2018
Finance Review
Gavin Hill

Oxford Instruments plc Preliminary Results presentation 2018
Income Statement
5
Constant Currency
ChangeReported
Change£m 2017/18 2016/17Revenue 296.9 300.2 (1.1%) (0.1%)Adjusted operating profit 46.5 38.0 22.4% (5.5%)Net finance costs (4.2) (6.5)Adjusted profit before tax 42.3 31.5 34.3% +0.6%
Amortisation of acquired intangibles (10.9) (12.5)Impairment of goodwill and intangibles - (36.7)Impairment of investment of associate - (8.0)Business reorganisation items 1.7 (1.7)Impairment of investment in associate (2.0) -Mark-to-market of currency hedges 3.1 1.2
Profit/(loss) before tax from continuing operations 34.2 (26.2)
Continuing adjusted basic earnings per share 56.3p 41.5p 35.7% Dividends per share 13.3p 13.0p 2.3%

Oxford Instruments plc Preliminary Results presentation 2018
Revenue by Sector
6
Materials & Characterisation
Research & Discovery
Service & Healthcare£m Total*
2016/17 105.7 125.3 69.3 300.2Underlying movement 13.9 (12.1) (2.0) (0.2)FX (1.5) (1.1) (0.5) (3.1)2017/18 118.1 112.1 66.8 296.9
GrowthReported +11.7% (10.5%) (3.6%) (1.1%)Constant currency +13.2% (9.7%) (2.9%) (0.1%)
* Excluding inter-segment revenues
Oxford Instruments plc Preliminary Results presentation 2018
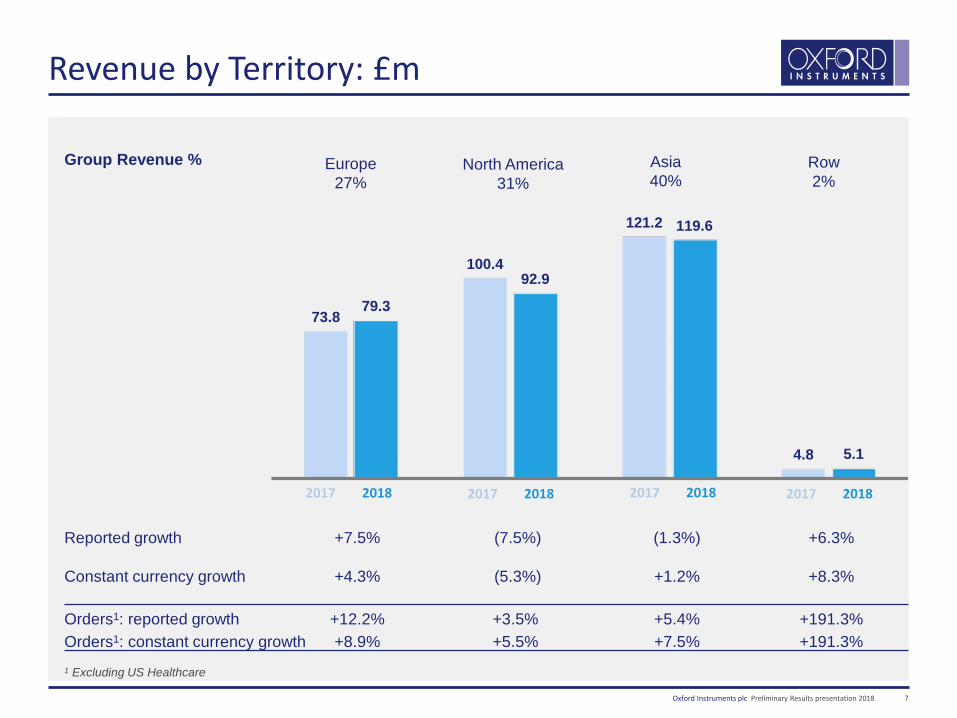
Revenue by Territory: £m
7
Group Revenue %
Reported growth +7.5% (7.5%) (1.3%) +6.3%
Constant currency growth +4.3% (5.3%) +1.2% +8.3%
Orders1: reported growth +12.2% +3.5% +5.4% +191.3% Orders1: constant currency growth +8.9% +5.5% +7.5% +191.3% 1 Excluding US Healthcare
73.8
100.4
121.2
4.8
79.3
92.9
119.6
5.1
2017 2018 2017 20182017 20182017 2018
Europe27%
North America31%
Asia40%
Row2%
Oxford Instruments plc Preliminary Results presentation 2018
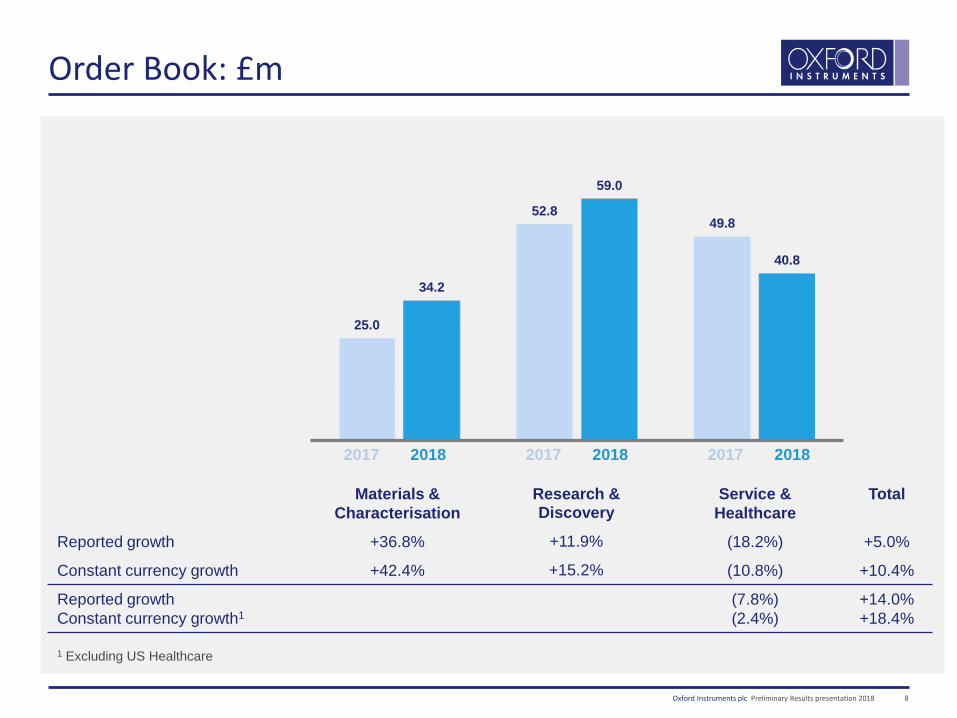
Order Book: £m
8
25.0
52.8 49.8
34.2
59.0
40.8
2017 2018 2017 20182017 2018
Materials & Characterisation
Research & Discovery
Service & Healthcare
Total
Reported growth +36.8% +11.9% (18.2%) +5.0%
Constant currency growth +42.4% +15.2% (10.8%) +10.4%
Reported growthConstant currency growth1
(7.8%)(2.4%)
+14.0%+18.4%
1 Excluding US Healthcare
Oxford Instruments plc Preliminary Results presentation 2018
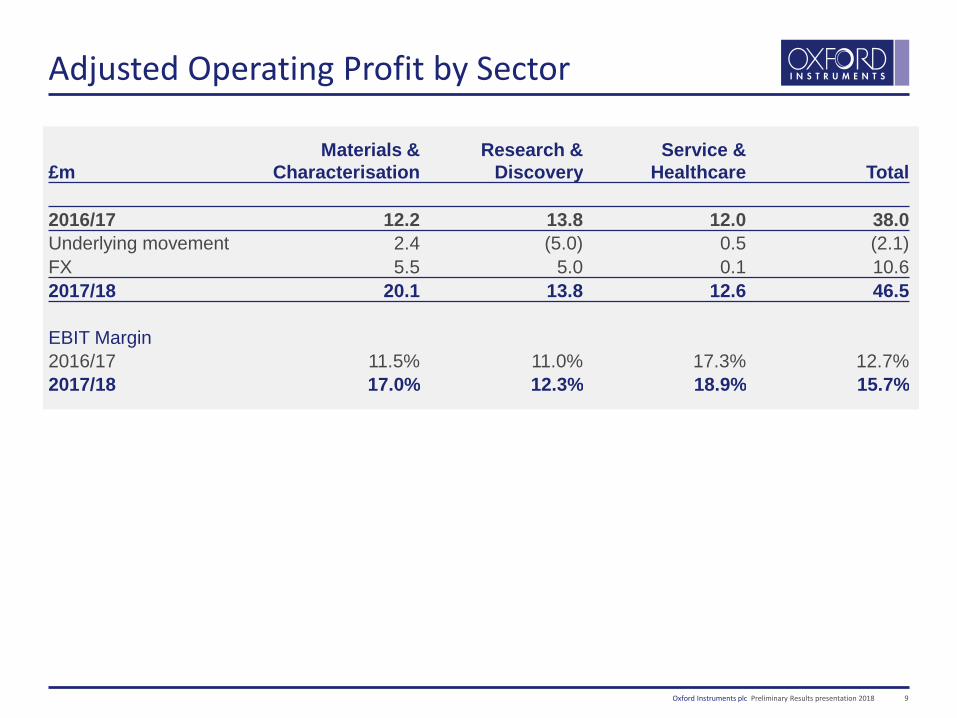
Adjusted Operating Profit by Sector
9
Materials & Characterisation
Research & Discovery
Service & Healthcare£m Total
2016/17 12.2 13.8 12.0 38.0Underlying movement 2.4 (5.0) 0.5 (2.1)FX 5.5 5.0 0.1 10.62017/18 20.1 13.8 12.6 46.5
EBIT Margin2016/17 11.5% 11.0% 17.3% 12.7%2017/18 17.0% 12.3% 18.9% 15.7%

Oxford Instruments plc Preliminary Results presentation 2018
Cash Flow
10
(140)
(120)
(100)
(80)
(60)
(40)
(20)
-
Cas
h/(D
ebt):
£m
EBITDA InterestTax
Pensions
Capitalised Development Capex
Disposal
Dividend Other/FX (net)
Working CapitalOutflow: £13.2m (2017: £4.4m)
Effective tax rate23.9% (2017: 24.8%)
Debt b/f
FY17
Debt c/f
FY18
Pensions:Deficit: £15.3m (2017: £25.1m)Annual contribution: £7.6m
Disposal (net cash flow):Industrial Analysis: £71.2mProperty: £9.3m
Cash conversion: 69% (2017: 90%)
Working Capital
Inv inAssociate

Oxford Instruments plc Preliminary Results presentation 2018
Currency Exposure
11
48.6
154.7
55.8
32.5
5.3
(48.9)
44.033.0
18.8
(0.4)
(60)
0
60
120
180
Sterling US Dollar Euro Japanese Yen Other
Sales Adjusted operating profit
£m e
quiv
alen
t
Oxford Instruments plc Preliminary Results presentation 2018 12
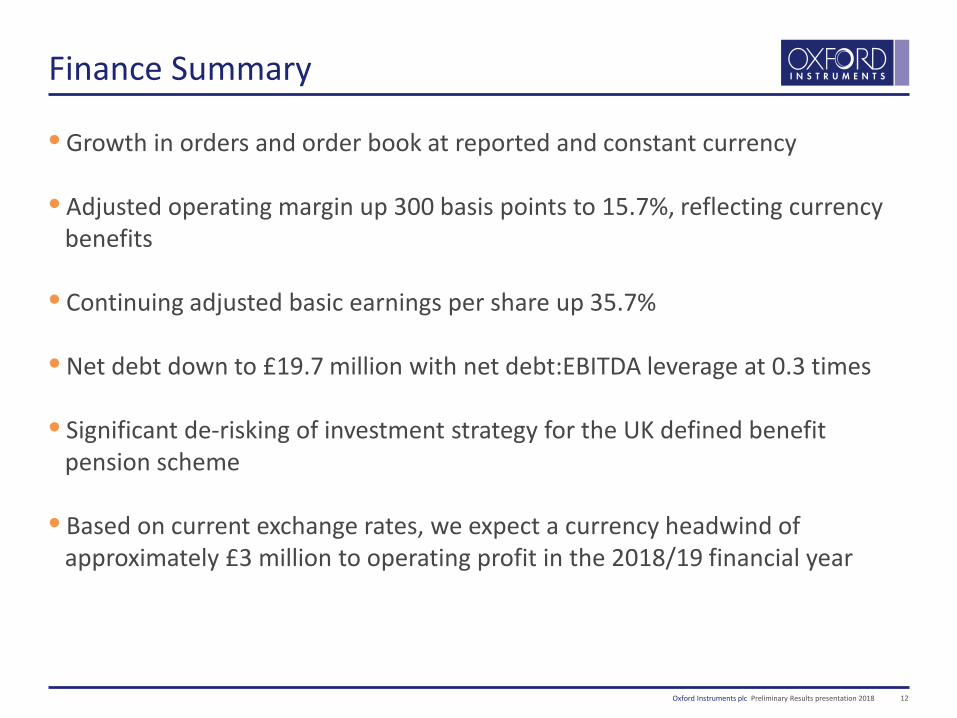
Finance Summary
• Growth in orders and order book at reported and constant currency
• Adjusted operating margin up 300 basis points to 15.7%, reflecting currency benefits
• Continuing adjusted basic earnings per share up 35.7%
• Net debt down to £19.7 million with net debt:EBITDA leverage at 0.3 times
• Significant de-risking of investment strategy for the UK defined benefit pension scheme
• Based on current exchange rates, we expect a currency headwind of approximately £3 million to operating profit in the 2018/19 financial year

Oxford Instruments plc Preliminary Results presentation 2018
Horizon Update &Operations Review
Ian Barkshire

Oxford Instruments plc Preliminary Results presentation 2018 14
Horizon Progress: Customer Centric Approach
•Good progress in early implementation phase of Horizon–Firmly embedded across the Group with positive engagement–Starting to see tangible benefits
•Transitioned to a more focused, market driven-Group–Broad range of applications and industrial segments
•Key enabling technologies underpinning shift to a greener economy, digital connectivity and advances in materials and life science
•Creating more value for existing customers and expanding our addressable markets through application specific solutions

Oxford Instruments plc Preliminary Results presentation 2018 15
Solutions and Application Focus
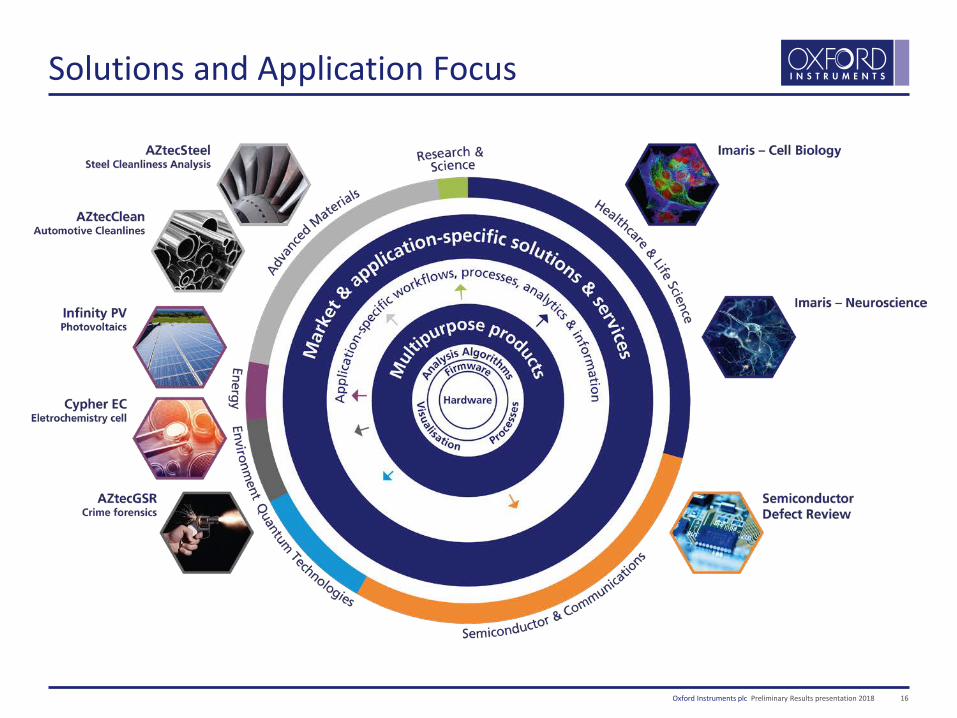
Oxford Instruments plc Preliminary Results presentation 2018 16
Solutions and Application Focus
Oxford Instruments plc Preliminary Results presentation 2018 17
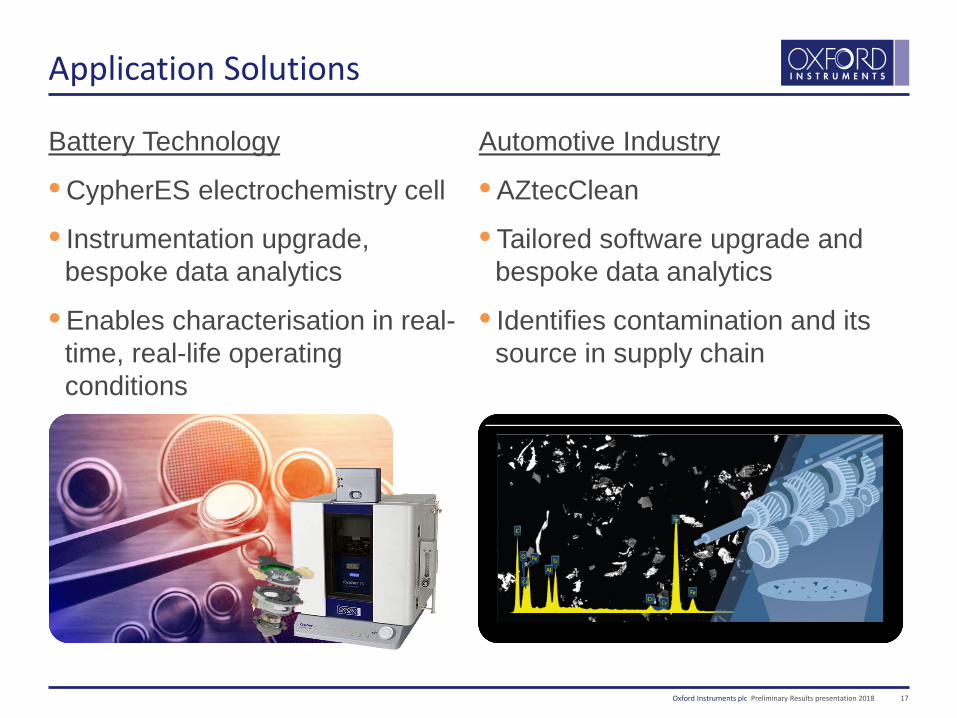
Application Solutions
Battery Technology
• CypherES electrochemistry cell
• Instrumentation upgrade, bespoke data analytics
• Enables characterisation in real-time, real-life operating conditions
Automotive Industry
• AZtecClean
• Tailored software upgrade and bespoke data analytics
• Identifies contamination and its source in supply chain

Oxford Instruments plc Preliminary Results presentation 2018 18
•Transformed leadership team at operational level–50% of senior managers recruited over the last two years
•Embedding best practice across sales, service and operations to augment excellence in technology–Overlay sharp commercial focus–Solution sales approach–Lean approach to operational excellence
•Exploiting synergies to create value–Leverage scale to accelerate growth and improve margins–£1.5 million central overhead efficiencies partially offsetting previous
contribution from Industrial Analysis
Horizon Progress: Developing & Embedding Capabilities
Oxford Instruments plc Preliminary Results presentation 2018 19
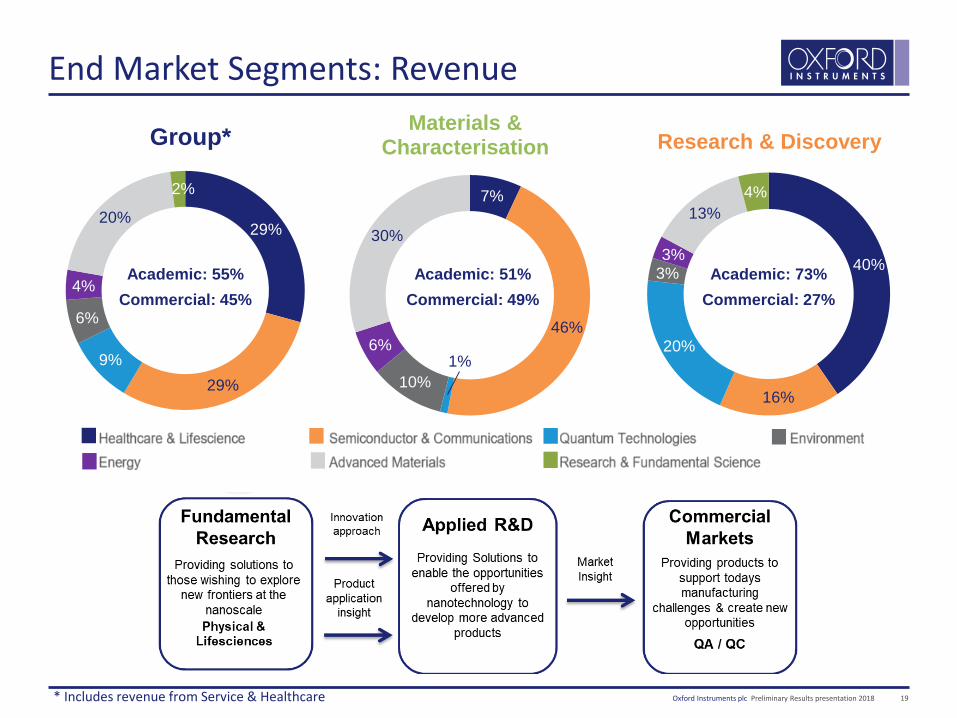
End Market Segments: Revenue
29%
29%9%
6%
4%
20%
2%
Group*
7%
46%
1%10%
6%
30%
Materials & Characterisation
40%
16%
20%
3%3%
13%4%
Research & Discovery
Academic: 55% Commercial: 45%
Academic: 51% Commercial: 49%
Academic: 73% Commercial: 27%
* Includes revenue from Service & Healthcare
Oxford Instruments plc Preliminary Results presentation 2018 20
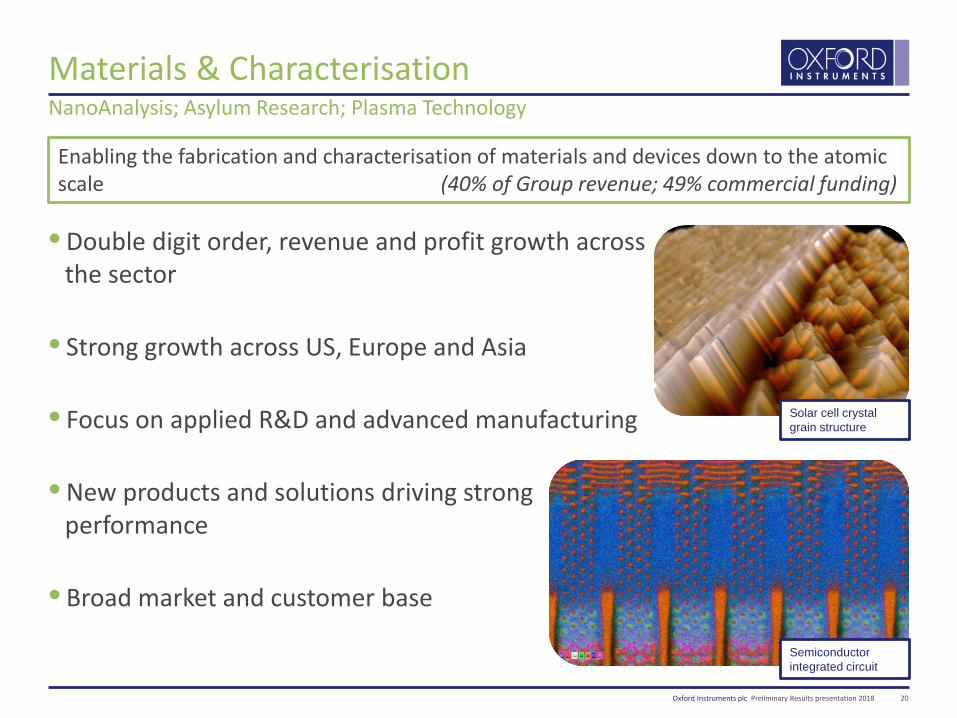
Materials & Characterisation
• Double digit order, revenue and profit growth across the sector
• Strong growth across US, Europe and Asia
• Focus on applied R&D and advanced manufacturing
• New products and solutions driving strong performance
• Broad market and customer base
NanoAnalysis; Asylum Research; Plasma Technology
Enabling the fabrication and characterisation of materials and devices down to the atomic scale (40% of Group revenue; 49% commercial funding)
Solar cell crystal grain structure
Semiconductor integrated circuit
Oxford Instruments plc Preliminary Results presentation 2018 21
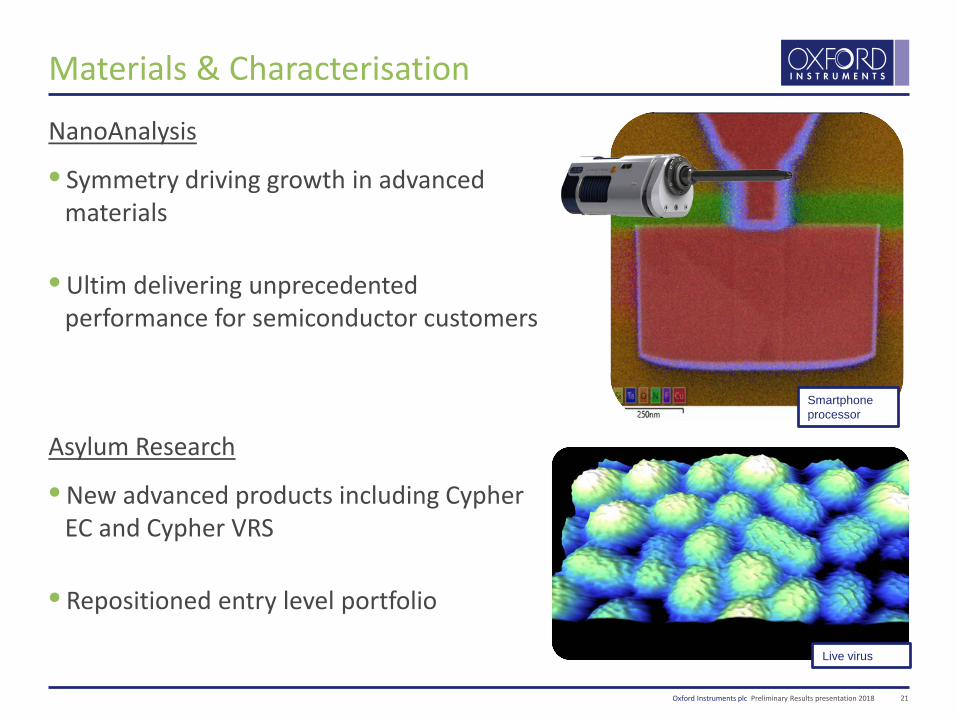
Materials & Characterisation
NanoAnalysis
• Symmetry driving growth in advanced materials
• Ultim delivering unprecedented performance for semiconductor customers
Asylum Research
• New advanced products including Cypher EC and Cypher VRS
• Repositioned entry level portfolio
EDS map of a bulk Smartphone processor cross section showing TEM like spatial resolution in the SEM
Smartphone processor
Live virus
Oxford Instruments plc Preliminary Results presentation 2018 22
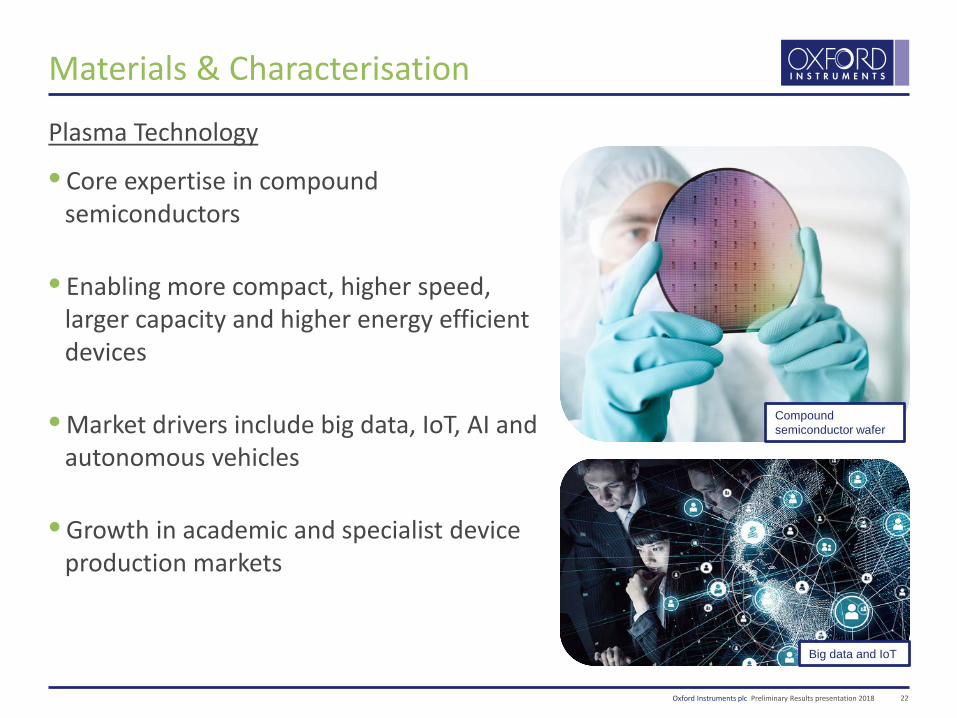
Materials & Characterisation
Plasma Technology
• Core expertise in compound semiconductors
• Enabling more compact, higher speed, larger capacity and higher energy efficient devices
• Market drivers include big data, IoT, AI and autonomous vehicles
• Growth in academic and specialist device production markets
Compound semiconductor wafer
Big data and IoT

Oxford Instruments plc Preliminary Results presentation 2018 23
Research & Discovery
• Strong second half more than offset by weaker first half performance
• Orders broadly in line with previous year, increased order book
• Second half improvement in optical microscopy
• NanoScience progressing on improvement plan
• Significant contribution from healthcare and life science; quantum technologies increasing
Andor Technology; X-ray Technology; NanoScience & Magnetic Resonance; ScientaOmicron
Advanced solutions that create unique environments and enable measurements down to the molecular and atomic level (38% of Group revenue; 73% academic funding)
Florescence imaging
Quantum Technologies
Oxford Instruments plc Preliminary Results presentation 2018 24
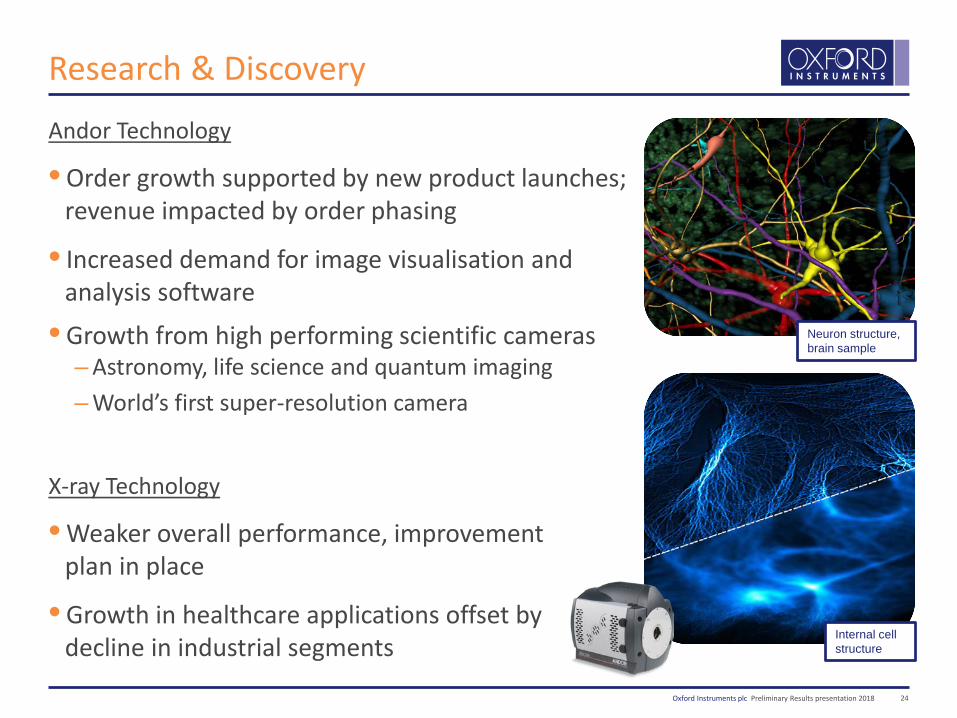
Research & Discovery
Andor Technology
• Order growth supported by new product launches; revenue impacted by order phasing
• Increased demand for image visualisation and analysis software
• Growth from high performing scientific cameras– Astronomy, life science and quantum imaging– World’s first super-resolution camera
X-ray Technology
• Weaker overall performance, improvement plan in place
• Growth in healthcare applications offset by decline in industrial segments
Neuron structure, brain sample
Internal cell structure
Oxford Instruments plc Preliminary Results presentation 2018 25
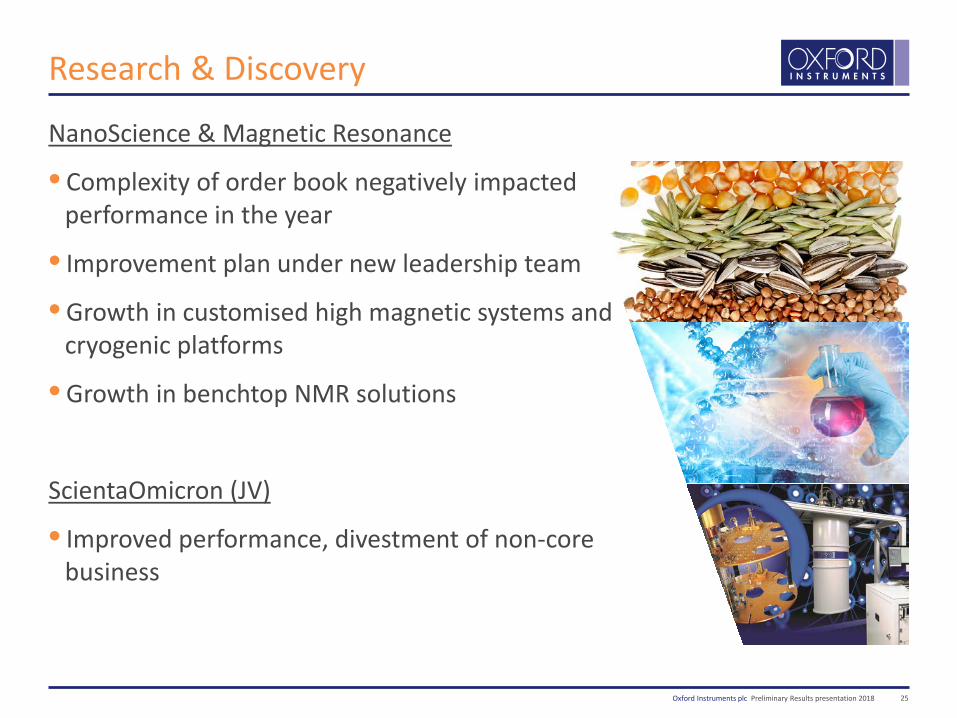
Research & Discovery
NanoScience & Magnetic Resonance
• Complexity of order book negatively impacted performance in the year
• Improvement plan under new leadership team
• Growth in customised high magnetic systems and cryogenic platforms
• Growth in benchtop NMR solutions
ScientaOmicron (JV)
• Improved performance, divestment of non-core business

Oxford Instruments plc Preliminary Results presentation 2018 26
Service & Healthcare
• Improved profitability and margin
• Revenue and order growth offset by reduction in OI Healthcare
OI Healthcare
• Strategic progress
• Improved second half performance
OiService
• Increased demand for services relating to own products
• Broader range of products and services and increased after-market revenues
OI Healthcare; OiService
Provides customer service and support for our own products and the service, sale and rental of third party healthcare imaging systems (22% of Group revenue)
Software Updates
Hardware
Updates

Oxford Instruments plc Preliminary Results presentation 2018
SummaryGood progress with Horizon, transitioning to a more commercially-focused GroupMaterials & Characterisation
• Performing strongly in attractive markets
• We continue to invest in new product development to improve and expand our range of products
• Increasing addressable market through solutions
27
Research & Discovery
• Improved second half performance
• Recovery in optical microscopy systems, with like for like order growth in Andor
• Under performance in NanoScience and X-ray Technology depressed sector results
• Addressing the challenges through structural change and business simplification
• Self-help actions, combined with positive end markets, support improved financial performance
Service & Healthcare
• OiService: focus on increasing after-market revenue by providing a broader range of support services
• OI Healthcare: strategic shift towards higher proportion of service revenue driving greater visibility of revenue and improved returns

Oxford Instruments plc Preliminary Results presentation 2018
Outlook
28
• Our chosen end markets remain attractive, supported by commercial and government investment
• Our growing order book, customer application focus and drive for operational efficiencies provide confidence for the year ahead
• We expect to see an improvement in performance on a reported basis after allowing for the impact of an anticipated currency headwind, based on current exchange rates

Oxford Instruments plc Preliminary Results presentation 2018 29
Questions

Oxford Instruments plc Preliminary Results presentation 2018
Disclaimer
This presentation is prepared for and addressed to authorised persons within the meaning of the Financial Services and Markets Act 2000 (FSMA). The information contained in this presentation is not for publication, distribution or reproduction,in whole or in part, to any persons outside the jurisdiction of this Act. The Company, its Directors, employees, agents or advisers do not accept or assume responsibility to any other person to whom this presentation is shown or into whose hands it may come and any such responsibility or liability is expressly disclaimed.
Statements contained in this presentation are based on the knowledge and information available to the Company's Directors at the date it was prepared and therefore the facts stated and views expressed may change after that date. By their nature, any statements concerning the risks and uncertainties facing the Company in this presentation involve uncertainty since future events and circumstances can cause results and developments to differ materially from those anticipated. To the extent that this presentation contains any statement dealing with any time after the date of its preparation such statement is merely predictive and speculative as it relates to events and circumstances which are yet to occur. The Company undertakes no obligation to update these forward-looking statements.
The information in this presentation shall not constitute or be deemed to constitute any offer or invitation to invest in or otherwise deal in shares or other securities of Oxford Instruments plc.
All information in the presentation is the property of Oxford Instruments plc.