preliminary results - inchcape · 3.4ppt. 15. cash flow and net debt operating cash flow £m. ......
TRANSCRIPT

Preliminary Results
26 February 2008

Executing our strategy:
The 6th consecutive year of record results
André Lacroix Group Chief Executive

Group financial highlights
• Sales* up 26% to £6.1bn• Like for like sales* up 3.4%
• Operating profit** up 27% to £270.7m• Like for like operating profit** increase of 6.6%
• EPS*** up 3.6% to 37.0p• Final dividend up 5.0% to 10.5p; full year dividend up 5.0% to 15.75p
* At constant currency** Pre exceptional items, at constant currency*** Normalised
Consistent and strong delivery in 2007
3
• Strategy delivery on track driving record profits for the Group• Strengthen: like for like sales* +3.4%; like for like operating profit* +6.6%
• Expansion: Sales* from new investments £1.2bn; operating profit* from new investments £47.9m
• Emerging Markets: continuing progress with acquisitions in Russia and the Baltics, expansion in the Balkans and successful entry into China
• UK: successful integration of recent acquisitions contribute to UK profit of £69.6m (+52%)
• International operations: sales of £3.4bn and trading profit growth of 16%. Represents 76% of Group trading profit
2007 Operational and strategic highlights
Group well placed to deliver further growth in 2008 and beyond* At constant currency4

Financial Results
Barbara Richmond Group Finance Director

2007£m
2006£m
Change%
Sales 6,057 4,842 25.1
Operating profit* 265.0 213.9 23.9
Net interest cost 33.4 5.9 466
Profit before tax 235.1 213.9 9.9
Tax rate (%) 25.0 21.7 3.3ppt
EPS (p) ** 37.0 35.7 3.6
Dividend per share (p) 15.75 15.0 5.0
Dividend cover (x) 2.3 2.4 -
Summary P&L
* Before exceptional items ** normalised6

2007£m
2006£m
Change%
Change % constant currency
Like for likechange % constant
currency
Distribution 2,509.5 2,518.5 (0.4) 1.4 0.4
Retail 3,547.3 2,323.6 52.7 52.6 6.8
Total 6,056.8 4,842.1 25.1 26.0 3.4
Sales
7

Trading profit & ROS
Trading profit
2007£m
2006£m
Change%
Change % constant currency
Like for like change % constant currency
Distribution 204.9 187.1 9.5 12.7 8.4
Retail 87.6 51.7 69.4 69.2 2.1
Total 292.5 238.8 22.5 24.9 7.0
ROS (%) 2007 2006 Changeppt
Like for likechange ppt
Distribution 8.2 7.4 0.8 0.5
Retail 2.5 2.2 0.3 (0.1)
Total 4.8 4.9 (0.1) 0.1
8

Regional analysis – trading profit
* Before central costs ** Excluding UK and Emerging Markets
Australia Hong KongSingapore Europe**
Emerging Markets UKROW
9
16%
25%16%
19%
9%
5%
10%
2007* 2006*
15%
16%
24%
8%
17%10%
10%

Australia*
• Another record year• Limited growth in
Distribution sales due to model run outs
• Increased Distribution margin due to special editions and tight cost controls
• Retail profits lower in very competitive market
• Good result from Autonexus
Distribution£m
Distributionchange %
Retail£m
Retailchange %
Sales 408.1 2.1 236.0 8.8
Like for like sales 408.1 2.1 222.5 2.6
Trading profit 34.3 21.7 8.6 (16.9)
Like for like profit 34.3 21.7 8.9 (14.0)
ROS % 8.4 1.3ppt 3.7 (1.0)ppt
* All regional figures are at constant currency10
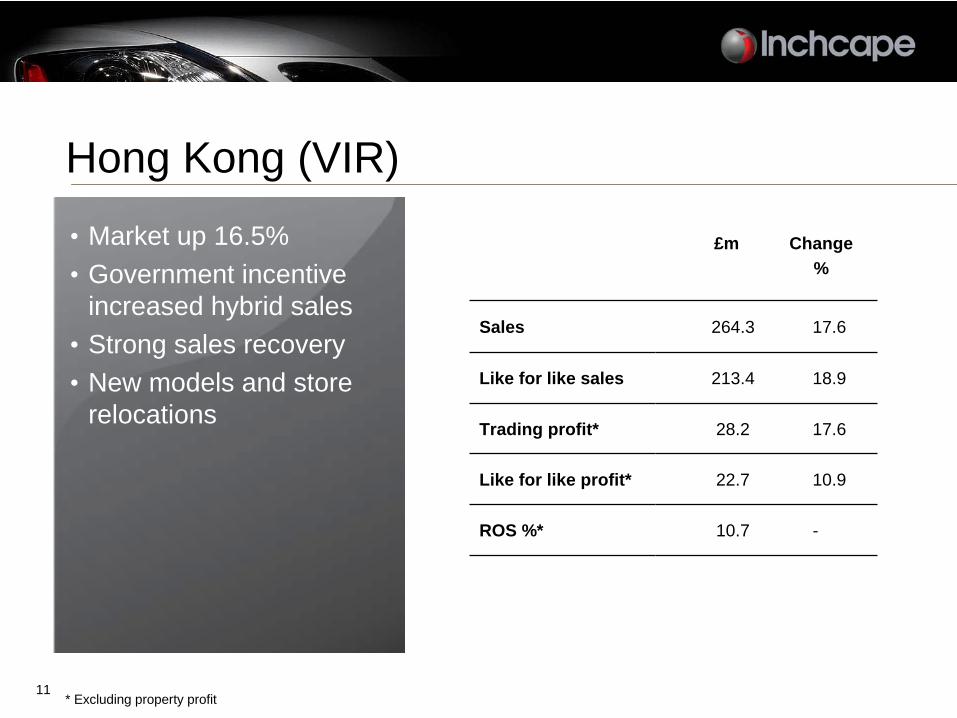
Hong Kong (VIR)
£m Change%
Sales 264.3 17.6
Like for like sales 213.4 18.9
Trading profit* 28.2 17.6
Like for like profit* 22.7 10.9
ROS %* 10.7 -
* Excluding property profit
• Market up 16.5%• Government incentive
increased hybrid sales• Strong sales recovery• New models and store
relocations
11
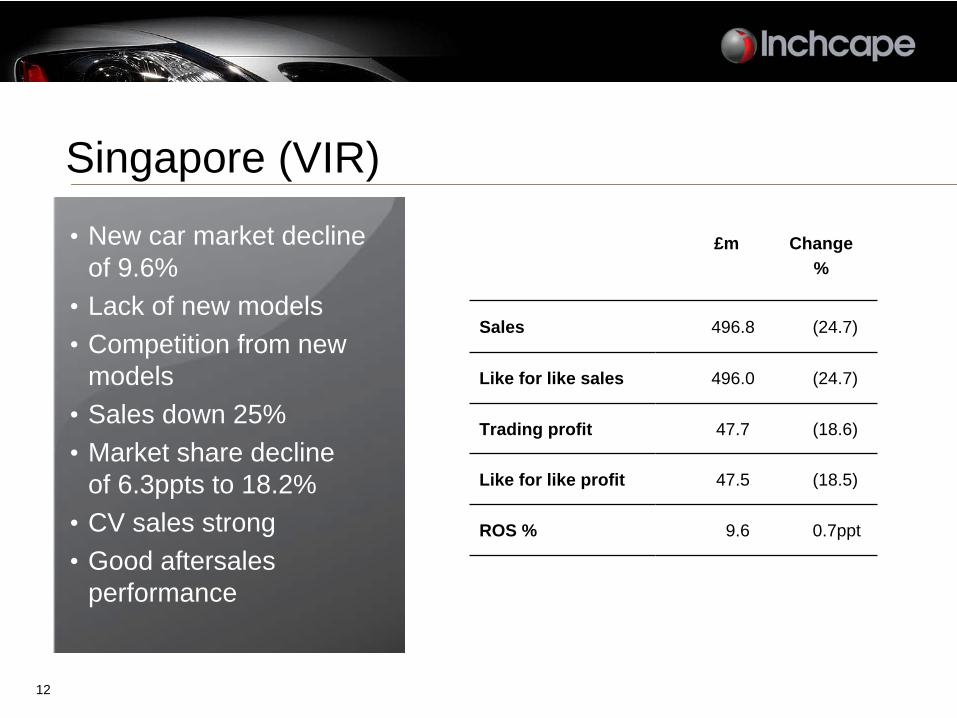
Singapore (VIR)• New car market decline
of 9.6%• Lack of new models• Competition from new
models • Sales down 25%• Market share decline
of 6.3ppts to 18.2%• CV sales strong• Good aftersales
performance
£m Change%
Sales 496.8 (24.7)
Like for like sales 496.0 (24.7)
Trading profit 47.7 (18.6)
Like for like profit 47.5 (18.5)
ROS % 9.6 0.7ppt
12

Europe
• Excellent performance across the region
• Record results in Distribution
• Successful Retail turnaround
• Disposal of French retail centres
Distribution£m
Distributionchange %
Retail£m
Retailchange %
Sales 824.1 5.9 379.8 (8.0)
Like for like sales 820.5 5.9 377.9 4.8
Trading profit 49.3 20.0 0.8 144.4
Like for like profit 49.2 20.0 0.8 200.0
ROS % 6.0 0.7ppt 0.2 0.6ppt
13

UK
• Retail LFL sales up 5.2%• Outperformed UK market• Focus on premium
brands• Industry leading LFL
ROS of 2.5%• Used car margin
pressure• Integration benefits of
EMH and Lind
• Disposal programme
Distribution£m
Distributionchange %
Retail£m
Retailchange %
Sales 67.5 (31.0) 2,646.0 63.9
Like for like sales 36.4 (11.4) 1,509.9 5.2
Trading profit 4.9 28.9 64.7 53.7
Like for like profit 4.9 (14.0) 38.1 (6.3)
ROS % 7.3 3.4ppt 2.4 (0.2)ppt
14

Emerging Markets• Strong growth in
all markets• Scale investment in
the Baltics• Full year of Russia
producing ROS of 6.6%• China ahead of
expectations
Distribution£m
Distributionchange %
Retail£m
Retailchange %
Sales 240.2 80.6 280.0 251.4
Like for like sales 192.8 45.0 124.9 56.6
Trading profit 16.3 71.6 13.4 1,118.5
Like for like profit 14.7 54.7 5.0 212.5
ROS % 6.8 (0.3)ppt 4.8 3.4ppt
15

Cash flow and net debtOperating cash flow £m
Operating profit* 265.0
Depreciation/ amortisation 33.7
Working capital 14.6
Other (7.1)
Operating cash flow 306.2
Free cash flow £m
Operating cash flow 306.2
Net interest (37.1)
Taxation (49.8)
Minority interest (1.8)
Capex (net) (32.8)
Free cash flow 184.7
* Excluding exceptional items ** Includes fair value re-measurements
Net cash £m
Free cash flow 184.7
Dividends (71.1)
Share buyback (18.5)
Pension (13.2)
Acquisitions (375.2)
Disposals 85.5
Other 4.8
Net cash flow (203.0)Opening net debt (19.0)Translation on net debt** 0.5
Closing net debt (221.5)
16

2007 summary: Delivering our strategy
• Focus on operational excellence and diversified value drivers delivers results
• Record year for Europe Distribution and Australia
• Margin protection in Singapore• Turnaround in Europe Retail & Hong Kong• UK strategy outperforming the market
Strengthen Expand• Existing facilities renewed and additional
funding obtained prior to credit crunch• Successful entry into Russia and China• Transformational acquisitions in the
Baltics• Greenfield investment in Balkans
Acceleration of like for like sales and profit growth
Emerging Markets exposuredoubled to 10% of Group profits
17

Executing our strategy: 2008 Priorities
André Lacroix Group Chief Executive

Track record of profitable growth
0
1
2
3
4
5
6
7
2001 2002 2003 2004 2005 2006 2007
SALES
£BN
CAGR: 11.7%
HPBT
£M
0
50
100
150
200
250
2001 2002 2003 2004 2005 2006 2007
CAGR: 26.9%
19

Well placed for revenue growth and margin protection
Broad geographic spread
Wgt avg. market growth 07: 4%
Scale and high margin operations
Big upside in Emerging Markets
Wgt avg. GDP growth 08: 2.9%
Multiple brand relationshipsStrongest premium brands
Long-term and scale relationships
Right brands, right markets
Multi-Channels
Distribution: stable, strong cash generation funding expansion
Retail: continuing growth in mature markets; high growth opportunities
in Emerging Markets
Growth & Defensive value drivers
Diversified revenue streams
Growth drivers: Vehicles, F&I c.50% of Group trading profit
Defensive drivers: Parts, Service c.50% of Group trading profit
Robust business model
20
26 countries

Delivering the strategy: 2008 priorities
• Drive LFL vehicles growth ahead of the market to gain share
• Accelerate growth of highly profitable Aftersales
• Drive margin improvement in growth markets and protect margin in challenging markets
• Address structural profitability opportunities
Strengthen Expand
• Integrate acquisitions made in 2007 and deliver synergies
• Footprint expansion in Russia
• Footprint expansion in China
• Eastern Europe expansion
• Identify additional core markets
21

Delivering our strategy: 2008
Drive LFL vehicles growth ahead of the market to gain share
• New models and limited editions• Effective marketing to drive traffic• Continue to improve Customer experience• Improve conversion rate from footfall
Accelerate growth of highly profitable Aftersales • Inchcape Advantage roll-out to improve service• Global Aftersales score card to improve capacity utilisation
and productivity• Initiatives to increase service retention • Sales programmes to up-sell service
Drive margin improvement in growth markets and protect margin in challenging markets
• Increase the mix of profitable segments and models• Minimise the number of highly discounted deals [ie fleet]• Rigorous management of sales and marketing effectiveness
and overheads
Addressing restructuring opportunities • Disposal of French operation• Continue UK non-core disposals• Back office and process streamlining with SAP
Strengthen
Priorities Initiatives
22

• Stable economic outlook - 2007 market at record levels (>1m new cars) and expected to remain strong in 2008
• New product launches to drive sales - 64% Subaru line-up new in 2008:
• Impreza launched Q4 2007• Tribeca face lift in January 2008• Forester to launch March 2008• All new launches/facelifts within growth segments
• Continuous focus on Operational Excellence in Retail• Growth opportunities in Logistics
Australia: New model launches
23

Hong Kong: Strengthen our leadership position
• Strong market momentum to continue with 7-10% growth expected in 2008
• Excellent pipeline of new products:• MPV segment : Alphard, Noah 7-seater, new Mazda5, new Mazda8• Sedan : new Corolla from Toyota (end 07), new Mazda6 • Luxury : Lexus GS450H and Jaguar XF
• Continuous focus on Inchcape Advantage initiatives to drive Customer Service and improve conversion rate
• Significant growth initiatives in Aftersales• New Lexus service facilities to improve capacity• CRM programmes to improve retention• Up-sell initiatives to increase service revenues
Initiatives to exploit strong market momentum 24
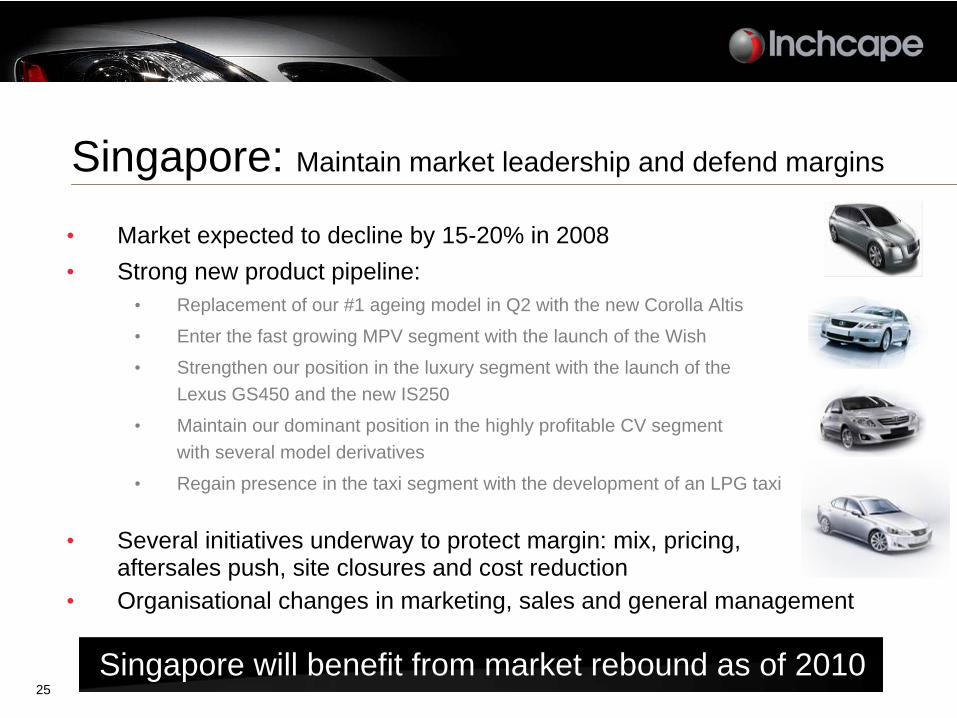
Singapore: Maintain market leadership and defend margins
• Market expected to decline by 15-20% in 2008 • Strong new product pipeline:
• Replacement of our #1 ageing model in Q2 with the new Corolla Altis
• Enter the fast growing MPV segment with the launch of the Wish
• Strengthen our position in the luxury segment with the launch of the Lexus GS450 and the new IS250
• Maintain our dominant position in the highly profitable CV segment with several model derivatives
• Regain presence in the taxi segment with the development of an LPG taxi
• Several initiatives underway to protect margin: mix, pricing, aftersales push, site closures and cost reduction
• Organisational changes in marketing, sales and general management
Singapore will benefit from market rebound as of 201025
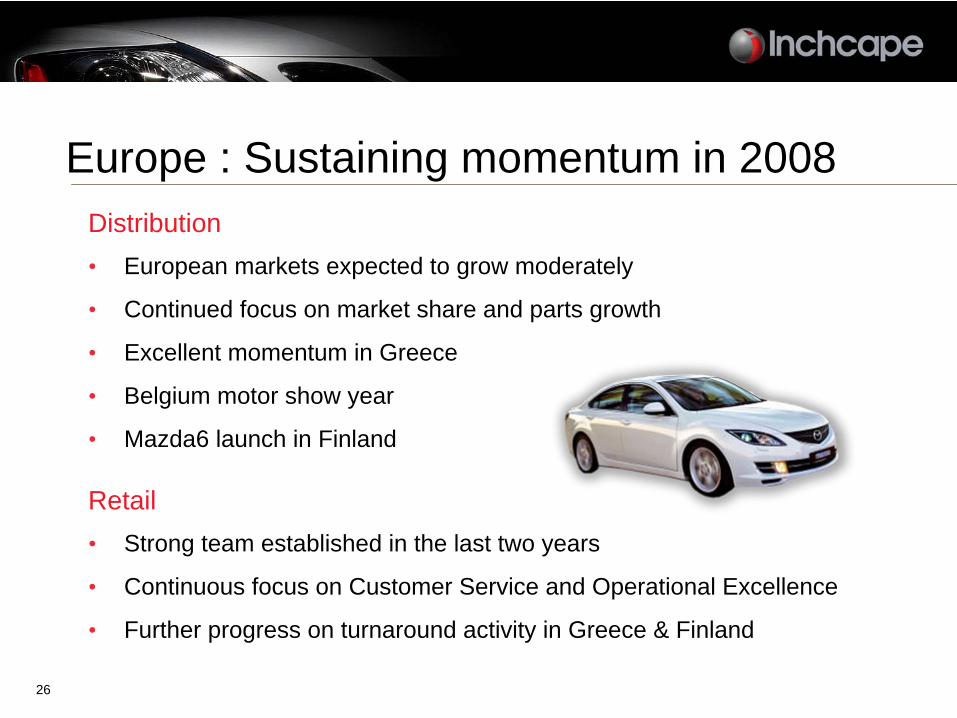
Europe : Sustaining momentum in 2008Distribution• European markets expected to grow moderately
• Continued focus on market share and parts growth
• Excellent momentum in Greece
• Belgium motor show year
• Mazda6 launch in Finland
Retail• Strong team established in the last two years
• Continuous focus on Customer Service and Operational Excellence
• Further progress on turnaround activity in Greece & Finland
26
• Premium partners expected to outperform the market, driven by new vehicle launches
• January market down 2.1% in aggregate but core premium partners were up 5.7%
• SMMT new car registrations forecast to decline by 2.5% in 2008
• OEMs continue to provide consumer offers to encourage new car sales
UK: Continued focus on premium brands
27

• Scale relationships with premium brand partners
• Stable & experienced franchise management structure
• High quality retail assets in freehold property portfolio
• Highly motivated & engaged colleagues in every retail centre
• Track record of consistent performance delivery
Revenue Growth• New Products
• Audi: Q5, A4, A3 Cab• BMW: X6, 1 Series Cab, 7 Series• Honda: Accord , Jazz• Mercedes-Benz: C Class Estate• VW: Tiguan, Scirocco, Passat Coupe
• Improve conversion rate from footfall• Service CRM
Gross Margin Initiatives• Mix management : models, used cars, aftersales• Increased F&I penetration using PCP formats• Flow-through of scale purchasing opportunities
Cost Control• Drive further cost reductions• Ongoing integration synergies• Process efficiencies : SAP streamlining
UK: well placed to outperform the market in 20082008 InitiativesCompetitive Advantages
28

ExpandDelivering our strategy: 2008
Integrate acquisitions made in 2007 and deliver synergies
• Further synergies from UK acquisitions• Latvia and Lithuania integration benefits• St Petersburg multi-brand scale benefits
Footprint expansion in Russia • Toyota St Petersburg sales and service capacity increase• New Lexus site development in St Petersburg• 2 sites in development in Moscow• Further expansion opportunities
Footprint expansion in China • Lexus Shaoxing opened in January 2008• Lexus opening in Shanghai in Q3• Increased pipeline of opportunities : M&A and Greenfield
Eastern Europe expansion • 2 sites under development in the Baltics• 5 sites under development in the Balkans• Greenfield development plans in Poland
Identify additional core markets • Several markets being researched : India, Brazil, South Africa, Ukraine, Turkey
Priorities Initiatives
29

• 2007 revenue increased 144% to £519m
• 13 sites under development : 5 relocations and 8 greenfield
• Targeting 50% increase in revenue in 2008
Emerging Markets delivering strong revenue growth
Inchcape Retail Centres in Emerging markets Emerging markets revenue
213
51912 13
0
5
10
15
20
25
30
35
40
2005 2006 2007 2008 2009 0
200
400
600
800
1,000
1,200
2006 2007 2008
£m
12
17
31
37 39
+50%
30

Strong fundamentals in Emerging Markets provide significant further growth
• Emerging Markets continue to grow at a rapid rate:• Inchcape Markets forecast to grow 20%* in 2008
• CAGR of 15% to 2011*
• Significant OEM investments leading to strong network expansion opportunities
• Sustainable margins as the car market develops
• Strong pipeline of opportunities
31* Source: Global Insight, Avtostat

Confident outlook for 2008 and beyond• Robust business model: excellent portfolio diversification
• Long term and scale relationships with OEMs
• Strong and stable management team
• Continued progress in developed markets
• Further expansion in high growth, higher margin Emerging Markets
• Significant cash generation, strong balance sheet
Group well placed to deliver further growth in 2008 and beyond32


AppendicesAppendices
Like-for-like definition
• Following are excluded from like-for-like sales:
• Businesses that are acquired, from the date of acquisition until the 13th month of ownership
• Businesses that are sold or closed
• Retail centres that are relocated from the date of opening until the 13th month of trading in the new location
35

Emerging markets definition
• Emerging markets are those markets in which the Group operates and where total new vehicle volume sales by international brands are growing by 10% or above per annum
• This currently covers the following countries:
• The Balkans• The Baltics• China • Poland• Russia
36

Impact of currency on pre-tax profit
(0.5)Interest/JV & Assoc PAT
(6.3)Pre-tax profit
(5.8)Trading profits
(2.3)57.054.7Other
0.942.943.8Australia
(1.7)47.746.0Singapore
(2.7)31.028.3Hong Kong
Currencyimpact
2007constant currency
2007actual exchange rates£m
37

Disclaimer
The information and opinions contained in this presentation are provided as at the date of the document.
Certain statements in this presentation, particularly those regarding the future prospects of Inchcape plc (“Inchcape”), returns, pricing, acquisitions, divestments, industry growth or other trend projections are or may be forward-looking statements. These forward-looking statements are not historical facts, nor are they guarantees of future performance. Such statements are based on current expectations and belief and, by their nature, are subject to a number of known and unknown risks and uncertainties which may cause the actual results, prospects and developments of Inchcape to differ materially from those expressed or implied by these forward-looking statements.
Except as required by any applicable law or regulation, Inchcape expressly disclaims any obligation or undertaking to release publicly any updates or revisions to any forward-looking statements contained in this presentation to reflect any change in Inchcape’s expectations with regard thereto or any change in events, conditions or circumstances on which any such statement is based.
All information in the presentation is the property of Inchcape plc and may not be reproduced or recorded without the written permission of the company. Nothing contained in the presentation constitutes or shall be deemed to constitute an offer or invitation to invest in or otherwise deal in any shares or other securities of Inchcape plc.
38
