preliminary result of a large scale microscopic...
TRANSCRIPT
Preliminary Result of a Large Scale MicroscopicEvacuation Simulation for the City of Padang in
the Case of Tsunami
Gregor Lammel1, Hubert Klupfel2, and Kai Nagel1
1 Berlin Institute of Technology (TU Berlin), Transport Systems Planning andTransport Telematics, Berlin, Germany
[email protected] TraffGo HT GmbH
Bismarckstraße 142a – 47057 Duisburg – [email protected]
Abstract. The evacuation of whole cities or even regions is an impor-tant problem, as demonstrated by recent events such as evacuation ofHouston in case of Hurricane Rita or the evacuation of coastal cities incase of Tsunamis. The city of Padang, Western Sumatra, Indonesia islocated in a zone of extreme risk due to severe earthquakes and possi-bly triggered tsunamis. A robust and flexible simulation framework forsuch large-scale disasters helps to predict the evacuation process, in orderto give evacuation relevant recommendations for a better preparednessfor a real event of tsunami. Existing methods are either geared towardssmaller problems (e.g. Cellular Automata techniques) or are not micro-scopic (e.g. methods based on dynamic traffic assignment). This paperpresents a technique that is both microscopic and capable to process largeproblems. The simulation framework is applied to the city of Padang inthe case of a Tsunami warning. In this paper we give a description of thesimulation framework. Although the results are still preliminary, we showfirst simulation results and give an analysis with respect to evacuationtime, evacuation process, and the outflow rate of evacuees.
1 Introduction
The evacuation of whole cities or even regions is an important problem, asdemonstrated by recent events such as the evacuation of Houston in the caseof hurricane Rita or the evacuation of coastal cities in the case of tsunamis. Asa consequence of these events, disaster and evacuation planning has become animportant topic in science and politics.
Congruent with the importance of the topic, there is a large body of researchregarding emergency evacuations. As a first classification, one may differentiatebetween two situations: (i) evacuation from within buildings, ships, airplanes,etc.; (ii) large-scale citywide or regional evacuations, e.g. because of nuclearpower plants failures or because of hurricanes. Case (i) usually concerns pedes-trian evacuation; case (ii) usually uses traffic-based evacuation.

2 Lammel et al.
A good overview of pedestrian evacuation modeling and software can befound in the books of the bi-annual conference series “Pedestrian and EvacuationDynamics” [44, 14, 15, 1]. Pedestrian evacuation simulations can be classified intomicroscopic and macroscopic ones. Microscopic models represent space, time,and persons on a fine-grained level. Possible microscopic approaches are Cellu-lar Automata (CA) [30], discretized differential equations (“molecular dynamics(MD)”) [23, 22], or movement rules based on random utility modelling [5]. Exam-ples of software packages based on microscopic models are Exodus [13], Myriad(www.crowddynamics.com), Egress (www.aeat-safety-and-risk.com/html/egress.html), and PedGo [29]. Macroscopic models use the analogy of flows ofpedestrians and liquids. Examples of software packages based on macroscopicmodels are Aseri [43] and Simulex (www.iesve.com). See Refs. [27] and [31] forsurveys. Compared to what is known in terms of field measurements (e.g. [39,48]), most if not all packages lead to similar results [40].
Once the pedestrian movement model is selected, it is necessary to define theevacuation directions. For more complex geometries, this is no longer a singlemovement towards one or two exits, but may involve rather complex movmentsin a building or in a street network. The arguably simplest solution is a grid-based potential function where the “uphill direction” leads to the nearest exit[37]. The same can be done using essentially continous spatial variables, at theexpense of much larger computing times [26]. Alternatively, routing can be donealong graphs [20, 17], which is a much faster technique when the abstraction toa graph is possible.
Another line of research concerns citywide or regional evacuations, i.e. case (ii).The development of these tools was much influenced by the development of toolsin the areas of transport planning and traffic management. At the core of manyof these methods is a static assignment routine (e.g. [45, 38]). A typical examplefor traffic-based evacuation simulation based on static concepts is MASSVAC[25] although later versions contain dynamic aspects.
A severe shortcoming of static assignment is that it does not possess anyconsideration of the time-of-day dynamics. Dynamic traffic assignment (DTA) isdefined as a distribution of time-dependent trips on routes. A typical approachto implement DTA is day-to-day re-planning: The traffic flow simulation (alsocalled network loading) is run with pre-specified routes, route costs are extracted,some or all of the routes are modified, the traffic flow simulation is run again,etc., until some stopping criterion is fulfilled. Examples of stopping criteria arethat either every trip uses a route which minimizes expected travel time (time-dependent Nash equilibrium), or it selects between different route alternativesfollowing a pre-specified distribution function (time-dependent SUE).
Many DTA packages have been tested in the evacuation context: MITSIM[28], Dynasmart [32, 10], PARAMICS [9], and VISSIM [21]. Oak Ridge NationalLaboratory has a package named “OREMS” (cta.ornl.gov/cata/One Pagers/OREMS.pdf) explicitly for evacuation traffic. Publications stressing dynamicaspects of traffic-based evacuation as a novelty can be found as recent as 2000,e.g. [41, 3]. For a review, see [2].

Large-scale evacuation simulation 3
A further distinction is if travelers can re-route while they are on their way(within-day re-planning; en-route re-planning), or only before their trip (day-to-day re-planning; pre-trip re-planning) [8]. Clearly, en-route re-planning capa-bility is more realistic. It is, however, also more demanding: Adaptation of theplans needs to be called frequently from within the network loading, rather thanonly having to alternate between the network loading and the mental layers asone does in day-to-day re-planning.
To our knowledge, none of the above aproaches is able to simulate large-scalescenarios (with millions of entities) while remaining microscopic:
– With a CA model, an area of 40 km× 40 km translates into 1010 cells. Evenif every cell only needs 1 Byte, this still translates into 10 GByte of memory,resulting in large simulation times.
– For the MD approach, the problem are the sub-second time resolutions thatare typically used [12].
– DTA approaches seem the most likely candidates, but to our knowledgetheir implementation of the traffic flow dynamics usually is still too time-consuming for scenarios of that size.
One way to achieve faster computation with a microscopic model is to usea model with deliberately large time steps and to computationally concentrateon those areas (links) where the pedestrian movement actually takes place [18].Another approach is based up on a modified queuing model [16, 46]. The queuingmodel simplifies streets to edges and crossings to nodes; the difference to stan-dard queuing theory is that agents (particles) are not dropped but spill back,causing congestion. This graph-oriented model is defined by lengths/widths, freespeed and flow capacity of the edges. This simplification leads to a major speedupof the simulation while keeping results realistic The combination of these twoapproaches (switching off unused links; queue model) is used in this paper.
A robust simulation framework will help to find feasible solutions for arbi-trary evacuation scenarios. The aim of this work is to find feasible evacuationsolutions for an evacuation of large cities or regions by foot. This means we arelooking for solutions from which it is possible to derive recommendations forthe real world. This work is part of the current multi-disciplinary project “Last-Mile” [6]. The overarching goal of “Last-Mile” is to develop jointly with localpartners a numerical last mile tsunami early warning and evacuation informationsystem on the basis of detailed earth observation data and techniques as well ashydraulic numerical modeling of small-scale flooding and inundation dynamicsof the tsunami including evacuation simulations in the urban coastal hinterlandfor the city of Padang, West Sumatra, Indonesia. It is well-documented thatSumatra’s third largest city with one million inhabitants is located directly onthe coast and partially sited beneath the sea level, and thus, is located in a zoneof extreme risk due to severe earthquakes and tentatively triggered tsunamis.
To develop an evacuation simulation for such a big city one needs muchpreparatory work, i.e. one needs detailed picture of the walkable area of the city,the socio-economic profile and of the expected extension of the inundation. Inthis article we will not go into detail how this information was explored. The
4 Lammel et al.
interested reader is referred to [33] for more information about how to get thenecessary input data.
2 Simulation framework
The simulation framework is based on the MATSim framework for transportsimulation [35]. Since MATSim is focused on simulation of motorized traffic,several adaptations were necessary. The key elements are:
– The agent database, where every agent represents one evacuee.– The simulation network, based on links and nodes.– The traffic flow simulator, where all the agents plans are executed.– The plans generator, which generates an escape plan for every agent.– There is a mechanism that allows improving the performance of the agents’
plans by repeatedly trying to find faster evacuation routes.
2.1 Synthetic population, plans, agent database
MATSim always start with a synthetic population of all involved individuals. Asynthetic population is a randomly generated population of individuals which isbased as much as possible on existing data such as census data. For evacuation,the synthetic population is the collection of all synthetic individuals that areinvolved in the evacuation.
Every synthetic individual possesses one or several plans. These plans are“intentions” of the synthetic individuals, to be tested in the traffic flow sim-ulation described later, and scored afterwards. For evacuation, the plans areevacuation strategies. For example, such a strategy may be to leave the building5 minutes after a second warning, and follow a predetermined route to safety.The collection of agents together with their plans is sometimes called an agentdatabase.
People can have different positions within the city when a warning occurs.For example, they can be at home or at work. Therefore, also in the evacuationcontext it makes sense to consider MATSim plans in their more conventionalmeaning, as a description on what a synthetic traveller intends to do during anormal day. One can then run a regular traffic flow simulation with these plans,stop it at the time of an evacuation warning, and use the positions of all agentsat the time of that warning as the initial condition to the evacuation.
2.2 Simulation network
The simulation network represents the area that is accessible by the evacuees. Inthe case of a vehicular evacuation this network consists of all accessible streets.Each street segment defines a link. The parameters of the links are the length,capacity and the free flow speed. For a pedestrian evacuation the links in thesimulation network also consist of squares and sidewalks. The flow capacity is

Large-scale evacuation simulation 5
given by the width of a link as described in the next section. A good way ofcreating the simulation network is by extracting the needed information fromsatellite imagery.
In the case of an evacuation simulation the network has time dependentattributes. For instance large-scale inundations or conflagrations do not coverall the endangered area at once. In fact the spreading of the threat could beseen as a function of time. One solution would be by modeling this as a timevariant network. This means streets, bridges etc. will be blocked as soon as theyno longer passable. In MATSim time variant aspects of the network are modeledas network change events. A network change event modifies parameters of a linkin the network (e.g. free speed or flow capacity). As soon as a link is no longerpassable its free speed will be set to zero.
2.3 Traffic flow simulator
The traffic flow simulation is implemented as a queue simulation, where eachstreet (link) is represented as a FIFO (first-in first-out) queue with three re-strictions [16]. First, each agent has to remain for a certain time on the link,corresponding to the free speed travel time. Second, a link flow capacity is de-fined which limits the outflow from the link. If, in any given time step, thatcapacity is used up, no more agents can leave the link. Finally, a link storagecapacity is defined which limits the number of agents on the link. If it is filled up,no more agents can enter this link. The difference to standard queueing theoryis that agents (particles) are not dropped but spill back, causing congestion.
Fig. 1. Functioning of the queue model is shown in (a) and its corresponding funda-mental diagram in (b).

6 Lammel et al.
An illustration of the queue model is shown in Fig. 1 a). The parameters ofthe model are:
– Link minimum width w– Link area A– Link length l– Flow capacity FC = w ∗ Cmax = w ∗ 1.3 p
m∗s– Free flow speed vmax = 1.66ms– Storage capacity SC = A ∗Dmax = A ∗ 5.4 p
m2
where Cmax is the maximum flow capacity per unit width, and Dmax is themaximum density per unit area.
The parameters have been chosen to approximate Weidmann’s fundamentaldiagram [48].3 He pointed out that the relation between density and velocity isadequately captured by the so-called Kladek-formula:
vF,hi(D) = vF,hf × [1 − e−γ×( 1D−
1Dmax
)]
With:
– vF,hi the velocity at a particular density [m/s],– vF,hf the velocity at free flow [m/s],– γ a free parameter [persons/m2],– D the actual density [persons/m2] and– Dmax the density at which no flow occurs [persons/m2].
Empirical studies showed the best results with γ = 1.913 persons/m2, vF,hf =1.34 m/s and Dmax = 5.4 person/m2.
Our study uses the same maximum density, but the free flow speed was setto 1.66 m/s. This value is slightly higher then the 1.34 m/s used by Weidmann,but the values presented by Weidmann reflect the pedestrian flow under normalconditions and not in a case of emergency.
Our queuing model, however, generates a speed-density relationship of theform v = min[vmax, FC/D] [47]. The flow capacity FC is a free parameter thathas to be chosen to fit the desired fundamental diagram. Even if a completeagreement is not possible, with FC = 1.3 p
m∗s the flow dynamics produced byour queue model is not too far away from Weidmann’s fundamental diagram (cf.Fig. 1 b)). Furthermore, Predtechenskii’s and Milinskii’s [39] empirical studysupports a value of approx. 1.3 p
m∗s for the flow capacity.
2.4 Plans generation
Initial plans use the shortest path (according to free speed travel time) out ofthe evacuation area for all agents. Within the MATSim framework a shortest
3 Newer studies [42] imply other fundamental diagrams then those from Weidmann.An adaptation of these values could, in consequence, become necessary in future.

Large-scale evacuation simulation 7
path router based on Dijkstra’s shortest path algorithm [11] has been imple-mented. This router finds the shortest path in a weighted graph from one nodeto any other, whereby the actual weights for a link are defined by a time- anddistance-dependent cost function. Since we want to evacuate the city as fast aspossible, the weights represents the (expected) travel time. There is, however,no particular node as the target of the shortest path calculation, as the evacueeshave more than one safe place to run to. Instead, in the underlying domain everynode outside the evacuation area is a possible destination for an agent that islooking for an escape route. To resolve this, the standard approach (e.g. [34])is to extend the network in the following way: All links which lead out of theevacuation area are connected, using virtual links with infinite flow capacity andzero length, to a special “evacuation node”, and all paths are routed to that spe-cial evacuation node. Doing so, Dijkstra’s algorithm will always find the shortestroute from any node inside the evacuation area to this evacuation node and, inconsequence, to safety.
2.5 Agents learning
After an execution of the traffic flow simulation, every agent will score the per-formed plan. The score of a plan is calculated by a scoring function as it isdescribed later. The scored plans remain in the agents’ memory for further ex-ecutions. For the learning procedure two different learning strategies were used.The ReRoute strategy generates new plans with new evacuation routes based onthe information of the experienced travel times from the last run. This uses therouter described in the previous section, but using time-variant link travel timesas link costs. The other strategy is called ChangeExpBeta. This strategy decidesif the just performed plan should be used again, or if a random plan out of thememory should be selected for the next iteration. The probability to change theselected plan is calculated by
pchange = min(1, α ∗ eβ∗(srandom−scurrent)/2)
With:
– α: The probability to change if both plans have the same score– β: A sensitivity parameter– s{random,current}: The score of the current/random plan
If the system is “well-behaved”, this set-up converges to a steady state wherethe probability that agent a uses plan i is
pa,i =eβ∗sa,i∑j eβ∗sa,j
,
i.e. the standard multinomial logit model (e.g. [4]).The plans score (utility) is determined by the scoring function:
Ui = βtr ttr,i + βdist di

8 Lammel et al.
where Ui is the (dis)utility of plan i, βevac is the marginal utility (in 1/h) fortravel (normally negative), ttr,i is the experienced travel time for plan i, betadistrepresents the marginal utility (in 1/km) of distance (normally negative), anddi the distance covered by executing plan i.
Each strategy is selected with a certain probability. These probabilities areassigned before the simulation starts, but they can be varied during the itera-tions. Typically, ReRoute is called with a relatively small probability, say 10%,and ChangeExpBeta is called in the remaining cases.
After re-planning every agent has a selected plan that will be executed in thenext iteration. Repeating this iteration cycle of learning, the agents’ behaviorwill move towards a Nash equilibrium. If the system were deterministic, then astate where every agent uses a plan that is a best response to the last iterationwould be a fixed point of the iterative dynamics, and at the same time a NashEquilibrium since no agent would have an incentive to unilaterally deviate. Since,however, the system is stochastic, this statement does not hold, and instead welook heuristically at projections of the system. From experience it is enoughto run 100 iterations until the iterative dynamics has reached a steady state.In most (but not all) evacuation situations, the Nash equilibrium leads to ashorter overall evacuation time than when everybody moves to the geographicallynearest evacuation point. On the other hand, a Nash equilibrium means thatnobody has an incentive to deviate. The Nash equilibrium in an evacuationsituation can therefore be considered as a solution that could be reached byappropriate training.
3 Scenario
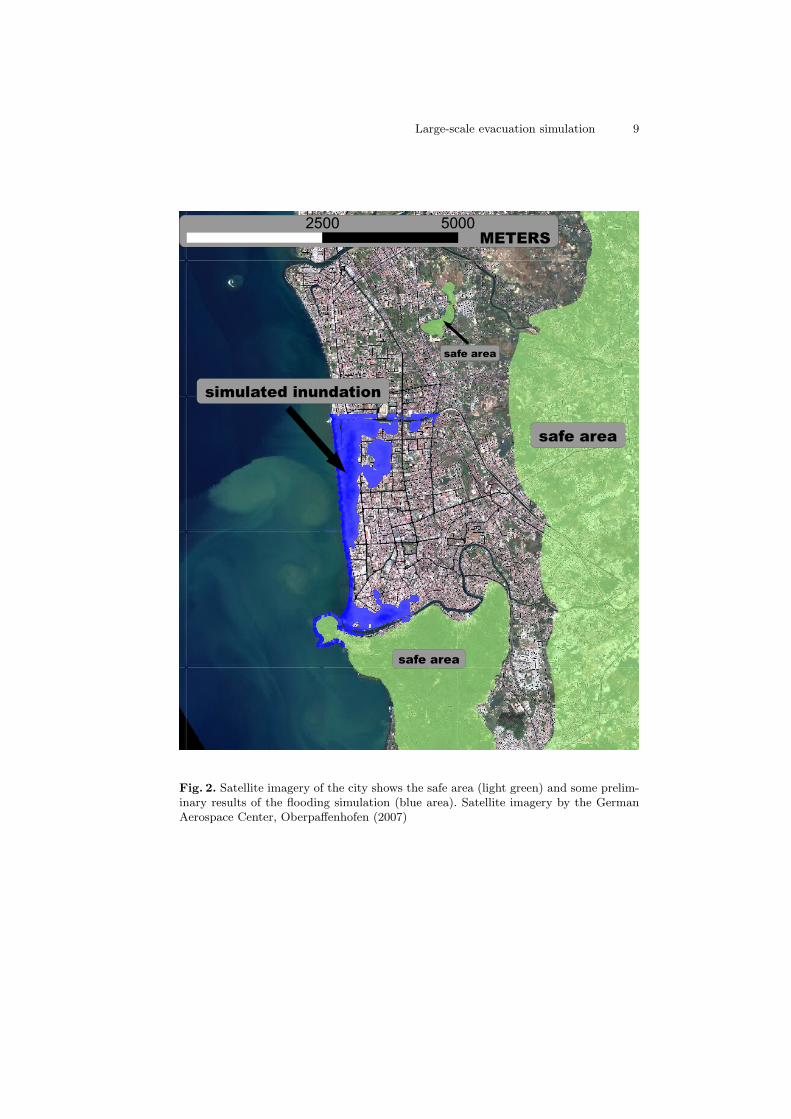
The evacuation procedure of a city depends on the distribution of the population.The distribution of the population changes over the time of day. That means onehas to develop different evacuation scenarios for different times of day. Here wepresent a scenario called: “evacuation at 3 am”. That means we assume all inhab-itants are at home. It is then straightforward to derive the necessary informationabout the population from existing census data. The presented simulation reliesupon the census for 2005 and was provided by the statistical bureau of Padang[7]. Another important aspect is the information about safe places. In future itis planned to identify buildings that are suitable for a vertical evacuation. Forthe time being we use a simpler approach: All areas with an elevation of morethe 10 m above sea level are defined as safe. Fig.2 shows an image of the city withthe safe area. However, based on models of small-scale flooding and inundationdynamics of the tsunami [19] it is not expected that all the area below 10 mwill be flooded. Based on these simulations, one also learns that the estimatedtime between the earthquake and the inundation of the city is about 28 min.The results are backed by the results of large-scale tsunami simulations for thewest coast of Sumatra Island [36]. Adding this to the simulation, the frameworkmakes the agents learn a more risk averse behavior, they are not only trying toreach the safe area as fast as possible, but they also try to avoid the flooding.
Large-scale evacuation simulation 9
2500 5000METERS
safe area
safe area
safe area
simulated inundation
Fig. 2. Satellite imagery of the city shows the safe area (light green) and some prelim-inary results of the flooding simulation (blue area). Satellite imagery by the GermanAerospace Center, Oberpaffenhofen (2007)

10 Lammel et al.
1000 2000METERS
3000
5 min
15 min
35 min
1000 2000METERS
3000
5 min
15 min
25 min
35 min
25 min
simulated inundation
simulated inundation
Fig. 3. Evacuation progress after 5 min, 15 min, 25 min and 35 min. Top: Resultsof the first iteration (shortest path solution). Bottom: Results of the last iteration(“Nash equilibrium” approach). One observes that, in the last iteration, for given timesmuch larger areas are evacuated. Satellite imagery by the German Aerospace Center,Oberpaffenhofen (2007)
Large-scale evacuation simulation 11
In some places the flooding will reach locations that are more than 2 km awayfrom the shoreline.
4 Results
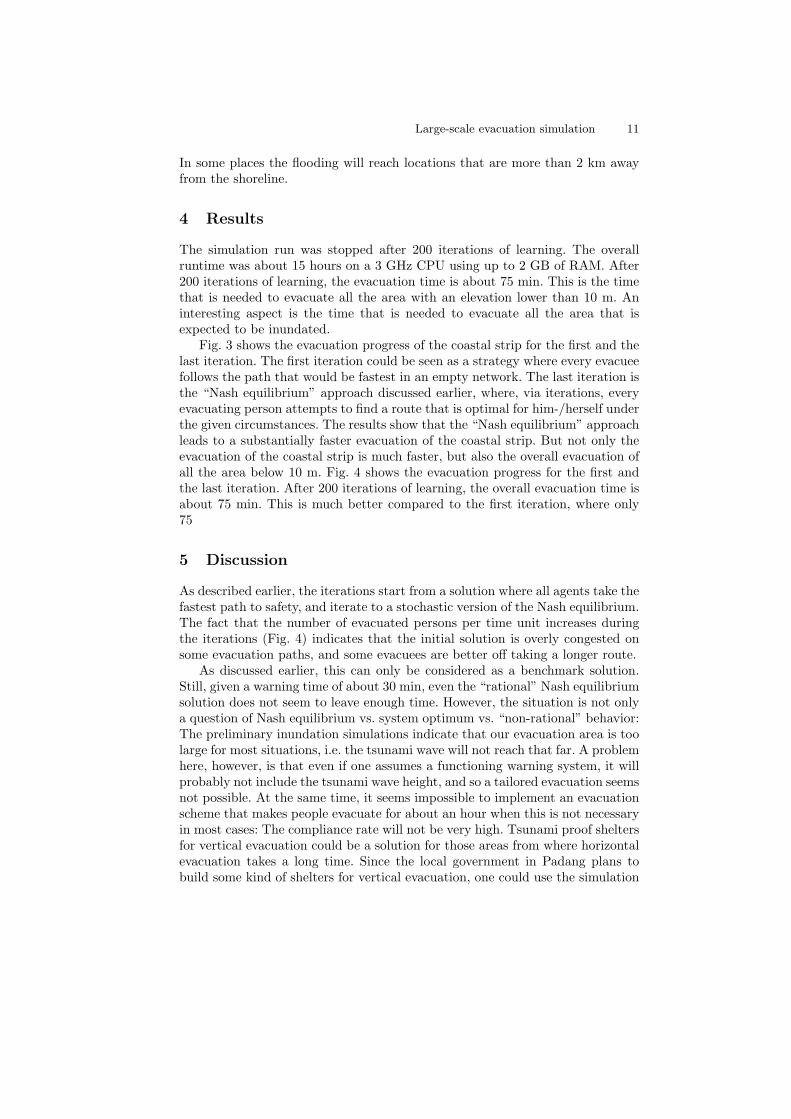
The simulation run was stopped after 200 iterations of learning. The overallruntime was about 15 hours on a 3 GHz CPU using up to 2 GB of RAM. After200 iterations of learning, the evacuation time is about 75 min. This is the timethat is needed to evacuate all the area with an elevation lower than 10 m. Aninteresting aspect is the time that is needed to evacuate all the area that isexpected to be inundated.
Fig. 3 shows the evacuation progress of the coastal strip for the first and thelast iteration. The first iteration could be seen as a strategy where every evacueefollows the path that would be fastest in an empty network. The last iteration isthe “Nash equilibrium” approach discussed earlier, where, via iterations, everyevacuating person attempts to find a route that is optimal for him-/herself underthe given circumstances. The results show that the “Nash equilibrium” approachleads to a substantially faster evacuation of the coastal strip. But not only theevacuation of the coastal strip is much faster, but also the overall evacuation ofall the area below 10 m. Fig. 4 shows the evacuation progress for the first andthe last iteration. After 200 iterations of learning, the overall evacuation time isabout 75 min. This is much better compared to the first iteration, where only75
5 Discussion
As described earlier, the iterations start from a solution where all agents take thefastest path to safety, and iterate to a stochastic version of the Nash equilibrium.The fact that the number of evacuated persons per time unit increases duringthe iterations (Fig. 4) indicates that the initial solution is overly congested onsome evacuation paths, and some evacuees are better off taking a longer route.
As discussed earlier, this can only be considered as a benchmark solution.Still, given a warning time of about 30 min, even the “rational” Nash equilibriumsolution does not seem to leave enough time. However, the situation is not onlya question of Nash equilibrium vs. system optimum vs. “non-rational” behavior:The preliminary inundation simulations indicate that our evacuation area is toolarge for most situations, i.e. the tsunami wave will not reach that far. A problemhere, however, is that even if one assumes a functioning warning system, it willprobably not include the tsunami wave height, and so a tailored evacuation seemsnot possible. At the same time, it seems impossible to implement an evacuationscheme that makes people evacuate for about an hour when this is not necessaryin most cases: The compliance rate will not be very high. Tsunami proof sheltersfor vertical evacuation could be a solution for those areas from where horizontalevacuation takes a long time. Since the local government in Padang plans tobuild some kind of shelters for vertical evacuation, one could use the simulation

12 Lammel et al.
evacution progress
evacuated persons
0
50,000
100,000
150,000
200,000
250,000
300,000
350,000
time in min0 10 20 30 40 50 60 70
first iterationlast iteration
Fig. 4. Comparison of the evacuation curves of the first iteration (shortest path solu-tion) and the last iteration (“Nash equilibrium” approach). The curves are truncatedat 75 min.
to find appropriate locations for these shelters. It might also be possible to usethe roofs of stable buildings for shelter. Another issue concerns the mode choice:The investigation assumes that all evacuation is done by foot while it might bereasonable to assume that some people use cars or cycles, and they might evenleave vehicles in the street to continue on foot if progress by vehicle becomestoo slow. For the time being, such issues are not considered. The queue modelcould, to a certain extent, be parameterized to deal with mixed traffic, as long asall modes move with the same speed. The effect of “stranded” vehicles could beincluded by a parameterization of the flow capacity of the queue model, althougha behavioral model for abandoning vehicles would be needed. Beyond that, onewould arguably need to switch to a true two-dimensional model such as [24] or[29]. Such models could still operate on networks [17].
6 Conclusion
We introduced the evacuation related part of the “Last-Mile” project. The mi-croscopic large-scale evacuation simulation is based on the MATSim framework.It is implemented as a Multi Agent Simulation, where every agent tries to opti-mize its individual evacuation plan in an iterative way. We discuss the simulationframework, the necessary input data, show preliminary results, and discuss these

Large-scale evacuation simulation 13
results. In the current base case it is assumed that all people are at home. Cur-rently we are working on more detailed picture of the population. Based oncensus data and the results of a survey with 1000 households, that took place inApril/Mai 2008, we are developing a synthetic population with individual dailyplans. From this synthetic population it will be possible to derive a model of thepopulation distribution at any time of day. In future work it is also planed tointegrate tsunami proof shelters into the simulation framework. Therefore thesimulation framework could be extended in a way to find optimal location forthe tsunami proof shelters.
7 Acknowledgments
This project was funded in part by the German Ministry for Education andResearch (BMBF), under grants numbers 03G0666E (“last mile”) and 03NAPI4(“Advest”).
References
1. Pedestrian and Evacuation Dynamics. Proceedings of the 4th international con-ference, Wuppertal, 2008. Springer, Berlin, 2008.
2. R. Alsnih and P. Stopher. A review of the procedures associated with devis-ing emergency evacuation plans. Working Paper ITS-WP-04-04, Institute ofTransport Studies, The University of Sydney and Monash University, 2004. Seewww.itls.usyd.edu.au/publications/working papers/wp2004/its wp 04-04.pdf.
3. B. Barrett, B. Ran, and R. Pillai. Developing a dynamic traffic management mod-eling framework for hurricane evacuation. Paper 00-1595, Transportation ResearchBoard Annual Meeting, Washington, D.C., 2000.
4. M. Ben-Akiva and S. R. Lerman. Discrete choice analysis. The MIT Press, Cam-bridge, MA, 1985.
5. M. Bierlaire, G. Antonini, and M. Weber. Behavioral dynamics for pedestrians. InK. Axhausen, editor, Moving through nets: The physical and social dimensions oftravel. Elsevier, 2003.
6. J. Birkmann, S. Dech, G. Hirzinger, R. Klein, H. Klupfel, F. Lehmann, C. Mott,K. Nagel, T. Schlurmann, N. Setiadi, F. Siegert, and G. Strunz. Numerical last-mile tsunami early warning and evacuation information system. In L. Stroink,editor, GEOTECHNOLOGIEN Science Report No. 10: “Early Warning Systems inEarth Management”, Technical University Karlsruhe, October 2007. Die DeutscheBiliothek.
7. BPS. Kecamatan Dalam Angka - Subdistricts in Numbers. Statistical bureau (BPS)Kota Padang, Padang, 2005.
8. E. Cascetta and C. Cantarella. A day-to-day and within-day dynamic stochasticassignment model. Transportation Research A, 25A(5):277–291, 1991.
9. X. Chen and F. Zhan. Agent-based modeling and simulation of urban evacuation:Relative effectiveness of simultaneous and staged evacuation strategies. Paper 04-0329, Transportation Research Board Annual Meeting, Washington, D.C., 2004.
10. Y.-C. Chiu, P. Korada, and P. Mirchandani. Dynamic traffic management for evac-uation. Paper 05-2369, Transportation Research Board Annual Meeting, Washing-ton, D.C., 2005.
14 Lammel et al.
11. E. Dijkstra. A note on two problems in connexion with graphs. NumerischeMathematik, 1:269–271, 1959.
12. I. Farkas. pedsim source code, accessed 2008. See pedsim.elte.hu.13. E. Galea. Simulating evacuation and circulation in planes, trains, buildings and
ships using the EXODUS software. In Schreckenberg and Sharma [44], pages 203–225.
14. E. R. Galea, editor. Pedestrian and Evacuation Dynamics. Proceedings of the 2ndinternational conference, London, 2003. CMS Press, University of Greenwich, UK,2003.
15. P. Gattermann, N. Waldau, and M. Schreckenberg, editors. Pedestrian and Evacu-ation Dynamics. Proceedings of the 3rd international conference, Vienna. Springer,Berlin, 2006.
16. C. Gawron. An iterative algorithm to determine the dynamic user equilibrium in atraffic simulation model. International Journal of Modern Physics C, 9(3):393–407,1998.
17. C. Gloor, P. Stucki, and K. Nagel. Hybrid techniques for pedestrian simulations.In P. Sloot, B. Chopard, and A. Hoekstra, editors, Cellular automata, Proceedings,number 3305 in Lecture Notes in Computer Science, pages 581–590. Springer, 2004.
18. C. Gloor, P. Stucki, and K. Nagel. Hybrid techniques for pedestrian simulations. InProceedings of Swiss Transport Research Conference (STRC), Monte Verita, CH,2004. See www.strc.ch.
19. N. Goseberg, A. Stahlmann, S. Schimmels, and T. Schlurmann. Highly-resolved nu-merical modeling of tsunami run-up and inundation scenarios in the city of Padang,West Sumatra. In Interantional Conference on Coastal Engineering, Hamburg, inpress.
20. S. Hamacher, H.W. Tjandra. Mathematical modelling of evacuation problems: Astate of art. Berichte des Fraunhofer ITWM, 24:1–38, 2001.
21. L. Han and F. Yuan. Evacuation modeling and operations using dynamic trafficassignment and most desirable destination approaches. Paper 05-2401, Transporta-tion Research Board Annual Meeting, Washington, D.C., 2005.
22. D. Helbing, L. Buzna, A. Johansson, and T. Werner. Self-organized pedestriancrowd dynamics: experiments, simulations and design solutions. TransportationScience, 39:1–24, 2005.
23. D. Helbing, I. Farkas, P. Molnar, and T. Vicsek. Simulation of pedestrian crowdsin normal and evacuation situations. In Schreckenberg and Sharma [44], pages21–58.
24. D. Helbing, I. Farkas, and T. Vicsek. Simulating dynamical features of escapepanic. Nature, 407:487–490, 2000.
25. A. Hobeika and C. Kim. Comparison of traffic assignments in evacuation modeling.IEEE Transactions on Engineering Management, 45(2):192–198, 1998.
26. S. Hoogendoorn, P. Bovy, and W. Daamen. Microscopic pedestrian wayfinding anddynamic modelling. In Schreckenberg and Sharma [44], pages 123–154.
27. M. Jafari, I. Bakhadyrov, and A. Maher. Technological advances in evacuationplanning and emergency management: Current state of the art. Final ResearchReports EVAC-RU4474, Center for Advanced Infrastructure and Transportation(CAIT), Rutgers University, NJ, 2003.
28. M. Jha, K. Moore, and B. Pashaie. Emergency evacuation planning with micro-scopic traffic simulation. Paper 04-2414, Transportation Research Board AnnualMeeting, Washington, D.C., 2004.
29. H. Klupfel. The simulation of crowd dynamics at very large events – Calibration,empirical data, and validation. In Gattermann et al. [15], pages 285–296.
Large-scale evacuation simulation 15
30. H. Klupfel, T. Meyer-Konig, A. Keßel, and M. Schreckenberg. Simulating evacua-tion processes and comparison to empirical results. In M. Fukui et al, editor, Trafficand granular flow ’01, pages 449–454. Springer, Berlin Heidelberg New York, 2003.
31. E. Kuligowski. Review of 28 egress models. Technical report, National Institute ofStandards and Technology (NIST), Gaithersburg, MD, 2004.
32. E. Kwon and S. Pitt. Evaluation of emergency evacuation strategies for down-town event traffic using a dynamic network model. Paper 05-2164, TransportationResearch Board Annual Meeting, Washington, D.C., 2005.
33. G. Lammel, M. Rieser, K. Nagel, H. Taubenbock, G. Strunz, N. Goseberg,T. Schlurmann, H. Klupfel, N. Setiadi, and J. Birkmann. Emergency prepared-ness in the case of a tsunami – evacuation analysis and traffic optimization for theIndonesian city of Padang. In Pedestrian and Evacuation Dynamics [1].
34. Q. Lu, B. George, and S. Shekhar. Capacity constrained routing algorithms forevacuation planning: A summary of results. LNCS, 3633:291–307, 2005.
35. MATSIM www page. MultiAgent Transport SIMulation. http://matsim.org/,accessed 2008.
36. J. McCloskey, A. Antonioli, A. Piatanesi, K. Sieh, S. Steacy, S. Nalbant, M. Cocco,C. Giunchi, J. Huang, and P. Dunlop. Tsunami threat in the Indian Ocean froma future megathrust earthquake west of Sumatra. Earth and Planetary ScienceLetters, 265:61–81, 2008.
37. K. Nishinari, A. Kirchner, A. Nazami, and A. Schadschneider. Extended floorfield CA model for evacuation dynamics. IEICE Transactions on Information andSystems, E87-D(3):726–732, 2004.
38. J. d. D. Ortuzar and L. Willumsen. Modelling transport. Wiley, Chichester, 1995.39. W. Predtetschenski and A. Milinski. Planning for Foot Traffic in Buildings.
Amerind Publishing Co. Pvt. Ltd., New Delhi, 1978.40. C. Rogsch. Vergleichende Untersuchungen zur Simulation von Personentromen.
Diploma thesis, Universitat Wuppertal, 2005.41. P. Sattayhatewa and B. Ran. Developing a dynamic traffic management model for
nuclear power plant evacuation. Paper, Transportation Research Board AnnualMeeting, Washington, D.C., 2000.
42. A. Schadschneider, W. Klingsch, H. Klupfel, T. Kretz, C. Rogsch, and A. Seyfried.Evacuation dynamics: Empirical results, modelling and applications. In B. Meyers,editor, Encyclopedia of Complexity and System Science. Springer, Berlin, to appear.
43. V. Schneider and R. Konnecke. Simulating evacuation processes with ASERI. InSchreckenberg and Sharma [44], pages 303–314.
44. M. Schreckenberg and S. D. Sharma, editors. Pedestrian and Evacation Dynamics.Proceedings of the 1st international conference, Duisburg, 2001. Springer, 2002.
45. Y. Sheffi. Urban Transportation Networks: Equilibrium Analysis with MathematicalProgramming Methods. Prentice-Hall, Englewood Cliffs, NJ, USA, 1985.
46. P. Simon, J. Esser, and K. Nagel. Simple queueing model applied to the city ofPortland. International Journal of Modern Physics C, 10(5):941–960, 1999.
47. P. Simon and K. Nagel. Simple queueing model applied to the city of Portland. Pa-per 99-0861, Transportation Research Board Annual Meeting, Washington, D.C.,1999.
48. U. Weidmann. Transporttechnik der Fussganger, volume 90 of Schriftenreihe desIVT. Institute for Transport Planning and Systems ETH Zurich, 2 edition, 1993.In German.