preliminary report nyando river basin - world … · baseline report nyando river basin ... the mau...
TRANSCRIPT

Baseline Report Nyando River Basin
Western Kenya Integrated Ecosystem Management Project
Findings from the Baseline Surveys
Compiled by: Louis Verchot
Anja Boye Robert Zomer With technical support from:
Luka Anjeho Tom Ochinga Isaac Learmo Joash Mango Walter Adongo Donald Agwa Odhiambo Florence Muchoki Meshack Nyabenge Peter Okoth
International Centre for Research in Agroforestry Nairobi, Kenya
5 April 2008

i
Table of contents
1. Introduction................................................................................................................. 1
1.1 Aim and objectives ............................................................................................. 1
1.2 Introduction to the Nyando river basin ............................................................... 1
2. Baseline data collection .............................................................................................. 3
2.1 Sampling design.................................................................................................. 3
2.2 Sampling methods............................................................................................... 3
2.2.1 Socio economic sampling methods............................................................. 3
2.2.2 Biophysical sampling methods ................................................................... 4
2.2.2.1 Plot lay out .............................................................................................. 4
2.2.2.2 Data collection........................................................................................ 4
2.2.2.3 Soil infiltration capacity ......................................................................... 5
2.2.2.4 Soil analyses............................................................................................ 5
2.3 Accessibility mapping......................................................................................... 6
3. Lower Nyando ............................................................................................................ 7
3.1 Biophysical baseline data summary.................................................................... 7
3.1.1 Topography................................................................................................. 7
3.1.2 Soil texture and soil depth restriction ......................................................... 9
3.1.3 Vegetation, land use and land ownership ................................................. 10
3.1.4 Soil erosion and conservation measures ................................................... 12
3.2 Socioeconomic baseline data summary ............................................................ 14
3.2.1 Household parameters............................................................................... 14
3.2.2 Land use and livestock.............................................................................. 15
3.2.3 Major constraints at farm level ................................................................. 16
3.2.4 Soil and water conservation ...................................................................... 17
3.2.5 Trees & Agroforestry................................................................................ 17
3.2.6 Trainings and group membership ............................................................. 18
3.3 Market accessibility .......................................................................................... 20
3.4 Synthesis and Recommendations...................................................................... 20
4. Middle Nyando ......................................................................................................... 24
4.1 Biophysical baseline data summary.................................................................. 25

ii
4.1.1 Topography............................................................................................... 25
4.1.2 Soil texture and soil depth restriction ....................................................... 26
4.1.3 Vegetation and land use ............................................................................ 27
4.1.4 Soil erosion and conservation measures ................................................... 29
4.2 Socioeconomic baseline data summary ............................................................ 31
4.2.1 Household parameters............................................................................... 31
4.2.2 Land-use and livestock ..............................Error! Bookmark not defined.
4.2.3 Major constraints at farm level ................................................................. 33
4.2.4 Soil and water conservation ...................................................................... 33
4.2.5 Trees & Agroforestry................................................................................ 34
4.2.6 Training and group membership............................................................... 35
4.3 Market accessibility .......................................................................................... 36
4.4 Synthesis and Recommendations...................................................................... 37
5. Upper Nyando........................................................................................................... 43
5.1 Biophysical baseline data summary.................................................................. 43
5.1.1 Topography............................................................................................... 43
5.1.2 Soil texture and soil depth restrictions...................................................... 45
5.1.3 Vegetation and land use ............................................................................ 46
5.1.4 Soil erosion and conservation measures ................................................... 48
5.2 Socio economic baseline data summary ........................................................... 49
5.2.1 Household parameters............................................................................... 49
5.2.2 Land use and livestock.............................................................................. 50
5.2.3 Major constraints at farm level ................................................................. 51
5.2.4 Soil and water conservation ...................................................................... 52
5.2.5 Trees & Agroforestry................................................................................ 52
5.2.6 Household energy supply.......................................................................... 53
5.2.7 Trainings and group membership ............................................................. 54
5.3 Market accessibility .......................................................................................... 54
5.4 Synthesis and recommendations ....................................................................... 55
6. Conclusion ................................................................................................................ 59

1
1. Introduction
1.1 Aim and objectives
The first aim of the WKIEMP baseline reports are to synthesize a quantitative description of the baseline project situation along the ecological and socioeconomic dimensions that are relevant for project implementation. In this context, flexible strategies for selecting priority intervention areas and households at the landscape/population scale are proposed. The second aim is to lay a foundation for change detection that considers spatial variability explicitly.
1.2 Introduction to the Nyando river basin
The Nyando River basin covers an area of 3517 km2 of Western Kenya. The river basin drains into the Winam Gulf in Lake Victoria and is a major contributor of sediment and phosphorus to the Lake1. Measurements by The World Agroforestry Centre show the Nyando River to have much larger concentrations of nitrogen and phosphorus compared to the Yala and Nzoia rivers2. The population of the basin is around 750,000 people mainly living in Nyando District in Nyanza Province and in Nandi and Kericho Districts in Rift Valley Province. More than 80% of the population formally or informally depends on agriculture for their livelihood. The population in the Nyando Basin is among the poorest in Kenya, 65% of the homes are poor in comparison to 52% for Kenya on average.
The historical pattern shows consistent deforestation and degradation over the last hundred years, punctuated by severe worsening of the problem during heavy rains, which accompany El Niño events. The Mau and Tinderet Forests are still being deforested and the increasing population had pushed agriculture into marginal areas. A study by Hai for the Nyando basin (ICRAF, unpublished data) shows that 41% of runoff is generated from degraded areas, 29% from roads, 16% from cultivated areas, 13% from grazing land, and 1% from bush land. Analyses of aerial photographs and satellite images illustrate changes in depth and width of the Nyando River, but also show removal of riparian vegetation, extended cultivation to the river bank and establishment of homesteads closer and closer to the river. In other words, the river has lost its ability to buffer against environmental variability. Sediment cores from Winam Gulf show that there has been massive soil movement in the last 50 years mainly from gully erosion in the lake plains. The World
1 2000/2001 Annual Technical Report of the ICRAF/NALEP project on ‘Improved Land Management in the Lake Victoria Basin’ 2 Workshop Proceedings: Reversing Environmental and Agricultural Decline in the Nyando River Basin, Dec. 9-11 2002, Kisumu

2
Agroforestry Centre reports that 60% of the Nyando River basin is eroding and is contributing sediment to the Lake. This contribution is on the order of 3.2 × 10⁶ Mg yr-1.
Hence, the major challenge is to reverse the current situation and increase the vegetative cover to minimize soil erosion, nutrient depletion and eutrophication of Lake Victoria and simultaneously improve the livelihood for the population of the basin.
The Western Kenyan Integrated Ecosystem Management Project (WKIEMP) has identified three main areas in the Nyando River Basin in which activities will take place. These focus areas have been identified from ground surveys and satellite images and have been placed to represent the basin in terms of elevation, slope, rainfall regimes and land use, e.g. the Lower Nyando block is located on the lake plains characterized by low elevation with moderate slopes and erratic rainfall, the Middle Nyando block, further upslope characterized by higher elevation, moderate to steep slopes and less erratic rainfall and finally, the Upper Nyando block characterized by steep slopes, larger farms and higher elevation.
Figure 1.1 Map of the Nyando river basin showing the 3 blocks.

3
2. Baseline data collection Baseline data was collected for socioeconomic and biophysical parameters. Before commencing the baseline data collection, the local administration was informed of the Project and a series of meeting arranged in each of the sub-locations where sampling was to take place. KARI and ICRAF jointly hold these meetings, where the overall objectives of the Project were outlined and discussed.
2.1 Sampling design
The baseline data collection is built around the use of blocks of 10 × 10 km in size. The basic sampling unit is called a cluster. In each block, 16 centre points are generated from which 10 sampling plots that constitute the cluster are generated. Hence, in each block the sampling size is 160 plots (see map in section 3.1). The centre point of each cluster is randomly placed within each block. The sampling plots are then randomized around each cluster centre point, resulting in a spatially stratified sampling design. This sampling design ensures proportional sampling within each block and minimizes local biases. The randomization procedures are done using either customized programmes or scripts or a special Microsoft Excel spreadsheet that has been prepared for this purpose. Using these tools enables easy up-load of plot coordinates to GPS units, which are then used to navigate from sampling plot to sampling plot in the baseline data collection exercise. For more detailed information about the randomization procedure see the Biophysical and Socioeconomic Monitoring and Evaluation Plan.
2.2 Sampling methods
2.2.1 Socio economic sampling methods Socioeconomic information is collected on a household level by the use of a questionnaire designed by KARI and ICRAF. The questionnaire contains 63 questions regarding various socio economic parameters such as household size and economy, livestock, soil and water conservation, agroforestry, etc. Three enumerators carry out the survey. They interview 10 households per cluster and collect one soil sample per household, (i.e. sample size is 160 households). A soil sample is collected to i) assess topsoil fertility at farm level and to ii) increase the number of soil samples collected per block to enhance the modelling of soil parameters. The soil samples are dried, crushed, and sieved through a 2mm sieve before being sent to ICRAF Nairobi for further analyses. See section below for more detailed description of analyses for soil samples. The information from the questionnaire is then entered into a Microsoft Access database created by ICRAF, which enables easy queries of data.

4
2.2.2 Biophysical sampling methods Biophysical information is collected for each of the 10 sampling plots for the 16 clusters. The biophysical team collects information on soil infiltration capacity, land forms and land cover, and soil characteristics. Before sampling can begin, the sample plot needs to be laid out.
2.2.2.1 Plot lay out Upon reaching the sampling plot, the radial arm plot method is used in setting up the plot layout as described in the Monitoring Manual. This method allows soil and vegetation to be sampled and classified for an area of 1000m2. After identifying the centre point (point no. 1) an additional three points are set up in the following order: sample point no. 2 is placed 12.2 m up-slope from the centre point, where point no. 3 and 4 are off-set 120o and 240o, respectively from the centre point in the down slope direction. Once the plot layout is set-up, sampling can begin.
2.2.2.2 Data collection The field data recording sheet is presented in the Monitoring Manual. The recording sheet is divided into six sections, A-F:
Section A: First, the centre point location is geo-referenced using a GPS unit. Thereafter, slope is measured both up and down slope using a clinometer.
Section B: Second, the major land forms and the topographic position are described. To do this, the surrounding area is inspected and the appropriate categories, provided on the field data recording sheet, are selected.
Section C: Thereafter, the land cover for all four points is recorded using the FAO Land Cover Classification System (LCCS). This classification system recognizes 8 primary land cover types of which 5 are present in the study areas of WKIEMP: Cultivated and managed terrestrial areas, natural and semi-natural vegetation, cultivated aquatic or regularly flooded areas, natural or semi-natural aquatic or regularly flooded vegetation, and bare areas. The LCCS classification system allows the identification of different land cover types on the basis of the dominant vegetation type (tree, shrubs, herbaceous). The questions in the field data recording sheet are designed to guide one through the classification process.
Section D: In section D, we collect information regarding land use and land ownership.

5
Section E: Section E is for characterization of the soil surface. The first questions are on erosion and conservation. Thereafter, soil sampling at the four points is carried out. Topsoil is sampled for the 0-20 cm depth and subsoil for the 20-50 cm depth by using a soil auger. The soil samples are bulked for the two depths in separate bags. Soil depth is measured until a depth of 120 cm at 5 cm increments and the depth of restriction is indicated on the field recording sheet.
Soil texture is assessed by using the ribbon method. The method is widely used for quick assessment of texture and is also the recommended method by the Australian Gas office.
Section F: Woody vegetation is measured in this section using the T-square sampling method. This method is one of the most robust methods for sampling woody plant communities. It can be used to estimate stand parameters such as density, basal area, bio-volume, and biomass. The advantage of this method is that it is less prone to bias where plants are not randomly distributed, such as in managed landscapes. In this sampling scheme, trees and shrubs are sampled separately.
2.2.2.3 Soil infiltration capacity Infiltration measurements are carried out at 3 of the 10 sampling plots for each of the 16 clusters. Infiltration rings measuring 12 inches in diameter are placed at the centre point (point no. 1) and infiltration rates are measured after the soil has been pre-wetted with approx. 2-3 litres of water. The data sheet is given on p. 12 in Annex 1.
The infiltration data is then entered into the Microsoft Access database designed for the biophysical baseline survey and infiltration curves are fitted using the Hortonian infiltration function.
2.2.2.4 Soil analyses The soil samples collected from both baseline surveys are air dried for a minimum of 3 days at the ICRAF Kisumu soils laboratory. The dried soil samples are crushed and sieved through a 2mm sieve and sent to Nairobi for further analyses. Samples are first analyzed using infrared spectroscopy and a subset of samples is sent to the lab for further analysis to permit calibration of the spectral data to soil properties of interest.
After completing the data collection, data is entered into the Access database designed for the bio physical baseline survey. This data together with the entered data from the socioeconomic survey is the basis of this report.

6
2.3 Accessibility mapping
Spatial accessibility is determined by the geographical location in relation to target location (towns), and by the transportation facilities that are available to reach those destinations (roads). Accessibility models are derived by creating a cost surface, which establishes the impedance for crossing each individual cell.
The accessibility surface in this project was created using an extension in ArcView “Accessibility analyst” developed by CIAT staff. This extension calculates the accessibility on a friction surface, which represents a grid where each cell value represents the cost of traversing that particular cell. The data used for this friction surface include: - Roads2006.shp, Land-use (grid), and the Bounding_Box.shp for defining the limits of the analysis. The Towns dataset (towns.shp) was our target input referred to as place of interest. The aim was to come up with a general overview of the accessibility in this region, therefore the land-use dataset was customized to be a continuous grid with all the cell values having the same value of 1. Cost distance algorithms work only with grid datasets therefore, the vector datasets were converted to their respective grids with a pixel dimension of 100m.
For the cost surface modelling the gridded datasets were reclassified so that the value of each cell represents the time required to traverse the cell. Using the formula:
⎥⎥⎥⎥
⎦
⎤
⎢⎢⎢⎢
⎣
⎡
⎟⎠⎞
⎜⎝⎛×
×=
36001000)/(
1_hrkmspeed
sizecellTime
Assuming an average speed for each dataset, the results of the cell crossing times are shown in the Table 2.1. All the reclassified datasets (roads, land-use and bounding box) to create the friction surfaces were merged to create one grid. Thereafter the cost-distance algorithm was implemented to determine cost allocations, cost directions, and the times to target. Our map is based on time to target, which indicates the cost of travel from each cell to the nearest town. The grid output was converted to shape file for visualization.
Table 2.1 Speed and cell crossing times for the datasets used in this analysis.
Dataset Average speed assumed (Km/h) Cell crossing time (seconds)Roads 60 6 Land-use 18 20 Towns 36 10 Bounding box 36 10

7
3. Lower Nyando
The Lower Nyando block is located in the lake plain (Kano Plains) of Lake Victoria in Nyando and Kericho Districts. Within the block are two divisions, Upper and Lower Nyando and 16 sub-locations (Figure 3.1). The population is predominantly Luo and Kalenjin. The area is largely subsistence farming, with a mix of crops typical of the lower elevations of western Kenya. Maize and sorghum are the major crops; banana and cassava are also grown. The area is also an important producer of mangos.
15 9
13
2
11
48
1216
157
6
10
14
3
Figure 3.1. Administrative map of the Lower Yala block. The blue dots are the sampling points for the biophysical survey.
3.1 Biophysical baseline data summary
3.1.1 Topography
The lower block on Nyando block is characterized by three dominant slope zones: lowlands (0-12%: cluster 3, 4, 7, 8, 10, 11, 12, 15, 16), midlands (12-47%: cluster 5, 6), and uplands / escarpments (> 47%: cluster 1, 2, 9, 13, 14) slope zones (Figure 3.2). The

8
area around cluster 13 is characterized by an escarpment dividing the lowlands from the highlands of Kericho. Slopes are particularly steep in this part of the block (Table 3.1). The highlands are high potential areas with high productivity levels. Cluster 5, 6, 10, and 14 are located in Tabaita sub-location, which area has relatively dense vegetation with steep slopes (cluster 9 and 10) and many small streams draining into the lowlands. Cluster 5 and 6 are placed at the foot slope of the escarpment and the slopes in this area are gentler. The centre of the block is characterized by plains, which are often flooded. These areas are highly degraded, especially, the areas around the Awach and Asawo Rivers (cluster 7, 8, 11). The western part of the block (cluster 2 and 3) is more sloping with streams draining into the Asawo River. This area has relatively dense vegetation with sparse settlements. Gully erosion is a serious problem in this block, especially around Lekwenyi and Jimo East sub-locations. The area around Thur-gem in Awach sub-location and Rarieda sub-location are also severely degraded.
Figure 3.2. Elevation map of lower Nyando block; blue dots indicate biophysical sampling points.

9
Table 3.1. Average slope, slope range and incidence of steep slopes Cluster Average slope
(%) Slope range
(%) No. values > 10%
1 12.0 2.0 – 42.5 4 2 8.1 3.0 – 12 3 3 1.1 0.5 – 1.5 0 4 1.0 0.8 – 1.3 0 5 4.8 1.5 – 7.5 0 6 3.8 2.0 – 6.0 0 7 1.1 0.3 – 2 0 8 0.9 0.25 – 2.0 0 9 14.1 0.5 – 30.5 7 10 3.4 1.5 – 9.0 0 11 0.8 0.25 – 1.5 0 12 1.0 0.0 – 2.8 0 13 9.6 2.5 – 17.8 4 14 6.2 1.8 – 16.5 1 15 2.3 1.0 – 3.5 0 16 2.2 0.3 – 4.5 0
3.1.2 Soil texture and soil depth restriction
The soil texture ranges from loamy to clayey. The lowlands have predominantly sandy-clay to silty-loamy soils; the mid slope has clayey and silty-loam soils, whereas the upland zones have predominantly silty to loamy soils. However, there is great variation within each cluster; hence it is important to assess soil texture for the exact locations where the Project is implementing activities.
Table 3.2. Soil texture (% of samples).
Clay Sandy loam
Clay loam
Sandy clay loam
Silty clay
Sandy clay
Silty clay loam Loam
22 22 14 11 10 8 5 5
Soil depth restriction is widely apparent in this block. More than 50% of the locations sampled had soil depth restriction at 20 cm (Table 3.1), and 67% of the locations had depth restrictions within the first 50 cm. Since soil depth limitation is widespread in this area, it is very important to assess soil depth on specific sites before planning activities, especially activities around agriculture and planting of trees.

10
Table 3.3. Incidence of depth restrictions per cluster (values = % of subplots per cluster with depth restrictions; n = 40 per cluster).
Cluster Shallow (≤ 20 cm) Deep (> 20 cm) 1 40 18 2 48 33 3 30 20 4 18 8 5 50 15 6 58 15 7 53 35 8 75 10 9 38 30 10 38 13 11 20 3 12 88 5 13 58 10 14 78 8 15 40 33 16 85 13
3.1.3 Vegetation, land use and land ownership
The largest allocation of land in this block was grassland, which is used primarily for grazing livestock (Table 3.4). Only about 26% of the land is used for crop production. Another 14 percent of the land is abandoned from agriculture and used as low-intensity forage land. There are small areas of woodland along the Yala River. Natural grass species include both perennial and annual both palatable and unpalatable for livestock. The dominant species in the area are:
1. Digitaria ciliaris: annual grass; low forage value;
2. Digitara gazensis: perennial grass; high quality forage;
3. Eragrostis aspera: annual grass; moderate forage quality;
4. Eragrostis superba: perennial grass; good quality forage;
5. Hyparrhenia collina: perennial grass; good forage, but it should be stocked in the early stages of growth.
6. Bracharia spp.: perennial grass; good quality forage
7. Cynodon dactylon : perennial grass; good quality forage
8. Capillipedium parviflorum: Perennial grass; forage quality unknown.
11
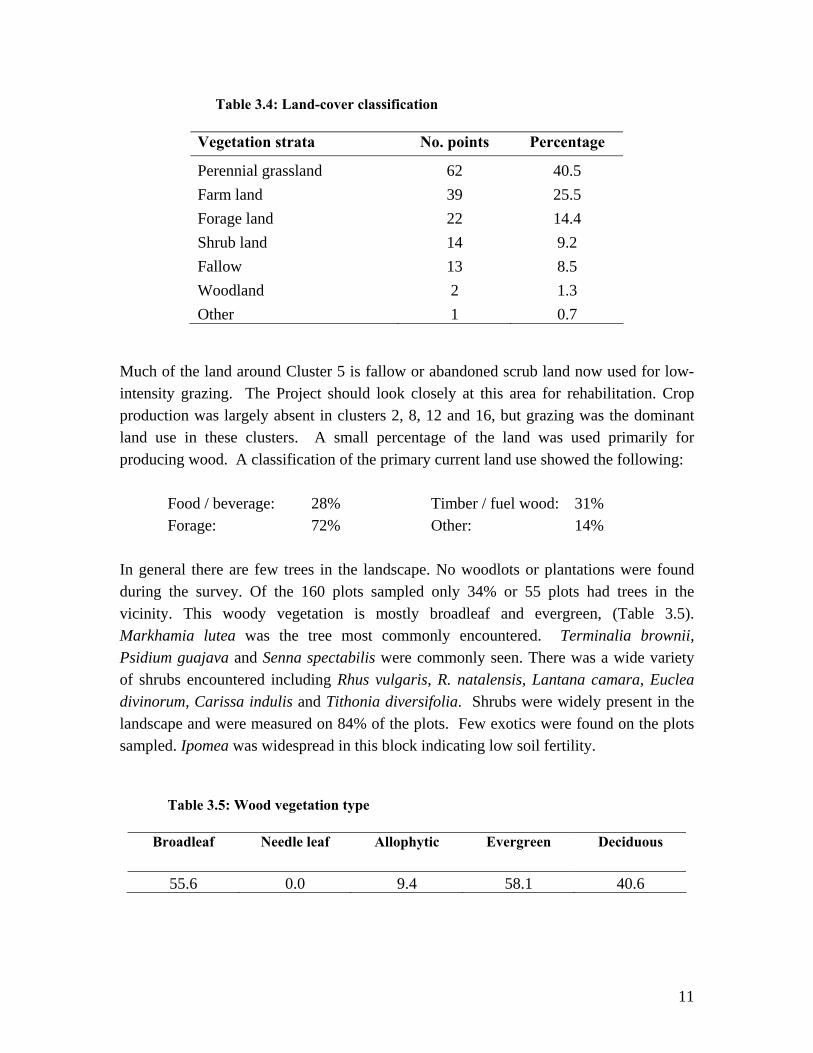
Table 3.4: Land-cover classification
Vegetation strata No. points Percentage
Perennial grassland 62 40.5 Farm land 39 25.5 Forage land 22 14.4 Shrub land 14 9.2 Fallow 13 8.5 Woodland 2 1.3 Other 1 0.7
Much of the land around Cluster 5 is fallow or abandoned scrub land now used for low-intensity grazing. The Project should look closely at this area for rehabilitation. Crop production was largely absent in clusters 2, 8, 12 and 16, but grazing was the dominant land use in these clusters. A small percentage of the land was used primarily for producing wood. A classification of the primary current land use showed the following:
Food / beverage: 28% Forage: 72%
Timber / fuel wood: 31% Other: 14%
In general there are few trees in the landscape. No woodlots or plantations were found during the survey. Of the 160 plots sampled only 34% or 55 plots had trees in the vicinity. This woody vegetation is mostly broadleaf and evergreen, (Table 3.5). Markhamia lutea was the tree most commonly encountered. Terminalia brownii, Psidium guajava and Senna spectabilis were commonly seen. There was a wide variety of shrubs encountered including Rhus vulgaris, R. natalensis, Lantana camara, Euclea divinorum, Carissa indulis and Tithonia diversifolia. Shrubs were widely present in the landscape and were measured on 84% of the plots. Few exotics were found on the plots sampled. Ipomea was widespread in this block indicating low soil fertility.
Table 3.5: Wood vegetation type
Broadleaf Needle leaf Allophytic Evergreen Deciduous
55.6 0.0 9.4 58.1 40.6

12
Ninety-six percent of the farms sampled are privately owned. Only one farm was on communal land, whereas for 4 farms it was not possible to establish the ownership. In this area conversion took place before and immediately after independence, which was also seen in the survey. Here we found that 12% of the plots have changed land cover since 1990. Flooding occurs regularly on 32% of the plots, and is particularly serious in the areas around cluster 3 and 4 (100%) and 7, 8 and 11 (60%). The former four clusters are located close to the Asawo and Awach rivers, whereas cluster 11 is located on the plains.
3.1.4 Soil erosion and conservation measures
The entire block in characterized by soil erosion (Table 3.6). More than 85% of the sampled areas show visible signs of soil erosion, with few or no soil and water conservation measures in place. Sheet erosion is visible on 78% of the plots, whereas 9% of the plots showed visible signs of rill erosion. One location had visible signs of gully erosion (cluster 16 plot 8). Only six plots have conservation structures (3 vegetative and 3 structural). The location of these structures showed that one plot had 2 structures and five plots had 1 structure. Rill and gully erosion is apparent in cluster 13 and 16, whereas sheet erosion was present throughout the block. The table below indicates on a cluster basis, the number of points showing visible signs of sheet erosion.
Sheet and rill erosion are present in all areas of the cluster. Erosion is slightly less severe in clusters 9 and 11. Gulley erosion was observed in cluster 16. The high presence of soil erosion and the low numbers of soil and water conservation measures should be one of the key-entry points for Project activities in this block.

13
Table 3.6. Percent of plots showing erosion features for each cluster Cluster None Sheet Rill Gulley 1 10 70 10 0 2 0 90 10 0 3 0 80 20 0 4 0 80 10 0 5 20 70 0 0 6 10 90 0 0 7 0 100 0 0 8 0 80 0 0 9 30 60 0 0 10 20 70 10 0 11 40 60 0 0 12 0 100 0 0 13 10 30 30 0 14 10 60 10 0 15 40 50 10 0 16 0 70 20 10
Table 3.7 Summary of baseline parameters Cluster Texture Slope (%) Woody
vegetation cover*
Soil depth restriction
(%)
Soil erosion (%)
1 Clay loam 12.0 Moderate 40 90 2 Clay 8.1 Low 48 100 3 Clay 1.1 Low 30 100 4 Clay to Clay loam 1.0 Low 18 100 5 Sandy clay to clay 4.8 Moderate 50 80 6 Sandy loam 3.8 Low 58 90 7 Clay 1.1 Low 53 100 8 Clay to Sandy clay 0.9 Low 75 100 9 Silty clay 14.1 Moderate 38 70 10 Sandy loam to clay
loam 3.4 Low 38 80 11 Sandy loam to clay
loam 0.8 Low 20 60 12 Sandy loam 1.0 Moderate 88 100 13 Sandy loam to clay
loam 9.6 Moderate 58 90 14 Sandy loam 6.2 Moderate 78 90 15 Clay 2.3 Moderate 40 60 16 Sandy loam 2.2 Moderate 85 100
* Low: <15%; Moderate: 15 to 65%, High: > 65%.

14
3.2 Socioeconomic baseline data summary
3.2.1 Household parameters
Average household size is 8 people with 85% of the household having 10 members or less. Population density is highest on the central and western side of the block (Figure 3.3). A few households have more than 15 members (7 homes). Average farm size is 6 acres; however, almost 40% of the households have farm sizes of 2 acres or less. Only 15% of the farms have farm sizes larger than 10 acres. The majority of the households are male headed (71%); whereas 27% are female headed. Orphans head two households and one household is polygamous.
Table 3.8. Household size (N=171)
Household size Number in sample Percentage 3 or less 19 10.7 4 12 6.8 5 16 9.0 6 22 12.4 7 – 10 82 46.3 11- 15 19 10.7 More than 15 7 4.0
Table 3.9. Farm size (N=171)
Farm size No. households Percentage 2 acres or less 38 22% 2 to 3 acres 25 14% 3 to 4 acres 38 22% 5 to 9 acres 48 28% 10 acres or more 26 15%
15
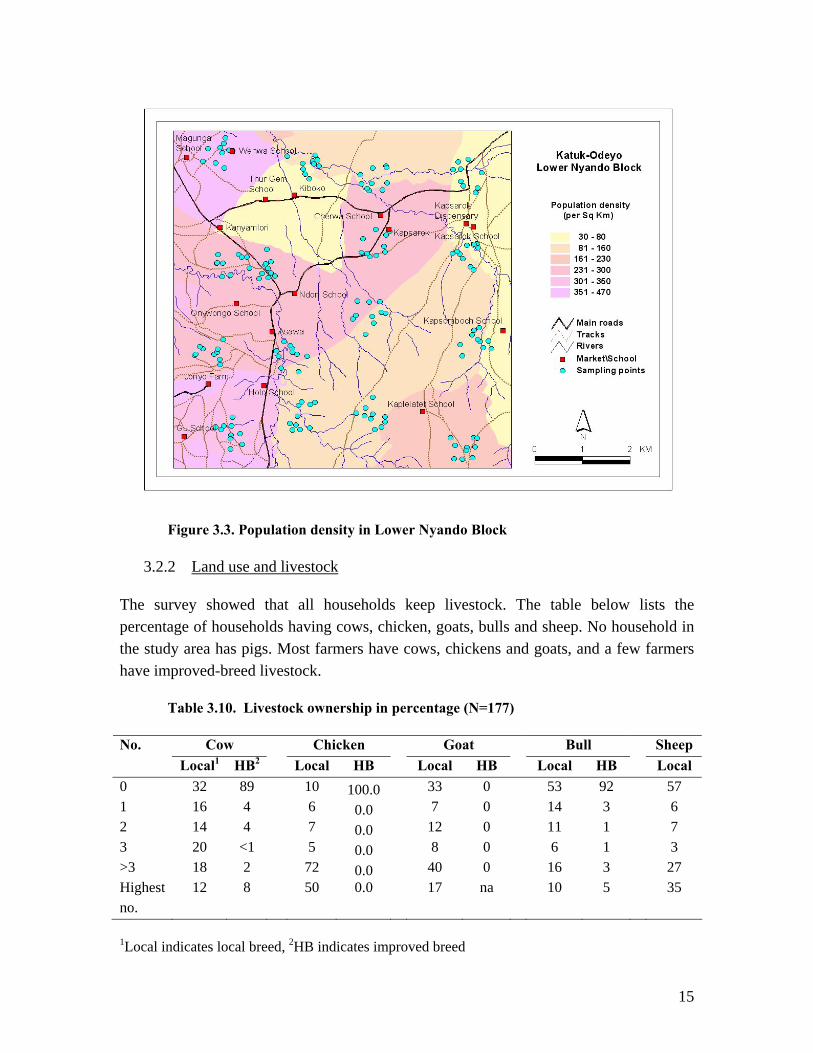
Figure 3.3. Population density in Lower Nyando Block
3.2.2 Land use and livestock
The survey showed that all households keep livestock. The table below lists the percentage of households having cows, chicken, goats, bulls and sheep. No household in the study area has pigs. Most farmers have cows, chickens and goats, and a few farmers have improved-breed livestock.
Table 3.10. Livestock ownership in percentage (N=177)
Cow Chicken Goat Bull Sheep No. Local1 HB2 Local HB Local HB Local HB Local
0 32 89 10 100.0 33 0 53 92 57 1 16 4 6 0.0 7 0 14 3 6 2 14 4 7 0.0 12 0 11 1 7 3 20 <1 5 0.0 8 0 6 1 3 >3 18 2 72 0.0 40 0 16 3 27 Highest no.
12 8 50 0.0 17 na 10 5 35
1Local indicates local breed, 2HB indicates improved breed

16
The source of fodder is mainly crop residue and grass from the homestead. Average acreage used for crop residue is 2 acres, whereas livestock are found to graze on around 3 acres. Few farmers leave their livestock to graze on communal (43 cases) and government land (3 cases). Artificial feed is a source of fodder for 26 households and nine households buy feed at the local market. However, 74% of the households are experiencing problems with their livestock. More than 70% of the households say they do not have adequate land for feeding their livestock and 55% experience problems with free-grazing livestock from neighbours, which corresponds with the fact that 70% of the households practice free-grazing.
3.2.3 Major constraints at farm level
Farmers ranked drought frequency and the unpredictability of rainfall as their single most important constraint in this block (Table 3.11). A second category of constraints was associated with capital for inputs, labour and farm implements. Pests and diseases are a problem and we need to single out that Striga infestations pose significant problems in this block. This problem is associated with soil fertility constraints.
Table 3.11. Major constrains at farm level listed by farmers
Constraints No. 1 (N=177) No. 2 (N=164) No.3 (N=138) Weather 44 53 24 Capital 36 27 21 Striga weed 21 20 24 Inputs 15 14 6 Low yields 19 5 5 Soil fertility 8 10 7 Lack of implements 0 9 8 Pests and diseases 1 2 11 Labour 2 5 3 Illness 0 2 6 Soil erosion 3 2 3
Soil erosion and free-grazing were only listed by a few farmers as major constraints, which is interesting since most of the area in Lower Nyando is experiencing severe erosion. Additionally, many farmers report that they are practicing soil erosion control. Thus there must be a perception of the problem.

17
3.2.4 Soil and water conservation
Soil erosion is being addressed by 97 of the households interviewed (55%) and the most common conservation measures are contour lines and strips of grasses and shrubs. The most commonly used species are Aloe vera, sisal, shrubs, Terminalia brownii, Grevillea robusta, Napier grass, and Casuarina spp. A few farmers report establishing terraces or check dams. This information is contrary to the results from the biophysical survey, which found few soil conservation structures in the field.
Many farmers are experiencing problems with animals browsing on the contour lines and plant mortality due to droughts. During the rainy season, many farmers see their efforts being swept away by runoff water. Hence, there is knowledge within the communities with regards to soil and water conservation. The Project, therefore, should build on this knowledge to enhance better practices and train farmers on the integration of trees in soil and water conservation. However, there is a need evaluate current practices with these communities first and build their capacity in this area.
3.2.5 Trees & Agroforestry
The majority of the farmers are practicing agroforestry. More than 90% of the homesteads have trees which are protected and more than 90% of the interviewed farmers are interested in planting more trees. More than 75% of the farmers say they practice agroforestry. Only 14 farmers out of 177 are not interested in planting more trees, which was mainly due to age (43%) and lack of land and time (29%). Three farmers from Kandaria and Ramogi sub-locations mentioned cultural practices as a hindrance to tree planting.
Table 3.12. Tree species on-farm (N=177)
No. Tree species No. farms with the species 1 Eucalyptus spp. 96 2 Terminalia brownii 39 3 Grevillea robusta 35 4 Acacia spp. 28 5 Markhamia spp. 25 6 Mango 18 7 Jacaranda 16 8 Manera 16 9 Terminalia mentalis 15 10 Cypress 13

18
Agroforestry products were rated by the farmers in order of priority as follows with regards to the usage:
1. Fuel wood
2. Timber
3. Wind breaker
4. Fruits
5. Food
6. Medicine
7. Fodder
8. Soil conservation
9. Aesthetics
10. Soil fertility
The main sources of fuel for communities in the block are wood, paraffin, and charcoal. The table below lists the percentage of farmers using the various fuel sources listed in the questionnaire.
Table 3.13. Fuel source
Fuel source Percentage Wood 99% Paraffin 83% Charcoal 56% Crop residue 12% Animal waste <1% Gas <1% Kerosene <1%
More than 90% of the households are not self sufficient with fuel, which might explain the high number of farmers interested in more tree planting as mentioned above. More than 85% of the interviewed farmers are interested in planting more trees.
3.2.6 Trainings and group membership
The majority of the farmers have not received any training. Only 69 (39%) of the 177 farmers interviewed had received training and of these, 62 are members of a group. Thus, it appears that a farmer is more likely to receive training if he/she is a member of a group. Only 8 farmers who are currently not a member of any groups have received training.

19
Table 3.14. Examples of community groups in different clusters Group name Main activity St Mary's farmers Maize production and marketing
St. Peter Merry-go-round scheme for buying household products
Nyaoke women Livestock keeping (goats and sheep) Asao sunflower Sunflower production Jokadayo Bereavement
Kapsorok Bee keeping, merry-go-round, chicken rearing, tree planting
Soil rehabilitation Tree production to boost income family groups Enhance togetherness when there is a problem. Kowala Plant trees
Slightly more than half of the farmers (58%) belong to groups. Thus, there is a base of community organization upon which to build. The Project should identify key groups in the target areas and engage with them early in the PAP development process. We note that when farmers were invited to comment, they mentioned that they are very interested in planting trees, but they do not have access to tree seedlings and / or seeds. The creation of tree-growers associations in the block will facilitate Project implementation and farmer training.

20
3.3 Market accessibility Market accessibility is generally good throughout the block, but a few areas in the north and central part of the block are relatively isolated from markets (Figure 3.4). In this block, the area has a reasonably good road network, particularly in the western portion of the block, so market oriented activities, like growing wood for timber or fuelwood may be feasible.
Figure 3.4 Market accessibility.
3.4 Synthesis and Recommendations
Management recommendations for Lower Nyando will cover the entire block, since at the time of writing, micro-catchments for Lower Nyando have not been identified. Interventions in this block should focus on increasing soil cover, boosting soil fertility and enhancing biodiversity. When discussing interventions with communities, farm size and soil depth restriction need to be considered. Average farm size is 6 acres and more than 100 of the 177 households have farms of 4 acres or less. More than 70% of the

21
sample points have soil depth restriction at 20 cm; hence it is important that soil depth is assessed before any activity is planned and implemented.
Soil erosion is a major problem in this block and baseline data shows severe land degradation in the entire block, except for the escarpment (cluster 13). Hence, activities which promote rehabilitation of degraded areas should be given priority. Such activities should include elements of tree planting and control of free-grazing. The target areas should be Lekwenyi, Kapsorok, Jimo East, Agoro East and West, and Awach. Also, establishment of soil and water conservation measures needs to be promoted on lands that are currently under agriculture. Only 55% of the households practice conservation, yet the entire block is experiencing soil erosion and large scale runoff.
The areas adjacent to the tributaries of the Nyando river, such as Awach and Asawo rivers need to be stabilized and interventions set up to protect the river banks. Recommended interventions are improved fallows and other leguminous cover crops such as Dolichos lablab and Mucuna spp. and planting of indigenous trees in riparian buffer zones.
In general, farmers are interested in agroforestry; however, most farmers have planted Eucalyptus spp. and have poor knowledge of indigenous trees and their purposes. The most common species besides Eucalyptus are Terminalia brownii, Markhamia lutea, Acacia spp. and the exotic Grevillea robusta. There are a wide range of indigenous trees which are suitable for the area which should be promoted through trainings and meetings with community groups and extension officers. Focus should be on species suitable for timber, fuel, fodder, and soil fertility. In order to successfully increase the tree cover of this block, there is a need to focus on the purposes and benefits of indigenous trees. More than 90% of the farmers are not self sufficient with firewood and under general comments many farmers asked for more knowledge on trees and especially inquired about access to seeds. Hence, there is an interest for tree planting upon which this Project should capitalize. This can be done through trainings of community groups, by tree planting in screening trials and degraded areas and in schools.
Another area which needs to be addressed is Striga spp. infestation. More than 100 of the 177 farmers interviewed list Striga as one of the major constraints at farm level. Striga weeds grow well on poor soils with low soil fertility. Studies in Western Kenya, by Boye (2005)3 and Gacheru and Rao (2005)4, show that relay-cropping maize and beans with
3 Boye, A. (2005) Effect of Short Term Fallowing on Maize Productivity and Soil Properties on a depleted Clayey Soil in Western Kenya. PhD dissertation University of Copenhagen 4 Gacheru, E. & Rao, M.R. 2005. The potential of planted shrub fallows to combat Striga infestation on maize. International J. Pest Management, 51(2): 91-100.

22
improved fallows reduce Striga infestation after a few rotations. At the same time, soil fertility is improved and the farmer has additional benefits from the wood produced by the fallow crop, fodder and firewood.
Many farmers listed erratic rainfall as a major constraint. The erratic rainfall pattern of Lower Nyando is likely to continue and perhaps worsening in the coming years because of climate change. Hence, interventions which increase soil cover and soil fertility, should be given priority, since these interventions will buffer the variable climatic conditions, which are especially significant in the lower part of the block, which is more semi-arid. Secondly, the few but heavy rains should be harvested in ponds and dams to ensure better water availability throughout the year. Hence, establishment of ponds and dams is another priority activity for the Project.
All households surveyed have livestock; however, 74% of the farmers are experiencing problems with their livestock. The main constraint is inadequate land available for grazing and lack of adequate alternative fodder sources. Free-grazing is a major problem in the entire block and is a threat to tree plangent activities. The Project should therefore assist the communities in setting-up by-laws to control free-grazing and promote live fencing. It is imperative that free-grazing is controlled for the Project to have any impact in terms of tree planting and rehabilitation of degraded areas. Several Acacia species can be planted as live fences since they are tolerant to browsing. Establishment of fodder banks and the encouragement of hay production are also of high importance since more than 70% of the households interviewed do not have adequate fodder. If farmers begin controlling grazing, an alternative fodder source needs to be provided. Planting trees at wide spacing (e.g. 4 x 10 m) on degraded sites would allow for both wood and grass production, where the grass could be used to augment fodder availability for farmers. Another option that needs to be explored with communities is intercropping food crops with a legume that can also be used as animal feed. One such system is improved fallows. The legume, Dolichos lablab can also be used as animal feed.
In general, few farmers have improved breed livestock. To upgrade the breeds, the Project should introduce hybrid bulls and goats perhaps in collaboration with the Kenyan dairy goat association. Their regional office for Western Kenya branch is in Mbale. Rotating the hybrid sires in the area and controlling breeding with local bucks will be more cost effective compared to buying individual hybrid animals. However, a rotational system requires more management.
Finally, establishing and strengthening of community groups should also be an activity of the Project. Most of the farmers who have received training are members of groups. Yet a significant number of farmers in the area do not belong to groups and have not received

23
training. Also, for the scaling up of successful Project activities, well functioning groups are imperative. Furthermore, the problems of flooding in the middle and lower parts of the block are mainly caused by activities up-slope. The link between the farmers up-slope and the farmers down-slope should be made through trainings for groups in both locations.

24
4. Middle Nyando
The Middle Nyando block lies in Kericho and Nyando Districts. Originally, the area was wooded grassland with indigenous trees and natural grasses before the conversion that took place when the white settlers arrived in the area in the early 1900’s. Muhoroni and Chilchila divisions were in the white settlement scheme from 1895 to 1967. During this time, half of the land was under coffee plantations, which were mainly situated on the hill tops and on dissected plains. Mid slopes and foot slopes were left for dairy ranching and part of the remaining areas (plains) were mostly planted to maize. The land use trend changed as the white settlers left and most of the area turned to sugarcane growing. Maize cultivation expanded on the plain areas. The north-eastern part of the block remained in coffee, as it was during the white settler’s time.
Figure 4.1 Administrative map of the Middle Nyando block. The blue dots are the sampling points for the biophysical survey.
In general there are few trees in the landscape. However, the vegetation is well conserved on the steep slopes (slope ranging from 6 to 29%) and the area is sparsely settled, overall. The maize fields are generally under poor management and slopes are being farmed with no soil conservation structures. Agriculture in clusters 8 and 12 is mainly maize. In cluster 15, two rivers, the Mugut and the Kipsinende join. This area is characterized by
1
2
5
4
6
3 7
8
9 13
10
11
14
12
15
16
1
2
5
4
6
3 7
8
9 13
10
11
14
12
15
16

25
steep slopes and there is good protection of the riparian vegetation along the Kipsinende River, but this is not the case for the Mugat River.
4.1 Biophysical baseline data summary
4.1.1 Topography
This block is composed of a series of ridges and valleys. The Barariet River traverses the block from east to west and carries large amounts of suspended material (Figure 4.1). The flood plain of this river is fairly wide and is characterized by gentle slopes and plains with gentle slopes ranging from 3 to 10% (Table 4.1). The central part of the block is moderately undulating with ridges and valleys and medium to high gradient hills. The north and eastern part of the block (clusters 8, 12, 15 and 16) is characterized by steep undulating terrain, with average slopes ranging from 13 to 22%. The south-eastern part of the block (clusters 9 & 13) is characterized by very steep slopes (7-28%) and sparse settlement. The natural vegetation has been cleared for agriculture and erosion is evident around cluster 13. The more gentle slopes of cluster 14 (1-8%) are characterized by gully formation and poor protection of river banks and riparian vegetation.
Table 4.1. Average slope, slope range and incidence of steep slopes Cluster Average slope
(%) Slope range
(%) No. values > 10%
1 12.8 2.8 – 31.8 5 2 6.5 2.0 – 29.0 1 3 4.8 2.3 – 15.0 1 4 7.2 1.8 – 21.5 2 5 11.4 2.5 – 27.5 4 6 13.6 4.3 – 25.0 5 7 5.9 2.5 – 17.3 1 8 13.5 10.0 – 24.0 8 9 13.5 6.3 – 27.0 6 10 5.5 2.3 – 15.0 1 11 11.6 2.5 – 27.3 3 12 12.6 5.8 – 20.5 5 13 16.6 7.5 – 28.8 8 14 4.0 1.3 – 6.5 0 15 13.1 6.3 – 19.5 6 16 22.1 13.0 – 31.5 10

26
Figure 4.2. Elevation map of the Middle Nyando block showing roads, streams, rivers, and sampling points.
4.1.2 Soil texture and soil depth restriction
The soils in this block are mainly clay soils (Table 4.2). A few soils are loamy soils (2 plots), sandy loams (5 plots) and silty clay soils (4 plots). There is very little variation in texture across the block.
Table 4.2. Soil texture (% of samples).
Clay Silty clay
Clay loam
Sandy loam Loam
Silty loam
Sandy clay loam
89 4 3 3 1 1 0
Soil depth restriction is apparent throughout the block, with 55% of the sub-plots sampled showing restrictions within the upper 50 cm of the soil profile (Table 4.3). Clusters 3, 13 and 15 had relatively low incidence of depth restrictions. Depth restrictions are particularly acute in the eastern part of the block (clusters 9, 13, 15 and 16). The majority of the soils showing depth restrictions had these problems at shallow depths (<20 cm).

27
Therefore, before planning any activity in relation to tree planting and agriculture, soil depth should be assessed for the planned intervention area.
Table 4.3. Incidence of depth restrictions per cluster (values = % of subplots per cluster with depth restrictions; n = 40 per cluster).
Cluster Shallow (≤ 20 cm) Deep (> 20 cm) 1 63 10 2 25 8 3 30 13 4 18 5 5 43 10 6 40 15 7 13 8 8 38 28 9 68 15 10 15 13 11 28 15 12 33 35 13 38 45 14 13 38 15 45 30 16 73 18
4.1.3 Vegetation and land use Grassland is the major land-use in the block, followed by farm land (Table 4.4). Agriculture is mixed production systems with large areas planted to cereals like maize. Sugar cane is generally grown on the plains and gentle foot slopes where maize is grown on the steeper slopes. There are large areas of forage land and scrub land that are used for low-intensity grazing. Natural grass species includes both perennial and annual both palatable and unpalatable for livestock. The dominant species in the area are:
1. Cymbopogon comphanatus: perennial grass, moderate to high forage quality;
2. Sporobolus pyramidalis: annual grass; low forage value;
3. Digitaria ciliaris: annual grass; low forage value;
4. Digitara gazensis: perennial grass; high quality forage
5. Eragrostis aspera: annual grass; moderate forage quality;
6. Eragrostis superba: perennial grass; good quality forage;

28
7. Hyparrhenia collina: perennial grass; good forage, but it should be stocked in the early stages of growth.
Table 4.4. Land cover classification (N=160) Vegetation strata No. points Percentage Perennial grassland 61 38.1 Farm land 42 26.3 Forage land 24 15.0 Shrub land 13 8.1 Other 8 5.0 Bush land 7 4.4 Fallow 5 3.1
In addition to sugar cane and maize, coffee is grown in the area around cluster 16. There are small areas of woodland along the Yala River. In this area several indigenous trees are seen in association with the coffee fields such as Cordia abssynica, Markhamia lutea and the exotic Grevillea robusta. These coffee fields offer opportunities for intensifying agroforestry by increasing tree cover and integrating tree species that can contribute to farmer income (e.g. avocado, macadamia, etc.). A classification of the primary current land use showed the following:
Food / beverage: 28% Forage: 73%
Timber / fuel wood: 31% Other: 14%
Tree cover was fairly sparse in the block. Only 30% of the 160 plots had trees growing within the sampling area. Much of the western part of the block had very few or no trees in the plots. The woody vegetation is mainly evergreen and semi-deciduous (Table 4.5). Tree and shrub densities are highest in small clusters on hilltops and mid-slopes of medium to high gradient hills. The following tree species are seen in the landscape: Olea Africana and Juniperus procera in higher altitudes, Acacia persiciflora on mid-slopes, and Acacia polyacantha and Acacia gerradi on foot slopes. Clusters 3 and 4 have plantations of exotic trees like Eucalyptus spp. and Grevillea robusta. The natural vegetation on the mid and upslope areas are being cleared and replaced with agriculture because of the initial good soil fertility and subsequent yields. Hence, the Project should focus on activities which replenish soil fertility in degraded areas and reduce degradation in the areas that are currently being converted to agriculture. The Project should also focus on promoting the production of fuelwood as part of the afforestation activities.

29
Table 4.5. Woody vegetation type
Broadleaf Needle leaf Allophytic Evergreen Deciduous
79% 6% 2% 69% 10%
The majority of the farms sampled are privately owned (98%). One farm is located on communal land, and two are located on government land. In one case ownership could not be established. More than 40% of the farms have had the same land use since 1990 and only 11% of the farms have changed land use. For many farms (44%) it could not be determined whether the land use type had changed since 1990. This area was part of a settlement scheme, where most of the land was acquired after independence from the white settlers. At that time, most of the land was under coffee and improved pastures. It is only after independence that sugar cane and maize was grown in the area.
4.1.4 Soil erosion and conservation measures
Soil erosion was observed in more than half of the plots: 44% of the plots showed visible signs of sheet erosion, 6% showed visible signs of rill erosion and one plot was located on the perimeter of a gully. The highest incidence of soil erosion was in clusters 1, 2, 8, 9 and 12 (Table 4.6); clusters 3, 4 and 14 had low incidence. Sheet erosion was the most common type or erosion encountered; rill erosion was not particularly common. We found gulley erosion at only one site in cluster 11.
The area close to the Homa Lime Company is under very good management and no visible signs of erosion are seen in this cluster or in the surrounding area. However, soil and water conservation measures are not seen elsewhere in the block. Of the plots experiencing sheet erosion, only 13 plots had conservation measures in place: 4 farms had vegetative measures in place and 9 farms had structural measures in place. Of the 10 plots experiencing rill erosion, only 1 plot had conservation structures established. For the area where a gully is forming, no conservation measures have so far been established, and addressing this should be a priority for the Project.
The high presence of soil erosion and the low numbers of soil and water conservation measures resulting in large transport of sediment by the streams and rivers should be one of the key-entry points in this block. It is not uncommon to see farmers ploughing up and down the slope rather than across the gradient, as recommended.
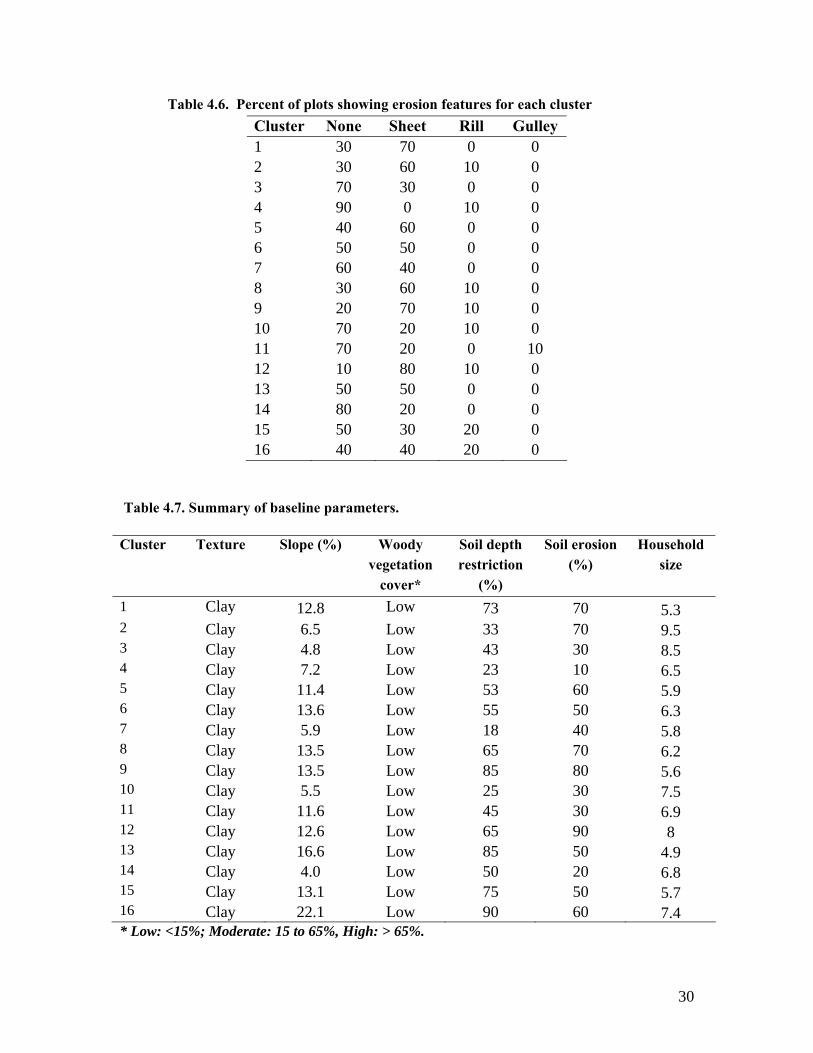
30
Table 4.6. Percent of plots showing erosion features for each cluster Cluster None Sheet Rill Gulley 1 30 70 0 0 2 30 60 10 0 3 70 30 0 0 4 90 0 10 0 5 40 60 0 0 6 50 50 0 0 7 60 40 0 0 8 30 60 10 0 9 20 70 10 0 10 70 20 10 0 11 70 20 0 10 12 10 80 10 0 13 50 50 0 0 14 80 20 0 0 15 50 30 20 0 16 40 40 20 0
Table 4.7. Summary of baseline parameters.
Cluster Texture Slope (%) Woody vegetation
cover*
Soil depth restriction
(%)
Soil erosion (%)
Household size
1 Clay 12.8 Low 73 70 5.3 2 Clay 6.5 Low 33 70 9.5 3 Clay 4.8 Low 43 30 8.5 4 Clay 7.2 Low 23 10 6.5 5 Clay 11.4 Low 53 60 5.9 6 Clay 13.6 Low 55 50 6.3 7 Clay 5.9 Low 18 40 5.8 8 Clay 13.5 Low 65 70 6.2 9 Clay 13.5 Low 85 80 5.6 10 Clay 5.5 Low 25 30 7.5 11 Clay 11.6 Low 45 30 6.9 12 Clay 12.6 Low 65 90 8 13 Clay 16.6 Low 85 50 4.9 14 Clay 4.0 Low 50 20 6.8 15 Clay 13.1 Low 75 50 5.7 16 Clay 22.1 Low 90 60 7.4 * Low: <15%; Moderate: 15 to 65%, High: > 65%.
31
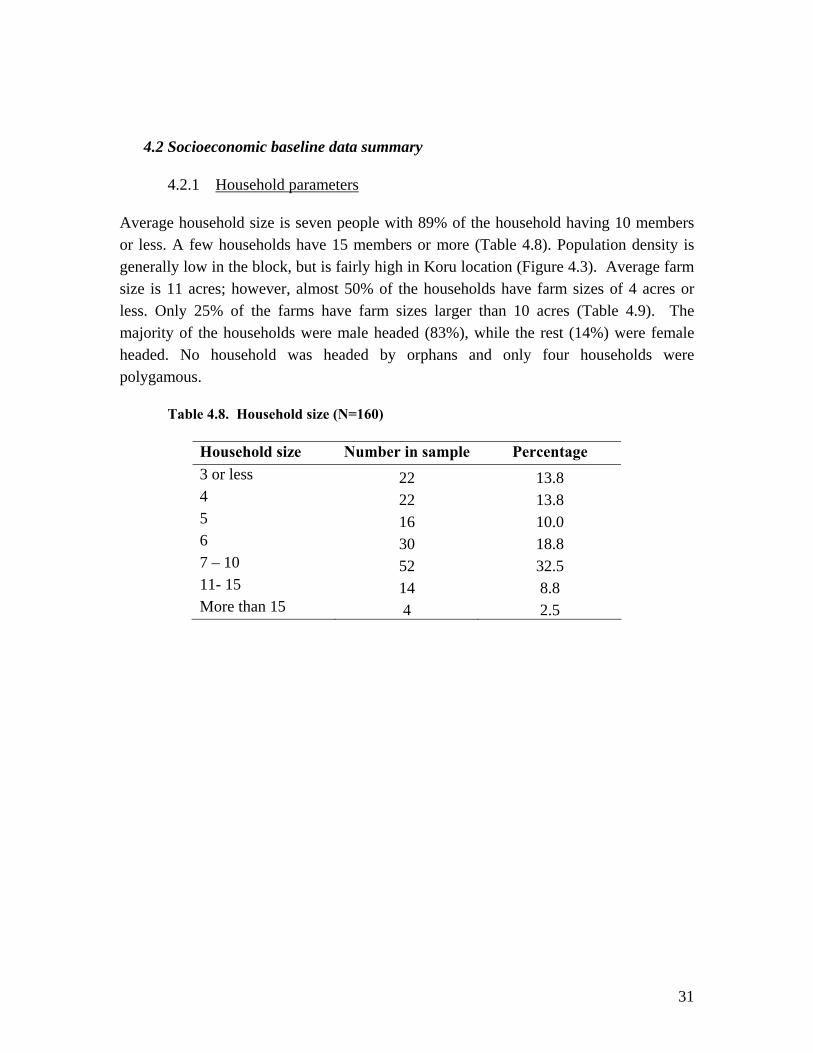
4.2 Socioeconomic baseline data summary
4.2.1 Household parameters
Average household size is seven people with 89% of the household having 10 members or less. A few households have 15 members or more (Table 4.8). Population density is generally low in the block, but is fairly high in Koru location (Figure 4.3). Average farm size is 11 acres; however, almost 50% of the households have farm sizes of 4 acres or less. Only 25% of the farms have farm sizes larger than 10 acres (Table 4.9). The majority of the households were male headed (83%), while the rest (14%) were female headed. No household was headed by orphans and only four households were polygamous.
Table 4.8. Household size (N=160)
Household size Number in sample Percentage 3 or less 22 13.8 4 22 13.8 5 16 10.0 6 30 18.8 7 – 10 52 32.5 11- 15 14 8.8 More than 15 4 2.5

32
Figure 4.3. Population densities in middle Nyando block.
Table 4.10. Table Livestock in percentage (N=160)
Cow Chicken Goat Bull Sheep No. Local1 HB2 Local HB Local HB Local HB Local
0 70 136 18 0 67 159 85 146 100 1 15 6 1 0 10 1 22 4 39 2 40 7 6 0 13 0 23 5 16 3 12 4 13 0 15 0 11 2 2 >3 22 7 122 0 55 0 19 3 3 Highest no.
10 9 60 0 56 1 12 8 4
The source of fodder is mainly grass and crop residues collected within the farm. The area upon which crop residue is produced is an average of 1.6 acres, whereas the area for livestock grazing is 2.1 acres. One third of the farmers leave their livestock to graze on communal (47 cases) and government land (9 cases). Commercial feed is a source of fodder for 46 households, and 24 households also buy locally produced feed. However, 93% of the households report experiencing problems with their livestock. More than 54%
33
of the households say they do not have adequate land for feeding their livestock and 64% experience problems with free-grazing livestock from neighbours, which corresponds well with the fact that 82% of the households practice free-grazing.
4.2.2 Major constraints at farm level
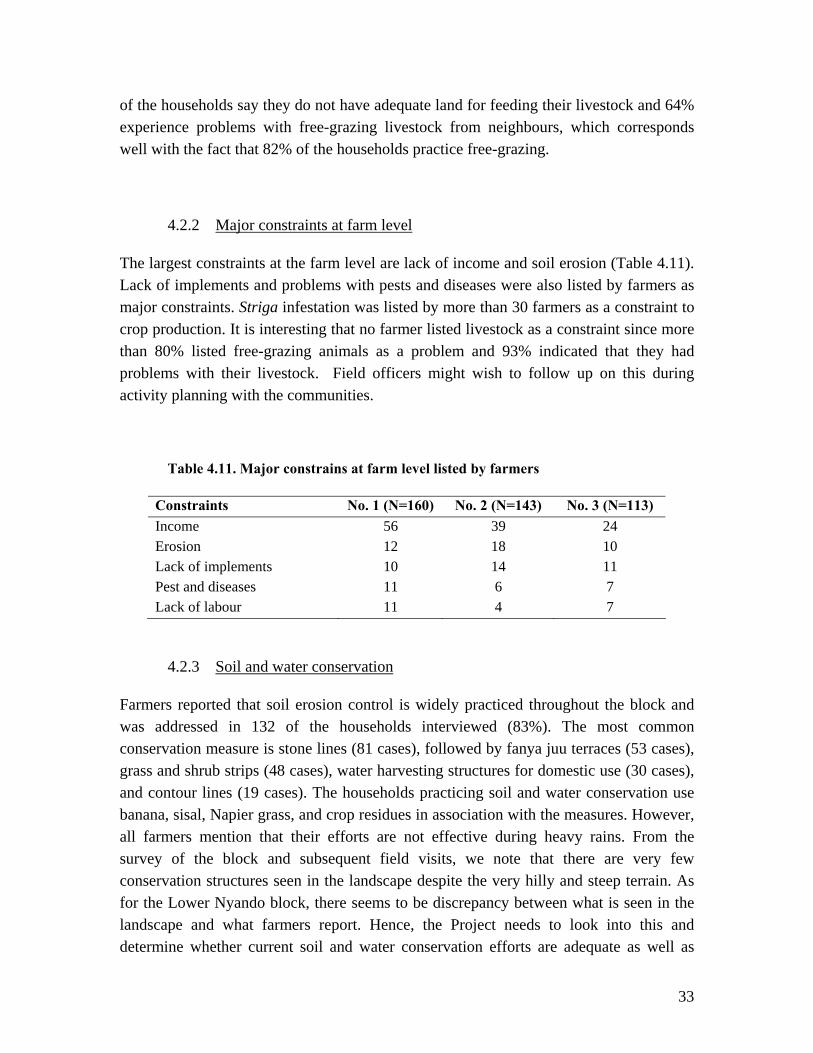
The largest constraints at the farm level are lack of income and soil erosion (Table 4.11). Lack of implements and problems with pests and diseases were also listed by farmers as major constraints. Striga infestation was listed by more than 30 farmers as a constraint to crop production. It is interesting that no farmer listed livestock as a constraint since more than 80% listed free-grazing animals as a problem and 93% indicated that they had problems with their livestock. Field officers might wish to follow up on this during activity planning with the communities.
Table 4.11. Major constrains at farm level listed by farmers
Constraints No. 1 (N=160) No. 2 (N=143) No. 3 (N=113) Income 56 39 24 Erosion 12 18 10 Lack of implements 10 14 11 Pest and diseases 11 6 7 Lack of labour 11 4 7
4.2.3 Soil and water conservation
Farmers reported that soil erosion control is widely practiced throughout the block and was addressed in 132 of the households interviewed (83%). The most common conservation measure is stone lines (81 cases), followed by fanya juu terraces (53 cases), grass and shrub strips (48 cases), water harvesting structures for domestic use (30 cases), and contour lines (19 cases). The households practicing soil and water conservation use banana, sisal, Napier grass, and crop residues in association with the measures. However, all farmers mention that their efforts are not effective during heavy rains. From the survey of the block and subsequent field visits, we note that there are very few conservation structures seen in the landscape despite the very hilly and steep terrain. As for the Lower Nyando block, there seems to be discrepancy between what is seen in the landscape and what farmers report. Hence, the Project needs to look into this and determine whether current soil and water conservation efforts are adequate as well as

34
give trainings to the communities on best practices. Furthermore, many farmers are ploughing up/down slope and not across the slope as generally recommended. This question was therefore put forward to some of these farmers and their response was that they were not aware of the consequences of farming up-down slope as compared to across the slope. Hence, in this block the Project should implement activities which focus on good farming practices as well as the importance of soil and water conservation measures. Since many farmers are already practicing some form of soil and water conservation this could be a very good entry point into the block.
4.2.4 Trees & Agroforestry
The majority of the farmers are practicing agroforestry. More than 90% of the homesteads have trees which are protected and more than 95% of the interviewed farmers are interested in planting more trees. The few farmers that are not interested in planting trees list land ownership (4 farmers), land size (4 farmers) and being a squatter as the reasons for their lack of interest in trees. Six farmers mentioned cultural practices as a hindrance to tree planting. These farmers are from Koru (4 farmers), Nyando (1 farmer) and Ogwedhi (1 farmer) sub-locations. The issue of cultural practices in relation to tree planting needs to be looked into more closely for Koru sub-location since this could have a negative impact on the Project. Table 4.12 lists the top 10 most common tree species preferred by the farmers.
Table 4.12. Tree species on-farm (N=160)
No. Tree species No. farms with the species 1 Grevillea robusta 55 2 Eucalyptus (Blue gum) 50 3 Fruit trees (incl. Mango) 43 4 Acacia spp. 40 5 Cypress spp. 29 6 Markhamia 28 7 Croton spp. 23 8 Avocado spp. 12 9 Jacaranda spp. 11 10 Sesbania sesban 7

35
Farmers grow trees for various reasons. In this area the farmers listed the reasons for practicing agroforestry as follows:
1. Fuel wood production 2. Wind breaks 3. Timber production 4. Fruit production 5. Food production
6. Soil fertility 7. Medicinal product production 8. Fodder production 9. Aesthetics 10. Soil conservation
The main sources of fuel in this area are paraffin, wood and charcoal. Table 4.13 lists the percentage of farmers using the various fuel sources listed in the questionnaire. More than 80% of the households are not self sufficient in fuel, which might explain the high number of farmers interested in more tree planting. More than 90% of the interviewed farmers are interested in planting more trees.
One key motivation for planting trees in this block is that Homa Lime Company is buying wood from farmers for the processing of limestone. Thus, there is already a market for wood. In fact, the Homa Lime plant is not operating at full capacity because of lack of wood. Hence, in this block there is a market for tree products and the Project should capitalize on this and work closely with the Homa Lime Company to explore marketing opportunities, the possibility of company support to farmers, and on the technical details regarding tree species selection for indigenous trees, dimensions desired and seed provision for local nurseries in the area.
Table 4.13. Fuel source
Fuel source Percentage Paraffin 96% Wood 86% Charcoal 48% Crop residue 33% Gas 4% Electricity 2% Solar & generator 1%
4.2.5 Training and group membership
The majority of the farmers interviewed have not received any formal training. Only 35 (23%) of the farmers interviewed had received training and of these farmers, 28 are members of a group. Thus, it appears that a farmer is more likely to receive training if

36
he/she is a member of a group. Only 7 farmers who are currently not a member of any groups have received training.
Table 4.14. Groups and main activity undertaken
Group name Cluster Main activity Makini Victory 8 Horticulture Patient Women’s group 10 Horticulture Fort Tenan Welfare group 10 Farming Chepkosa Women’s group 13 Tree planting Mugut Women’s group 16 Farming
Less than half of the farmers (45%) belong to groups. The Project should look into the reasons behind low adherence to groups and understand how farmers in this area perceive collective action. The Project could then identify key groups in the target areas and engage with them early in the PAP development process. Some groups are already focusing on tree planting, bee-keeping and better farming practices, but these groups are few in number. Generally, groups in this area are focusing on sugar cane production and marketing of associated products. This suggests that market opportunities foster cooperation within the communities and the Project should take advantage of this, if indeed this proves to be the case during interactions with communities. The table below lists some of the groups which might be of interest to the Project.
4.3 Market accessibility Market accessibility is generally good throughout the central portion of the block, but a few areas in the north and southern part of the block are relatively isolated from markets (Figure 4.4). In this block as well, the area has a reasonably good road network, so market oriented activities, like growing wood for timber or fuelwood may be feasible.

37
Figure 4.4 Market accessibility.
4.4 Synthesis and Recommendations
The terrain in the Middle Nyando block is very challenging with the major landforms being hills, escarpments and steeply sloping land. The tributaries of the Nyando River are carrying a lot of sediment, which has been washed into the river and streams by overland flow and soil erosion. The areas under sugar cane, mainly the foot slopes, are generally well managed with no visible erosion taking place. The areas under maize and the areas left for grazing, mainly the mid-slopes and hill tops, are the severely degraded and being cleared of any remaining natural vegetation. Farmers are encroaching on to the hills for maize production because of the initial good yields. Very few farmers have implemented soil and water conservation measures and in general there are very few trees in the landscape. Therefore, the management recommendations for the Middle Nyando block have been grouped into five categories:

38
• Increase the woody vegetation cover with special emphasis on indigenous trees;
• Soil and water conservation measures with special focus on best management practices on sloping land as well as control of rill and gully erosion;
• Soil fertility replenishment through plantation of leguminous trees and shrubs and improved FYM management;
• River bank protection. Several interventions are being implemented with poor success; and
• Group establishment and training in technical areas as well as in group dynamics.
Figure 4.4 shows the Middle Nyando block with the rivers and road networks displayed. Three main areas have been identified as potential intervention areas for the Project.
Figure 4.5. Priority intervention areas in the block.

39
The first area (Area 1) is mainly located in Timbilil sub-location (cluster 8 & 12). This area has been selected because of the prevalence of poor farming practices. Farmers are cultivating steep slopes with no or few soil conservation structures in place. In addition, soil cover is low and the main crop, maize, is generally in poor condition. The close proximity to the Homa Lime Company which has many good interventions in place could serve as an extension site to demonstrate good farming practices and ensure the sustainability of Project activities. Furthermore, farmers are encroaching further into the hills for fuel wood and cultivation and this trend needs to be reversed.
Soil and water conservation through terracing and contour planting. With time, the contours will serve as terraces if planted and managed properly. Contour strips of Napier grass, leguminous tree and shrubs such as Tephrosia spp., Crotalaria spp., Sesbania sesban and Gliricidia sepium and Calliandra spp. are recommended. Most farmers mentioned fodder constraints and low soil fertility, both of which could be addressed through the integration of legumes in soil and water conservation measures. In addition to this, the sparse woody cover should be increased through tree planting along farm boundaries, contours and in woodlots. Various indigenous trees should be planted with special emphasis on hardwood species, fruit trees and trees for fuel wood such as Croton macrostachys, Markhamia lutea, Acacia spp., Casuarina equisetofolia.
Horticulture is another activity that could be introduced in this area. There is one group in the area whose main activity is horticulture. The foot- and mid-slopes is suitable for horticulture activities and could be one entry point for the Project in the area. Tree nursery establishment and/or training and capacity building of existing groups should be promoted in this area.
The second area cuts across three sub-locations (Area 2): Kokwet, Koisagat, and Fort Tenan (cluster 10, 11, 15 &16). This area has been selected because of i) high levels of soil erosion due to cultivation of steep slopes with few soil conservation measures in place; ii) visible incipient and on-going gully formation; iii) opportunities for protection of riparian vegetation; and iv) the opportunity for integration of trees in coffee growing.
From the socioeconomic survey, the following groups were mentioned: Fort Tenan Welfare group and Mugut Women’s group located in cluster 10 and 16, respectively. These two groups focus on better farming practices. In addition to these two groups, there is also the Patient Women’s group located in cluster 10, which main activity is horticulture.
In cluster 10, a gully is forming and activities which can rehabilitate the gully and stop its spread should be implemented. These activities among other should include: diversion of

40
surface runoff water, increase the soil cover through tree planting and introduction of cover crops such as Dolichos lablab and Mucuna spp. and other crops which quickly provide soil cover and simultaneously provides additional fertility benefits. Depending on the size of the gully, when activities are being implemented, stabilization of gully walls could also be an activity the Project could focus on.
Protection of riparian vegetation is an activity which should be introduced in the area around cluster 15 where the Mugut and Kipsinende Rivers join. Along the Mugut River several good interventions have been set up to protect the riparian vegetation. These initiatives can serve as demonstration sites for activities along the Kipsinende River, where there is no protection of the riparian vegetation. In addition, farmers in the area need to be sensitized in the importance of protection of riparian vegetation and the consequences of cultivating up to the river bank.
In the area around cluster 16, farmers are growing coffee. Some coffee farms are being managed very well, however, the number of trees in the coffee fields has greatly declined over time. At the same time, coffee yields have been declining. Therefore, activities which integrate coffee production and tree growing should be considered in the area. The coffee farmers have the capital to purchase seedlings and are willing to invest in their farms, however they do not have access to knowledge and information about tree growing and which types are appropriate in shade coffee systems. The Project should therefore capitalize on this aspect and assist the communities with nurseries and promote them as an enterprise. Within the coffee farms the following indigenous trees are currently seen: Cordia, Markhamia lutea, Erythyrina abyssinica and the exotic Grevillea robusta. Other trees, such as Macadamia and Avocado, could be introduced into these systems to diversify the production and increase income.
The last area selected (Area 3) is located in Koisagat, Siwot, and Ochoria sub-locations (clusters 9, 13 & 14). Just on the outskirts of Fort Tenan town, several attempts are being made to protect the river bank and the main road. A little further away, two small gullies are forming, where one is threatening the main road. Several more gullies are forming close to the Barariet River. Hence, this area has been selected for river bank protection and rehabilitation of the catchment area and control of rill and gully erosion. In addition to these activities, the area around cluster 13 has been selected for improved pasture. This area is currently functioning as a grazing area for the surrounding communities. The area is severely degraded on the plateau and on the slopes; homesteads are seen often located in areas which are prone to heavy runoff and landslides. In this area only one group was mentioned which is of interest to the Project, Chepkosa Women group which focuses on tree planting (cluster 13). The Project could strengthen this group and explore opportunities to expand their activities.

41
Activities focusing on river bank protection should be initiated in the area of cluster 14 on the outskirts of Fort Tenan town. The river is undermining the river banks and thereby threatening the bridge and main road. Hence the main activities to be implemented include: protection of riparian vegetation and planting of appropriate species to increase the vegetative cover along the river. Increasing soil cover of the areas draining into the river will reduce surface runoff and thereby assist in the stabilization of the gullies which are forming and progressing at a relatively high speed. As recommended for Area 2, activities which can rehabilitate the gullies should be implemented. These activities should include: diversion of surface runoff water, increase of soil cover through tree planting and introduction of cover crops such as Dolichos lablab and Mucuna spp. and other crops which quickly provide soil cover and simultaneously provide additional benefits. Depending on the size of the gully when activities are being implemented, stabilization of gully walls could also be considered
The area of cluster 13 is ideal for improved pasture establishment. The area is used for grazing of livestock; however, the grasses present are of low quality for livestock. Hence, in this area, activities which include introduction of improved pasture grass species should be promoted. In addition, the communities need to be sensitized on free-grazing versus zero-grazing of livestock and additional fodder banks should be established on farmers’ fields. Along side these activities, the introduction of improved breeds of goats and cows could be a key point in addressing the issue of free-grazing. Nurseries should also be established and the women group, Chepkosa, could be the first one to train.
Finally, the hill slopes are not managed well and activities which increase soil cover, especially the woody cover should be the focus in this area. The Project should explore with the population the possibilities of establishing set aside areas on the hills. In addition, terraces should be established to control runoff. This area is prone to landslides if runoff is not managed and controlled. Furthermore, farmers in this area do not have easy access to water and activities which harvest runoff water for both domestic and agricultural purposes should be targeted.
The activities and interventions proposed for the three areas mentioned above should not exclude any activities mentioned by the communities in the PAP’s. Hopefully, the recommended activities will support and supplement the activities prioritized by the communities.
Finally, we would like to describe the reasons for not selecting the remaining part of the block for Project activities. The area around cluster 1, 2, 3, and 5 is mainly under sugar cane on level terrain. The area around cluster 5 could have been selected for improved pastures, but since the Project has to limit the areas of interventions, this area was

42
excluded. Cluster 4 is located close to the Homa Lime Company which is already implementing community work in relation to farming practices and biodiversity improvement. Instead of setting up activities in this area, the Project should partner with the Homa Lime Company and learn from their experiences in the area and share with them information of the value of indigenous trees and their functions. The areas around cluster 6 and 7 were not selected because cluster 6 is mainly located on a hill top with sparse settlement and cluster 7 is mainly a sugar cane producing area, with good management. However, this does not mean that the Project can or should not implement activities in these areas. The selection presented here should simply be seen as guidance to the field officer for the Nyando River basin.

43
5. Upper Nyando
The Upper Nyando block lies in Kericho District. The block covers part of Londiani and Kipkelion divisions of Kericho district and is located on the south-western flank of Tindoret Volcano. Within the block are six locations and twelve sub- locations. The entire block is made up of undulating highlands with numerous small seasonal streams, which run across the cluster and drain into Kipchorian River, which flows into the River Nyando. Formerly the land was bushland and grassland. The entire block was part of the white settlement area between 1945 and 1967. The major land use then was rangeland for livestock raising. The area supported mainly dairy and beef cattle, but a few areas were used for growing wheat, especially in seasonally wet sites on the valley bottoms and foot slopes.
Land-use has changed drastically in the last 30 years, with the conversion to agricultural land. The majority of the farmers in the block are still squatters who are temporarily farming. Maize farming and livestock rearing are now the major economic activities. Extensive areas of vegetation have been cleared to give way to crops and grazing, even on the steep slopes. Due to the expansion of low-input, subsistence farming, land degradation has become widespread and most of the important tree species, some of high medicinal value and some of high timber quality, have disappeared. There is evidence of heavy deforestation from the sparse vegetation on the hillsides. Soil erosion is a serious problem in this area.
The map below (Figure 5.1) shows the Upper block of Nyando. The blue dots are the sampling points for the biophysical survey – e.g. the points fall in 16 clusters. The socioeconomic team used the 16 clusters as their entry point and identified 10 households per cluster.
5.1 Biophysical baseline data summary
5.1.1 Topography The area of Upper Nyando is generally characterized by steep terrain at a relatively higher altitude (1920 – 2430 masl) with slopes ranging between 1 and 51% (Table 5.1). About 62% of the sample plots had slopes greater than 10% and 28% of the plots had slopes exceeding 20%. Lower gradient slopes were found around clusters 12, 15 and 16. The steepest slopes were found through the middle of the block where the highlands give way to the river valley. Steep slopes were also found along the crests of the ridges. The riparian area of the Kipchorian River is characterized by a narrow floodplain with wetland vegetation.

44
Figure 5.1. Administrative map of the Upper Nyando block. The blue dots are the sampling points for the biophysical survey
Table 5.1. Average slope, slope range and incidence of steep slopes.
Cluster Average slope (%)
Slope range (%)
No. values > 10%
1 13.7 9.2 - 25.9 1 2 15.0 4.8 - 34.4 2 3 24.8 6.1 - 41.4 6 4 14.3 5.7 - 26.8 2 5 22.6 2.6 – 43.0 4 6 21.5 9.6 - 37.4 8 7 16.9 3.5 – 33.0 4 8 17.7 2.6 - 36.4 5 9 12.0 5.2 – 24.0 2 10 23.7 6.1 - 36.9 6 11 27.4 7.0 - 51.5 5 12 5.6 1.7 - 8.7 0 13 11.2 3.9 - 34.4 1 14 19.0 4.8 - 42.4 6 15 4.6 0.9 - 9.6 0 16 6.8 4.4 - 10.5 0
1
2
59 13
3
6
7
48
12
16
11 15
10 14

45
Figure 5.2. Elevation map of the Upper Nyando Block showing streams and roads.
5.1.2 Soil texture and soil depth restrictions The soil texture in this area is mainly clay to clay loam (Table 5.2). The remaining 9% of the sampled area is a mixture of coarser textured loams.
Table 5.2. Soil texture (percent of samples).
Clay Clay loam Loam
Sandy loam
Silty loam Other
24.7 66.6 2.8 0.8 4.5 0.6 Soil depth restrictions were widespread across the block, with 47% of the subplots sampled showing restrictions within the first 50 cm and 23% of the subplots showing restrictions within the first 20 cm. The southern side of the block had the highest incidence of depth restrictions (clusters 1, 5, 9, and 13). Clusters 7 and 10 also had high incidence of restrictions. The incidence of restriction was less than 25% only in clusters 14 and 15.

46
Table 5.3. Incidence of depth restrictions per cluster (values = % of subplots per cluster with depth restrictions; n = 640).
Cluster Shallow (≤ 20 cm) Deep (> 20 cm) 1 15 85 2 10 35 3 10 18 4 15 13 5 38 48 6 23 23 7 28 33 8 33 8 9 25 25 10 53 20 11 35 10 12 10 20 13 58 18 14 10 5 15 10 13 16 15 10
5.1.3 Vegetation and land use The largest allocation of the land is to agricultural production (Table 5.4). Farms are mixed production systems where the most important cereal is maize. Fallowing of land is no longer common in this area and the soil fertility is largely depleted as a result of this. Livestock production is another major activity – mainly dairy cattle. Thus, there are extensive areas of perennial grassland and other types of grazing land throughout the block. Some agricultural land (7.5%) has been degraded to the point where it has been abandoned and is now used for low-intensity livestock grazing. Paddocks, mainly natural grasses, are relatively large (1-5 acres) and are often seen around every homestead. These paddocks are well fenced with barbed wire to restrict animal movement. The dominant grass species are:
1. Cynodon dactylon : perennial grass; good quality forage
2. Sporobolus pyramidalis: annual grass; low forage value;
3. Digitaria ciliaris: annual grass; low forage value;
4. Digitara gazensis: perennial grass; high quality forage
5. Eragrostis aspera: annual grass; moderate forage quality;
6. Sporobolus pyramidalis: annual grass; low forage value;
7. Hyparrhenia variabilis: perennial grass; good forage, but it should be stocked in the early stages of growth.
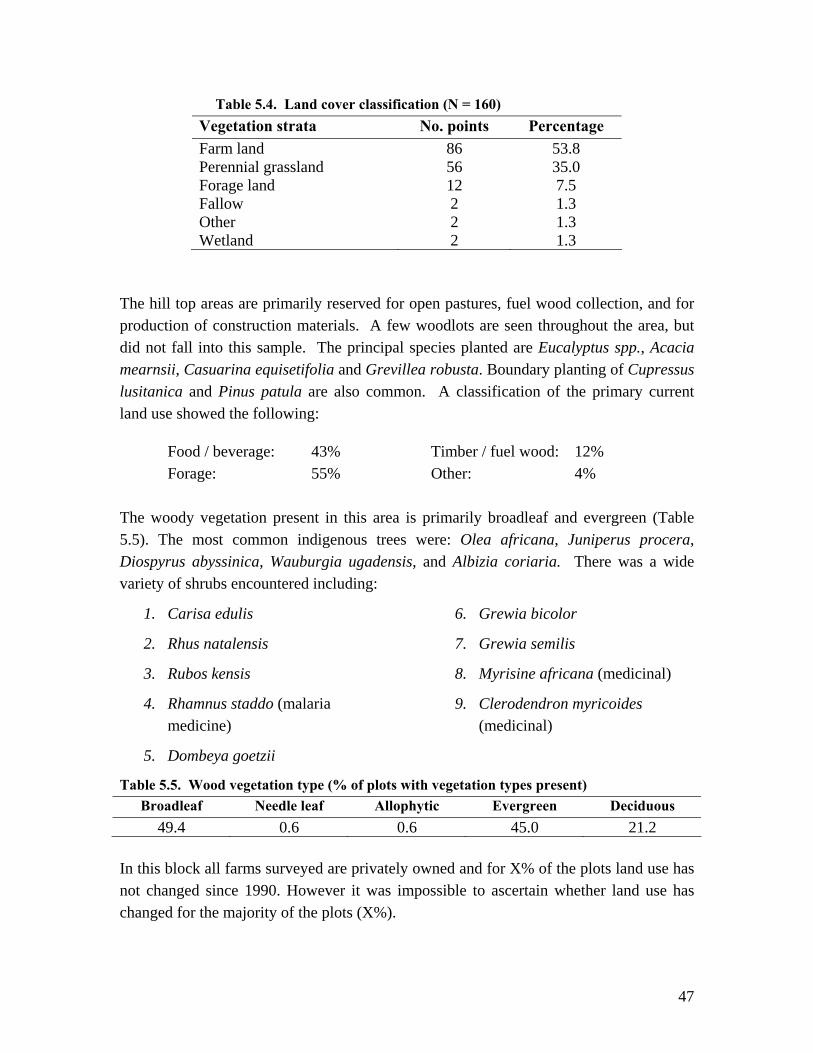
47
Table 5.4. Land cover classification (N = 160) Vegetation strata No. points Percentage Farm land 86 53.8 Perennial grassland 56 35.0 Forage land 12 7.5 Fallow 2 1.3 Other 2 1.3 Wetland 2 1.3
The hill top areas are primarily reserved for open pastures, fuel wood collection, and for production of construction materials. A few woodlots are seen throughout the area, but did not fall into this sample. The principal species planted are Eucalyptus spp., Acacia mearnsii, Casuarina equisetifolia and Grevillea robusta. Boundary planting of Cupressus lusitanica and Pinus patula are also common. A classification of the primary current land use showed the following:
Food / beverage: 43% Forage: 55%
Timber / fuel wood: 12% Other: 4%
The woody vegetation present in this area is primarily broadleaf and evergreen (Table 5.5). The most common indigenous trees were: Olea africana, Juniperus procera, Diospyrus abyssinica, Wauburgia ugadensis, and Albizia coriaria. There was a wide variety of shrubs encountered including:
1. Carisa edulis
2. Rhus natalensis
3. Rubos kensis
4. Rhamnus staddo (malaria medicine)
5. Dombeya goetzii
6. Grewia bicolor
7. Grewia semilis
8. Myrisine africana (medicinal)
9. Clerodendron myricoides (medicinal)
Table 5.5. Wood vegetation type (% of plots with vegetation types present) Broadleaf Needle leaf Allophytic Evergreen Deciduous
49.4 0.6 0.6 45.0 21.2 In this block all farms surveyed are privately owned and for X% of the plots land use has not changed since 1990. However it was impossible to ascertain whether land use has changed for the majority of the plots (X%).

48
5.1.4 Soil erosion and conservation measures Soil erosion was visible in 32% of the plots, with highest incidence in clusters 2, 3, 10, and 14 (Table 5.6). With the presence of steep slopes in the block, the extensive low-input agriculture practiced by farmers and the continued expansion of agriculture into more marginal areas for farming (e.g. upper portions of micro-catchments), we expect that the soil erosion problem will grow in the future unless actions are taken now to conserve soils. Clusters 1, 6 and 15 had the lowest incidence of soil erosion. The principal type of erosion is sheet erosion, but rill erosion was present in 5 of the 16 blocks. Soil and water conservation is not widely practiced in this block and needs to be expanded. The clusters with the highest incidence of erosion were the areas where most of the erosion control structures were encountered. This indicates that the population is aware of the problem in the areas where it is most severe. The soil conservation structures that were found are primarily made of vegetative material. Therefore, the Project can build on current practices and extend soil and water conservation practices. This should be done in association with tree planting should be one of the first activities undertaken in this block.
Table 5.6. Percent of plots showing erosion features for each cluster
Cluster None Sheet Rill Gulley 1 90 10 0 0 2 50 30 20 0 3 50 40 10 0 4 80 20 0 0 5 70 30 0 0 6 90 10 0 0 7 70 30 0 0 8 70 10 20 0 9 70 30 0 0 10 40 50 10 0 11 60 20 20 0 12 80 20 0 0 13 70 30 0 0 14 40 60 0 0 15 100 0 0 0 16 60 40 0 0
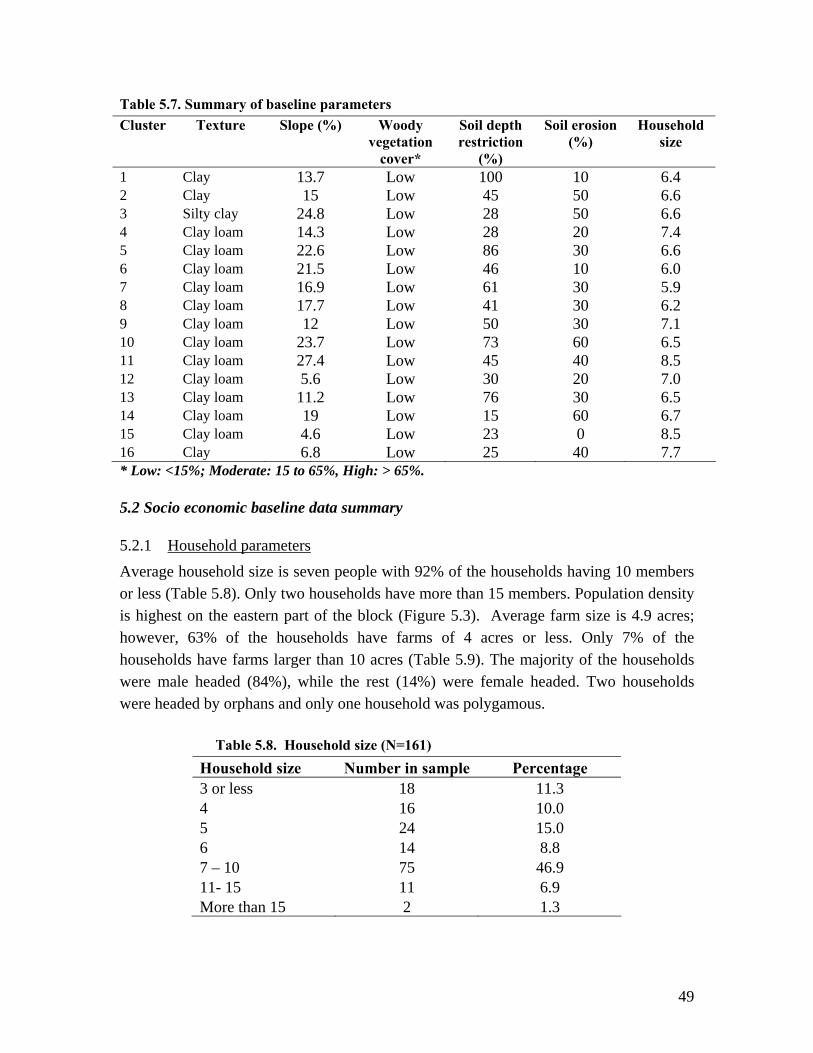
49
Table 5.7. Summary of baseline parameters Cluster Texture Slope (%) Woody
vegetation cover*
Soil depth restriction
(%)
Soil erosion (%)
Household size
1 Clay 13.7 Low 100 10 6.4 2 Clay 15 Low 45 50 6.6 3 Silty clay 24.8 Low 28 50 6.6 4 Clay loam 14.3 Low 28 20 7.4 5 Clay loam 22.6 Low 86 30 6.6 6 Clay loam 21.5 Low 46 10 6.0 7 Clay loam 16.9 Low 61 30 5.9 8 Clay loam 17.7 Low 41 30 6.2 9 Clay loam 12 Low 50 30 7.1 10 Clay loam 23.7 Low 73 60 6.5 11 Clay loam 27.4 Low 45 40 8.5 12 Clay loam 5.6 Low 30 20 7.0 13 Clay loam 11.2 Low 76 30 6.5 14 Clay loam 19 Low 15 60 6.7 15 Clay loam 4.6 Low 23 0 8.5 16 Clay 6.8 Low 25 40 7.7 * Low: <15%; Moderate: 15 to 65%, High: > 65%.
5.2 Socio economic baseline data summary
5.2.1 Household parameters Average household size is seven people with 92% of the households having 10 members or less (Table 5.8). Only two households have more than 15 members. Population density is highest on the eastern part of the block (Figure 5.3). Average farm size is 4.9 acres; however, 63% of the households have farms of 4 acres or less. Only 7% of the households have farms larger than 10 acres (Table 5.9). The majority of the households were male headed (84%), while the rest (14%) were female headed. Two households were headed by orphans and only one household was polygamous.
Table 5.8. Household size (N=161)
Household size Number in sample Percentage 3 or less 18 11.3 4 16 10.0 5 24 15.0 6 14 8.8 7 – 10 75 46.9 11- 15 11 6.9 More than 15 2 1.3

50
Figure 5.3 Population density in Upper Nyando Block
Table 5.9. Farm size (N=161)
Farm size No. households Percentage 2 acres or less 64 40.3 3 acres or less 22 13.8 4 acres or less 14 8.8 5 to 9 acres 48 30.2 10 acres or more 11 6.9
5.2.2 Land use and livestock Of the 160 households surveyed, 153 rear livestock. Table 5.10 lists the percentage of households with different species of livestock. Only one household in the study area had pigs and seven households had donkeys. Improved breed cattle are widely raised in the area, but improved breeds of other animals are not widespread. Only three households had improved breed chickens, while only two were raising improved goats.

51
Table 5.10. Livestock ownership in percentage (N=160) Cow Chicken Goat Bull Sheep Donkeys
No.
Local1 HB2 Local HB Local HB Local HB Local Local 0 75.6 35.0 22.5 98.1 77.5 98.8 88.1 73.1 61.9 72.5 1 6.9 12.5 5.0 0.0 3.8 0.6 6.3 10.6 5.6 18.8 2 6.3 20.0 5.0 0.0 8.1 0.0 1.3 7.5 5.6 6.9 3 5.0 12.5 8.1 0.0 3.1 0.6 1.9 3.1 8.8 0.6 >3 6.3 20.0 59.4 1.9 7.5 0.0 2.5 5.6 18.1 1.3 Highest no.
10 10 50 10 12 3 6 8 10 4
1Local indicates local breed, 2HB indicates improved breed The source of fodder is mainly grasses (87%) and crop residue (85%) produced on the farms. Average acreage used for crop residue production is 1.8 acres and livestock grazes on around 2.5 acres, on average. Grazing on communal land is not very common (22%) and uncommon on government land (11%). Forty percent of the households purchase commercial feed and 21 households are buying feed at the local market. However, 85% of the households are experiencing problems with their livestock. The major problem is livestock health, with 65% of the respondents reporting problems with ticks and disease incidence. Forty-three percent of the households cited fodder availability as a major problem with their livestock and 12% cite lack of water. Low milk yield (18% and lack of veterinary services (10%) were also highlighted by farmers. With a large number of farmers reporting inadequate land for grazing their livestock, 78% practice free-grazing, while 61% claim to experience problems with free-grazing livestock from neighbours. The Project will need to deal with the free-grazing problem as it sets up PAPs with the communities.
5.2.3 Major constraints at farm level The largest constraints at farm level are lack of income, resources to invest into the farming enterprise and the high prices for inputs (Table 5.11). Fertilizer and improved seed were often cited as desired inputs. Soil related problems, particularly fertility, stoniness, erosion and water logging were also important. Thus, the Project should pay attention to income generation opportunities, soil erosion and fertility problems in this block. Markets represent a problem in this block, both with respect to selling excess production and prices when surpluses are produced. Pests and diseases on crops and unpredictable weather were also seen as important constraints.
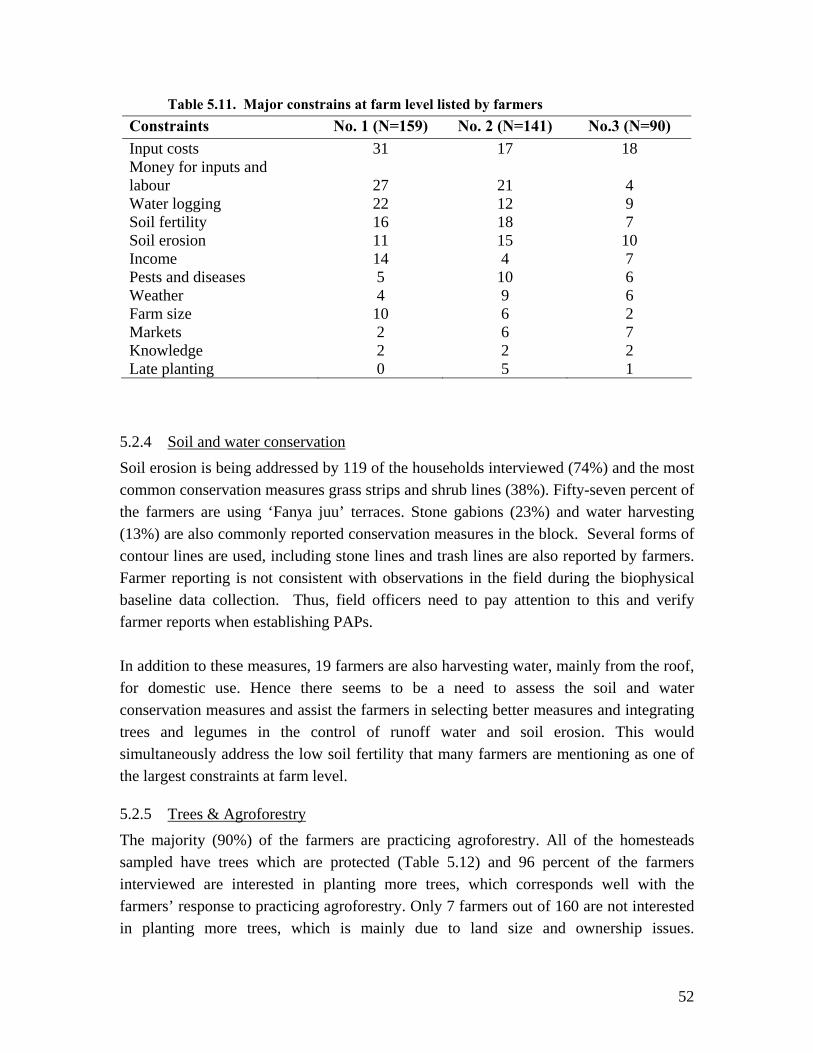
52
Table 5.11. Major constrains at farm level listed by farmers Constraints No. 1 (N=159) No. 2 (N=141) No.3 (N=90) Input costs 31 17 18 Money for inputs and labour 27 21 4 Water logging 22 12 9 Soil fertility 16 18 7 Soil erosion 11 15 10 Income 14 4 7 Pests and diseases 5 10 6 Weather 4 9 6 Farm size 10 6 2 Markets 2 6 7 Knowledge 2 2 2 Late planting 0 5 1
5.2.4 Soil and water conservation Soil erosion is being addressed by 119 of the households interviewed (74%) and the most common conservation measures grass strips and shrub lines (38%). Fifty-seven percent of the farmers are using ‘Fanya juu’ terraces. Stone gabions (23%) and water harvesting (13%) are also commonly reported conservation measures in the block. Several forms of contour lines are used, including stone lines and trash lines are also reported by farmers. Farmer reporting is not consistent with observations in the field during the biophysical baseline data collection. Thus, field officers need to pay attention to this and verify farmer reports when establishing PAPs. In addition to these measures, 19 farmers are also harvesting water, mainly from the roof, for domestic use. Hence there seems to be a need to assess the soil and water conservation measures and assist the farmers in selecting better measures and integrating trees and legumes in the control of runoff water and soil erosion. This would simultaneously address the low soil fertility that many farmers are mentioning as one of the largest constraints at farm level.
5.2.5 Trees & Agroforestry The majority (90%) of the farmers are practicing agroforestry. All of the homesteads sampled have trees which are protected (Table 5.12) and 96 percent of the farmers interviewed are interested in planting more trees, which corresponds well with the farmers’ response to practicing agroforestry. Only 7 farmers out of 160 are not interested in planting more trees, which is mainly due to land size and ownership issues.

53
Approximately 25% of the farmers interviewed are planning to cut down trees on their farm. Three farmers from mentioned cultural practices as a hindrance to tree planting.
Table 5.12. Tree species on-farm (N=161) Tree species No. farms with the species Cupressus lusitanica 104 Eucalyptus spp. 88 Grevillea robusta 42 Acacia spp. 40 Acacia mearnsii 21 Croton macrostachys 16 Tarchonanthus camphoratus 12 Avocado 7 Juniperus procera 7
The primary reasons for growing trees include producing fuel wood and to reduce the negative effects of wind (>80% for each). Other uses include fruit and timber production, fodder supplements, and medicinal products (>50% for each). Only 30% of the respondents reported growing trees on the farm for medicine and for cash income. Interestingly, 42 % of the farmers use trees to address soil fertility problems. With the rich diversity of uses and knowledge about trees in these communities, the Project should work with community leaders to expand awareness of opportunities offered by tree growing and the production of other tree products to enhance integration of trees into the farming system. Using farmers’ answers to rank the importance of agroforestry products the top 10 uses were:
1. Fuelwood
2. Wind breaks
3. Timber
4. Fruits
5. Fodder
6. Medicine
7. Food
8. Soil fertility
9. Soil conservation
10. Cash income
5.2.6 Household energy supply The main sources of fuel for the farming families in this block are wood and paraffin (Table 5.13). About 75% of the households are not energy self sufficient, which might explain the high number of farmers interested in more tree planting as mentioned above. As we noted in the previous section, the primary motivation for tree planting is the production of fuelwood and more than 95% of the interviewed farmers are interested in planting more trees.

54
Table 5.13. Fuel use by source Fuel source Percentage Wood 99.4 Paraffin 91.9 Charcoal 36.9 Crop residue 16.9 Solar 2.5
5.2.7 Trainings and group membership The majority of the farmers interviewed have not received any training. Only 33 of the 160 farmers interviewed had been trained, and half of those (16) were members of a group. Group adherence in this block is lower than in other blocks with only 41% of the farmers interviewed indicated that they adhere to a group. The block also has fewer groups than other blocks, which probably is a function of the lower population density. We encountered 51 groups during the survey. Table 5.14 lists a number of croups by cluster. Therefore, there is a good base upon which to build the training programme in the block for these groups.
Table 5.14. Examples of community groups in different clusters Group name Cluster Main activity Goshin women group 14 Livestock Tumoiyot water project 10 Water access Jagogor 12 Education assistance Tuyobei youth 10 Bee keeping Kimasian Cooperative Society 7 Coffee growing
Kiomo ge 5Environmental conservation and health hygiene
Tapfiga women 8 Farming Sajanlowan 15 Farming Kaplaba 3 Farming Kiomo Women 5 Fruit production
5.3 Market accessibility Market accessibility is generally good throughout the block, but a few areas in the south and eastern part of the block are relatively isolated from markets (Figure 5.4). In this block as well, the area has a reasonably good road network, so market oriented activities, like growing wood for timber or fuelwood may be feasible.

55
Figure 5.4 Market accessibility.
5.4 Synthesis and recommendations The terrain in the upper Nyando block is characterized by ridges and valleys with much steeply sloping land. Most of hill slopes and hill tops have been heavily deforested in the past and the vegetation has been replaced by crops. Currently, regeneration of montane shrubs and bushes in clusters are seen in specific areas especially on rocky hill tops and cliffs; and these areas are mainly used for grazing, charcoal production and for construction materials. Some of the flatter highland areas are under wheat. The areas under maize and the pasture areas are mainly found in the mid- and foot-slopes. These areas are the severely degraded and being cleared of any remaining natural vegetation. Farmers are encroaching into the hills for maize production because of the initial good yields. Kipkelion North and Barsiele sub-locations lie on very steep slopes with sparse vegetation cover. Jagoror and Kipsirichet sub-locations are located in an area with large ridges and valleys. There is a threat of land slides in Kimasian, Kisabo, Kimugul and Macheisok sub-locations. Segetet, Kalyet and Saramek sub-locations border Sorget Forestry Reserve. The residents of Segetet, Kalyet and Saramek sub-locations depend on the forest for their fuelwood, thus putting pressure on the forest resources.

56
Farmers living in these areas need to be sensitized and educated on the dangers associated with farming on the steep slopes and escarpments. The Project should work with communities to find alternatives. On areas that are to remain under farming, erosion needs to be controlled and soil fertility maintained. Landslides are also seen in some parts of the cluster as a result of reduced ground cover and unsustainable soil and water management practices. Hard pans have been exposed in some areas as a result of farming on these steep slopes. Farmers report that base-flow water levels in the streams have been reduced tremendously as a result of tree cutting. Soil and water conservation need to be expanded in the block and with the long, steep slopes, collective action will be needed. Thus, there will be a need for building stronger community institutions to deal with these problems. The management recommendations are much the same as they were for the Middle Nyando block:
• Increase the woody vegetation cover with special emphasis on indigenous trees;
• Soil and water conservation measures with special focus on best management practices on sloping land as well as control of rill and gully erosion;
• Soil fertility replenishment through plantation of leguminous trees and shrubs and improved FYM management;
• River bank protection and sediment reduction; and
• Group establishment and training in technical areas as well as in group dynamics.
In the Upper Nyando block three areas have been selected for interventions as indicated on the map below. The first area (Area 1) is located on the steep slopes in the central part of the block; the second area (Area 2) is located in the western part of the block in an area prone to landslides. The last are (Area3) is located in the northern part of the block, where the main activity is livestock rearing.
For Area 1, proposed activities include establishment of 2 nurseries: one in cluster 10 and one in cluster 14. Slope stabilization with large scale tree planting is recommended. The area is one of the more important source areas for Wauburgia ugandensis in the region and this can be an important resource for the Project. Thus, the Project should set up a seed collection and participatory selection programme with the communities in the area. Other aspects of soil conservation and rehabilitation of cropping and paddock lands should also be part of the programme. Finally, charcoal production is an important source of income this area. The Project should work with the communities to develop sustainable production practices based on the principles of allowable harvest, which in turn will be based on plantation rates.

57
In Area 2, 80% of the land is under intensive agricultural production mainly at the lower part of the slopes while about 20% is reserved for grazing. Livestock are mainly improved breed cows and goats and few dairy animals. The proposed activities in this area include planting of trees on the slopes for both soil and water conservation and on field edges as wind breaks. Many of the agricultural soils are degraded and are showing signs of erosion. The discrepancy between observations and farmer reports about conservation should be looked into in this region by the Project and soil conservation introduced or improved as necessary. River and stream bank protection with indigenous tree species to reduce sediment loads and improve water quality should also be considered. The Project should also look into the livestock fodder problem in this block. As population density is moderate, intensification of hay production and fodder trees could be introduced.
Area 3 has low population density and most of the land is under agricultural production, either maize cropping or pastures for grazing. Few rocky hills/sites are left without being cultivated. These areas provide fuelwood and grass for thatching and other construction purposes. The eastern part of the area has potential for hay growing and also scattered vegetable gardens – mainly of cabbage, onions and tomatoes in seasonal wet soils. Paddocks of pastures are also seen mainly close to homesteads for livestock, with natural grasses. The Project should look at the establishment of improved pastures, with wider use of high quality grasses like Rhodes grass. The western portion of this area is showing signs of severe erosion and soil degradation. As in Area 2, the discrepancy between observations and farmer reports about conservation should be looked into in this region by the Project and soil conservation introduced or improved as necessary.

58
Figure 5.5. Priority intervention areas in the block.
Throughout the block, the hill slopes are not managed well and activities which increase soil cover, especially the woody cover should be the focus in this area. The Project should explore with the population the possibilities of establishing set aside areas on the hills. In addition, terraces should be established to control runoff.
The activities and interventions proposed for the three areas mentioned above should not exclude any activities mentioned by the communities in the PAP’s. Hopefully, the recommended activities will support and supplement the activities prioritized by the communities.

59
6. Conclusion This baseline report presents the results of the data collected from the combination of field and household surveys in three blocks of the Western Kenya Integrated Ecosystem Management Project. Interpretation and management recommendations are based solely on the data and do not represent a consensus view between the Project and the participating communities. It is imperative that before initiating any activities in the respective blocks, more information be collected for the targeted area chosen for interventions. It should be noted that recommendations made within this report are not based on any dialog with communities. It is therefore vital for the Project to establish a dialog with the target communities and farmers. These communities and farmers need to be actively involved in the process of prioritizing activities. Thus the information contained within the report should provide support to the field officers of WKIEMP, but the ultimate decisions concerning priorities need to be made based upon consensus between the communities and the Project.