preliminary findings of the south africa power system
TRANSCRIPT

NREL is a national laboratory of the U.S. Department of Energy Office of Energy Efficiency & Renewable Energy Operated by the Alliance for Sustainable Energy, LLC
This report is available at no cost from the National Renewable Energy Laboratory (NREL) at www.nrel.gov/publications.
Contract No. DE-AC36-08GO28308
Preliminary Findings of the South Africa Power System Capacity Expansion and Operational Model Study Erol Chartan, Tim Reber, and Gregory Brinkman National Renewable Energy Laboratory
Presented at South African Wind Energy Association’s WindAc Africa Cape Town, South Africa November 14 – 15, 2017
Conference Paper NREL/CP-5D00-67852 January 2018

NOTICE
The submitted manuscript has been offered by an employee of the Alliance for Sustainable Energy, LLC (Alliance), a contractor of the US Government under Contract No. DE-AC36-08GO28308. Accordingly, the US Government and Alliance retain a nonexclusive royalty-free license to publish or reproduce the published form of this contribution, or allow others to do so, for US Government purposes.
This report was prepared as an account of work sponsored by an agency of the United States government. Neither the United States government nor any agency thereof, nor any of their employees, makes any warranty, express or implied, or assumes any legal liability or responsibility for the accuracy, completeness, or usefulness of any information, apparatus, product, or process disclosed, or represents that its use would not infringe privately owned rights. Reference herein to any specific commercial product, process, or service by trade name, trademark, manufacturer, or otherwise does not necessarily constitute or imply its endorsement, recommendation, or favoring by the United States government or any agency thereof. The views and opinions of authors expressed herein do not necessarily state or reflect those of the United States government or any agency thereof.
This report is available at no cost from the National Renewable Energy Laboratory (NREL) at www.nrel.gov/publications.
Available electronically at SciTech Connect http:/www.osti.gov/scitech
Available for a processing fee to U.S. Department of Energy and its contractors, in paper, from:
U.S. Department of Energy Office of Scientific and Technical Information P.O. Box 62 Oak Ridge, TN 37831-0062 OSTI http://www.osti.gov Phone: 865.576.8401 Fax: 865.576.5728 Email: [email protected]
Available for sale to the public, in paper, from:
U.S. Department of Commerce National Technical Information Service 5301 Shawnee Road Alexandria, VA 22312 NTIS http://www.ntis.gov Phone: 800.553.6847 or 703.605.6000 Fax: 703.605.6900 Email: [email protected]
Cover Photos by Dennis Schroeder: (left to right) NREL 26173, NREL 18302, NREL 19758, NREL 29642, NREL 19795.
NREL prints on paper that contains recycled content.

PRELIMINARY FINDINGS OF THE SOUTH AFRICA POWER SYSTEM CAPACITY EXPANSION AND OPERATIONAL MODEL STUDY
Erol Chartan1*, Tim Reber2, and Gregory Brinkman3 1* Research Engineer, National Renewable Energy Laboratory, 15013 Denver W Pkwy, Golden, Colorado, CO 80401 United States of America, +1 303 275 3000; [email protected] 2 National Renewable Energy Laboratory; [email protected] 3 National Renewable Energy Laboratory; [email protected]
Abstract
Wind and solar power contract prices have recently become cheaper than many conventional new-build
alternatives in South Africa, and trends suggest a continued increase in the share of variable renewable
energy (vRE) on South Africa’s power system with coal technology seeing the greatest reduction in
capacity. Consequently it is essential to perform a state-of-the-art grid integration study examining the
effects of potential high penetrations of vRE on South Africa’s power system. Under the 21st Century
Power Partnership (21CPP), funded by the U.S. Department of Energy, the National Renewable Energy
Laboratory (NREL) has created a detailed model of the South African power system to investigate least-
cost options for continued vRE expansion. To achieve this, NREL developed, tested, and ran a
combined capacity expansion and operational model of the South African power system including
spatially disaggregated detail and geographical representation of system resources. New software to
visualize and interpret modelling outputs has been developed, and scenario analysis of stepwise vRE
build targets provides new insight into associated planning and operational impacts and costs.
The model, built using PLEXOS®, is split into two components: a capacity expansion model and a unit
commitment with economic dispatch model. The capacity expansion model optimizes new generation
decisions to achieve the lowest cost, with a full understanding of capital cost and an approximated
understanding of operational cost. The operational model has a greater set of detailed operational
constraints and is run at daily resolutions. Both are run from 2017 through 2050. This investigation
suggests that running both models in tandem may be the most effective means to plan the least-cost
South African power system, as build plans seen to be more expensive than optimal by the capacity
expansion model can actually produce greater operational cost savings that are seen only in the
operational model.
Keywords
Grid, integration, South Africa, planning, renewable.
1This report is available at no cost from the National Renewable Energy Laboratory at www.nrel.gov/publications.

Highlights
Tandem planning and operational model methodology yields more cost-effective build plans.
Long-term planning cost analysis for different variable renewable energy integration scenarios.
Visualization tool development to better understand results.
Operational model to justify and test build plans.
A novel spatially disaggregated model of the South African grid.
2This report is available at no cost from the National Renewable Energy Laboratory at www.nrel.gov/publications.

1. Introduction
With the costs of variable wind and solar continuing to decline and becoming increasingly competitive with thermal resources such as coal, the South African grid is expected to transition to higher penetrations of variable renewable energy, (vRE) over the coming years [1, 2]. Since 2016, NREL has worked to develop and explore a multi-nodal model to investigate the effect of adding wind and solar resources that vary based on geographic locations and the effect of adding transmission with transfer limits. This paper presents methods and preliminary results based on this newly developed model and incorporating data extracted from the published Draft Integrated Resource Plan (IRP) 2016. The model simulates the South African power system as it is designed and operated today, including current plans for transmission and generation, current forecasts, and operating requirements. Scenario analysis reveals capital expenditure (CAPEX) and operating expenditure (OPEX) trends when investigating a range of scenarios for different levels of variable renewable generation that could be built by 2035. Throughout this paper, “vRE” refers to wind power, solar power (PV), and concentrated solar power (CSP) with storage.
2. Model details
2.1 Spatial disaggregation
The model was first split into 27 distinct regions as shown in Figure 1. The regions do not represent political but rather theoretical operational system boundaries.
Figure 1: Modelled regions of South Africa with detail of existing transmission in 2017
The transmission lines in the model as of 2017 can be seen in Figure 1 and are currently aggregated within each region for run-time benefits. Transfer limits have been incorporated as operational limits to which the system is run, which reflect Eskom’s National Load Dispatch Centre’s practices rather than
3This report is available at no cost from the National Renewable Energy Laboratory at www.nrel.gov/publications.

technical limits. This is to ensure the results reflect stable system operation as PLEXOS® does not consider certain details such as voltage and frequency requirements. Lines that are identical between regions and thus have no mathematical difference in the model were aggregated in order to save model run-time without the loss of fidelity. South Africa’s intended transmission plan out to 2020 [3] is also included. The model has the ability to optimize the build plan and operate the system while taking into account these transfer limits. However, given that the model cannot yet optimize for new transmission builds and retirements to accommodate increased demand beyond 2020, the transmission plan is held static beyond 2020. In addition, given South Africa’s expected increase in load beyond 2020, the static transmission system soon becomes overly congested in the model. Therefore, the findings in this initial study were developed with these transfer limits deactivated.
Each region has an annual hourly wind and solar profile that approximates the wind and solar availability in that region for each year based on historic data. A subset of regions for which gas and coal generation types can be built was created using data from EPRI based on the location of existing gas ports and coal mining resources. The model aggregates the transmission within each region defined in Figure 1. With appropriate data and model development, transmission detail could offer significant potential versus a single node model as generation and transmission expansion could, in theory, be co-optimized to create a more holistic expansion plan. Note that distributed generation (e.g., rooftop PV) and demand-side management scenarios are not input into the model currently; both could affect the ability of the system to incorporate utility-scale vRE while maintaining system stability [4].
A load forecast from 2014 to 2050 published by the Council for Scientific and Industrial Research (CSIR) [5] was disaggregated into the 27 regions. Imports and exports between South Africa and neighbouring countries were factored into the load forecasts of the regions to which they interconnect. This offers significant run-time savings relative to an explicit simulation of neighbouring country imports and exports.
Several additional minor details were updated, such as build cost estimates for individual generators according to a 2015 report published by the Electric Power Research Institute (EPRI) for the South African Department of Energy [6].
2.2 Generation planning
The capacity expansion model optimizes the planning solution to achieve the lowest net present value (NPV) power system for any number of pre-defined inputs or model constraints in each given scenario and runs from 2017 to 2050 in one time step.1 This optimization is comprised of both the costs to build new generation (plant retirement is at no cost) as well as an approximated cost of operating those generators, either until the end of the generator lifetime or until the end of the planning horizon (i.e., 2050). The approximation of operational costs includes an estimation of fixed operational and maintenance costs, short-run marginal costs, and the cost of unserved energy. However, in order to achieve the greatest prediction of operational costs, the operational model must be run. Running an operational model for the time horizons examined in this paper has proven to be an extremely intensive computational process, and creating CAPEX and OPEX estimations for multiple vRE scenarios requires a large number of computing cores in order to achieve reasonable model run times. However, running
1 The model has a perfect foresight over this time period, though of course forecast data such as load and wind and solar resource are subject to errors.
4This report is available at no cost from the National Renewable Energy Laboratory at www.nrel.gov/publications.

the model was made possible by the capability of NREL’s high performance supercomputer, Peregrine.2 Running combined capacity expansion and operational models for each expansion plan reveals the degree to which the capacity expansion model has only approximated projected operational costs.
The required lead-time to build new generation is taken from EPRI [6] and considered in the model. This ensures the model cannot decide to build unrealistically fast at the beginning of the simulation, so the first several years (through ~2025) do not show significant build increases. Solar and wind units that can be built within the model have a physical lifetime of between 20–25 years depending on the technology type which, once exhausted, results in their retirement.
2.3 Model settings
Typically, capacity expansion models contain less operational detail than operational models due to their greater time horizons and the demand on computer power this poses. For the tandem capacity expansion and operational model setup employed here, the capacity expansion model makes generation expansion decisions which are then passed to the operational model to minimize the total operational cost given these future configurations.
The capacity expansion model examines detailed load profiles and selects 9 days each year that best represent the spread of load. Each year’s capacity expansion decisions are then based off model inputs, e.g., wind and solar profiles, from just these corresponding 9 days. It is important to note that the model’s ideal representation of load does not necessarily match with the days that best represent the spread of wind and solar forecast profiles; a higher number of sampled days is desired to capture the variability of wind and solar capacity factors. When running for 34 years, the number of samples is 9 x 34 = 306. This maximized the capability of NREL’s supercomputer, Peregrine, to capture variability of renewable energy. Other model settings were based on recommendations from in-depth investigations carried out and reported by Eskom in 2016 [7]. More detail can be found in that report.
The operational model initially runs with yearly steps to capture intertemporal constraints such as monthly hydropower limits. These constraints are decomposed and apportioned to daily intervals and the model runs again in daily steps to choose the least-cost unit commitment and economic dispatch while respecting constraints such as heat rates, minimum stable levels, minimum up and down times, and more. Each single-day step apportions results such as generator dispatch to an hourly level.
The model has a substantial financial punishment for curtailment that avoids overvaluing vRE. It does this by simulating the institutional requirement of having to pay for vRE generated regardless of whether or not those units are curtailed. This "punishment" was required to ensure vRE units were not unrealistically curtailed at any hour with zero cost and therefore being overvalued. The financial punishment for curtailment means that the model tries to plan the system so that the majority of vRE can be utilized as this saves costs; if the vRE does curtail, it is because it either had no other feasible choice or the alternative options, e.g., pumping hydro, were more expensive.
2 More information on the Peregrine high performance computer is available here: https://hpc.nrel.gov/users/systems/peregrine
5This report is available at no cost from the National Renewable Energy Laboratory at www.nrel.gov/publications.

3. Scenario analysis and visualization
3.1 Description of scenarios
A set of scenarios was established to evaluate stepwise variable renewable energy targets in 10 GW increments by the year 2035. Running the model from 2017-2050 then allowed investigation of the effects and costs of various vRE penetrations both leading up to and for several years after the target year. In each case, the total capital or operational cost has been divided into an average annual cost over the entire period. Generation units in the model that are known now to be built at a future date and hence cannot be optimized are exempt from the build cost presented in this analysis.
3.2 Penetration of vRE on the system
The sum of existing vRE and vRE already planned to be built within South Africa that we expect still to be operational by 2035 is above 6 GW. The vRE build targets are formulated as 10 GW increments of additional vRE capacity which the model must build by the end of 2035.
Figure 2: Proportion of total energy served by vRE in 2035. Note that these results assume no significant changes in how the South African power system is designed and operated (e.g., no
changes to existing thermal reserve requirements, demand-side management, distributed generation, etc.).
As seen in Figure 2, as vRE capacity increases, the proportion of total annual generation met by vRE increases approximately linearly until almost 70 GW of vRE capacity exists. At this point, vRE becomes less effective at serving load as a result of the system’s requirement to keep thermal generation running at minimum mandated levels for system stability. This non-variable generation requirement is based on a subset of thermal generation including coal and nuclear units that are forced to run at least at their minimum stable level. At 100 GW of vRE capacity, approximately 60% of total annual energy is served by vRE, and further increasing the capacity of vRE does not result in significantly more vRE contributing to energy. Approximately all energy beyond this amount is curtailed under the assumed conditions, explaining why we have shown results only to that level.
6This report is available at no cost from the National Renewable Energy Laboratory at www.nrel.gov/publications.

Further investigation suggests that decreasing the non-variable generation requirement could in fact result in scenarios in which vRE supplies more than 60% of total annual energy. Additional capability to enhance system security such as storage and demand response would be expected to further increase this proportion. Adding these capabilities to the model will be an important consideration for future work. It should also be noted that while PLEXOS® is able to manage the quantity of energy required to meet demand, it has no consideration for certain details such as voltage requirements, frequency requirements, and similar factors that can govern system reliability. For the current South Africa system, these physical constraints could, in theory, reduce the annual penetration of renewables. Under the current system constraints, as shown in Figure 1, at just over 100 GW of vRE capacity in 2035 there are 435 hours out of the 8760 in 2035 when vRE contributes to 100% of demand as has occurred in several other contexts around the world. These results suggest that the instantaneous penetration of renewables could, in theory, reach 100%, though additional studies examining dynamic stability would be required to verify this.
3.3 Capital expenditure, CAPEX, and operational expenditure, OPEX, cost curves
CAPEX values were taken from the capacity expansion model and represent the average annual build cost for each generation expansion plan from 2017–2048. The costs in the last 2 years of the simulation were omitted due to modelling reasons. CAPEX remains fairly flat until about 70 GW of total vRE capacity as the addition of vRE generators is mitigating requirements for building thermal generators. Continuing to meet increasingly higher capacities of vRE results in the average build cost increasing because additional vRE capacity no longer offsets the same quantity of thermal generation as a lower limit of non-variable generation required is met, consistent with the increase in curtailment mentioned above. It should be noted that surplus vRE capacity through the simulation horizon could ultimately mitigate some requirement for new vRE builds after 2050.
Figure 3: CAPEX and OPEX for the vRE scenarios explored for South Africa’s power system
The OPEX values were taken from the operational model that reads the build profile created from the capacity expansion model and runs a real-time daily representation of the South African grid. These results represent the average annual total generation cost of all generation for each year from 2017–2048. The OPEX curve continues to drop because there is more fuel cost savings with each additional increment of vRE available on the system.
0
20
40
60
80
100
120
16 26 36 46 56 66 76 86 96 106 116 126 136 146 156 166 176 186 196
Ran
d (b
n)
Total vRE Capacity by 2035, GW
Cost Curves for 2017 - 2048
Average Annual CAPEX Average Annual OPEX
7This report is available at no cost from the National Renewable Energy Laboratory at www.nrel.gov/publications.

It is important to take into account, however, that although the operational model optimizes daily operation considering the cost of curtailment as a constraint, this cost is not included in Figures 3 and 4 because it is arbitrary. Contractual payments to vRE generators for curtailed energy would begin to increase the OPEX at a total of 70 GW or more of vRE capacity by 2035 due to increases in curtailment. Figure 2 and Figure 4 together suggest that, assuming no changes to how the South African power system is designed and operated between now and 2035, the system could cost-effectively incorporate 60-100 GW of additional vRE. It should also be noted that any vRE capacity built to last beyond 2048 will continue to provide OPEX benefits beyond the values analysed here.
3.4 Total expenditure, TOTEX
Combining average annual CAPEX from the capacity expansion model and annual average OPEX from the operational model provides a more accurate picture of the average annual total expenditure, or TOTEX. The optimal3 point that minimizes this combined measure of annualized CAPEX and OPEX costs occurs around 96 GW of total vRE capacity by 2035. This falls very close to the vRE capacity at which the portion of total energy served by vRE begins to level out as depicted in Figure 2. Figure 3 shows cost saving benefits for vRE penetrations in excess of 100 GW by 2035 and it is expected that excess vRE capacity will ultimately become valuable given that the load is forecasted to continue growing. That is, building more vRE capacity than would be optimal for the simulated horizon could result in additional CAPEX and OPEX costs being saved beyond 2048.
Figure 4: TOTEX for the vRE scenarios explored for South Africa’s power system
Sensitivity scenarios were also evaluated to investigate the optimized solution with zero cost of curtailment. Under this assumption, results indicated an optimum vRE capacity by 2035 of 110 GW, which is 20 GW more than the “base case” optimum. This suggests that if curtailment was fully available and free, as opposed to having a cost associated with it, more vRE capacity could save even more on total lifetime cost for the South African system.
3.5 The Effect of modelling transmission
In order to investigate the effects of transmission, the solution of 36 GW of vRE capacity by 2035 was re-evaluated in the capacity expansion and operational model with thermal operational constraints on 3 Subject to input assumptions and particularly sensitive to cost values such as build and fuel cost
155
160
165
170
175
180
185
16 26 36 46 56 66 76 86 96 106 116 126 136 146 156 166 176 186 196
Ran
d (b
n)
Total vRE Capacity by 2035, GW
TOTEX (CAPEX + OPEX) Average Annual Cost for 2017 -2048
8This report is available at no cost from the National Renewable Energy Laboratory at www.nrel.gov/publications.
the existing and planned transmission system. A relatively low vRE scenario was selected for this sensitivity analysis because the transmission development plan ends in 2020; load growth is forecasted to 2040 so it was expected that the results would show instances in which demand was not met and other instances in which much greater curtailment occurs. With no transmission constraints enforced, the solar and wind energy available are always able to serve load anywhere within the country. This larger effective balancing area results in less net variability due to spatial smoothing across the wind and solar generators. However, when transmission becomes congested and individual regions therefore rely progressively more on their local ability to match load with generation, they experience greater variability, resulting in more curtailment (under the modelling assumptions described above).
3.6 Visualization of outputs
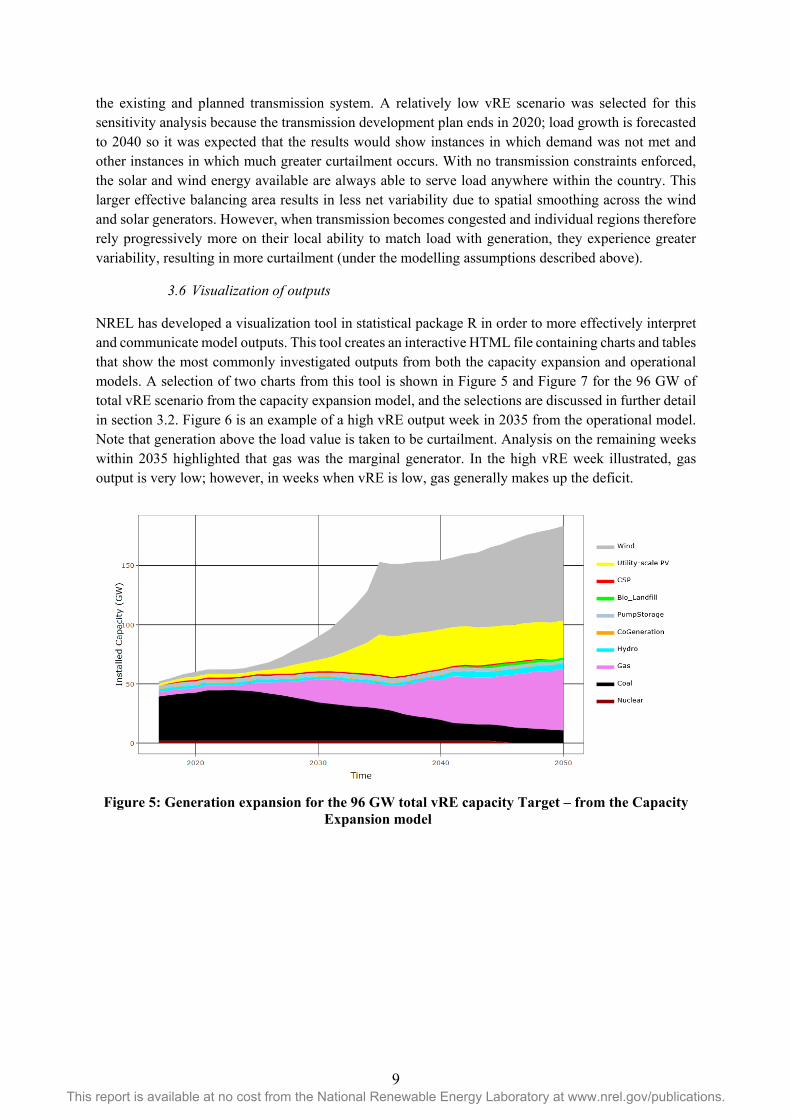
NREL has developed a visualization tool in statistical package R in order to more effectively interpret and communicate model outputs. This tool creates an interactive HTML file containing charts and tables that show the most commonly investigated outputs from both the capacity expansion and operational models. A selection of two charts from this tool is shown in Figure 5 and Figure 7 for the 96 GW of total vRE scenario from the capacity expansion model, and the selections are discussed in further detail in section 3.2. Figure 6 is an example of a high vRE output week in 2035 from the operational model. Note that generation above the load value is taken to be curtailment. Analysis on the remaining weeks within 2035 highlighted that gas was the marginal generator. In the high vRE week illustrated, gas output is very low; however, in weeks when vRE is low, gas generally makes up the deficit.
Figure 5: Generation expansion for the 96 GW total vRE capacity Target – from the Capacity Expansion model
9This report is available at no cost from the National Renewable Energy Laboratory at www.nrel.gov/publications.
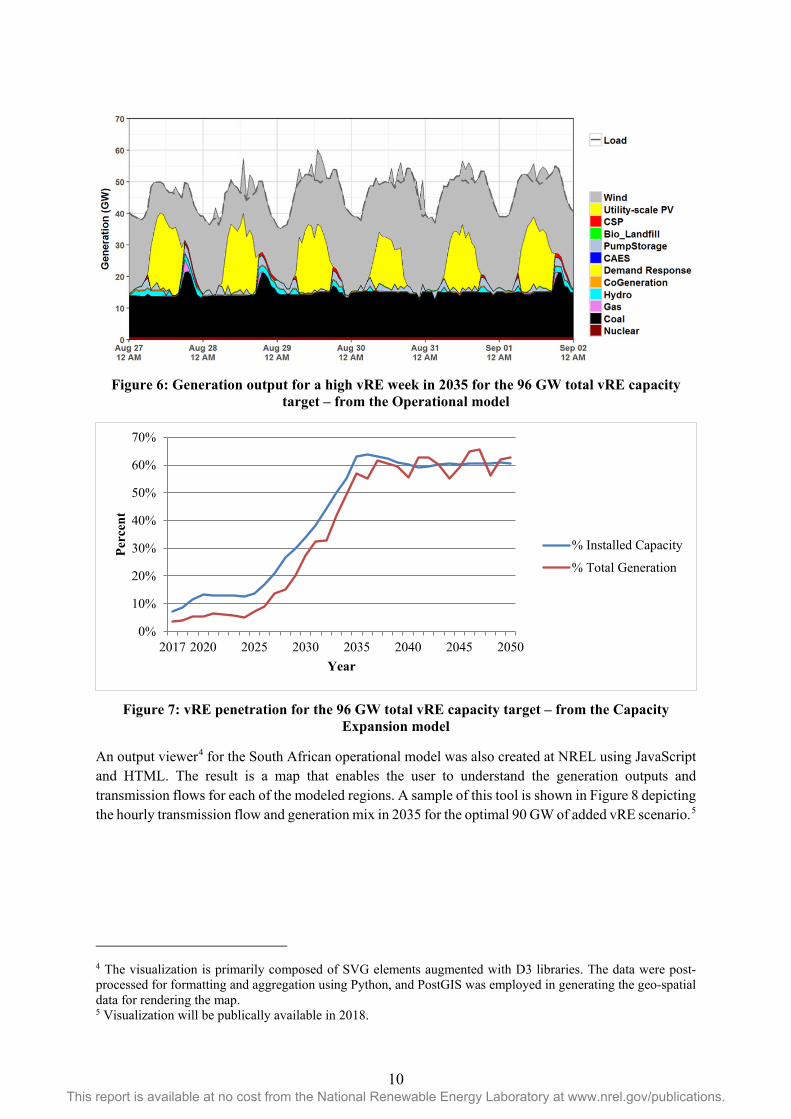
Figure 6: Generation output for a high vRE week in 2035 for the 96 GW total vRE capacity
target – from the Operational model
Figure 7: vRE penetration for the 96 GW total vRE capacity target – from the Capacity Expansion model
An output viewer4 for the South African operational model was also created at NREL using JavaScript and HTML. The result is a map that enables the user to understand the generation outputs and transmission flows for each of the modeled regions. A sample of this tool is shown in Figure 8 depicting the hourly transmission flow and generation mix in 2035 for the optimal 90 GW of added vRE scenario.5
4 The visualization is primarily composed of SVG elements augmented with D3 libraries. The data were post-processed for formatting and aggregation using Python, and PostGIS was employed in generating the geo-spatial data for rendering the map. 5 Visualization will be publically available in 2018.
0%
10%
20%
30%
40%
50%
60%
70%
2017 2020 2025 2030 2035 2040 2045 2050
Perc
ent
Year
% Installed Capacity
% Total Generation
10This report is available at no cost from the National Renewable Energy Laboratory at www.nrel.gov/publications.

Figure 8: Output viewer for the Operational model
3.7 Results for the 90 GW of added vRE built by 2035
Figure 5 shows the annual build plan that is considered optimal when summing CAPEX from the planning model and OPEX from the operational model. There is a sharp increase in overall builds in the years leading up to 2035 in order to meet the target for vRE capacity by 2035. The analysis also indicates that, due to forecasted increases in demand, the later generation is built, the more time that generation will be able to benefit the system at a higher demand with a reduced chance of curtailment, allowing for a more effective utilization of the vRE. In reality, yearly build limits may restrict the annual build quantity currently seen in the results, particularly in 2034. If this were to be the case, this suggests that the optimal expansion plans per vRE target could involve building vRE earlier in order to reach targets before 2035. Additionally, because the analysis has revealed that the capacity expansion model underestimates the OPEX savings of vRE, the values of which are revealed by the operational model, the vRE build is reduced. Thus, if the capacity model had foreseen this detail of OPEX benefits from vRE, the results would likely have built more vRE earlier.
As seen in Figure 5, the vRE target is met mostly by wind capacity as it contributes to the greatest reduction of TOTEX given the various regions from which the model can choose the strongest wind resources. Solar PV also contributes to a significant reduction in TOTEX though slightly less than wind.
The modelling of CSP involved profiles that were input to characterize the seasonal sun availability with a representative number of zero-sun days per month randomly distributed, for different storage quantities. It was then assumed that the heat storages have a perfect efficiency, meaning that they do not lose heat over time. This is a reasonable approximation due to the average thermal loss of a tank per day being typically below 1%. This storage capability allows CSP to better utilize variable solar energy; however, it does not create enough of a benefit to compete with the greater TOTEX savings of utility-scale PV. As a result, analysis reveals that the optimal build mix does not include any more CSP than the 950 MW capacity already planned to be built by 2035, which is what can be seen in Figure 5.
The thermal fleet’s total capacity remains fairly constant over the horizon with gas generation progressively replacing the coal fleet as it is retired. As a result of running daily steps, the model sees no difference in ramp rates between coal and gas given that both technologies can typically ramp their entire output range within a single day. With the given capital and fuel costs assumptions from EPRI [6], gas6 replaces coal given that gas contributes to a greater reduction in TOTEX.
The unconstrained least-cost capacity expansion with horizon from 2017–2048 undervalues the OPEX savings of vRE without daily representation and the higher detail of operational constraints the
6Mostly builds Open Cycle Gas Turbines (OCGT) as opposed to Combined Cycle Gas Turbines (CCGT). This is likely due to OCGTs having lower operational and maintenance costs.
11This report is available at no cost from the National Renewable Energy Laboratory at www.nrel.gov/publications.

operational model sees. Thus, careful examination of both OPEX and CAPEX are required to make more accurate assessments of TOTEX to inform planning decisions. As discussed, this is likely because the capacity expansion model does not see the full operational detail that the operational model sees and, therefore, does not see the true OPEX benefit. If a similar experiment were carried with different targets for gas and coal, a more optimal output may also be discovered.
Figure 7 shows how the vRE contribution to capacity and generation changes over the course of the horizon. As shown in Figure 5, the total thermal generation capacity stays fairly constant in comparison to the vRE. Figure 7 illustrates that once the vRE capacity reaches its optimum in 2035, the vRE generation year-on-year varies according to resource availability, and the number of thermal units contributing to the non-variable generation requirement that experience a planned or unplanned outage that year. After 2035, there are a few years where the percentage of generation met by vRE is greater than the percentage of capacity. This is due to a significant portion of the thermal fleet not running. The thermal fleet that does run often does so only as a result of the non-variable generation requirement constraint, resulting in the fleet running with maximum headroom and, thus, a lower percentage of the thermal capacity available is utilized.
4. Future work
4.1 Co-optimization of generation and transmission
Given the significant sensitivity of generation-to-transmission congestion, the highest priority moving forward will be to develop capabilities to co-optimize new generation and transmission expansion together. Other capacity expansion least-cost optimization models built by NREL already incorporate this capability and allow deeper evaluation of trade-offs between transmission build outs, local generation, flexible resources, storage, etc. [8]. Such capability can, for example, provide significant insight to grid planners regarding priority areas for transmission expansion because it accounts for costs associated with making transmission improvements in areas of high vRE potential [9]. The improvement requires accurate information on the build and retirement costs for transmission lines.
4.2 Stability and load flow analysis
Linking production cost with software that is able to look further into system stability issues would further enhance the robustness of results [10]. A transmission analysis with Power System Simulator for Engineering (PSSE) or Positive Sequence Load Flow software (PSLF), for example, could be performed using PLEXOS® outputs in order to determine constraints required to maintain stability that can then be input back into PLEXOS® to achieve a fully reflective system cost. This iterative process could develop confidence in the build decisions that PLEXOS® makes.
4.3 Enhanced wind and solar resource data
NREL is working with the CSIR to develop detailed wind and solar profiles and supply curves specific to each region in South Africa. This effort includes analysis of the available resource profile, consideration of exclusions that prevent building such as mountains and urban areas, and calculating region-specific LCOEs based on different technology types and resource profiles. Ultimately the analysis will result in region-specific supply curves that can be incorporated into the model to more accurately represent the costs and availability of vRE in each region.
12This report is available at no cost from the National Renewable Energy Laboratory at www.nrel.gov/publications.

4.4 Additional system detail
Power system-related forecasts and predictions (e.g., load, resource availability, costs, etc.) are constantly changing and evolving. Keeping this or any model up-to-date with the best available data maintains robustness of the results relative to the existing system. Furthermore, enhancing functionality to account for additional components that can provide advanced reserve and grid services to reflect the probable future of a system with high vRE penetrations would offer great insight into how the system may develop. Future power system scenarios involving battery storage, demand response, and rooftop PV, for example, could all have a significant impact on results.
Acknowledgements
The authors would like to thank the CSIR for their support and partnership throughout this endeavour, including Jarrad Wright, Greg Landwehr, and Joanne Calitz. We also thank the 21st Century Power Partnership, as well as Jeffrey Logan, Doug Arent, Owen Zinaman, Carlo Brancucci Martinez-Anido, and Gregory Brinkman from NREL. Finally, several other members of the South African power sector and energy community played an important role in developing this study and we are grateful for all of their support and guidance.
References
1. "Integrated Resource Plan Update: Assumptions, Base Case Results and Observations," South African Government Gazette No. 40445, 25 November 2016. http://www.gpwonline.co.za/Gazettes/Gazettes/40445_25-11_NationalGovernment.pdf
2. Bischof-Niemz, T. Wind resource in South Africa: On par with solar, Presentation at the WindAcAfrica conference, 2016. [See slide 6 and 7.] http://windac-africa.com/wp-content/uploads/2017/05/1.-Tobias-Bischof-Niemz.pdf.
3. Eskom. Transmission development plan, 2016 – 2015. [Figure 3.1.] http://www.eskom.co.za/Whatweredoing/TransmissionDevelopmentPlan/Documents/TransDevPlan2016-2025Brochure.pdf)
4. Assessing the impact of increasing shares of variable generation on system operations in South Africa: Flexibility study, 2017. Deutsche Gesellschaft fur Internationale Zudammenarbeit (GIZ) Gmbh. [See 1.2.4 Scenarios.] http://www.ee.co.za/article/engineering-study-dispels-myths-limits-renewable-energy-south-african-grid.html#.WcLa0EFMGEd
5. Council for Scientific and Industrial Research. Forecasts for electricity demand in South Africa (2014 – 2050) using the CSIR sectoral regression model. [See Figure 8.] http://www.energy.gov.za/IRP/2016/IRP-AnnexureB-Demand-forecasts-report.pdf
6. South African Government. Power Generation Technology Data for Integrated Resource Plan of South Africa, technical update, 2015. Prepared for the Government of South Africa by the Electric Power Research Institute. [See Chapter 10.] ]http://www.energy.gov.za/IRP/2016/IRP-AnnexureA-EPRI-Report-Power-Generation-Technology-Data-for-IRP-of-SA.pdf
7. Rambau, P. and Mdhluli, S. (Eskom). 21st Century Power Partnership: September 2016 Fellowship Report, 2017. National Renewable Energy Laboratory, Golden, CO. NREL/TP-6A50-69085. https://www.nrel.gov/docs/fy17osti/69085.pdf
13This report is available at no cost from the National Renewable Energy Laboratory at www.nrel.gov/publications.

8. Sullivan, P., Cole, W., Blair, N, et al.2015 Standard Scenarios Annual Report: U.S. Electric Sector Scenario Exploration report, 2015. National Renewable Energy Laboratory, Golden, CO NREL/TP-6A20-64072. https://www.nrel.gov/docs/fy15osti/64072.pdf
9. Lee, N., Flores-Espino, F., Hurlbut, D. Renewable Energy Zone (REZ) Transmission Planning Process: A Guidebook for Practitioners, guidebook, 2017. National Renewable Energy Laboratory and United States Agency for International Development, Golden, CO. NREL/TP-7A40-69043 https://www.nrel.gov/docs/fy17osti/69043.pdf
10. Miller, N.W., Shao, M., Pajic, S., and D'Aquila, R. Western Wind and Solar Integration Study Phase 3 – Frequency Response and Transient Stability, report, 2014. National Renewable Energy Laboratory, Golden, CO. NREL/SR-5D00-62906. https://www.nrel.gov/docs/fy15osti/62906.pdf
14This report is available at no cost from the National Renewable Energy Laboratory at www.nrel.gov/publications.