preliminary financial statements - saha · san antonio housing authority 818 s. flores st. san...
TRANSCRIPT

SAN ANTO NIO HO USI NG AUT HO RITY
818 S. Flores St. San Antonio, TX 78204
Phone:
(210) 477-6262 Fax:
(210) 477-6062
We’re on the Web! See us at:
www.saha.org
Ed Hinojosa Chief Financial Officer Diana K. Fiedler Director of Finance and Accounting Linda Le Financial Reporting Manager Jennifer Mireles Budget Manager
PRELIMINARY FINANCIAL STATEMENTS
Issue Date: June 7, 2018
San Antonio Housing Authority
1. Summarized Combined Income Statement – Current Month
2. Summarized Combined Income Statement – Year-To-Date
3. Summarized Combined Balance Sheet
4. Summarized Income Statement by Business Unit – Administrative Services
5. Property Management Income Statements
a. Summarized Income Statement by Line of Business – Public Housing
i. Group A
ii. Group B
iii. Group C
b. Summarized Income Statement by Line of Business – Beacon Communities
i. SAHA Managed
ii. Third Party Managed
For the Month and Year-To-Date Ended May 31, 2018 (Unaudited and Subject to Review)
1. Property Management Income Statements a. Summarized Income Statement by Company – Partnerships
2. Summarized Non-Consolidating Balance Sheet
1. Summarized Combined Income Statement – Year-To-Date 2. Summarized Combined Balance Sheet
Managed Not Owned
Partnerships
SAHA Combined

Combined Income Statement - Current Month
Period Ending May 31, 2018
Actual Amounts Vs. Approved Budget Comparison Page 1 of 2
GlJdeIncomeStatementByResponsibility
6/7/2018 11:35:40PM
San Antonio Housing Authority
rp_GlJdeIncomeStatementByResponsibility
Section 8 Beacon Real Estate Central Office Community Initiatives Capital Funds Elim Company Combined TotalSubotalPublic Housing
Actual Budget Actual Budget Actual Budget Actual Budget Actual Budget Actual Budget Actual Budget Actual Budget Actual BudgetAccount Description Actual Budget
Revenue
Rental Revenue 877,547 925,245 1,579,098 1,659,577 217 2,456,645 2,585,039 2,456,645 2,585,039
Bad Debt, Net of Collections (44,274) 15,769 (24,545) (28,006) (68,819) (12,236) (68,819) (12,236)
Other Tenant Revenue 25,130 49,244 60,983 50,895 86,113 100,138 86,113 100,138
Grants 2,085,377 1,642,194 1,183,911 711,285 225,731 232,371 803,184 1,183,216 (7,148) (10,675) 3,607,618 2,749,916 4,403,654 3,922,456 112,599 164,066
HAP Revenue 9,299,520 7,699,040 9,299,520 7,699,040 9,299,520 7,699,040
Miscellaneous Revenue 30,957 18,025 1,764 2,000 17,390 26,402 85,899 152,009 75,890 93,499 (70,145) (86,509) 243,082 338,099 172,937 251,591 31,181 46,164
2,974,737 2,650,478 10,485,195 8,412,325 1,858,658 1,941,239 85,899 152,226 75,890 93,499 803,184 1,183,216 (77,294) (97,184) 15,624,159 13,459,996 16,350,050 14,546,028 Net Revenue 143,780 210,230
Operating Expense
Salaries and Benefits 865,394 875,487 395,204 413,775 393,634 488,005 56,287 54,197 741,926 755,000 26,544 57,233 2,671,710 2,822,543 2,698,255 2,879,776 219,265 236,078
Supplies and Materials 246,892 121,416 106,685 62,043 5 4,221 2,766 410 358,539 186,230 358,949 186,230 740
Fleet Costs 18,475 10,961 1,541 2,917 2,575 2,090 112 1,101 2,111 3,240 25,025 20,383 25,025 20,383 210 75
Outside Services 630,568 385,688 225 500 240,890 217,733 7,805 13,541 22,544 15,839 6,052 902,032 633,300 908,084 633,300
Utilities 333,062 380,974 168,365 167,803 358 620 17,968 15,804 519,753 565,200 519,753 565,200
Protective Services 19,388 35,883 179 23,676 17,194 (137) 206 9,537 17,852 53,561 71,724 53,561 71,724 1,098 408
Insurance 248,560 122,903 18,641 18,395 26,033 95,276 974 5,441 753 15,828 121 295,220 263,518 295,220 263,640 259 5,675
HAP Expense 7,887,442 7,699,040 735 7,887,442 7,699,775 7,887,442 7,699,775
Other Expenses 134,981 196,708 60,894 130,903 90,199 88,136 30,059 65,998 72,486 150,219 191,512 335,972 (67,164) (82,659) 429,088 719,442 553,437 972,755 40,469 87,478
2,497,319 2,130,020 8,363,947 8,265,709 1,052,058 1,139,016 95,460 141,110 871,546 976,547 224,518 393,326 (67,164) (82,659) 13,142,372 12,982,116 13,299,726 13,292,783 Total Operating Expense 262,041 329,714
Total Operating Income 477,418 520,457 2,121,248 146,616 806,600 (9,561) 11,116 (795,656) 578,666 789,890 (14,525) 2,481,787 3,050,323 1,253,245 (118,261) (119,483)(883,048) 802,223 (10,130) 477,881
Non-Operating Income (Expense)
Interest Expense (3,280) (168,591) (144,890) (1,489) (56,885) (59,137) 17,376 7,593 (173,360) (144,890) (212,869) (196,434)
Interest Income 95,506 35,111 1,115 19 44,272 15,351 80,008 77,040 10,306 14 1,541 70 (17,376) (7,593) 231,331 127,542 215,496 120,019 125 7
Replacement/Extraordinary Item (24,243) (49,614) (93,408) (123,760) (208) (582) (83) (118,233) (173,665) (118,233) (173,665)
Other Income (Expense) (303,216) (115,359) 76,156 615 (2,995) 563 7,148 10,675 (238,097) (114,797) (230,948) (104,121)(8,657)
Management Fees (388,311) (407,906) (266,399) (261,115) (130,531) (147,511) (258) (1,590) 778,795 793,723 (29,664) (29,053) 2,981 3,850 (7,666) (24,965) (34,349) (50,169)(961) (567)
Transfers (18,932) 17,931 (500,000) 500,000 (17,177) 7,152 (29,053)(7,152) 11,877 0 (17,177) 11,781 11,122
(642,476) (519,836) (265,284) (261,096) (772,102) (400,809) 578,876 58,065 785,523 794,217 (77,857) (117,174) 10,130 14,525 (313,175) (318,898) (380,903) (421,547)Total Non-Operating Income (Expense) 2,288 10,562
Surplus or Deficit Prior to Non-Cash Items (165,058) 621 1,855,964 (114,480) 34,498 569,315 69,181 (10,133) 500,809 672,716 2,168,612 2,669,421 831,699 (115,973) (108,922)(88,832) 401,414 158,982
Non-Cash Items
Depreciation & Amortization (978,187) (884,182) (2,950) (2,950) (220,655) (206,789) (1,112) (1,128) (10,893) (6,409) (1,214,064) (1,101,725) (1,214,064) (1,101,725)(268) (268)
Non-Oper Income (Expense) 780,100 633,991 (21,133) (381) (166) 5,271 21,133 (3,165,394) (822,298) 779,934 638,881 (2,385,461) (183,417)
(198,088) (250,190) (24,082) (2,950) (220,655) (207,170) (1,278) 4,143 10,240 (6,409) (3,165,394) (822,298)(434,130) (462,843) (3,599,525) (1,285,142)Total Non-Cash Items (268) (268)
Change In Net Assets (363,146) (249,569) 1,831,882 (117,430) (186,158) 568,037 73,324 107 (2,664,586) (149,582) 1,734,482 (930,104) (453,443)(116,240) (109,189)(95,241) 194,244 (303,861)
UNAUDITED
For Internal Use Only

Combined Income Statement - Current Month
Period Ending May 31, 2018
Actual Amounts Vs. Approved Budget Comparison Page 2 of 2
GlJdeIncomeStatementByResponsibility
6/7/2018 11:35:40PM
San Antonio Housing Authority
rp_GlJdeIncomeStatementByResponsibility
18.11%
63.83%
11.31%
4.89%
0.46%0.52%0.88%C1 -Public Housing 18.11%C2 -Section 8 63.83%C3 -Non Profit 11.31%C4 -Capital Funds 4.89%C5 -Central Office 0.46%C6 -Real Estate 0.52%C8 -Moving to Work 0.88%E1 -Eliminating Company 0.00%
Total: 100.00%
Net Revenue
by Line of Business
35.56%
26.02%
6.90%
6.29%
5.25%
4.42%
4.39%
4.13%3.76% 3.28%
Operating Transfers Out 35.56%
Admin - Salaries 26.02%
Other General Expenses 6.90%
Maint - Salaries 6.29%
Admin - Hospitalization 5.25%
Water 4.42%
Unit Make Ready 4.39%
Ins-Property 4.13%
Electricity 3.76%
Admin - Contract Labor 3.28%
Total: 100.00%
Top 10 Operating Expenses
Excluding HAP Expenses
-400K
0K
400K
800K
1200K
1600K
2000K
0 1 2 3 4 5 6 7
1,856K
569K 501K
34K 0K -10K -116K -165K
C2 -Section 8
C6 -Real Estate
C4 -Capital Funds
C3 -Non Profit
E1 -EliminatingCompany
C5 -Central Office
C8 -Moving to Work
C1 -Public Housing
Surplus or Deficit Prior to Non-Cash Items
by Line of Business
0
400000
800000
1200000
1600000
2000000
2400000San Antonio Housing Authority
Actual Amount
Budget Amount
Subtotal Surplus or Deficit Prior to Non-Cash Items
(Before Capital Funds)
UNAUDITED
For Internal Use Only

Combined Income Statement - Year-To-Date
Period Ending May 31, 2018
Actual Amounts Vs. Approved Budget Comparison Page 1 of 2
GlJdeIncomeStatementByResponsibility
6/7/2018 11:36:06PM
San Antonio Housing Authority
rp_GlJdeIncomeStatementByResponsibility
Section 8 Beacon Real Estate Central Office Community Initiatives Capital Funds Elim Company Combined TotalSubotalPublic Housing
Actual Budget Actual Budget Actual Budget Actual Budget Actual Budget Actual Budget Actual Budget Actual Budget Actual BudgetAccount Description Actual Budget
Revenue
Rental Revenue 9,306,586 10,177,697 17,582,094 18,212,359 (1,000) 2,383 26,887,681 28,392,439 26,887,681 28,392,439
Bad Debt, Net of Collections (138,833) 173,064 (291,200) (308,061) 719 (429,314) (134,997) (429,314) (134,997)
Other Tenant Revenue 336,296 463,396 605,937 559,840 (8,938) 942,233 1,023,237 933,295 1,023,237
Grants 20,493,396 18,064,131 8,315,996 7,824,130 2,465,879 2,556,083 10,059,418 13,015,377 (97,904) (117,430) 32,691,491 30,249,073 42,653,005 43,147,020 1,416,220 1,804,730
HAP Revenue 94,400,827 84,689,439 94,400,827 84,689,439 94,400,827 84,689,439
Miscellaneous Revenue 397,677 198,280 39,130 22,000 160,561 292,369 1,181,010 1,836,088 946,281 1,020,925 (769,768) (951,595) 3,206,317 3,877,467 2,436,548 2,925,872 481,658 507,804
30,395,123 29,076,569 102,755,953 92,535,570 20,523,271 21,312,590 1,180,729 1,838,471 946,281 1,020,925 10,059,418 13,015,377 (876,610) (1,069,025) 157,699,235 148,096,659 166,882,043 160,043,011 Net Revenue 1,897,878 2,312,534
Operating Expense
Salaries and Benefits 9,261,184 9,630,682 4,285,187 4,551,528 4,402,954 5,006,920 578,035 596,171 7,706,872 8,307,502 354,434 629,564 28,530,030 30,689,659 28,884,463 31,319,223 2,295,797 2,596,856
Supplies and Materials 2,030,609 1,335,609 385 749,405 708,424 100 57 25,650 30,429 703 2,806,888 2,074,519 2,807,591 2,074,519 740
Fleet Costs 173,122 120,572 21,633 32,083 26,069 22,985 1,133 12,111 27,325 35,635 251,628 224,212 251,628 224,212 2,347 825
Outside Services 6,065,692 4,249,330 1,062 5,500 2,525,391 2,501,536 74,414 148,947 181,419 174,225 85,557 8,847,985 7,079,539 8,933,542 7,079,539 7
Utilities 4,387,141 4,244,219 1,786,435 1,850,936 6,857 6,939 194,904 173,904 6,375,337 6,275,997 6,375,337 6,275,997
Protective Services 244,322 394,717 1,615 1,974 183,682 189,137 659 2,270 191,701 196,371 624,844 788,959 624,844 788,959 2,864 4,492
Insurance 1,183,223 1,390,298 151,829 218,894 748,272 1,097,090 35,447 62,617 129,423 196,677 317 1,332 2,284,571 3,037,720 2,284,888 3,039,052 36,377 72,143
HAP Expense 85,047,320 84,689,439 8,085 85,047,320 84,697,524 85,047,320 84,697,524
Other Expenses 1,725,183 2,239,250 916,609 1,474,137 1,188,059 1,052,772 666,767 730,233 1,145,555 1,685,662 1,640,589 3,695,693 (742,575) (909,250) 6,384,585 8,147,607 7,282,599 10,934,050 742,412 965,553
25,070,476 23,604,678 90,425,640 90,973,556 11,610,266 12,437,885 1,363,412 1,559,344 9,602,850 10,800,405 2,081,599 4,326,589 (742,575) (909,250) 141,153,188 143,015,737 142,492,211 146,433,076 Total Operating Expense 3,080,545 3,639,869
Total Operating Income 5,324,647 5,471,891 12,330,313 1,562,014 8,913,005 (182,683) 279,127 (8,656,569) 7,977,819 8,688,788 (159,775) 16,546,047 24,389,832 13,609,935 (1,182,667) (1,327,335)(9,779,480) 8,874,705 (134,034) 5,080,922
Non-Operating Income (Expense)
Interest Expense (41,001) (1,939,118) (1,607,892) (22,813) (9,021) (653,263) (650,503) 181,063 83,519 (2,002,932) (1,616,913) (2,475,132) (2,183,898)
Interest Income 1,026,195 386,221 6,588 205 375,191 168,863 1,051,862 839,205 61,315 152 8,577 770 (181,063) (83,519) 2,522,718 1,394,719 2,350,232 1,311,970 1,567 73
Replacement/Extraordinary Item (483,360) (551,050) (759,812) (1,379,243) (2,292) (6,477) (917) (1,249,650) (1,933,501) (1,249,650) (1,933,501)
Other Income (Expense) (1,820,227) (1,268,954) 860 84,619 615 (53,454) 6,190 97,904 117,430 (1,841,156) (1,262,764) (1,743,253) (1,145,334)(53,569)
Management Fees (4,352,167) (4,486,962) (2,883,738) (2,872,262) (1,415,412) (1,622,248) (6,412) (17,489) 8,512,829 8,728,956 (326,302) (319,588) 36,131 42,345 (158,050) (276,242) (448,221) (553,484)(13,149) (6,237)
Transfers (182,995) 197,246 (361,512) 361,512 (188,944) 67,128 (319,588)(67,128) 130,642 0 (188,945) 115,868 122,341
(5,853,557) (5,723,500) (2,876,290) (2,872,057) (4,016,044) (4,440,520) 1,384,764 621,459 8,514,213 8,734,382 (903,860) (1,288,909) 134,034 159,775 (2,796,197) (3,564,059) (3,566,023) (4,693,193)Total Non-Operating Income (Expense) 50,717 116,177
Surplus or Deficit Prior to Non-Cash Items (528,910) (251,609) 9,454,023 (1,310,043) 4,896,960 1,202,082 900,586 (142,356) 7,073,958 7,399,879 13,749,850 20,823,808 8,916,742 (1,131,950) (1,211,158)(1,045,097) 4,434,185 1,516,863
Non-Cash Items
Depreciation & Amortization (10,190,366) (9,952,155) (39,626) (39,528) (2,482,440) (2,376,529) (12,232) (12,439) (102,270) (70,920) (12,829,878) (12,454,513) (12,829,878) (12,454,513)(2,943) (2,943)
Non-Oper Income (Expense) 5,456,902 6,973,906 (7,641,751) 34,379 (4,187) 2,526,309 58,712 312,205 (5,268,285) (9,045,279) 2,721,982 7,028,431 (2,546,303) (2,016,848) 2,033,937
(4,733,464) (2,978,249) (7,681,377) (39,528) (2,448,061) (2,380,716) 2,514,077 46,273 209,935 (70,920) (5,268,285) (9,045,279)(10,107,896) (5,426,082) (15,376,181) (14,471,361)Total Non-Cash Items 2,030,995 (2,943)
Change In Net Assets (5,262,373) (3,229,858) 1,772,646 (1,349,570) 2,448,899 3,716,159 946,859 67,579 1,805,673 (1,645,400) 3,641,954 5,447,627 (5,554,619) 899,044 (1,214,101)(1,116,017) 2,053,469 (3,909,219)
UNAUDITED
For Internal Use Only
Combined Income Statement - Year-To-Date
Period Ending May 31, 2018
Actual Amounts Vs. Approved Budget Comparison Page 2 of 2
GlJdeIncomeStatementByResponsibility
6/7/2018 11:36:06PM
San Antonio Housing Authority
rp_GlJdeIncomeStatementByResponsibility
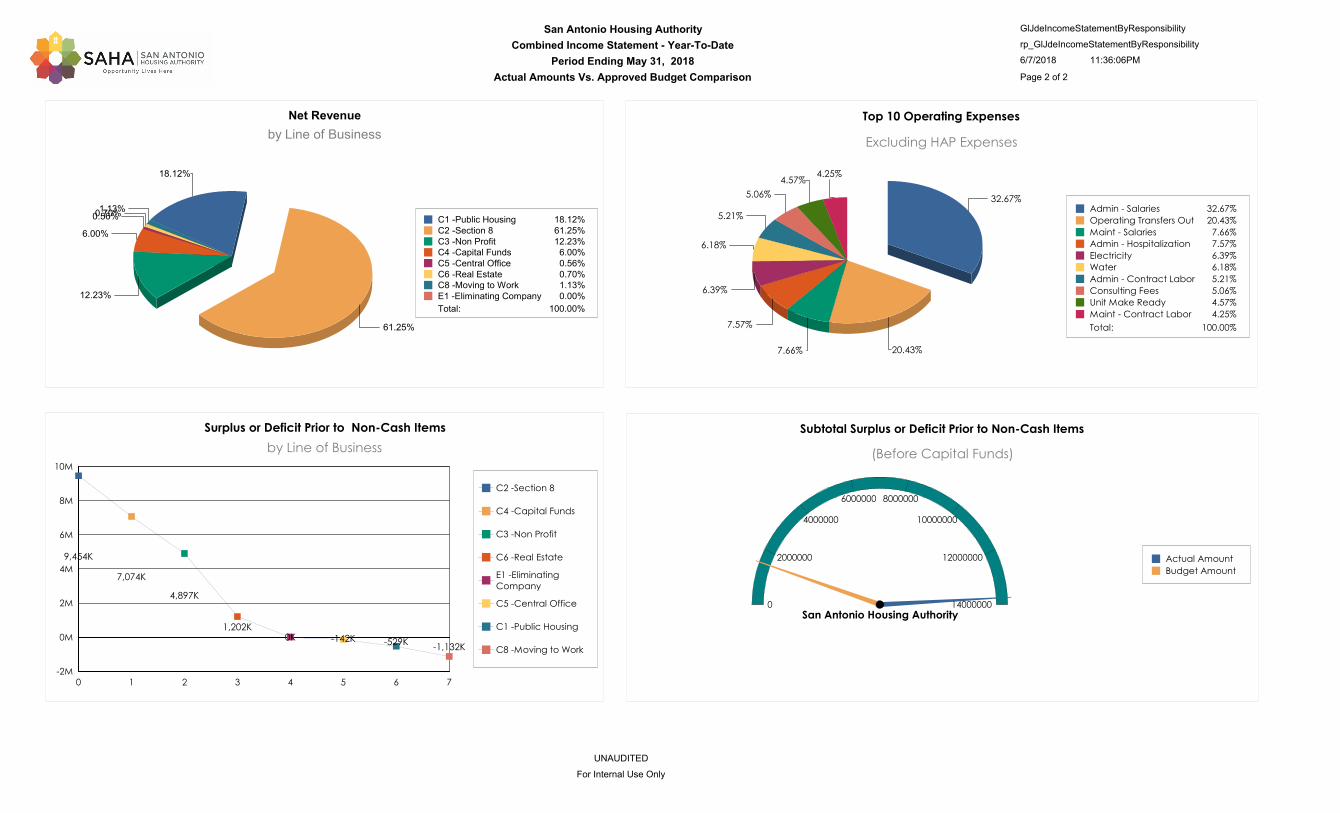
18.12%
61.25%
12.23%
6.00%
0.56%0.70%1.13%C1 -Public Housing 18.12%C2 -Section 8 61.25%C3 -Non Profit 12.23%C4 -Capital Funds 6.00%C5 -Central Office 0.56%C6 -Real Estate 0.70%C8 -Moving to Work 1.13%E1 -Eliminating Company 0.00%
Total: 100.00%
Net Revenue
by Line of Business
32.67%
20.43%7.66%
7.57%
6.39%
6.18%
5.21%
5.06%
4.57%4.25%
Admin - Salaries 32.67%
Operating Transfers Out 20.43%
Maint - Salaries 7.66%
Admin - Hospitalization 7.57%
Electricity 6.39%
Water 6.18%
Admin - Contract Labor 5.21%
Consulting Fees 5.06%
Unit Make Ready 4.57%
Maint - Contract Labor 4.25%
Total: 100.00%
Top 10 Operating Expenses
Excluding HAP Expenses
-2M
0M
2M
4M
6M
8M
10M
0 1 2 3 4 5 6 7
9,454K
7,074K
4,897K
1,202K0K -142K -529K
-1,132K
C2 -Section 8
C4 -Capital Funds
C3 -Non Profit
C6 -Real Estate
E1 -EliminatingCompany
C5 -Central Office
C1 -Public Housing
C8 -Moving to Work
Surplus or Deficit Prior to Non-Cash Items
by Line of Business
0
2000000
4000000
6000000 8000000
10000000
12000000
14000000San Antonio Housing Authority
Actual Amount
Budget Amount
Subtotal Surplus or Deficit Prior to Non-Cash Items
(Before Capital Funds)
UNAUDITED
For Internal Use Only

Period Ending May 31, 2018
GlJdeBalanceSheetByResponsicility
Page 1 of 1
Amounts in Thousands 6/7/2018 11:35:13PM
San Antonio Housing Authority
Summarized Combined Balance Sheet rp_jdeBalanceSheetByResponsicility
Public Housing Section 8 Not For Profit Real Estate Services Central Office Capital Funds Combined Total
This Year Last Year This Year Last Year This Year This Year This Year Last Year This Year This Year Last YearLast Year Last Year Last Year
Eliminating Company
This Year Last YearThis Year Last Year
Community Initiatives
Assets
Current Assets
Cash & Investments, Unrestricted 6,408 7,331 7,693 4,724 16,484 15,456 1,122 6,993 6,909 122 66 789 38,510 35,695 22 88
Cash & Investments, Restricted 12,147 13,850 1,557 1,328 14,012 14,111 111 336 30,111 32,009 2,285 2,384
Accounts Receivable 555 506 793 403 3,764 4,325 229 3,891 3,478 1,155 186 254 6,140 5,345 522 851 (4,796) (4,633)
Prepaid Expenses and Other Current Assets 772 0 7,641 6,935 445 272 7 181 178 1 0 9,041 7,393
Total Current Assets 17,684 13,391 34,705 34,165 1,044 11,065 10,565 1,359 1,390 588 83,802 80,443 21,686 19,881 2,828 3,322 (4,796) (4,633)
Fixed Assets
Land, Buildings and Equipment 371,662 370,584 810 822 108,576 106,102 19,313 2,763 2,868 41 41 19,122 502,973 499,730
Construction In Progress 5,465 1,049 6,450 1,179 578 90 938 26,720 14,925 13,866 12,029
Accumulated Depreciation (276,823) (267,437) (756) (723) (58,727) (56,292) (300) (2,334) (2,547) (27) (24)(154) (338,821) (327,324)
Total Fixed Assets 53 99 56,299 50,989 19,906 429 411 19,591 13 17 190,872 187,332 104,196 100,305 13,866 12,029
Other Non-Current Assets
Other Non-Current Assets 35,386 34,779 3,143 2,963 37,495 39,033 72,441 69,260 (5,122) (5,977)
Total Other Non-Current Assets 3,143 2,963 39,033 37,495 72,441 69,260 34,779 35,386 (5,122) (5,977)
Deferred Outflow of Resources
Deferred Outflow of Resources 946 1,073 946 1,073
Total Deferred Outflow of Resources 946 1,073 946 1,073
Total Assets & Deferred Outflow of Resources 17,737 95,092 13,489 89,189 59,983 58,445 1,403 605 11,494 10,976 348,060 338,108 155,572 160,662 16,695 15,352 (9,917) (10,610)
Liabilities
Current Liabilities
Trade Payable & Accruals 1,387 1,466 1,672 698 2,713 2,365 114 1,275 413 125 94 122 6,087 5,517 291 464 (1,498) (97)
Other Current Liabilities 1,325 1,383 1,818 1,119 4,147 5,010 1,616 35 254 479 546 812 5,989 6,278 753 961 (3,380) (4,613)
Total Current Liabilities 3,490 1,817 6,859 7,375 933 1,310 668 1,730 604 640 12,076 11,795 2,849 2,712 1,044 1,425 (4,877) (4,710)
Non-Current Liabilities
Non-Current Long Term Debt 894 284 1,415 1,327 52,653 48,564 10,655 9,179 75,658 73,408 16,558 18,477 (5,040) (5,900)
Total Non-Current Liabilities 1,415 1,327 52,653 48,564 9,179 10,655 75,658 73,408 284 894 16,558 18,477 (5,040) (5,900)
Total Liabilities 4,905 59,513 3,144 55,940 10,112 12,386 604 640 1,310 668 87,734 85,203 3,606 3,133 17,602 19,902 (9,917) (10,610)
Equity
Equity
Invested In Capital Assets 100,305 104,196 53 99 2,766 1,620 18,124 429 411 13 17 18,440 123,866 122,473 (3,183) (6,861) 5,044 4,867
Restricted Net Assets 12,147 13,850 1,557 1,328 14,012 14,111 111 336 30,111 32,009 2,285 2,384
Unrestricted Net Assets 39,515 39,483 11,222 8,918 18,802 17,518 27,935 9,755 9,898 675 (389) 31,432 106,349 98,423 (8) (73) (5,044) (4,867)
Total Equity 12,833 10,345 35,580 33,249 49,871 10,184 10,309 46,059 799 (36) 260,326 252,905 157,529 151,966 (907) (4,551) 0
338,108 348,060 605 1,403 10,976 11,494 58,445 59,983 89,189 95,092 13,489 17,737 160,662 155,572 Total Liabilities and Equity 16,695 15,352 (9,917) (10,610)
UNAUDITED
For Internal Use Only

Period Ending May 31, 2018
Actual Amounts Vs. Approved Budget ComparisonPage 1 of 1
6/7/2018 11:34:16PM
GlJdeAdministrativeIncomeStatementByBusinessUnit
Summarized Income Statement by Business UnitAsset Management
rp_GlJdeAdministrativeIncomeStatementByBusinessUnit
Account Description
Current Month Year-To-Date
Actual Budget Variance Actual Budget VarianceLast YearLast Year %
Operating Expense
28,810 27,774 291,447 305,516 (14,069) 1,035 27,887 277,196 (4.61)Salaries and Benefits
10 249 2,505 3,352 (847)(238) 20 2,096 (25.26)Insurance
2,414 3,855 38,456 42,401 (3,945)(1,441) 2,372 29,860 (9.30)Other Expenses
31,234 31,878 (644) 332,408 351,269 (18,861)Total Operating Expense 30,279 309,153 (5.37)
Total Operating Income (31,234) (31,878) (332,408) (351,269) 644 18,861 (309,153)(30,279) (5.37)
Non-Operating Income (Expense)
(76) (24) (596) (261) (335)(52)(28) (640) 128.30 Management Fees
(76) (24) (52) (596) (261) (335)Total Non-Operating Income (Expense) (28) (640) 128.30
Surplus or Deficit Prior to Non-Cash Items (31,310) (31,901) (333,005) (351,531) 591 18,526 (309,793)(30,307) (5.27)
Non-Cash Items
(146) (874) (874)(146) 100.00 Depreciation & Amortization
21,133 312,205 312,205 21,133 38,708 326,379 100.00 Non-Oper Income (Expense)
20,987 20,987 311,331 311,331 Total Non-Cash Items 38,708 326,379 100.00
Change In Net Assets (10,323) (31,901) (21,674) (351,531) 21,578 329,856 16,586 8,401 (93.83)
UNAUDITED
For Internal Use Only

Period Ending May 31, 2018
Actual Amounts Vs. Approved Budget ComparisonPage 1 of 1
6/7/2018 11:34:19PM
GlJdeAdministrativeIncomeStatementByBusinessUnit
Summarized Income Statement by Business UnitBrazos Warehouse Building
rp_GlJdeAdministrativeIncomeStatementByBusinessUnit
Account Description
Current Month Year-To-Date
Actual Budget Variance Actual Budget VarianceLast YearLast Year %
Revenue
Other Tenant Revenue
2,025 2,025 288 100.00 Miscellaneous Revenue
2,025 2,025 Net Revenue 288 100.00
Operating Expense
4,495 4,549 42,015 50,037 (8,022)(54) 671 20,196 (16.03)Salaries and Benefits
749 187 1,068 2,060 (992) 562 578 1,558 (48.16)Supplies and Materials
208 2,292 (2,292)(208) 75 (100.00)Fleet Costs
881 1,810 5,580 19,905 (14,325)(929)(4,271) (10,618) (71.97)Outside Services
1,943 427 20,289 4,764 15,525 1,516 2,593 34,195 325.88 Utilities
81 119 350 1,306 (955)(38) 47 2,353 (73.17)Protective Services
5 2,509 19,074 27,820 (8,746)(2,504) 6 18,651 (31.44)Insurance
232 4,344 8,195 47,779 (39,584)(4,111) 139 41,178 (82.85)Other Expenses
8,386 14,153 (5,767) 96,571 155,962 (59,391)Total Operating Expense (237) 107,588 (38.08)
Total Operating Income (8,386) (14,153) (94,546) (155,962) 5,767 61,416 (107,300) 237 (39.38)
Non-Operating Income (Expense)
(7) (3) (54) (36) (18)(4)(8) (244) 50.08 Management Fees
(7) (3) (4) (54) (36) (18)Total Non-Operating Income (Expense) (8) (244) 50.08
Surplus or Deficit Prior to Non-Cash Items (8,393) (14,156) (94,600) (155,998) 5,763 61,398 (107,545) 229 (39.36)
Non-Cash Items
(1,470) (1,444) (16,165) (15,881) (284)(26)(1,546) (15,983) 1.79 Depreciation & Amortization
(1,470) (1,444) (26) (16,165) (15,881) (284)Total Non-Cash Items (1,546) (15,983) 1.79
Change In Net Assets (9,862) (15,600) (110,766) (171,879) 5,737 61,114 (123,528)(1,316) (35.56)
UNAUDITED
For Internal Use Only

Period Ending May 31, 2018
Actual Amounts Vs. Approved Budget ComparisonPage 1 of 1
6/7/2018 11:34:22PM
GlJdeAdministrativeIncomeStatementByBusinessUnit
Summarized Income Statement by Business UnitCentral Office Building
rp_GlJdeAdministrativeIncomeStatementByBusinessUnit
Account Description
Current Month Year-To-Date
Actual Budget Variance Actual Budget VarianceLast YearLast Year %
Revenue
22 Other Tenant Revenue
84 924 (924)(84) 15,494 (100.00)Miscellaneous Revenue
84 (84) 924 (924)Net Revenue 15,516 (100.00)
Operating Expense
26,748 25,177 302,372 276,950 25,422 1,571 28,845 296,310 9.18 Salaries and Benefits
3,472 2,575 24,306 28,323 (4,018) 897 2,114 22,473 (14.19)Supplies and Materials
161 342 6,884 3,757 3,128 (180) 286 4,216 83.27 Fleet Costs
20,587 13,852 166,331 152,367 13,964 6,735 4,998 113,504 9.16 Outside Services
16,025 15,376 174,615 169,140 5,476 649 15,283 171,942 3.24 Utilities
4,642 15,377 108,216 169,152 (60,936)(10,736) 14,870 153,197 (36.02)Protective Services
89 2,626 17,597 30,165 (12,568)(2,537) 51 18,750 (41.66)Insurance
(70,204) (74,904) (788,966) (823,942) 34,977 4,700 (66,382) (778,824) (4.25)Other Expenses
1,520 421 1,099 11,356 5,911 5,445 Total Operating Expense 65 1,567 92.11
Total Operating Income (1,520) (337) (11,356) (4,987)(1,183) (6,369) 13,949 (65) 127.70
Non-Operating Income (Expense)
(83) (5,895) (917) (4,979) 83 (2,040) 543.15 Replacement/Extraordinary Item
563 1,200 6,190 (4,990)(563) 3,220 (80.61)Other Income (Expense)
3,952 1,101 30,931 12,106 18,825 2,852 822 32,286 155.49 Management Fees
3,952 1,580 2,372 26,236 17,380 8,856 Total Non-Operating Income (Expense) 822 33,466 50.95
Surplus or Deficit Prior to Non-Cash Items 2,432 1,243 14,880 12,393 1,189 2,487 47,415 757 20.07
Non-Cash Items
(4,035) (1,226) (31,653) (13,902) (17,751)(2,809)(1,883) (42,358) 127.69 Depreciation & Amortization
(4,035) (1,226) (2,809) (31,653) (13,902) (17,751)Total Non-Cash Items (1,883) (42,358) 127.69
Change In Net Assets (1,602) 17 (16,772) (1,509)(1,620) (15,264) 5,057 (1,126) 1,011.67
UNAUDITED
For Internal Use Only
Period Ending May 31, 2018
Actual Amounts Vs. Approved Budget ComparisonPage 1 of 1
6/7/2018 11:34:29PM
GlJdeAdministrativeIncomeStatementByBusinessUnit
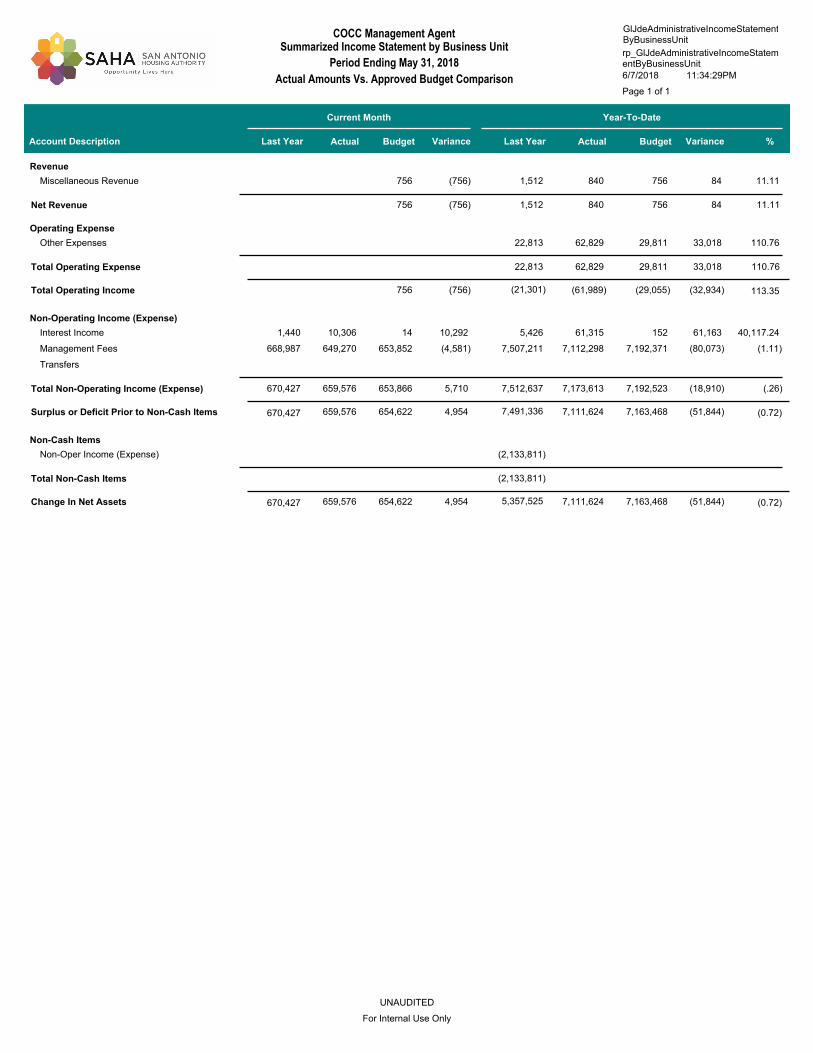
Summarized Income Statement by Business UnitCOCC Management Agent
rp_GlJdeAdministrativeIncomeStatementByBusinessUnit
Account Description
Current Month Year-To-Date
Actual Budget Variance Actual Budget VarianceLast YearLast Year %
Revenue
756 840 756 84 (756) 1,512 11.11 Miscellaneous Revenue
756 (756) 840 756 84 Net Revenue 1,512 11.11
Operating Expense
62,829 29,811 33,018 22,813 110.76 Other Expenses
62,829 29,811 33,018 Total Operating Expense 22,813 110.76
Total Operating Income 756 (61,989) (29,055)(756) (32,934)(21,301) 113.35
Non-Operating Income (Expense)
10,306 14 61,315 152 61,163 10,292 1,440 5,426 40,117.24 Interest Income
649,270 653,852 7,112,298 7,192,371 (80,073)(4,581) 668,987 7,507,211 (1.11)Management Fees
Transfers
659,576 653,866 5,710 7,173,613 7,192,523 (18,910)Total Non-Operating Income (Expense) 670,427 7,512,637 (.26)
Surplus or Deficit Prior to Non-Cash Items 659,576 654,622 7,111,624 7,163,468 4,954 (51,844) 7,491,336 670,427 (0.72)
Non-Cash Items
(2,133,811)Non-Oper Income (Expense)
Total Non-Cash Items (2,133,811)
Change In Net Assets 659,576 654,622 7,111,624 7,163,468 4,954 (51,844) 5,357,525 670,427 (0.72)
UNAUDITED
For Internal Use Only
Period Ending May 31, 2018
Actual Amounts Vs. Approved Budget ComparisonPage 1 of 1
6/7/2018 11:34:45PM
GlJdeAdministrativeIncomeStatementByBusinessUnit
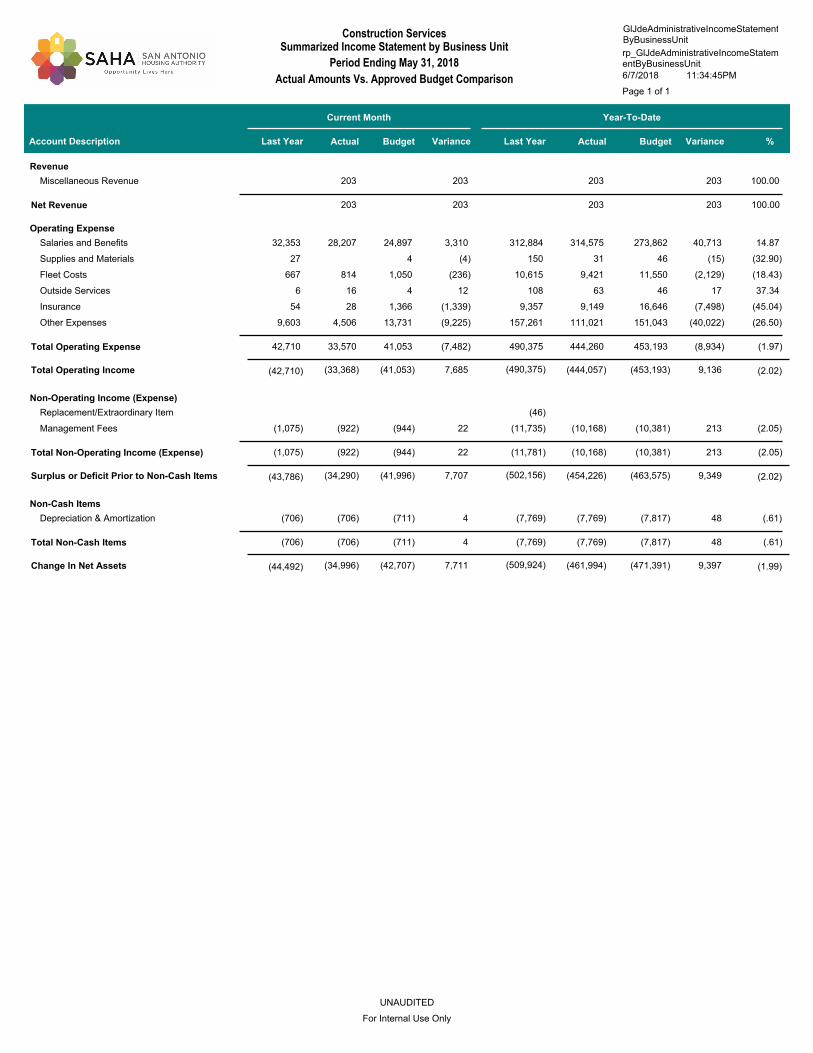
Summarized Income Statement by Business UnitConstruction Services
rp_GlJdeAdministrativeIncomeStatementByBusinessUnit
Account Description
Current Month Year-To-Date
Actual Budget Variance Actual Budget VarianceLast YearLast Year %
Revenue
203 203 203 203 100.00 Miscellaneous Revenue
203 203 203 203 Net Revenue 100.00
Operating Expense
28,207 24,897 314,575 273,862 40,713 3,310 32,353 312,884 14.87 Salaries and Benefits
4 31 46 (15)(4) 27 150 (32.90)Supplies and Materials
814 1,050 9,421 11,550 (2,129)(236) 667 10,615 (18.43)Fleet Costs
16 4 63 46 17 12 6 108 37.34 Outside Services
28 1,366 9,149 16,646 (7,498)(1,339) 54 9,357 (45.04)Insurance
4,506 13,731 111,021 151,043 (40,022)(9,225) 9,603 157,261 (26.50)Other Expenses
33,570 41,053 (7,482) 444,260 453,193 (8,934)Total Operating Expense 42,710 490,375 (1.97)
Total Operating Income (33,368) (41,053) (444,057) (453,193) 7,685 9,136 (490,375)(42,710) (2.02)
Non-Operating Income (Expense)
(46)Replacement/Extraordinary Item
(922) (944) (10,168) (10,381) 213 22 (1,075) (11,735) (2.05)Management Fees
(922) (944) 22 (10,168) (10,381) 213 Total Non-Operating Income (Expense) (1,075) (11,781) (2.05)
Surplus or Deficit Prior to Non-Cash Items (34,290) (41,996) (454,226) (463,575) 7,707 9,349 (502,156)(43,786) (2.02)
Non-Cash Items
(706) (711) (7,769) (7,817) 48 4 (706) (7,769) (.61)Depreciation & Amortization
(706) (711) 4 (7,769) (7,817) 48 Total Non-Cash Items (706) (7,769) (.61)
Change In Net Assets (34,996) (42,707) (461,994) (471,391) 7,711 9,397 (509,924)(44,492) (1.99)
UNAUDITED
For Internal Use Only

Period Ending May 31, 2018
Actual Amounts Vs. Approved Budget ComparisonPage 1 of 1
6/7/2018 11:34:51PM
GlJdeAdministrativeIncomeStatementByBusinessUnit
Summarized Income Statement by Business UnitExecutive Office
rp_GlJdeAdministrativeIncomeStatementByBusinessUnit
Account Description
Current Month Year-To-Date
Actual Budget Variance Actual Budget VarianceLast YearLast Year %
Operating Expense
90,869 61,159 795,503 672,749 122,754 29,710 92,076 840,592 18.25 Salaries and Benefits
246 246 100.00 Supplies and Materials
25 333 238 3,667 (3,429)(308) 29 1,246 (93.51)Fleet Costs
(11) 83 737 917 (180)(94) 277 (19.65)Outside Services
240 723 5,494 9,094 (3,600)(484) 40 5,492 (39.59)Insurance
16,023 21,140 156,118 232,537 (76,418)(5,117) 22,530 151,379 (32.86)Other Expenses
107,146 83,439 23,708 958,335 918,963 39,372 Total Operating Expense 114,674 998,985 4.28
Total Operating Income (107,146) (83,439) (958,335) (918,963)(23,708) (39,372)(998,985)(114,674) 4.28
Non-Operating Income (Expense)
(355) (355) (355)(355) 100.00 Replacement/Extraordinary Item
14,943 11,414 135,027 125,556 9,471 3,529 15,899 136,545 7.54 Management Fees
14,588 11,414 3,174 134,672 125,556 9,116 Total Non-Operating Income (Expense) 15,899 136,545 7.26
Surplus or Deficit Prior to Non-Cash Items (92,558) (72,025) (823,663) (793,407)(20,534) (30,256)(862,441)(98,776) 3.81
Non-Cash Items
(1,154) (1,151) (12,690) (12,658) (31)(3)(1,151) (11,173) .25 Depreciation & Amortization
(1,154) (1,151) (3) (12,690) (12,658) (31)Total Non-Cash Items (1,151) (11,173) .25
Change In Net Assets (93,712) (73,175) (836,353) (806,065)(20,537) (30,287)(873,613)(99,926) 3.76
UNAUDITED
For Internal Use Only
Period Ending May 31, 2018
Actual Amounts Vs. Approved Budget ComparisonPage 1 of 1
6/7/2018 11:34:56PM
GlJdeAdministrativeIncomeStatementByBusinessUnit
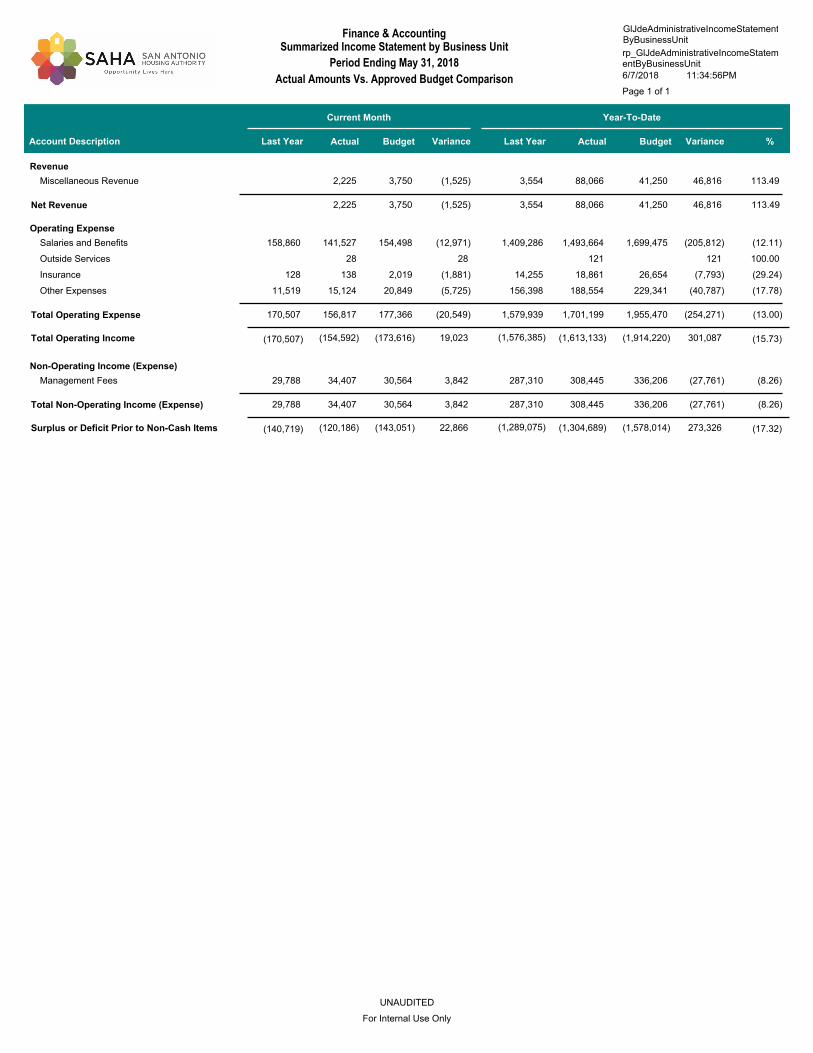
Summarized Income Statement by Business UnitFinance & Accounting
rp_GlJdeAdministrativeIncomeStatementByBusinessUnit
Account Description
Current Month Year-To-Date
Actual Budget Variance Actual Budget VarianceLast YearLast Year %
Revenue
2,225 3,750 88,066 41,250 46,816 (1,525) 3,554 113.49 Miscellaneous Revenue
2,225 3,750 (1,525) 88,066 41,250 46,816 Net Revenue 3,554 113.49
Operating Expense
141,527 154,498 1,493,664 1,699,475 (205,812)(12,971) 158,860 1,409,286 (12.11)Salaries and Benefits
28 121 121 28 100.00 Outside Services
138 2,019 18,861 26,654 (7,793)(1,881) 128 14,255 (29.24)Insurance
15,124 20,849 188,554 229,341 (40,787)(5,725) 11,519 156,398 (17.78)Other Expenses
156,817 177,366 (20,549) 1,701,199 1,955,470 (254,271)Total Operating Expense 170,507 1,579,939 (13.00)
Total Operating Income (154,592) (173,616) (1,613,133) (1,914,220) 19,023 301,087 (1,576,385)(170,507) (15.73)
Non-Operating Income (Expense)
34,407 30,564 308,445 336,206 (27,761) 3,842 29,788 287,310 (8.26)Management Fees
34,407 30,564 3,842 308,445 336,206 (27,761)Total Non-Operating Income (Expense) 29,788 287,310 (8.26)
Surplus or Deficit Prior to Non-Cash Items (120,186) (143,051) (1,304,689) (1,578,014) 22,866 273,326 (1,289,075)(140,719) (17.32)
UNAUDITED
For Internal Use Only

Period Ending May 31, 2018
Actual Amounts Vs. Approved Budget ComparisonPage 1 of 1
6/7/2018 11:34:59PM
GlJdeAdministrativeIncomeStatementByBusinessUnit
Summarized Income Statement by Business UnitHuman Resources
rp_GlJdeAdministrativeIncomeStatementByBusinessUnit
Account Description
Current Month Year-To-Date
Actual Budget Variance Actual Budget VarianceLast YearLast Year %
Revenue
20 20 20 20 100.00 Miscellaneous Revenue
20 20 20 20 Net Revenue 100.00
Operating Expense
47,120 55,181 549,821 606,990 (57,169)(8,061) 60,774 644,739 (9.42)Salaries and Benefits
2,536 2,536 100.00 Outside Services
875 875 572 100.00 Protective Services
29 671 6,681 8,981 (2,300)(642) 52 5,704 (25.61)Insurance
14,528 30,549 256,739 336,034 (79,295)(16,021) 26,800 234,701 (23.60)Other Expenses
61,677 86,401 (24,723) 816,652 952,005 (135,353)Total Operating Expense 87,625 885,716 (14.22)
Total Operating Income (61,657) (86,401) (816,632) (952,005) 24,743 135,373 (885,716)(87,625) (14.22)
Non-Operating Income (Expense)
8,217 12,077 112,535 130,852 (18,318)(3,861) 11,838 120,282 (14.00)Management Fees
8,217 12,077 (3,861) 112,535 130,852 (18,318)Total Non-Operating Income (Expense) 11,838 120,282 (14.00)
Surplus or Deficit Prior to Non-Cash Items (53,441) (74,323) (704,097) (821,153) 20,883 117,055 (765,434)(75,787) (14.26)
UNAUDITED
For Internal Use Only

Period Ending May 31, 2018
Actual Amounts Vs. Approved Budget ComparisonPage 1 of 1
6/7/2018 11:35:01PM
GlJdeAdministrativeIncomeStatementByBusinessUnit
Summarized Income Statement by Business UnitInternal Audit
rp_GlJdeAdministrativeIncomeStatementByBusinessUnit
Account Description
Current Month Year-To-Date
Actual Budget Variance Actual Budget VarianceLast YearLast Year %
Operating Expense
26,215 29,874 304,417 328,614 (24,197)(3,659) 21,111 249,651 (7.36)Salaries and Benefits
25 92 138 1,008 (871)(67) (86.34)Fleet Costs
4 4 100.00 Outside Services
19 464 4,038 6,096 (2,058)(445) 29 3,181 (33.76)Insurance
4,063 7,030 59,577 80,421 (20,844)(2,966) 4,858 67,993 (25.92)Other Expenses
30,322 37,460 (7,137) 368,174 416,140 (47,966)Total Operating Expense 25,999 320,826 (11.53)
Total Operating Income (30,322) (37,460) (368,174) (416,140) 7,137 47,966 (320,826)(25,999) (11.53)
Non-Operating Income (Expense)
4,220 5,267 52,198 57,933 (5,735)(1,047) 3,593 43,869 (9.90)Management Fees
4,220 5,267 (1,047) 52,198 57,933 (5,735)Total Non-Operating Income (Expense) 3,593 43,869 (9.90)
Surplus or Deficit Prior to Non-Cash Items (26,103) (32,193) (315,976) (358,207) 6,090 42,231 (276,957)(22,406) (11.79)
Non-Cash Items
(307) (3,379) (3,379)(307) 100.00 Depreciation & Amortization
(307) (307) (3,379) (3,379)Total Non-Cash Items 100.00
Change In Net Assets (26,410) (32,193) (319,355) (358,207) 5,783 38,852 (276,957)(22,406) (10.85)
UNAUDITED
For Internal Use Only

Period Ending May 31, 2018
Actual Amounts Vs. Approved Budget ComparisonPage 1 of 1
6/7/2018 11:35:04PM
GlJdeAdministrativeIncomeStatementByBusinessUnit
Summarized Income Statement by Business UnitLegal Services
rp_GlJdeAdministrativeIncomeStatementByBusinessUnit
Account Description
Current Month Year-To-Date
Actual Budget Variance Actual Budget VarianceLast YearLast Year %
Revenue
21,949 34,094 266,144 375,031 (108,887)(12,145) 18,491 260,586 (29.03)Miscellaneous Revenue
21,949 34,094 (12,145) 266,144 375,031 (108,887)Net Revenue 18,491 260,586 (29.03)
Operating Expense
24,054 19,603 239,788 215,637 24,152 4,451 21,532 206,552 11.20 Salaries and Benefits
8 215 2,087 2,914 (827)(206) 20 2,125 (28.38)Insurance
7,014 12,980 113,761 142,776 (29,015)(5,965) 10,335 106,956 (20.32)Other Expenses
31,077 32,798 (1,721) 355,636 361,327 (5,690)Total Operating Expense 31,887 315,632 (1.57)
Total Operating Income (9,128) 1,296 (89,492) 13,705 (10,424) (103,197)(55,047)(13,396) (753.01)
Non-Operating Income (Expense)
1,204 (62) 13,331 (682) 14,012 1,266 1,845 7,863 (2,055.89)Management Fees
1,204 (62) 1,266 13,331 (682) 14,012 Total Non-Operating Income (Expense) 1,845 7,863 (2,055.89)
Surplus or Deficit Prior to Non-Cash Items (7,924) 1,234 (76,162) 13,023 (9,158) (89,185)(47,184)(11,552) (684.82)
UNAUDITED
For Internal Use Only

Period Ending May 31, 2018
Actual Amounts Vs. Approved Budget ComparisonPage 1 of 1
6/7/2018 11:35:12PM
GlJdeAdministrativeIncomeStatementByBusinessUnit
Summarized Income Statement by Business UnitAnnie Casey
rp_GlJdeAdministrativeIncomeStatementByBusinessUnit
Account Description
Current Month Year-To-Date
Actual Budget Variance Actual Budget VarianceLast YearLast Year %
Revenue
16,873 143,008 185,601 (42,593)(16,873) 215,918 (22.95)Miscellaneous Revenue
16,873 (16,873) 143,008 185,601 (42,593)Net Revenue 215,918 (22.95)
Operating Expense
17,053 15,608 152,983 171,689 (18,706) 1,445 13,235 151,496 (10.90)Salaries and Benefits
43 495 470 25 (43) 11 5.26 Insurance
33 1,259 24,306 13,850 10,456 (1,226) 694 23,347 75.50 Other Expenses
17,087 16,910 177 177,784 186,009 (8,225)Total Operating Expense 13,928 174,854 (4.42)
Total Operating Income (17,087) (37) (34,776) (408)(17,050) (34,368) 41,064 (13,928) 8,430.57
Non-Operating Income (Expense)
(300) 16,763 16,763 (300) 100.00 Transfers
(300) (300) 16,763 16,763 Total Non-Operating Income (Expense) 100.00
Surplus or Deficit Prior to Non-Cash Items (17,387) (37) (18,013) (408)(17,350) (17,605) 41,064 (13,928) 4,318.64
UNAUDITED
For Internal Use Only

Period Ending May 31, 2018
Actual Amounts Vs. Approved Budget ComparisonPage 1 of 1
6/7/2018 11:35:14PM
GlJdeAdministrativeIncomeStatementByBusinessUnit
Summarized Income Statement by Business UnitEarly Engagement
rp_GlJdeAdministrativeIncomeStatementByBusinessUnit
Account Description
Current Month Year-To-Date
Actual Budget Variance Actual Budget VarianceLast YearLast Year %
Operating Expense
211 2,321 (2,321)(211) (100.00)Protective Services
4 41 (41)(4) (100.00)Insurance
1,399 2,231 13,045 24,538 (11,493)(832) 1,709 11,690 (46.84)Other Expenses
1,399 2,445 (1,046) 13,045 26,900 (13,855)Total Operating Expense 1,709 11,690 (51.50)
Total Operating Income (1,399) (2,445) (13,045) (26,900) 1,046 13,855 (11,690)(1,709) (51.50)
Non-Operating Income (Expense)
(2) (20) 20 2 (100.00)Management Fees
(2) 2 (20) 20 Total Non-Operating Income (Expense) (100.00)
Surplus or Deficit Prior to Non-Cash Items (1,399) (2,447) (13,045) (26,920) 1,048 13,875 (11,690)(1,709) (51.54)
UNAUDITED
For Internal Use Only
Period Ending May 31, 2018
Actual Amounts Vs. Approved Budget ComparisonPage 1 of 1
6/7/2018 11:35:16PM
GlJdeAdministrativeIncomeStatementByBusinessUnit
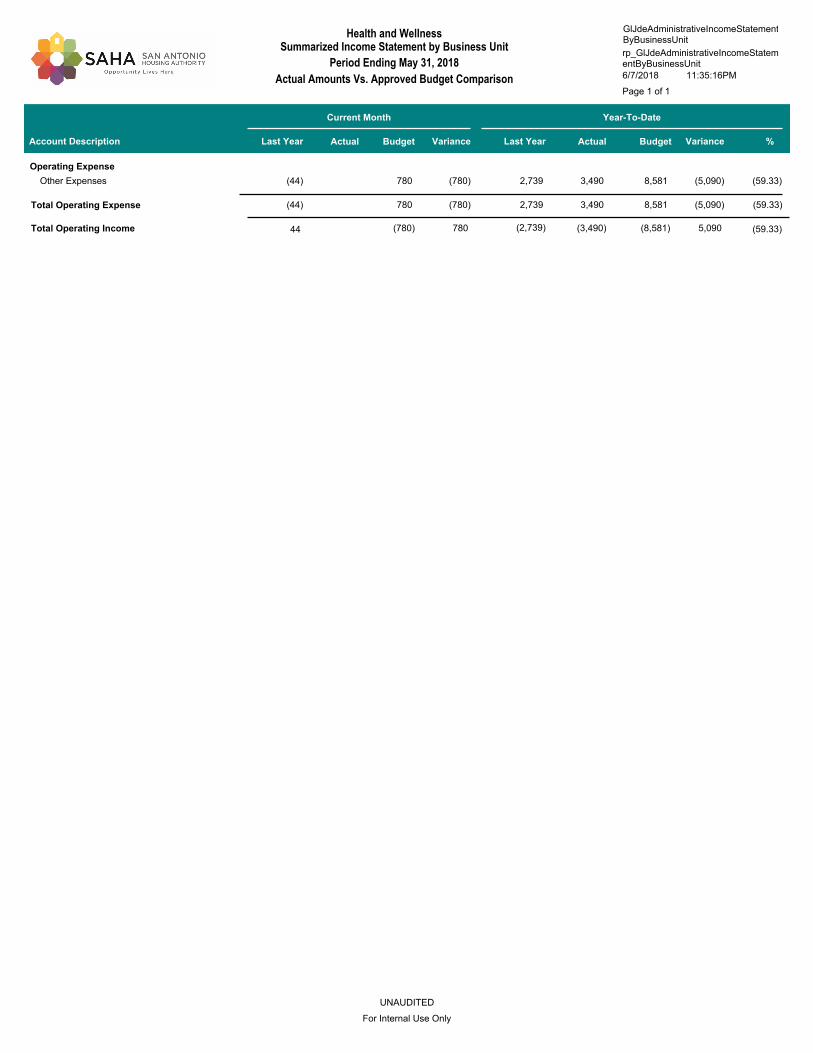
Summarized Income Statement by Business UnitHealth and Wellness
rp_GlJdeAdministrativeIncomeStatementByBusinessUnit
Account Description
Current Month Year-To-Date
Actual Budget Variance Actual Budget VarianceLast YearLast Year %
Operating Expense
780 3,490 8,581 (5,090)(780)(44) 2,739 (59.33)Other Expenses
780 (780) 3,490 8,581 (5,090)Total Operating Expense (44) 2,739 (59.33)
Total Operating Income (780) (3,490) (8,581) 780 5,090 (2,739) 44 (59.33)
UNAUDITED
For Internal Use Only

Period Ending May 31, 2018
Actual Amounts Vs. Approved Budget ComparisonPage 1 of 1
6/7/2018 11:35:22PM
GlJdeAdministrativeIncomeStatementByBusinessUnit
Summarized Income Statement by Business UnitMTW Program Administration
rp_GlJdeAdministrativeIncomeStatementByBusinessUnit
Account Description
Current Month Year-To-Date
Actual Budget Variance Actual Budget VarianceLast YearLast Year %
Revenue
100 100 36,544 100.00 Miscellaneous Revenue
100 100 Net Revenue 36,544 100.00
Operating Expense
61,387 59,650 625,607 656,152 (30,545) 1,736 49,782 448,946 (4.66)Salaries and Benefits
210 75 2,347 825 1,522 135 695 2,981 184.52 Fleet Costs
7 7 100.00 Outside Services
855 197 2,192 2,171 21 658 234 1,859 .96 Protective Services
128 3,039 25,142 41,279 (16,136)(2,911) 213 23,209 (39.09)Insurance
30,761 34,617 277,022 380,788 (103,766)(3,856) 11,550 187,655 (27.25)Other Expenses
93,341 97,579 (4,238) 932,318 1,081,214 (148,897)Total Operating Expense 62,476 664,649 (13.77)
Total Operating Income (93,341) (97,579) (932,218) (1,081,214) 4,238 148,997 (628,106)(62,476) (13.78)
Non-Operating Income (Expense)
500 500 1 10,145 100.00 Interest Income
(8,657) (8,657) (8,657)(8,657) 100.00 Other Income (Expense)
(495) (223) (5,087) (2,452) (2,636)(273)(149) (4,130) 107.50 Management Fees
12,081 11,122 99,578 122,341 (22,763) 959 9,454 107,014 (18.61)Transfers
2,928 10,899 (7,971) 86,333 119,889 (33,556)Total Non-Operating Income (Expense) 9,306 113,028 (27.99)
Surplus or Deficit Prior to Non-Cash Items (90,413) (86,680) (845,885) (961,325)(3,733) 115,441 (515,077)(53,170) (12.01)
Non-Cash Items
2,033,937 2,033,937 (124,409) (17,251,666) 100.00 Non-Oper Income (Expense)
2,033,937 2,033,937 Total Non-Cash Items (124,409) (17,251,666) 100.00
Change In Net Assets (90,413) (86,680) 1,188,053 (961,325)(3,733) 2,149,378 (17,766,743)(177,578) (223.58)
UNAUDITED
For Internal Use Only

Period Ending May 31, 2018
Actual Amounts Vs. Approved Budget ComparisonPage 1 of 1
6/7/2018 11:35:27PM
GlJdeAdministrativeIncomeStatementByBusinessUnit
Summarized Income Statement by Business UnitRes Ambassador Empowerment Pgm
rp_GlJdeAdministrativeIncomeStatementByBusinessUnit
Account Description
Current Month Year-To-Date
Actual Budget Variance Actual Budget VarianceLast YearLast Year %
Operating Expense
2,655 5,411 24,177 59,523 (35,346)(2,757) 2,629 22,452 (59.38)Salaries and Benefits
24 228 182 2,508 (2,326)(204) 2 233 (92.74)Insurance
7 73 (73)(7) 40 (100.00)Other Expenses
2,678 5,646 (2,968) 24,360 62,105 (37,745)Total Operating Expense 2,631 22,725 (60.78)
Total Operating Income (2,678) (5,646) (24,360) (62,105) 2,968 37,745 (22,725)(2,631) (60.78)
UNAUDITED
For Internal Use Only

Period Ending May 31, 2018
Actual Amounts Vs. Approved Budget ComparisonPage 1 of 1
6/7/2018 11:35:34PM
GlJdeAdministrativeIncomeStatementByBusinessUnit
Summarized Income Statement by Business UnitSummer Youth Program
rp_GlJdeAdministrativeIncomeStatementByBusinessUnit
Account Description
Current Month Year-To-Date
Actual Budget Variance Actual Budget VarianceLast YearLast Year %
Operating Expense
10,248 47,451 112,731 (65,280)(10,248) 61,779 (57.91)Salaries and Benefits
1,140 44 12,540 (12,496)(1,140) 1,321 (99.65)Insurance
17 1,288 3,483 (2,195)(17) 3,634 (63.03)Other Expenses
11,405 (11,405) 48,783 128,754 (79,971)Total Operating Expense 66,734 (62.11)
Total Operating Income (11,405) (48,783) (128,754) 11,405 79,971 (66,734) (62.11)
UNAUDITED
For Internal Use Only

Period Ending May 31, 2018
Actual Amounts Vs. Approved Budget ComparisonPage 1 of 1
6/7/2018 11:35:37PM
GlJdeAdministrativeIncomeStatementByBusinessUnit
Summarized Income Statement by Business UnitPolicy And Planning
rp_GlJdeAdministrativeIncomeStatementByBusinessUnit
Account Description
Current Month Year-To-Date
Actual Budget Variance Actual Budget VarianceLast YearLast Year %
Revenue
48,750 Miscellaneous Revenue
Net Revenue 48,750
Operating Expense
25,072 24,879 256,859 273,667 (16,808) 193 24,513 249,513 (6.14)Salaries and Benefits
30 Supplies and Materials
340 Outside Services
12 324 2,722 4,256 (1,534)(312) 20 2,198 (36.05)Insurance
7,451 5,621 47,600 61,830 (14,230) 1,830 3,803 48,823 (23.01)Other Expenses
32,535 30,824 1,711 307,181 339,753 (32,572)Total Operating Expense 28,336 300,905 (9.59)
Total Operating Income (32,535) (30,824) (307,181) (339,753)(1,711) 32,572 (252,155)(28,336) (9.59)
Non-Operating Income (Expense)
(227) (227) (227)(227) 100.00 Replacement/Extraordinary Item
4,530 4,238 43,204 46,617 (3,413) 292 3,951 34,851 (7.32)Management Fees
4,303 4,238 65 42,977 46,617 (3,640)Total Non-Operating Income (Expense) 3,951 34,851 (7.81)
Surplus or Deficit Prior to Non-Cash Items (28,232) (26,586) (264,203) (293,136)(1,646) 28,933 (217,304)(24,384) (9.87)
Non-Cash Items
(69) (69) (757) (757) 0 (69) (757) .00 Depreciation & Amortization
(69) (69) (757) (757) 0 Total Non-Cash Items (69) (757) .00
Change In Net Assets (28,300) (26,654) (264,960) (293,893)(1,646) 28,933 (218,061)(24,453) (9.84)
UNAUDITED
For Internal Use Only

Period Ending May 31, 2018
Actual Amounts Vs. Approved Budget ComparisonPage 1 of 1
6/7/2018 11:35:40PM
GlJdeAdministrativeIncomeStatementByBusinessUnit
Summarized Income Statement by Business UnitProcurement
rp_GlJdeAdministrativeIncomeStatementByBusinessUnit
Account Description
Current Month Year-To-Date
Actual Budget Variance Actual Budget VarianceLast YearLast Year %
Revenue
447 447 100.00 Miscellaneous Revenue
447 447 Net Revenue 100.00
Operating Expense
42,022 49,004 444,877 539,046 (94,170)(6,982) 43,347 511,963 (17.47)Salaries and Benefits
30 625 5,836 8,363 (2,527)(595) 43 4,908 (30.21)Insurance
5,457 11,276 108,702 124,132 (15,430)(5,819) 4,504 88,092 (12.43)Other Expenses
47,509 60,904 (13,395) 559,415 671,541 (112,126)Total Operating Expense 47,894 604,963 (16.70)
Total Operating Income (47,509) (60,904) (558,969) (671,541) 13,395 112,573 (604,963)(47,894) (16.76)
Non-Operating Income (Expense)
6,428 8,325 77,588 91,573 (13,985)(1,897) 6,506 82,049 (15.27)Management Fees
6,428 8,325 (1,897) 77,588 91,573 (13,985)Total Non-Operating Income (Expense) 6,506 82,049 (15.27)
Surplus or Deficit Prior to Non-Cash Items (41,082) (52,580) (481,380) (579,969) 11,498 98,588 (522,914)(41,388) (17.00)
Non-Cash Items
(312) (312) (3,433) (3,433) 0 0 (312) (3,433) .00 Depreciation & Amortization
(312) (312) 0 (3,433) (3,433) 0 Total Non-Cash Items (312) (3,433) .00
Change In Net Assets (41,394) (52,892) (484,814) (583,402) 11,498 98,588 (526,348)(41,700) (16.90)
UNAUDITED
For Internal Use Only

Period Ending May 31, 2018
Actual Amounts Vs. Approved Budget ComparisonPage 1 of 1
6/7/2018 11:35:43PM
GlJdeAdministrativeIncomeStatementByBusinessUnit
Summarized Income Statement by Business UnitSAHFC Property Mgmt Admin
rp_GlJdeAdministrativeIncomeStatementByBusinessUnit
Account Description
Current Month Year-To-Date
Actual Budget Variance Actual Budget VarianceLast YearLast Year %
Revenue
583 583 100.00 Bad Debt, Net of Collections
2,571 Miscellaneous Revenue
583 583 Net Revenue 2,571 100.00
Operating Expense
22,594 19,433 227,409 213,768 13,641 3,161 6.38 Salaries and Benefits
147 2,262 2,262 147 100.00 Fleet Costs
4 37 37 4 100.00 Outside Services
10 418 3,038 5,184 (2,146)(408) (41.39)Insurance
1,979 5,073 48,716 55,804 (7,088)(3,094) (12.70)Other Expenses
24,735 24,925 (189) 281,463 274,757 6,706 Total Operating Expense 2.44
Total Operating Income (24,735) (24,925) (280,880) (274,757) 189 (6,124) 2,571 2.23
Non-Operating Income (Expense)
1,614 1,614 100.00 Other Income (Expense)
22,519 14,602 256,679 160,617 96,062 7,917 (17,335) 15,690 59.81 Management Fees
22,519 14,602 7,917 258,293 160,617 97,676 Total Non-Operating Income (Expense) (17,335) 15,690 60.81
Surplus or Deficit Prior to Non-Cash Items (2,217) (10,323) (22,587) (114,140) 8,106 91,553 18,261 (17,335) (80.21)
Non-Cash Items
(389) (3,889) (3,889)(389) 100.00 Depreciation & Amortization
(389) (389) (3,889) (3,889)Total Non-Cash Items 100.00
Change In Net Assets (2,606) (10,323) (26,477) (114,140) 7,718 87,663 18,261 (17,335) (76.80)
UNAUDITED
For Internal Use Only

Period Ending May 31, 2018
Actual Amounts Vs. Approved Budget ComparisonPage 1 of 1
6/7/2018 11:35:46PM
GlJdeAdministrativeIncomeStatementByBusinessUnit
Summarized Income Statement by Business UnitProperty Management - PH
rp_GlJdeAdministrativeIncomeStatementByBusinessUnit
Account Description
Current Month Year-To-Date
Actual Budget Variance Actual Budget VarianceLast YearLast Year %
Operating Expense
82,635 77,682 850,085 854,497 (4,412) 4,953 97,491 1,054,644 (.52)Salaries and Benefits
37 Supplies and Materials
754 133 4,085 1,467 2,618 620 92 876 178.54 Fleet Costs
693 17 2,484 183 2,301 676 35 454 1,254.80 Outside Services
(210) 269 269 (210) 100.00 Protective Services
39 1,269 10,226 16,319 (6,093)(1,230) 83 10,595 (37.34)Insurance
15,417 26,270 218,227 288,975 (70,748)(10,853) 19,939 211,153 (24.48)Other Expenses
99,327 105,371 (6,044) 1,085,376 1,161,442 (76,065)Total Operating Expense 117,641 1,277,760 (6.55)
Total Operating Income (99,327) (105,371) (1,085,376) (1,161,442) 6,044 76,065 (1,277,760)(117,641) (6.55)
Non-Operating Income (Expense)
(2,995) (62,995) (62,995)(2,995) 7,450 100.00 Other Income (Expense)
(371) (98) (8,159) (1,081) (7,079)(272)(338) (6,022) 654.97 Management Fees
(3,366) (98) (3,267) (71,154) (1,081) (70,074)Total Non-Operating Income (Expense) (338) 1,428 6,483.79
Surplus or Deficit Prior to Non-Cash Items (102,693) (105,469) (1,156,531) (1,162,522) 2,776 5,992 (1,276,332)(117,979) (0.52)
Non-Cash Items
(242) (89) (1,745) (981) (764)(153)(89) (4,196) 77.91 Depreciation & Amortization
(242) (89) (153) (1,745) (981) (764)Total Non-Cash Items (89) (4,196) 77.91
Change In Net Assets (102,935) (105,558) (1,158,276) (1,163,503) 2,623 5,227 (1,280,528)(118,068) (0.45)
UNAUDITED
For Internal Use Only

Period Ending May 31, 2018
Actual Amounts Vs. Approved Budget ComparisonPage 1 of 1
6/7/2018 11:35:48PM
GlJdeAdministrativeIncomeStatementByBusinessUnit
Summarized Income Statement by Business UnitPublic Affairs
rp_GlJdeAdministrativeIncomeStatementByBusinessUnit
Account Description
Current Month Year-To-Date
Actual Budget Variance Actual Budget VarianceLast YearLast Year %
Revenue
2,981 3,850 36,131 42,345 (6,215)(868) 3,863 29,670 (14.68)Miscellaneous Revenue
2,981 3,850 (868) 36,131 42,345 (6,215)Net Revenue 3,863 29,670 (14.68)
Operating Expense
17,959 37,581 247,305 413,391 (166,086)(19,622) 26,762 292,121 (40.18)Salaries and Benefits
61 675 (675)(61) 430 (100.00)Outside Services
19 462 4,244 6,103 (1,859)(443) 31 3,566 (30.46)Insurance
18,212 18,924 155,958 208,167 (52,209)(713) 23,167 137,572 (25.08)Other Expenses
36,190 57,029 (20,839) 407,507 628,337 (220,829)Total Operating Expense 49,960 433,689 (35.15)
Total Operating Income (33,208) (53,179) (371,377) (585,991) 19,971 214,614 (404,019)(46,097) (36.62)
Non-Operating Income (Expense)
4,543 7,426 52,069 81,685 (29,616)(2,883) 6,407 56,548 (36.26)Management Fees
4,543 7,426 (2,883) 52,069 81,685 (29,616)Total Non-Operating Income (Expense) 6,407 56,548 (36.26)
Surplus or Deficit Prior to Non-Cash Items (28,666) (45,753) (319,307) (504,306) 17,088 184,999 (347,471)(39,690) (36.68)
Non-Cash Items
Depreciation & Amortization
Total Non-Cash Items
Change In Net Assets (28,666) (45,753) (319,307) (504,306) 17,088 184,999 (347,471)(39,690) (36.68)
UNAUDITED
For Internal Use Only

Period Ending May 31, 2018
Actual Amounts Vs. Approved Budget ComparisonPage 1 of 1
6/7/2018 11:35:49PM
GlJdeAdministrativeIncomeStatementByBusinessUnit
Summarized Income Statement by Business UnitDev Srvcs & Neighborhood Rev
rp_GlJdeAdministrativeIncomeStatementByBusinessUnit
Account Description
Current Month Year-To-Date
Actual Budget Variance Actual Budget VarianceLast YearLast Year %
Operating Expense
50,817 48,781 514,504 536,595 (22,091) 2,035 48,122 727,071 (4.12)Salaries and Benefits
5 100 57 43 (5) 75.72 Supplies and Materials
112 1,101 1,133 12,111 (10,978)(989) 1,138 4,525 (90.65)Fleet Costs
813 812 8,447 8,928 (481) 2 1,261 10,486 (5.39)Outside Services
52 2,265 10,962 27,340 (16,377)(2,213) 98 19,241 (59.90)Insurance
10,563 33,643 424,565 370,076 54,489 (23,080) 11,372 110,196 14.72 Other Expenses
62,357 86,607 (24,250) 959,712 955,107 4,605 Total Operating Expense 61,991 871,519 .48
Total Operating Income (62,357) (86,607) (959,712) (955,107) 24,250 (4,605)(871,519)(61,991) 0.48
Non-Operating Income (Expense)
(1,489) (22,813) (9,021) (13,792)(1,489)(639) (14,154) 152.89 Interest Expense
165 165 165 165 100.00 Interest Income
615 615 615 615 100.00 Other Income (Expense)
(206) (295) (1,766) (3,241) 1,475 89 (83) (3,201) (45.50)Management Fees
724,984 1,028,963 1,028,963 724,984 1,023,521 100.00 Transfers
724,070 (295) 724,365 1,005,164 (12,262) 1,017,425 Total Non-Operating Income (Expense) (722) 1,006,166 (8,297.69)
Surplus or Deficit Prior to Non-Cash Items 661,713 (86,902) 45,452 (967,368) 748,614 1,012,820 134,647 (62,713) (104.70)
Non-Cash Items
(335) (335) (3,681) (3,681)(335) (3,681)Depreciation & Amortization
250,000 250,000 100.00 Non-Oper Income (Expense)
(335) (335) 246,319 (3,681) 250,000 Total Non-Cash Items (335) (3,681) (6,791.36)
Change In Net Assets 661,378 (87,236) 291,771 (971,049) 748,614 1,262,820 130,965 (63,048) (130.05)
UNAUDITED
For Internal Use Only

Period Ending May 31, 2018
Actual Amounts Vs. Approved Budget ComparisonPage 1 of 1
6/7/2018 11:35:51PM
GlJdeAdministrativeIncomeStatementByBusinessUnit
Summarized Income Statement by Business UnitReceivable Transaction Process
rp_GlJdeAdministrativeIncomeStatementByBusinessUnit
Account Description
Current Month Year-To-Date
Actual Budget Variance Actual Budget VarianceLast YearLast Year %
Operating Expense
609 411 6,455 4,523 1,931 198 580 4,631 42.70 Salaries and Benefits
0 8 80 112 (32)(8) 1 66 (28.70)Insurance
939 3,827 43,517 42,100 1,417 (2,889) 3,741 39,962 3.37 Other Expenses
1,548 4,247 (2,699) 50,052 46,735 3,317 Total Operating Expense 4,322 44,659 7.10
Total Operating Income (1,548) (4,247) (50,052) (46,735) 2,699 (3,317)(44,659)(4,322) 7.10
Non-Operating Income (Expense)
1,548 4,248 50,052 46,727 3,325 (2,700) 4,322 44,659 7.12 Management Fees
1,548 4,248 (2,700) 50,052 46,727 3,325 Total Non-Operating Income (Expense) 4,322 44,659 7.12
Surplus or Deficit Prior to Non-Cash Items 1 (8)(1) 8 (100.00)
UNAUDITED
For Internal Use Only

Period Ending May 31, 2018
Actual Amounts Vs. Approved Budget ComparisonPage 1 of 1
6/7/2018 11:35:57PM
GlJdeAdministrativeIncomeStatementByBusinessUnit
Summarized Income Statement by Business UnitRegulatory Oversight
rp_GlJdeAdministrativeIncomeStatementByBusinessUnit
Account Description
Current Month Year-To-Date
Actual Budget Variance Actual Budget VarianceLast YearLast Year %
Operating Expense
10,975 7,284 82,177 80,127 2,050 3,691 2,692 24,987 2.56 Salaries and Benefits
92 44 1,008 (965)(92) (296) (95.65)Fleet Costs
6 140 1,088 1,767 (679)(134) 4 827 (38.42)Insurance
3,835 1,948 18,242 21,577 (3,335) 1,887 1,548 10,298 (15.46)Other Expenses
14,816 9,464 5,352 101,551 104,479 (2,928)Total Operating Expense 4,244 35,815 (2.80)
Total Operating Income (14,816) (9,464) (101,551) (104,479)(5,352) 2,928 (35,815)(4,244) (2.80)
Non-Operating Income (Expense)
504 504 100.00 Other Income (Expense)
2,053 1,327 14,083 14,602 (519) 726 591 4,963 (3.55)Management Fees
2,053 1,327 726 14,587 14,602 (15)Total Non-Operating Income (Expense) 591 4,963 (.10)
Surplus or Deficit Prior to Non-Cash Items (12,762) (8,136) (86,965) (89,878)(4,626) 2,913 (30,852)(3,653) (3.24)
UNAUDITED
For Internal Use Only

Period Ending May 31, 2018
Actual Amounts Vs. Approved Budget ComparisonPage 1 of 1
6/7/2018 11:35:58PM
GlJdeAdministrativeIncomeStatementByBusinessUnit
Summarized Income Statement by Business UnitRisk Management
rp_GlJdeAdministrativeIncomeStatementByBusinessUnit
Account Description
Current Month Year-To-Date
Actual Budget Variance Actual Budget VarianceLast YearLast Year %
Revenue
68,762 68,762 75,054 100.00 Miscellaneous Revenue
68,762 68,762 Net Revenue 75,054 100.00
Operating Expense
6,432 18,229 69,339 203,022 (133,683)(11,797) 9,200 168,000 (65.85)Salaries and Benefits
174 Supplies and Materials
14 213 1,884 2,812 (928)(199) 11 1,262 (32.99)Insurance
2,756 2,397 24,567 26,472 (1,905) 358 4,169 23,153 (7.20)Other Expenses
9,202 20,840 (11,638) 95,790 232,306 (136,516)Total Operating Expense 13,380 192,588 (58.77)
Total Operating Income (9,202) (20,840) (27,028) (232,306) 11,638 205,278 (117,534)(13,380) (88.37)
Non-Operating Income (Expense)
960 2,691 10,316 29,606 (19,290)(1,732) 1,864 16,263 (65.16)Management Fees
960 2,691 (1,732) 10,316 29,606 (19,290)Total Non-Operating Income (Expense) 1,864 16,263 (65.16)
Surplus or Deficit Prior to Non-Cash Items (8,243) (18,149) (16,712) (202,700) 9,906 185,988 (101,271)(11,516) (91.76)
UNAUDITED
For Internal Use Only
Period Ending May 31, 2018
Actual Amounts Vs. Approved Budget ComparisonPage 1 of 1
6/7/2018 11:36:00PM
GlJdeAdministrativeIncomeStatementByBusinessUnit
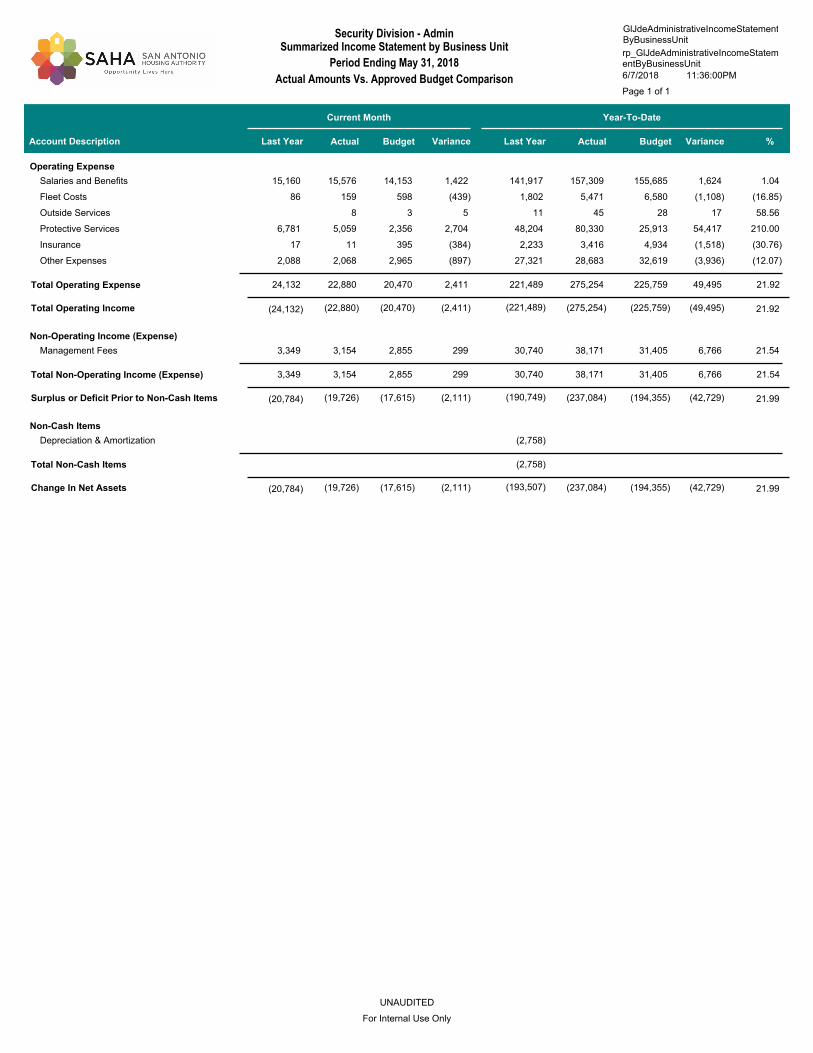
Summarized Income Statement by Business UnitSecurity Division - Admin
rp_GlJdeAdministrativeIncomeStatementByBusinessUnit
Account Description
Current Month Year-To-Date
Actual Budget Variance Actual Budget VarianceLast YearLast Year %
Operating Expense
15,576 14,153 157,309 155,685 1,624 1,422 15,160 141,917 1.04 Salaries and Benefits
159 598 5,471 6,580 (1,108)(439) 86 1,802 (16.85)Fleet Costs
8 3 45 28 17 5 11 58.56 Outside Services
5,059 2,356 80,330 25,913 54,417 2,704 6,781 48,204 210.00 Protective Services
11 395 3,416 4,934 (1,518)(384) 17 2,233 (30.76)Insurance
2,068 2,965 28,683 32,619 (3,936)(897) 2,088 27,321 (12.07)Other Expenses
22,880 20,470 2,411 275,254 225,759 49,495 Total Operating Expense 24,132 221,489 21.92
Total Operating Income (22,880) (20,470) (275,254) (225,759)(2,411) (49,495)(221,489)(24,132) 21.92
Non-Operating Income (Expense)
3,154 2,855 38,171 31,405 6,766 299 3,349 30,740 21.54 Management Fees
3,154 2,855 299 38,171 31,405 6,766 Total Non-Operating Income (Expense) 3,349 30,740 21.54
Surplus or Deficit Prior to Non-Cash Items (19,726) (17,615) (237,084) (194,355)(2,111) (42,729)(190,749)(20,784) 21.99
Non-Cash Items
(2,758)Depreciation & Amortization
Total Non-Cash Items (2,758)
Change In Net Assets (19,726) (17,615) (237,084) (194,355)(2,111) (42,729)(193,507)(20,784) 21.99
UNAUDITED
For Internal Use Only

Period Ending May 31, 2018
Actual Amounts Vs. Approved Budget ComparisonPage 1 of 1
6/7/2018 11:36:03PM
GlJdeAdministrativeIncomeStatementByBusinessUnit
Summarized Income Statement by Business UnitSecurity Division
rp_GlJdeAdministrativeIncomeStatementByBusinessUnit
Account Description
Current Month Year-To-Date
Actual Budget Variance Actual Budget VarianceLast YearLast Year %
Revenue
10 Miscellaneous Revenue
Net Revenue 10
Operating Expense
1 15 Salaries and Benefits
225 268 2,474 (2,205)(225) 117 4,457 (89.15)Fleet Costs
2 3 17 (14)(2) 10 (82.06)Outside Services
3,218 24,206 Protective Services
43 76 477 (401)(43) 8 1,698 (84.05)Insurance
220 50 2,422 (2,372)(220) 19 841 (97.94)Other Expenses
490 (490) 398 5,390 (4,992)Total Operating Expense 3,363 31,225 (92.62)
Total Operating Income (490) (398) (5,390) 490 4,992 (31,215)(3,363) (92.62)
Non-Operating Income (Expense)
490 403 5,390 (4,987)(490) 3,363 33,322 (92.52)Management Fees
490 (490) 403 5,390 (4,987)Total Non-Operating Income (Expense) 3,363 33,322 (92.52)
Surplus or Deficit Prior to Non-Cash Items 5 5 2,106 0.00
Non-Cash Items
(2,068)Depreciation & Amortization
Total Non-Cash Items (2,068)
Change In Net Assets 5 5 39 0.00
UNAUDITED
For Internal Use Only

Period Ending May 31, 2018
Actual Amounts Vs. Approved Budget ComparisonPage 1 of 1
6/7/2018 11:36:10PM
GlJdeAdministrativeIncomeStatementByBusinessUnit
Summarized Income Statement by Business UnitService Coordination
rp_GlJdeAdministrativeIncomeStatementByBusinessUnit
Account Description
Current Month Year-To-Date
Actual Budget Variance Actual Budget VarianceLast YearLast Year %
Revenue
2,400 2,400 12,000 26,400 (14,400) 2,400 24,000 (54.55)Miscellaneous Revenue
2,400 2,400 12,000 26,400 (14,400)Net Revenue 2,400 24,000 (54.55)
Operating Expense
2,857 2,205 27,036 24,254 2,782 652 1,303 23,614 11.47 Salaries and Benefits
2 37 359 496 (138)(36) 3 265 (27.72)Insurance
8 35 423 387 36 (27) 1 294 9.24 Other Expenses
2,867 2,277 589 27,817 25,138 2,680 Total Operating Expense 1,307 24,173 10.66
Total Operating Income (467) 123 (15,817) 1,262 (589) (17,080)(173) 1,093 (1,353.03)
UNAUDITED
For Internal Use Only

Period Ending May 31, 2018
Actual Amounts Vs. Approved Budget ComparisonPage 1 of 1
6/7/2018 11:36:22PM
GlJdeAdministrativeIncomeStatementByBusinessUnit
Summarized Income Statement by Business UnitInnovative Technology Services
rp_GlJdeAdministrativeIncomeStatementByBusinessUnit
Account Description
Current Month Year-To-Date
Actual Budget Variance Actual Budget VarianceLast YearLast Year %
Revenue
46,113 48,565 471,645 534,219 (62,574)(2,452) 43,551 459,091 (11.71)Miscellaneous Revenue
46,113 48,565 (2,452) 471,645 534,219 (62,574)Net Revenue 43,551 459,091 (11.71)
Operating Expense
39,848 40,367 399,261 444,034 (44,773)(519) 39,827 394,530 (10.08)Salaries and Benefits
87 Supplies and Materials
174 167 775 1,833 (1,058) 8 941 (57.72)Fleet Costs
4 4 4 4 6 100.00 Outside Services
21 666 5,569 8,526 (2,957)(646) 40 5,005 (34.68)Insurance
3,995 6,137 58,161 67,504 (9,344)(2,142) 2,517 45,188 (13.84)Other Expenses
44,041 47,337 (3,295) 463,770 521,898 (58,128)Total Operating Expense 42,384 445,756 (11.14)
Total Operating Income 2,072 1,229 7,874 12,321 843 (4,446) 13,335 1,168 (36.09)
Non-Operating Income (Expense)
6,123 6,123 100.00 Other Income (Expense)
(614) (22) (1,190) (242) (948)(592)(27) (606) 391.52 Management Fees
(614) (22) (592) 4,932 (242) 5,175 Total Non-Operating Income (Expense) (27) (606) (2,137.29)
Surplus or Deficit Prior to Non-Cash Items 1,458 1,207 12,807 12,079 251 728 12,729 1,141 6.03
Non-Cash Items
(1,458) (1,141) (12,866) (12,549) (317)(317)(1,141) (12,549) 2.53 Depreciation & Amortization
(1,458) (1,141) (317) (12,866) (12,549) (317)Total Non-Cash Items (1,141) (12,549) 2.53
Change In Net Assets 66 (59) (470)(66) 411 180 (87.43)
UNAUDITED
For Internal Use Only

Period Ending May 31, 2018
Actual Amounts Vs. Approved Budget ComparisonPage 1 of 1
6/7/2018 11:36:16PM
GlJdeAdministrativeIncomeStatementByBusinessUnit
Summarized Income Statement by Business UnitInnovative Technology Admin
rp_GlJdeAdministrativeIncomeStatementByBusinessUnit
Account Description
Current Month Year-To-Date
Actual Budget Variance Actual Budget VarianceLast YearLast Year %
Operating Expense
52,655 50,230 524,932 552,532 (27,600) 2,425 49,792 502,402 (5.00)Salaries and Benefits
14 332 3,439 4,455 (1,017)(318) 26 2,773 (22.82)Insurance
4,391 6,735 73,171 74,085 (914)(2,344) 8,412 91,106 (1.23)Other Expenses
57,060 57,297 (237) 601,542 631,073 (29,531)Total Operating Expense 58,230 596,280 (4.68)
Total Operating Income (57,060) (57,297) (601,542) (631,073) 237 29,531 (596,280)(58,230) (4.68)
Non-Operating Income (Expense)
8,006 7,956 85,918 87,512 (1,594) 50 7,987 82,051 (1.82)Management Fees
8,006 7,956 50 85,918 87,512 (1,594)Total Non-Operating Income (Expense) 7,987 82,051 (1.82)
Surplus or Deficit Prior to Non-Cash Items (49,054) (49,341) (515,624) (543,561) 287 27,938 (514,229)(50,244) (5.14)
Non-Cash Items
(995) (268) (10,940) (2,943) (7,997)(727)(268) (2,943) 271.77 Depreciation & Amortization
(995) (268) (727) (10,940) (2,943) (7,997)Total Non-Cash Items (268) (2,943) 271.77
Change In Net Assets (50,048) (49,609) (526,564) (546,504)(440) 19,940 (517,172)(50,511) (3.65)
UNAUDITED
For Internal Use Only

Period Ending May 31, 2018
Actual Amounts Vs. Approved Budget ComparisonPage 1 of 1
6/7/2018 11:36:24PM
GlJdeAdministrativeIncomeStatementByBusinessUnit
Summarized Income Statement by Business UnitUAC (Formerly AOD)
rp_GlJdeAdministrativeIncomeStatementByBusinessUnit
Account Description
Current Month Year-To-Date
Actual Budget Variance Actual Budget VarianceLast YearLast Year %
Operating Expense
23,979 25,869 277,066 284,564 (7,498)(1,890) 27,719 293,566 (2.63)Salaries and Benefits
338 616 616 338 100.00 Outside Services
41 Protective Services
17 414 4,187 5,564 (1,376)(396) 36 3,821 (24.74)Insurance
4,069 8,517 85,487 93,682 (8,195)(4,448) 5,263 61,668 (8.75)Other Expenses
28,403 34,800 (6,397) 367,356 383,809 (16,453)Total Operating Expense 33,018 359,096 (4.29)
Total Operating Income (28,403) (34,800) (367,356) (383,809) 6,397 16,453 (359,096)(33,018) (4.29)
Non-Operating Income (Expense)
28,403 34,856 367,356 383,416 (16,061)(6,453) 33,018 359,224 (4.19)Management Fees
28,403 34,856 (6,453) 367,356 383,416 (16,061)Total Non-Operating Income (Expense) 33,018 359,224 (4.19)
Surplus or Deficit Prior to Non-Cash Items 56 (393)(56) 393 129 (100.00)
UNAUDITED
For Internal Use Only
Period Ending May 31, 2018
Actual Amounts Vs. Approved Budget ComparisonPage 1 of 2
6/7/2018 11:35:20PM
GlJdeIncomeStatementByLineOfBusiness
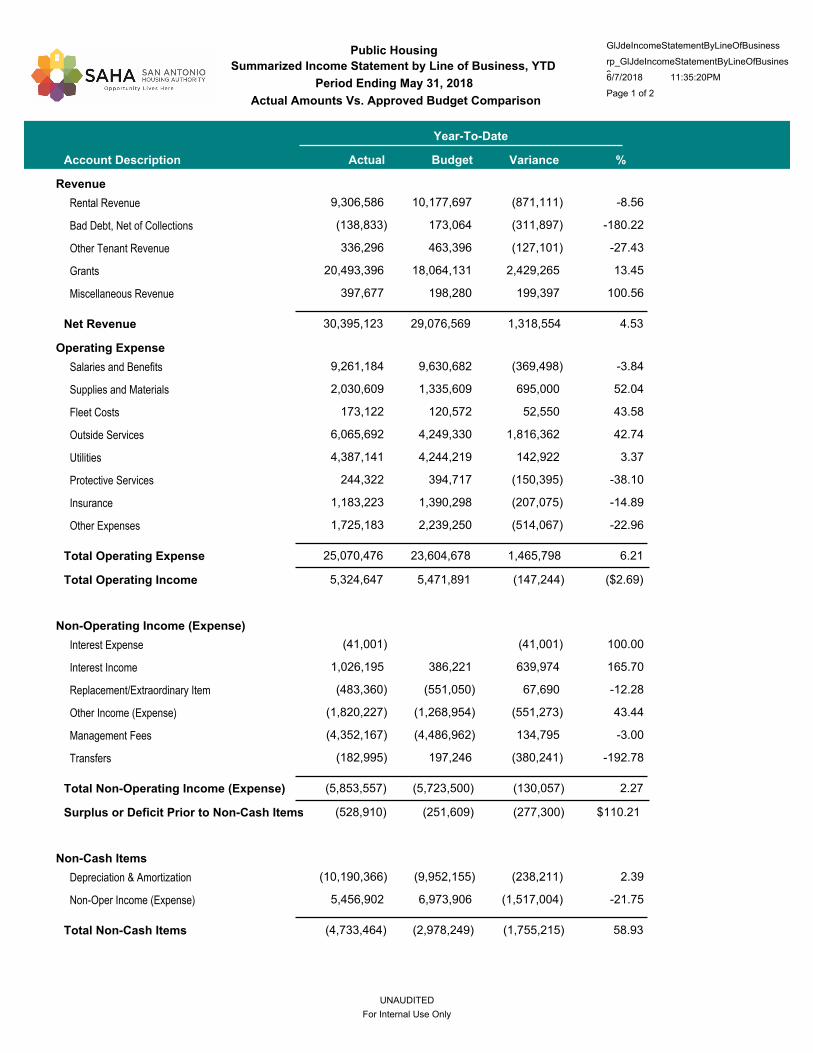
Summarized Income Statement by Line of Business, YTD
Public Housingrp_GlJdeIncomeStatementByLineOfBusiness
Account Description
Year-To-Date
Actual Budget Variance %
Revenue
9,306,586 10,177,697 (871,111)Rental Revenue -8.56
(138,833) 173,064 (311,897)Bad Debt, Net of Collections -180.22
336,296 463,396 (127,101)Other Tenant Revenue -27.43
20,493,396 18,064,131 2,429,265 Grants 13.45
397,677 198,280 199,397 Miscellaneous Revenue 100.56
30,395,123 29,076,569 1,318,554 Net Revenue 4.53
Operating Expense
9,261,184 9,630,682 (369,498)Salaries and Benefits -3.84
2,030,609 1,335,609 695,000 Supplies and Materials 52.04
173,122 120,572 52,550 Fleet Costs 43.58
6,065,692 4,249,330 1,816,362 Outside Services 42.74
4,387,141 4,244,219 142,922 Utilities 3.37
244,322 394,717 (150,395)Protective Services -38.10
1,183,223 1,390,298 (207,075)Insurance -14.89
1,725,183 2,239,250 (514,067)Other Expenses -22.96
25,070,476 23,604,678 1,465,798 Total Operating Expense 6.21
Total Operating Income 5,324,647 5,471,891 (147,244) ($2.69)
Non-Operating Income (Expense)
(41,001) (41,001)Interest Expense 100.00
1,026,195 386,221 639,974 Interest Income 165.70
(483,360) (551,050) 67,690 Replacement/Extraordinary Item -12.28
(1,820,227) (1,268,954) (551,273)Other Income (Expense) 43.44
(4,352,167) (4,486,962) 134,795 Management Fees -3.00
(182,995) 197,246 (380,241)Transfers -192.78
(5,853,557) (5,723,500) (130,057)Total Non-Operating Income (Expense) 2.27
Surplus or Deficit Prior to Non-Cash Items (528,910) (251,609) (277,300) $110.21
Non-Cash Items
(10,190,366) (9,952,155) (238,211)Depreciation & Amortization 2.39
5,456,902 6,973,906 (1,517,004)Non-Oper Income (Expense) -21.75
(4,733,464) (2,978,249) (1,755,215)Total Non-Cash Items 58.93
UNAUDITED
For Internal Use Only

Period Ending May 31, 2018
Actual Amounts Vs. Approved Budget ComparisonPage 2 of 2
6/7/2018 11:35:20PM
GlJdeIncomeStatementByLineOfBusiness
Summarized Income Statement by Line of Business, YTD
Public Housingrp_GlJdeIncomeStatementByLineOfBusiness
Account Description
Year-To-Date
Actual Budget Variance %
Change In Net Assets (5,262,373) (3,229,858) (2,032,515) $62.93
0K
4,000K
8,000K
12,000K
16,000K
20,000K
19,999K
9,307K
718K 692K 279K 215K 170K 170K 164K 138K
Grant Inc-PHOperating Subsidy
Dwelling Rental
Recovery - TenantMaint
Interest on Notes
Add'l OS AddOn forEPC
OS for EPC Util Savings
Non Dwelling Rental
Interest on Mortgages
Fraud Recovery
Other Income
Top 10 Sources of Revenue
Year-To-Date
0K
500K
1000K
1500K
2000K
2500K
3000K
3500K
3,209K3,038K
2,636K2,380K
1,648K1,560K1,435K1,379K1,106K
875K
Operating TransfersOut
Management Fee -Internal
Admin - Salaries
Maint - Salaries
Electricity
Unit Make Ready
Water
Other GeneralExpenses
Sewer
Plumbing Repairs
Top 10 Operating Expenses
Yer-To-Date
0K
100K
200K
300K
400K
500K
600K
592K
449K 435K379K
339K
269K233K 225K 216K
185K
Unit Make Ready
Maint - ContractLabor
Interest on Notes
Annual Leave
Plumbing Repairs
HVAC Repairs
Holiday
Lawn Services
Other MaintenanceContracts
Solid Waste Disposal
Top 10 Variances Over Budget
Year-To-Date
-800000
-400000
0400000
800000
1200000
16000002017
-800000
-400000
0400000
800000
1200000
16000002018
AA
BA
Surplus (Deficit) Prior to Non-Cash Items
Year-To-Date
UNAUDITED
For Internal Use Only

Period Ending May 31, 2018
Actual Amounts Vs. Approved Budget Comparison Page 1 of 2
6/7/2018 11:34:42PM
GlJdeIncomeStatementByLineOfBusinessByGroup
Summarized Income Statement by Line of Business, YTDrp_GlJdeIncomeStatementByLineOfBusinessByGroup
Public HousingGroup A
Account Description
Current Month Year-To-Date
Actual Budget Variance Actual Budget VarianceLast YearLast Year %
Revenue
458,047 4,861,061 5,247,314 (386,253)(18,982) 435,896 4,768,854 Rental Revenue (7.36) 477,029
(6,583) (103,865) 99,359 (203,224)(15,616) 7,868 (28,206)Bad Debt, Net of Collections (204.53) 9,033
12,118 155,567 214,977 (59,410)(7,425) 14,479 167,280 Other Tenant Revenue (27.64) 19,543
1,008,007 9,553,734 8,514,641 1,039,093 233,949 783,265 8,789,832 Grants 12.20 774,058
22,884 229,244 82,126 147,118 15,418 14,071 201,964 Miscellaneous Revenue 179.14 7,466
14,695,741 14,158,418 537,323 Net Revenue 3.80 13,899,724 1,255,579 1,494,472 207,343 1,287,129
Operating Expense
476,775 4,956,574 5,274,096 (317,522)(2,688) 513,156 5,169,683 Salaries and Benefits (6.02) 479,463
150,995 1,191,253 733,035 458,218 84,359 86,512 1,043,100 Supplies and Materials 62.51 66,637
7,675 98,896 59,227 39,669 2,290 10,248 92,831 Fleet Costs 66.98 5,384
400,778 3,583,855 2,198,444 1,385,411 200,928 310,181 3,351,663 Outside Services 63.02 199,850
172,566 2,225,994 2,051,350 174,644 (13,209) 177,949 2,041,138 Utilities 8.51 185,775
8,890 145,448 231,851 (86,403)(12,188) 14,621 191,166 Protective Services (37.27) 21,077
141,849 672,938 826,731 (153,793) 68,574 624 459,875 Insurance (18.60) 73,275
HAP Expense
61,914 861,072 1,275,004 (413,932)(50,730) 52,221 903,055 Other Expenses (32.47) 112,644
13,736,030 12,649,737 1,086,293 Total Operating Expense 8.59 13,252,511 1,165,512 1,421,442 277,337 1,144,106
Total Operating Income 73,030 959,712 1,508,681 (69,993) (548,969) 647,213 90,067 (36.39) 143,023
Non-Operating Income (Expense)
(901) (11,267) (11,267)(901)(960) (7,235)Interest Expense 100.00
23,527 257,431 154,801 102,629 9,454 18,839 184,450 Interest Income 66.30 14,073
(19,491) (281,207) (222,136) (59,071) 704 (33,704) (380,889)Replacement/Extraordinary Item 26.59 (20,194)
(209) (61,523) (61,523)(209)(1,315) 233,035 Other Income (Expense) 100.00
(192,618) (2,146,875) (2,218,368) 71,493 9,052 (198,606) (2,180,353)Management Fees (3.22)(201,670)
(615) 4,238 104,670 (100,432)(10,130) 22,463 244,680 Transfers (95.95) 9,515
(2,239,203) (2,181,033) (58,171)Total Non-Operating Income (Expense) 2.67 (1,906,311)(193,284) (190,307) 7,969 (198,276)
Surplus or (Deficit) Prior to Non-Cash Items (117,277) (1,279,491) (672,352)(62,024) (607,140)(1,259,098)(103,217) 90.30 (55,253)
Non-Cash Items
(546,544) (5,363,390) (5,202,838) (160,551)(85,136)(521,630) (5,850,075)Depreciation & Amortization 3.09 (461,409)
778,492 1,365,066 3,525,917 (2,160,851) 457,954 (1,538) 394,753 Non-Oper Income (Expense) (61.28) 320,538
(3,998,323) (1,676,921) (2,321,402)Total Non-Cash Items 138.43 (5,455,322)(523,168) 231,948 372,818 (140,871)
Change In Net Assets 114,671 (5,277,815) (2,349,273) 310,794 (2,928,542)(6,714,420)(626,385) 124.66 (196,123)
UNAUDITED
For Internal Use Only

Period Ending May 31, 2018
Actual Amounts Vs. Approved Budget Comparison Page 2 of 2
6/7/2018 11:34:42PM
GlJdeIncomeStatementByLineOfBusinessByGroup
Summarized Income Statement by Line of Business, YTDrp_GlJdeIncomeStatementByLineOfBusinessByGroup
Public HousingGroup A
0K
400K
800K
1200K
1600K
2000K
2400K
2800K
3200K
2,843K
1,552K1,382K1,291K
966K757K 755K
611K 519K 504K
Operating TransfersOut
Management Fee -Internal
Admin - Salaries
Maint - Salaries
Unit Make Ready
Electricity
Water
Sewer
Lawn Services
Plumbing Repairs
Top 10 Operating Expenses
Year-To-Date
0K
100K
200K
300K
400K
500K
478K
249K226K 219K 202K
173K 164K125K 118K 103K
Unit Make Ready
Maint - ContractLabor
Plumbing Repairs
HVAC Repairs
Annual Leave
Other MaintenanceContracts
Lawn Services
Holiday
Solid Waste Disposal
Appliance Parts
Top 10 Variances Over Budget
Year-To-Date
-1,400K
-1,200K
-1,000K-800K-600K
-400K
-200K
0K2017
-1,400K
-1,200K
-1,000K-800K-600K
-400K
-200K
0K2018
AA
BA
Surplus (Deficit) Prior to Non-Cash Items
Year-to-Date
0K
2,000K
4,000K
6,000K
8,000K
10,000K
9,412K
4,861K
411K 170K 110K
Grant Inc-PHOperating Subsidy
Dwelling Rental
Recovery - TenantMaint
Interest on Notes
Fraud Recovery
Top 5 Sources of Revenue
Year-To-Date
UNAUDITED
For Internal Use Only
Period Ending May 31, 2018
Actual Amounts Vs. Approved Budget Comparison Page 1 of 1
6/7/2018 11:34:20PM
GlJdeIncomeStatementByCompany
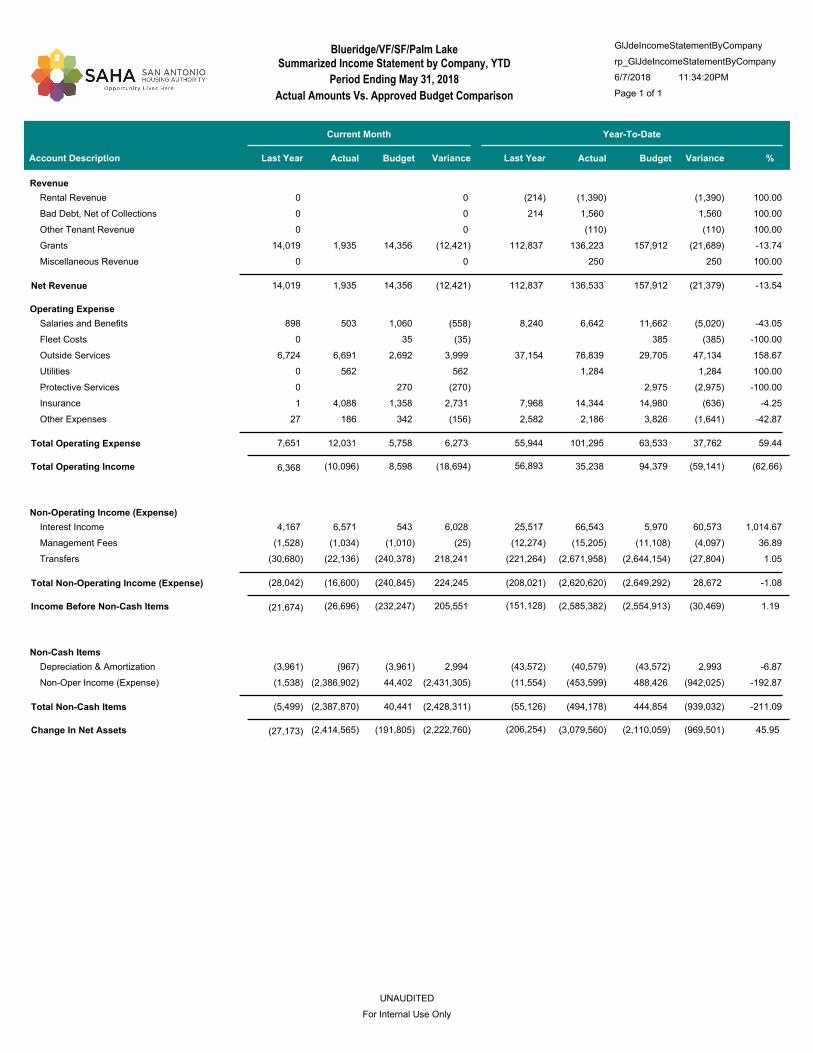
Summarized Income Statement by Company, YTDBlueridge/VF/SF/Palm Lake
rp_GlJdeIncomeStatementByCompany
Account Description
Current Month Year-To-Date
Actual Budget Variance Actual Budget VarianceLast YearLast Year %
Revenue
(1,390) (1,390) 0 0 (214) 100.00Rental Revenue
1,560 1,560 0 0 214 100.00Bad Debt, Net of Collections
(110) (110) 0 0 100.00Other Tenant Revenue
1,935 14,356 136,223 157,912 (21,689)(12,421) 14,019 112,837 -13.74Grants
250 250 0 0 100.00Miscellaneous Revenue
1,935 14,356 (12,421) 136,533 157,912 (21,379)Net Revenue 14,019 112,837 -13.54
Operating Expense
503 1,060 6,642 11,662 (5,020)(558) 898 8,240 -43.05Salaries and Benefits
35 385 (385)(35) 0 -100.00Fleet Costs
6,691 2,692 76,839 29,705 47,134 3,999 6,724 37,154 158.67Outside Services
562 1,284 1,284 562 0 100.00Utilities
270 2,975 (2,975)(270) 0 -100.00Protective Services
4,088 1,358 14,344 14,980 (636) 2,731 1 7,968 -4.25Insurance
186 342 2,186 3,826 (1,641)(156) 27 2,582 -42.87Other Expenses
12,031 5,758 6,273 101,295 63,533 37,762 Total Operating Expense 7,651 55,944 59.44
Total Operating Income (10,096) 8,598 35,238 94,379 (18,694) (59,141) 56,893 6,368 (62.66)
Non-Operating Income (Expense)
6,571 543 66,543 5,970 60,573 6,028 4,167 25,517 1,014.67Interest Income
(1,034) (1,010) (15,205) (11,108) (4,097)(25)(1,528) (12,274) 36.89Management Fees
(22,136) (240,378) (2,671,958) (2,644,154) (27,804) 218,241 (30,680) (221,264) 1.05Transfers
(16,600) (240,845) 224,245 (2,620,620) (2,649,292) 28,672 Total Non-Operating Income (Expense) (28,042) (208,021) -1.08
Income Before Non-Cash Items (26,696) (232,247) (2,585,382) (2,554,913) 205,551 (30,469)(151,128)(21,674) 1.19
Non-Cash Items
(967) (3,961) (40,579) (43,572) 2,993 2,994 (3,961) (43,572) -6.87Depreciation & Amortization
(2,386,902) 44,402 (453,599) 488,426 (942,025)(2,431,305)(1,538) (11,554) -192.87Non-Oper Income (Expense)
(2,387,870) 40,441 (2,428,311) (494,178) 444,854 (939,032)Total Non-Cash Items (5,499) (55,126) -211.09
Change In Net Assets (2,414,565) (191,805) (3,079,560) (2,110,059)(2,222,760) (969,501)(206,254)(27,173) 45.95
UNAUDITED
For Internal Use Only

Period Ending May 31, 2018
Actual Amounts Vs. Approved Budget Comparison Page 1 of 1
6/7/2018 11:34:23PM
GlJdeIncomeStatementByCompany
Summarized Income Statement by Company, YTDCassiano Homes
rp_GlJdeIncomeStatementByCompany
Account Description
Current Month Year-To-Date
Actual Budget Variance Actual Budget VarianceLast YearLast Year %
Revenue
46,776 46,833 521,610 515,167 6,443 (57) 49,920 516,677 1.25Rental Revenue
(9,032) (954) (42,303) (10,495) (31,807)(8,078) 2,813 (42,970) 303.06Bad Debt, Net of Collections
885 1,272 14,045 13,990 55 (387) 1,185 11,694 .39Other Tenant Revenue
258,119 196,447 2,421,042 2,160,920 260,122 61,672 198,786 2,213,219 12.04Grants
7,123 558 92,634 6,139 86,495 6,565 4,693 84,943 1,409.00Miscellaneous Revenue
303,871 244,156 59,715 3,007,028 2,685,721 321,307 Net Revenue 257,397 2,783,563 11.96
Operating Expense
78,937 82,370 836,585 906,073 (69,488)(3,434) 85,683 873,082 -7.67Salaries and Benefits
40,088 15,601 310,034 171,616 138,419 24,486 19,871 224,316 80.66Supplies and Materials
1,473 868 19,677 9,549 10,128 605 2,481 14,131 106.07Fleet Costs
95,758 42,351 894,049 465,861 428,188 53,407 55,414 745,187 91.91Outside Services
33,122 33,327 382,352 367,255 15,097 (205) 32,095 353,726 4.11Utilities
1,826 2,811 45,872 30,925 14,947 (985) 4,816 58,250 48.33Protective Services
31,040 14,770 141,324 165,863 (24,539) 16,271 109 92,419 -14.79Insurance
11,720 8,331 130,010 99,383 30,627 3,389 6,131 129,866 30.82Other Expenses
293,963 200,430 93,533 2,759,903 2,216,524 543,379 Total Operating Expense 206,600 2,490,978 24.51
Total Operating Income 9,908 43,726 247,125 469,197 (33,818) (222,072) 292,586 50,797 (47.33)
Non-Operating Income (Expense)
(263) (3,290) (3,290)(263)(280) (2,113) 100.00Interest Expense
695 6 6,778 64 6,714 689 435 1,294 10,542.24Interest Income
(402) (4,432) (52,474) (48,756) (3,718) 4,030 (9,173) (70,633) 7.63Replacement/Extraordinary Item
0 0 36,200 Other Income (Expense)
(29,762) (32,792) (337,613) (360,717) 23,105 3,031 (32,059) (347,050) -6.41Management Fees
(1,336) 1,607 (12,428) 17,679 (30,107)(2,943) 2,812 35,321 -170.30Transfers
(31,068) (35,612) 4,544 (399,027) (391,731) (7,296)Total Non-Operating Income (Expense) (38,266) (346,980) 1.86
Income Before Non-Cash Items (21,160) 8,114 (151,902) 77,466 (29,274) (229,368)(54,395) 12,531 (296.09)
Non-Cash Items
(57,748) (56,991) (633,841) (626,904) (6,937)(757)(57,436) (629,820) 1.11Depreciation & Amortization
0 0 Non-Oper Income (Expense)
(57,748) (56,991) (757) (633,841) (626,904) (6,937)Total Non-Cash Items (57,436) (629,820) 1.11
Change In Net Assets (78,908) (48,877) (785,744) (549,438)(30,031) (236,305)(684,215)(44,905) 43.01
UNAUDITED
For Internal Use Only

Period Ending May 31, 2018
Actual Amounts Vs. Approved Budget Comparison Page 1 of 1
6/7/2018 11:34:26PM
GlJdeIncomeStatementByCompany
Summarized Income Statement by Company, YTDCross Creek/Rutledge/Beldon
rp_GlJdeIncomeStatementByCompany
Account Description
Current Month Year-To-Date
Actual Budget Variance Actual Budget VarianceLast YearLast Year %
Revenue
23,000 26,115 258,375 287,268 (28,893)(3,115) 23,396 255,128 -10.06Rental Revenue
(5,290) 1,946 (4,700) 21,404 (26,104)(7,236)(5,498) (5,496) -121.96Bad Debt, Net of Collections
467 446 5,411 4,901 510 21 525 4,704 10.41Other Tenant Revenue
67,235 53,679 646,421 590,464 55,957 13,556 54,318 622,179 9.48Grants
1,830 603 31,470 6,633 24,836 1,227 0 8,868 374.41Miscellaneous Revenue
87,242 82,788 4,454 936,977 910,670 26,307 Net Revenue 72,741 885,383 2.89
Operating Expense
31,637 27,133 320,214 298,464 21,750 4,504 32,938 319,514 7.29Salaries and Benefits
13,077 4,131 99,297 45,475 53,822 8,946 5,936 75,079 118.35Supplies and Materials
438 585 5,416 6,440 (1,024)(148) 829 9,756 -15.90Fleet Costs
26,983 11,293 179,279 124,220 55,059 15,690 20,923 167,467 44.32Outside Services
14,192 13,329 147,092 146,934 158 863 11,344 135,934 .11Utilities
941 10,349 (10,349)(941) 0 3,910 -100.00Protective Services
8,642 4,365 40,206 49,231 (9,026) 4,276 43 26,782 -18.33Insurance
5,382 6,601 58,811 74,817 (16,006)(1,219) 4,367 60,726 -21.39Other Expenses
100,351 68,379 31,972 850,315 755,931 94,384 Total Operating Expense 76,380 799,169 12.49
Total Operating Income (13,109) 14,409 86,661 154,739 (27,519) (68,078) 86,214 (3,640) (44.00)
Non-Operating Income (Expense)
92 1 952 10 942 91 141 295 9,844.41Interest Income
(534) (2,416) (16,764) (26,573) 9,809 1,882 (1,508) (56,093) -36.91Replacement/Extraordinary Item
(1,785) (1,785) 0 0 293,368 100.00Other Income (Expense)
(12,175) (12,280) (133,770) (135,080) 1,310 105 (12,789) (133,523) -.97Management Fees
539 532 6,334 5,851 483 7 1,768 19,384 8.25Transfers
(12,078) (14,163) 2,085 (145,033) (155,793) 10,759 Total Non-Operating Income (Expense) (12,388) 123,430 -6.91
Income Before Non-Cash Items (25,187) 246 (58,372) (1,054)(25,434) (57,318) 209,645 (16,028) 5,439.76
Non-Cash Items
(14,756) (12,267) (177,581) (140,075) (37,506)(2,489)(15,317) (165,319) 26.78Depreciation & Amortization
4,927 765,671 54,200 711,471 (4,927) 0 (10,841) 1,312.68Non-Oper Income (Expense)
(14,756) (7,340) (7,416) 588,090 (85,875) 673,965 Total Non-Cash Items (15,317) (176,159) -784.82
Change In Net Assets (39,943) (7,093) 529,718 (86,929)(32,850) 616,647 33,485 (31,345) (709.37)
UNAUDITED
For Internal Use Only

Period Ending May 31, 2018
Actual Amounts Vs. Approved Budget Comparison Page 1 of 1
6/7/2018 11:34:43PM
GlJdeIncomeStatementByCompany
Summarized Income Statement by Company, YTDFair Avenue/Matt Garcia
rp_GlJdeIncomeStatementByCompany
Account Description
Current Month Year-To-Date
Actual Budget Variance Actual Budget VarianceLast YearLast Year %
Revenue
61,900 65,210 698,354 717,306 (18,952)(3,310) 63,346 689,644 -2.64Rental Revenue
3,347 139 (1,439) 1,531 (2,970) 3,208 262 9,309 -193.98Bad Debt, Net of Collections
432 1,046 6,491 11,507 (5,015)(614) 1,132 9,137 -43.59Other Tenant Revenue
63,377 46,287 587,730 509,161 78,569 17,090 46,942 510,663 15.43Grants
1,464 1,731 16,204 19,041 (2,837)(267) 1,489 51,853 -14.90Miscellaneous Revenue
130,520 114,413 16,107 1,307,340 1,258,546 48,794 Net Revenue 113,171 1,270,607 3.88
Operating Expense
44,116 48,359 461,414 531,946 (70,532)(4,242) 44,652 498,488 -13.26Salaries and Benefits
13,389 4,314 82,043 47,453 34,590 9,075 6,127 76,642 72.89Supplies and Materials
608 281 9,599 3,088 6,511 328 188 5,673 210.86Fleet Costs
31,167 9,508 211,804 104,584 107,220 21,659 17,532 249,917 102.52Outside Services
15,548 18,417 209,386 202,583 6,803 (2,869) 15,996 222,448 3.36Utilities
463 1,527 13,281 16,795 (3,514)(1,064) 2,669 33,990 -20.92Protective Services
7,484 3,417 39,595 39,568 26 4,067 56 21,116 .07Insurance
4,703 7,594 90,324 86,783 3,541 (2,892) 4,912 76,100 4.08Other Expenses
117,478 93,416 24,062 1,117,447 1,032,801 84,647 Total Operating Expense 92,133 1,184,374 8.20
Total Operating Income 13,042 20,997 189,893 225,745 (7,955) (35,852) 86,233 21,038 (15.88)
Non-Operating Income (Expense)
(638) (7,977) (7,977)(638)(680) (5,122) 100.00Interest Expense
324 0 1,157 5 1,152 324 17 98 25,549.67Interest Income
(2,069) (1,260) (17,405) (13,859) (3,546)(809)(2,513) (24,099) 25.59Replacement/Extraordinary Item
(5,420) (41,062) (41,062)(5,420) 0 61,466 100.00Other Income (Expense)
(17,506) (16,648) (179,249) (183,133) 3,884 (857)(16,162) (183,051) -2.12Management Fees
(6,296) 873 (66,004) 9,599 (75,604)(7,169)(5,527) (50,085) -787.58Transfers
(31,605) (17,035) (14,570) (310,541) (187,388) (123,153)Total Non-Operating Income (Expense) (24,865) (200,793) 65.72
Income Before Non-Cash Items (18,563) 3,962 (120,648) 38,358 (22,525) (159,006)(114,561)(3,827) (414.53)
Non-Cash Items
(31,314) (30,467) (348,080) (340,450) (7,630)(847)(31,034) (341,885) 2.24Depreciation & Amortization
271,208 1,337 2,983,292 (2,981,955)(271,208) 0 207,151 -99.96Non-Oper Income (Expense)
(31,314) 240,741 (272,055) (346,744) 2,642,841 (2,989,585)Total Non-Cash Items (31,034) (134,734) -113.12
Change In Net Assets (49,877) 244,703 (467,392) 2,681,199 (294,580) (3,148,591)(249,295)(34,861) (117.43)
UNAUDITED
For Internal Use Only

Period Ending May 31, 2018
Actual Amounts Vs. Approved Budget Comparison Page 1 of 1
6/7/2018 11:34:49PM
GlJdeIncomeStatementByCompany
Summarized Income Statement by Company, YTDHighview/W Sinkin
rp_GlJdeIncomeStatementByCompany
Account Description
Current Month Year-To-Date
Actual Budget Variance Actual Budget VarianceLast YearLast Year %
Revenue
25,954 24,877 262,999 273,651 (10,651) 1,077 23,534 264,225 -3.89Rental Revenue
120 1,039 (21,362) 11,432 (32,794)(919) 340 20,215 -286.87Bad Debt, Net of Collections
376 1,697 10,284 18,666 (8,383)(1,321) 885 10,818 -44.91Other Tenant Revenue
42,527 30,367 389,471 334,034 55,437 12,160 30,747 356,352 16.60Grants
13,887 13,887 0 0 8,681 100.00Miscellaneous Revenue
68,977 57,980 10,997 655,278 637,784 17,495 Net Revenue 55,506 660,291 2.74
Operating Expense
15,404 18,692 161,216 205,616 (44,400)(3,288) 11,339 183,349 -21.59Salaries and Benefits
3,233 4,351 58,767 47,866 10,901 (1,119) 687 72,377 22.77Supplies and Materials
1,284 169 6,569 1,862 4,706 1,114 0 2,283 252.73Fleet Costs
34,019 11,080 179,316 121,876 57,440 22,939 5,248 202,294 47.13Outside Services
10,371 11,615 132,456 127,762 4,693 (1,243) 10,861 129,723 3.67Utilities
1,361 665 5,197 7,313 (2,115) 697 295 4,507 -28.93Protective Services
6,161 2,992 28,384 33,688 (5,304) 3,170 22 18,144 -15.74Insurance
2,466 4,049 34,081 46,228 (12,148)(1,583) 1,921 34,668 -26.28Other Expenses
74,299 53,613 20,687 605,985 592,211 13,774 Total Operating Expense 30,374 647,345 2.33
Total Operating Income (5,322) 4,368 49,293 45,573 (9,690) 3,721 12,945 25,132 8.16
Non-Operating Income (Expense)
80 0 285 5 281 79 5 33 6,224.61Interest Income
(1,322) (15,951) (14,543) (1,408) 1,322 0 (25,276) 9.68Replacement/Extraordinary Item
(8,127) (8,338) (90,752) (91,717) 965 211 (7,999) (89,735) -1.05Management Fees
373 379 4,404 4,168 236 (6) 1,101 12,064 5.67Transfers
(7,674) (9,281) 1,607 (102,015) (102,088) 74 Total Non-Operating Income (Expense) (6,893) (102,914) -.07
Income Before Non-Cash Items (12,996) (4,913) (52,721) (56,516)(8,082) 3,795 (89,968) 18,239 (6.71)
Non-Cash Items
(7,485) (7,266) (87,365) (85,158) (2,207)(219)(9,896) (108,162) 2.59Depreciation & Amortization
(7,485) (7,266) (219) (87,365) (85,158) (2,207)Total Non-Cash Items (9,896) (108,162) 2.59
Change In Net Assets (20,481) (12,179) (140,086) (141,674)(8,302) 1,587 (198,130) 8,343 (1.12)
UNAUDITED
For Internal Use Only

Period Ending May 31, 2018
Actual Amounts Vs. Approved Budget Comparison Page 1 of 1
6/7/2018 11:34:53PM
GlJdeIncomeStatementByCompany
Summarized Income Statement by Company, YTDJewett Circle/G Cisneros
rp_GlJdeIncomeStatementByCompany
Account Description
Current Month Year-To-Date
Actual Budget Variance Actual Budget VarianceLast YearLast Year %
Revenue
26,574 26,333 293,442 289,667 3,775 241 25,164 290,452 1.30Rental Revenue
64 (2) (362) (17) (346) 66 945 (211) 2,094.42Bad Debt, Net of Collections
108 371 2,346 4,079 (1,733)(263) 348 3,071 -42.50Other Tenant Revenue
33,457 22,715 296,786 249,860 46,926 10,742 23,034 263,757 18.78Grants
25 42 50 458 (408)(17) 0 100 -89.09Miscellaneous Revenue
60,229 49,459 10,770 592,262 544,047 48,214 Net Revenue 49,492 557,169 8.86
Operating Expense
29,463 27,855 290,647 306,410 (15,763) 1,608 27,180 275,212 -5.14Salaries and Benefits
1,263 16,864 13,888 2,977 (1,263) 2,828 23,533 21.43Supplies and Materials
355 178 3,421 1,958 1,462 177 344 6,763 74.67Fleet Costs
6,611 3,914 71,934 43,052 28,882 2,697 6,488 71,507 67.09Outside Services
7,852 5,296 104,239 58,891 45,348 2,556 8,346 94,845 77.00Utilities
(66) 732 1,077 8,057 (6,980)(799) 141 1,346 -86.64Protective Services
5,295 2,891 26,926 33,082 (6,156) 2,405 38 17,565 -18.61Insurance
3,033 4,832 38,915 54,629 (15,714)(1,798) 2,613 42,529 -28.77Other Expenses
52,543 46,960 5,583 554,022 519,966 34,056 Total Operating Expense 47,978 533,299 6.55
Total Operating Income 7,686 2,499 38,239 24,081 5,187 14,158 23,870 1,514 58.80
Non-Operating Income (Expense)
57 213 213 57 15 62 100.00Interest Income
(317) (5,591) (3,483) (2,108) 317 (3,921) (11,597) 60.51Replacement/Extraordinary Item
761 761 0 0 100.00Other Income (Expense)
(9,023) (9,220) (98,099) (101,424) 3,325 197 (8,977) (100,202) -3.28Management Fees
408 424 4,886 4,667 219 (16) 731 7,907 4.69Transfers
(8,558) (9,113) 555 (97,830) (100,241) 2,410 Total Non-Operating Income (Expense) (12,153) (103,829) -2.40
Income Before Non-Cash Items (872) (6,614) (59,591) (76,160) 5,742 16,569 (79,960)(10,639) (21.76)
Non-Cash Items
(14,358) (14,141) (163,509) (161,293) (2,216)(217)(15,416) (194,618) 1.37Depreciation & Amortization
(14,358) (14,141) (217) (163,509) (161,293) (2,216)Total Non-Cash Items (15,416) (194,618) 1.37
Change In Net Assets (15,230) (20,755) (223,100) (237,453) 5,525 14,353 (274,578)(26,055) (6.04)
UNAUDITED
For Internal Use Only

Period Ending May 31, 2018
Actual Amounts Vs. Approved Budget Comparison Page 1 of 1
6/7/2018 11:34:57PM
GlJdeIncomeStatementByCompany
Summarized Income Statement by Company, YTDKenwood/Glen/Park Square
rp_GlJdeIncomeStatementByCompany
Account Description
Current Month Year-To-Date
Actual Budget Variance Actual Budget VarianceLast YearLast Year %
Revenue
26,027 23,492 260,444 258,408 2,035 2,535 20,556 237,015 .79Rental Revenue
(319) 334 (3,814) 3,675 (7,490)(653) 479 (10,204) -203.78Bad Debt, Net of Collections
516 2,249 11,841 24,741 (12,900)(1,733) 759 12,456 -52.14Other Tenant Revenue
30,174 24,073 293,232 264,802 28,430 6,101 24,380 267,032 10.74Grants
38 650 413 238 (38) 0 850 57.58Miscellaneous Revenue
56,398 50,185 6,213 562,352 552,039 10,313 Net Revenue 46,174 507,150 1.87
Operating Expense
17,648 17,845 197,079 196,299 780 (197) 20,057 180,430 .40Salaries and Benefits
4,551 1,938 37,209 21,313 15,896 2,613 615 28,616 74.59Supplies and Materials
166 469 1,830 (1,361)(166) 190 1,510 -74.37Fleet Costs
6,008 5,544 103,248 60,981 42,267 464 14,275 91,568 69.31Outside Services
8,860 10,586 130,003 118,071 11,932 (1,726) 9,793 111,256 10.11Utilities
642 1,077 7,065 (5,988)(642) 182 3,123 -84.76Protective Services
6,075 3,075 27,873 34,680 (6,807) 3,000 26 20,825 -19.63Insurance
1,653 3,018 25,927 34,688 (8,761)(1,365) 1,605 31,190 -25.26Other Expenses
44,795 42,814 1,981 522,884 474,927 47,956 Total Operating Expense 46,744 468,518 10.10
Total Operating Income 11,603 7,371 39,469 77,112 4,232 (37,643) 38,632 (569) (48.82)
Non-Operating Income (Expense)
102 2 322 19 303 100 23 120 1,564.31Interest Income
(459) (775) (15,194) (8,525) (6,669) 316 (2,122) (10,903) 78.23Replacement/Extraordinary Item
2,551 2,551 2,551 2,551 0 100.00Other Income (Expense)
(7,854) (8,402) (87,736) (92,417) 4,681 547 (7,833) (88,462) -5.06Management Fees
365 362 4,276 3,978 298 4 737 8,035 7.49Transfers
(5,295) (8,813) 3,518 (95,782) (96,944) 1,163 Total Non-Operating Income (Expense) (9,195) (91,209) -1.20
Income Before Non-Cash Items 6,308 (1,442) (56,313) (19,832) 7,750 (36,480)(52,578)(9,764) 183.94
Non-Cash Items
(7,519) (9,554) (97,450) (120,219) 22,769 2,035 (8,921) (147,645) -18.94Depreciation & Amortization
2,437 2,437 0 0 100.00Non-Oper Income (Expense)
(7,519) (9,554) 2,035 (95,013) (120,219) 25,206 Total Non-Cash Items (8,921) (147,645) -20.97
Change In Net Assets (1,211) (10,996) (151,326) (140,052) 9,785 (11,274)(200,223)(18,684) 8.05
UNAUDITED
For Internal Use Only

Period Ending May 31, 2018
Actual Amounts Vs. Approved Budget Comparison Page 1 of 1
6/7/2018 11:35:00PM
GlJdeIncomeStatementByCompany
Summarized Income Statement by Company, YTDLila Cockrell/South San
rp_GlJdeIncomeStatementByCompany
Account Description
Current Month Year-To-Date
Actual Budget Variance Actual Budget VarianceLast YearLast Year %
Revenue
16,593 20,171 186,532 221,882 (35,350)(3,578) 17,664 193,055 -15.93Rental Revenue
230 290 2,525 (2,235)(230) 0 1,223 -88.52Bad Debt, Net of Collections
234 368 3,401 4,052 (651)(135) 340 4,638 -16.06Other Tenant Revenue
20,021 16,603 191,130 182,637 8,493 3,418 16,852 189,913 4.65Grants
25 125 275 (150)(25) 50 425 -54.55Miscellaneous Revenue
36,848 37,397 (550) 381,478 411,371 (29,893)Net Revenue 34,906 389,254 -7.27
Operating Expense
10,802 9,496 106,302 104,455 1,847 1,306 20,697 177,876 1.77Salaries and Benefits
6,626 1,917 29,317 21,087 8,231 4,709 3,674 40,291 39.03Supplies and Materials
298 1,330 3,276 (1,946)(298) 0 2,422 -59.40Fleet Costs
27,073 6,801 101,874 74,816 27,058 20,271 6,309 91,405 36.17Outside Services
3,697 6,457 51,868 71,393 (19,525)(2,761) 3,493 49,524 -27.35Utilities
(210) 563 1,709 6,197 (4,488)(773) 94 4,018 -72.42Protective Services
3,460 1,884 15,805 21,236 (5,432) 1,576 26 12,628 -25.58Insurance
2,824 4,174 33,260 47,084 (13,824)(1,350) 2,149 34,250 -29.36Other Expenses
54,272 31,591 22,681 341,465 349,544 (8,079)Total Operating Expense 36,442 412,414 -2.31
Total Operating Income (17,425) 5,807 40,013 61,827 (23,231) (21,814)(23,160)(1,536) (35.28)
Non-Operating Income (Expense)
34 163 163 34 0 12 100.00Interest Income
(1,481) (483) (6,111) (5,317) (794)(998) 732 (13,470) 14.93Replacement/Extraordinary Item
1,312 1,312 0 0 100.00Other Income (Expense)
(6,741) (6,996) (75,539) (76,960) 1,421 255 (6,760) (75,711) -1.85Management Fees
313 316 3,810 3,472 338 (3) 622 6,787 9.74Transfers
(7,875) (7,164) (711) (76,365) (78,805) 2,440 Total Non-Operating Income (Expense) (5,406) (82,382) -3.10
Income Before Non-Cash Items (25,299) (1,358) (36,352) (16,978)(23,942) (19,374)(105,542)(6,942) 114.11
Non-Cash Items
(15,696) (15,640) (172,734) (172,162) (573)(56)(15,942) (175,080) .33Depreciation & Amortization
0 0 18,815 Non-Oper Income (Expense)
(15,696) (15,640) (56) (172,734) (172,162) (573)Total Non-Cash Items (15,942) (156,265) .33
Change In Net Assets (40,995) (16,997) (209,086) (189,140)(23,997) (19,946)(261,807)(22,884) 10.55
UNAUDITED
For Internal Use Only

Period Ending May 31, 2018
Actual Amounts Vs. Approved Budget Comparison Page 1 of 1
6/7/2018 11:35:05PM
GlJdeIncomeStatementByCompany
Summarized Income Statement by Company, YTDMirasol/CTK/Rangel
rp_GlJdeIncomeStatementByCompany
Account Description
Current Month Year-To-Date
Actual Budget Variance Actual Budget VarianceLast YearLast Year %
Revenue
32,712 28,332 320,598 311,647 8,950 4,381 28,457 289,625 2.87Rental Revenue
(949) 1,511 13,245 16,621 (3,376)(2,460)(5,368) 8,920 -20.31Bad Debt, Net of Collections
5,805 5,964 66,063 65,599 463 (158) 5,887 65,240 .71Other Tenant Revenue
81,578 63,350 780,408 696,850 83,558 18,228 64,133 722,709 11.99Grants
3,665 1,267 10,910 13,933 (3,024) 2,398 0 (8,780) -21.70Miscellaneous Revenue
122,811 100,423 22,389 1,191,223 1,104,651 86,571 Net Revenue 93,110 1,077,714 7.84
Operating Expense
44,791 35,761 396,200 393,371 2,829 9,030 38,502 381,633 .72Salaries and Benefits
11,669 4,080 84,345 44,876 39,468 7,590 6,755 72,090 87.95Supplies and Materials
384 439 10,840 4,829 6,011 (55) 1,386 11,698 124.48Fleet Costs
22,248 17,395 371,138 191,350 179,789 4,853 44,452 289,947 93.96Outside Services
9,748 9,985 120,073 110,369 9,704 (237) 8,554 102,322 8.79Utilities
922 1,397 18,770 15,369 3,401 (476) 564 10,991 22.13Protective Services
15,335 7,687 68,071 86,123 (18,052) 7,648 46 46,105 -20.96Insurance
3,955 6,960 61,509 79,725 (18,216)(3,005) 4,006 62,488 -22.85Other Expenses
109,052 83,704 25,348 1,130,945 926,013 204,933 Total Operating Expense 104,266 977,275 22.13
Total Operating Income 13,759 16,719 60,277 178,639 (2,960) (118,361) 100,439 (11,155) (66.26)
Non-Operating Income (Expense)
58 1 409 7 401 57 55 197 5,447.08Interest Income
(4,488) (1,285) (20,619) (14,140) (6,479)(3,202)(2,577) (23,126) 45.82Replacement/Extraordinary Item
966 966 966 966 0 100.00Other Income (Expense)
(16,538) (17,309) (188,507) (190,395) 1,888 770 (17,186) (188,940) -.99Management Fees
775 784 9,227 8,626 601 (9) 1,940 21,165 6.97Transfers
(19,227) (17,809) (1,418) (198,525) (195,901) (2,623)Total Non-Operating Income (Expense) (17,769) (190,703) 1.34
Income Before Non-Cash Items (5,468) (1,090) (138,247) (17,263)(4,378) (120,985)(90,264)(28,924) 700.84
Non-Cash Items
(104,635) (103,828) (1,150,627) (1,144,214) (6,413)(808)(104,672) (1,151,186) .56Depreciation & Amortization
(104,635) (103,828) (808) (1,150,627) (1,144,214) (6,413)Total Non-Cash Items (104,672) (1,151,186) .56
Change In Net Assets (110,103) (104,918) (1,288,874) (1,161,477)(5,186) (127,397)(1,241,450)(133,597) 10.97
UNAUDITED
For Internal Use Only

Period Ending May 31, 2018
Actual Amounts Vs. Approved Budget Comparison Page 1 of 1
6/7/2018 11:35:13PM
GlJdeIncomeStatementByCompany
Summarized Income Statement by Company, YTDMission Park
rp_GlJdeIncomeStatementByCompany
Account Description
Current Month Year-To-Date
Actual Budget Variance Actual Budget VarianceLast YearLast Year %
Revenue
11,322 14,001 124,850 154,008 (29,158)(2,679) 12,558 118,003 -18.93Rental Revenue
23 333 (4,694) 3,667 (8,360)(310) 35 3,576 -228.00Bad Debt, Net of Collections
255 330 4,256 3,635 621 (75) 225 3,001 17.10Other Tenant Revenue
41,244 31,588 387,344 347,466 39,878 9,656 31,964 380,871 11.48Grants
25 2,577 275 2,302 (25) 0 9,916 836.95Miscellaneous Revenue
52,844 46,277 6,567 514,333 509,051 5,282 Net Revenue 44,782 515,368 1.04
Operating Expense
20,725 14,036 166,537 154,401 12,136 6,689 17,854 193,656 7.86Salaries and Benefits
3,963 3,125 59,617 34,375 25,242 838 3,827 46,218 73.43Supplies and Materials
146 215 4,874 2,360 2,514 (69) 337 6,205 106.55Fleet Costs
1,378 8,747 152,793 96,220 56,573 (7,370) 9,816 168,547 58.80Outside Services
1,420 10,385 129,604 114,478 15,125 (8,965) 7,610 105,901 13.21Utilities
330 563 1,756 6,197 (4,441)(234)(40) 9,967 -71.66Protective Services
6,152 4,888 37,275 54,461 (17,185) 1,264 17 30,718 -31.56Insurance
2,125 3,462 27,926 39,717 (11,791)(1,337) 2,320 31,818 -29.69Other Expenses
36,238 45,422 (9,184) 580,383 502,209 78,174 Total Operating Expense 41,741 593,031 15.57
Total Operating Income 16,606 855 (66,050) 6,842 15,751 (72,892)(77,663) 3,041 (1,065.38)
Non-Operating Income (Expense)
1 11 10 2 (1) 0 29 18.08Interest Income
(145) (1,167) (13,415) (12,833) (582) 1,022 0 (8,624) 4.53Replacement/Extraordinary Item
504 3,782 3,782 504 0 100.00Other Income (Expense)
(7,122) (7,822) (76,221) (86,037) 9,817 699 (7,612) (80,781) -11.41Management Fees
313 315 3,730 3,466 264 (2) 1,147 12,599 7.63Transfers
(6,450) (8,672) 2,222 (82,112) (95,395) 13,283 Total Non-Operating Income (Expense) (6,464) (76,777) -13.92
Income Before Non-Cash Items 10,156 (7,817) (148,162) (88,553) 17,973 (59,609)(154,440)(3,423) 67.31
Non-Cash Items
(4,777) (4,253) (51,167) (47,770) (3,397)(524)(7,579) (85,526) 7.11Depreciation & Amortization
0 0 28,702 Non-Oper Income (Expense)
(4,777) (4,253) (524) (51,167) (47,770) (3,397)Total Non-Cash Items (7,579) (56,824) 7.11
Change In Net Assets 5,378 (12,070) (199,329) (136,323) 17,449 (63,006)(211,264)(11,003) 46.22
UNAUDITED
For Internal Use Only
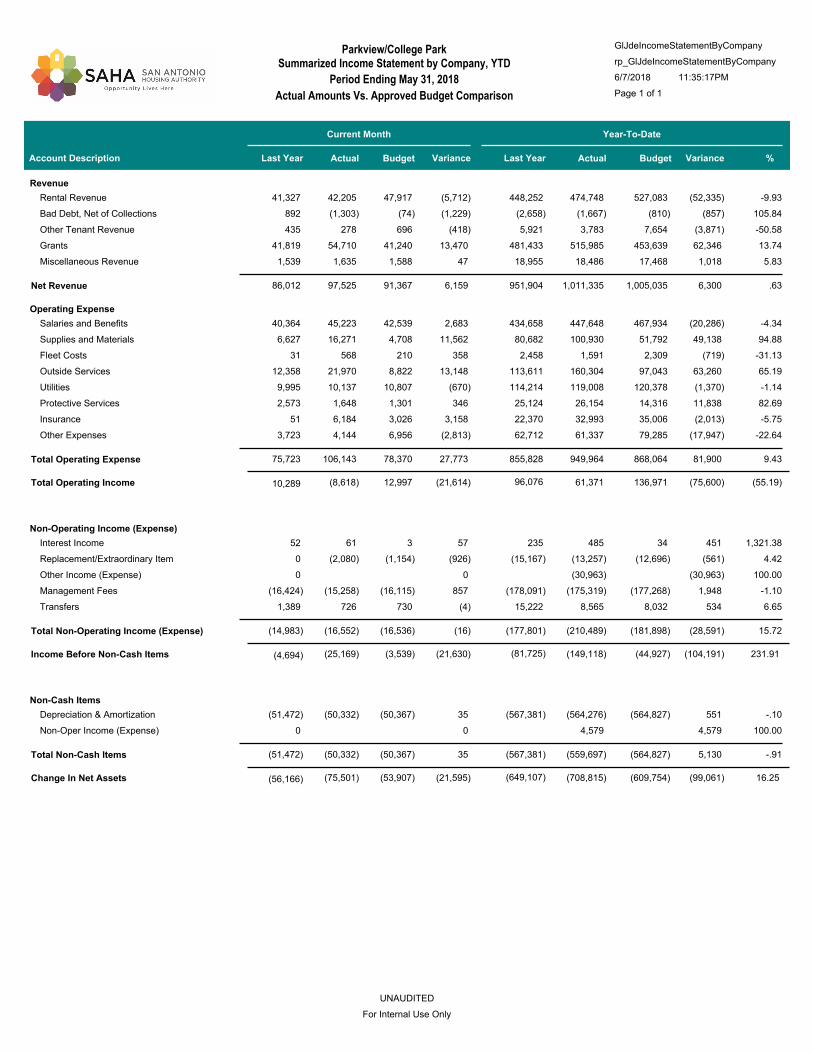
Period Ending May 31, 2018
Actual Amounts Vs. Approved Budget Comparison Page 1 of 1
6/7/2018 11:35:17PM
GlJdeIncomeStatementByCompany
Summarized Income Statement by Company, YTDParkview/College Park
rp_GlJdeIncomeStatementByCompany
Account Description
Current Month Year-To-Date
Actual Budget Variance Actual Budget VarianceLast YearLast Year %
Revenue
42,205 47,917 474,748 527,083 (52,335)(5,712) 41,327 448,252 -9.93Rental Revenue
(1,303) (74) (1,667) (810) (857)(1,229) 892 (2,658) 105.84Bad Debt, Net of Collections
278 696 3,783 7,654 (3,871)(418) 435 5,921 -50.58Other Tenant Revenue
54,710 41,240 515,985 453,639 62,346 13,470 41,819 481,433 13.74Grants
1,635 1,588 18,486 17,468 1,018 47 1,539 18,955 5.83Miscellaneous Revenue
97,525 91,367 6,159 1,011,335 1,005,035 6,300 Net Revenue 86,012 951,904 .63
Operating Expense
45,223 42,539 447,648 467,934 (20,286) 2,683 40,364 434,658 -4.34Salaries and Benefits
16,271 4,708 100,930 51,792 49,138 11,562 6,627 80,682 94.88Supplies and Materials
568 210 1,591 2,309 (719) 358 31 2,458 -31.13Fleet Costs
21,970 8,822 160,304 97,043 63,260 13,148 12,358 113,611 65.19Outside Services
10,137 10,807 119,008 120,378 (1,370)(670) 9,995 114,214 -1.14Utilities
1,648 1,301 26,154 14,316 11,838 346 2,573 25,124 82.69Protective Services
6,184 3,026 32,993 35,006 (2,013) 3,158 51 22,370 -5.75Insurance
4,144 6,956 61,337 79,285 (17,947)(2,813) 3,723 62,712 -22.64Other Expenses
106,143 78,370 27,773 949,964 868,064 81,900 Total Operating Expense 75,723 855,828 9.43
Total Operating Income (8,618) 12,997 61,371 136,971 (21,614) (75,600) 96,076 10,289 (55.19)
Non-Operating Income (Expense)
61 3 485 34 451 57 52 235 1,321.38Interest Income
(2,080) (1,154) (13,257) (12,696) (561)(926) 0 (15,167) 4.42Replacement/Extraordinary Item
(30,963) (30,963) 0 0 100.00Other Income (Expense)
(15,258) (16,115) (175,319) (177,268) 1,948 857 (16,424) (178,091) -1.10Management Fees
726 730 8,565 8,032 534 (4) 1,389 15,222 6.65Transfers
(16,552) (16,536) (16) (210,489) (181,898) (28,591)Total Non-Operating Income (Expense) (14,983) (177,801) 15.72
Income Before Non-Cash Items (25,169) (3,539) (149,118) (44,927)(21,630) (104,191)(81,725)(4,694) 231.91
Non-Cash Items
(50,332) (50,367) (564,276) (564,827) 551 35 (51,472) (567,381) -.10Depreciation & Amortization
4,579 4,579 0 0 100.00Non-Oper Income (Expense)
(50,332) (50,367) 35 (559,697) (564,827) 5,130 Total Non-Cash Items (51,472) (567,381) -.91
Change In Net Assets (75,501) (53,907) (708,815) (609,754)(21,595) (99,061)(649,107)(56,166) 16.25
UNAUDITED
For Internal Use Only

Period Ending May 31, 2018
Actual Amounts Vs. Approved Budget Comparison Page 1 of 1
6/7/2018 11:35:19PM
GlJdeIncomeStatementByCompany
Summarized Income Statement by Company, YTDRiverside/Midway/Linda Lou
rp_GlJdeIncomeStatementByCompany
Account Description
Current Month Year-To-Date
Actual Budget Variance Actual Budget VarianceLast YearLast Year %
Revenue
15,761 20,052 148,034 220,573 (72,539)(4,291) 13,714 150,848 -32.89Rental Revenue
2,973 2,463 (2,944) 27,097 (30,041) 510 (2,065) (15,558) -110.86Bad Debt, Net of Collections
287 343 4,449 3,772 677 (56) 398 2,770 17.95Other Tenant Revenue
42,075 29,885 382,202 328,737 53,465 12,190 30,252 340,995 16.26Grants
583 644 6,417 (5,773)(583) 450 900 -89.96Miscellaneous Revenue
61,096 53,327 7,769 532,385 586,595 (54,211)Net Revenue 42,748 479,955 -9.24
Operating Expense
16,198 17,836 191,111 196,198 (5,087)(1,638) 19,641 170,989 -2.59Salaries and Benefits
7,766 1,825 56,157 20,077 36,080 5,941 2,887 45,943 179.71Supplies and Materials
313 3,355 3,444 (89)(313) 38 2,702 -2.58Fleet Costs
16,968 9,397 162,745 103,362 59,383 7,572 12,833 162,883 57.45Outside Services
6,395 8,740 119,505 96,419 23,086 (2,344) 9,976 97,509 23.94Utilities
643 586 6,774 6,445 329 57 643 2,080 5.10Protective Services
5,889 2,833 27,227 31,972 (4,746) 3,057 25 17,313 -14.84Insurance
2,326 2,917 24,582 33,523 (8,941)(591) 1,511 23,340 -26.67Other Expenses
56,187 44,446 11,740 591,454 491,440 100,015 Total Operating Expense 47,555 522,760 20.35
Total Operating Income 4,910 8,881 (59,070) 95,156 (3,971) (154,225)(42,805)(4,807) (162.08)
Non-Operating Income (Expense)
1 9 15 (6)(1) 1 42 -37.86Interest Income
(780) (1,310) (6,783) (14,415) 7,633 530 0 (18,746) -52.95Replacement/Extraordinary Item
(7,117) (7,760) (81,620) (85,360) 3,739 643 (7,694) (83,739) -4.38Management Fees
327 330 3,862 3,628 234 (2) 932 10,214 6.44Transfers
(7,570) (8,739) 1,169 (84,532) (96,132) 11,600 Total Non-Operating Income (Expense) (6,762) (92,228) -12.07
Income Before Non-Cash Items (2,661) 141 (143,602) (976)(2,802) (142,625)(135,033)(11,568) 14,608.91
Non-Cash Items
(4,278) (3,863) (62,031) (59,630) (2,401)(415)(6,345) (73,602) 4.03Depreciation & Amortization
0 0 13,429 Non-Oper Income (Expense)
(4,278) (3,863) (415) (62,031) (59,630) (2,401)Total Non-Cash Items (6,345) (60,173) 4.03
Change In Net Assets (6,939) (3,722) (205,633) (60,607)(3,217) (145,026)(195,206)(17,914) 239.29
UNAUDITED
For Internal Use Only

Period Ending May 31, 2018
Actual Amounts Vs. Approved Budget Comparison Page 1 of 1
6/7/2018 11:35:25PM
GlJdeIncomeStatementByCompany
Summarized Income Statement by Company, YTDScattered Sites
rp_GlJdeIncomeStatementByCompany
Account Description
Current Month Year-To-Date
Actual Budget Variance Actual Budget VarianceLast YearLast Year %
Revenue
24,391 25,000 248,004 275,000 (26,996)(609) 22,705 240,717 -9.82Rental Revenue
448 487 (11,350) 5,352 (16,703)(38) 975 2,060 -312.06Bad Debt, Net of Collections
300 458 3,221 5,042 (1,821)(158) 270 3,213 -36.11Other Tenant Revenue
54,275 41,137 512,727 452,504 60,223 13,138 41,626 449,566 13.31Grants
6,768 6,768 0 125 250 100.00Miscellaneous Revenue
79,414 67,082 12,333 759,370 737,898 21,472 Net Revenue 65,701 695,805 2.91
Operating Expense
11,413 14,807 139,824 162,880 (23,056)(3,395) 21,176 223,564 -14.16Salaries and Benefits
3,600 5,333 25,243 58,667 (33,424)(1,733) 717 34,671 -56.97Supplies and Materials
122 452 5,393 4,973 420 (330) 1,668 9,696 8.45Fleet Costs
28,068 21,393 295,203 235,324 59,879 6,675 15,099 235,593 25.45Outside Services
275 213 5,122 2,370 2,752 62 194 5,036 116.10Utilities
918 10,102 (10,102)(918) 0 -100.00Protective Services
11,736 4,703 47,244 52,431 (5,187) 7,033 29 28,036 -9.89Insurance
1,855 4,424 28,311 48,659 (20,348)(2,569) 5,537 38,625 -41.82Other Expenses
57,068 52,244 4,824 546,341 575,405 (29,065)Total Operating Expense 44,421 575,220 -5.05
Total Operating Income 22,347 14,838 213,029 162,492 7,509 50,537 120,585 21,280 31.10
Non-Operating Income (Expense)
4,091 2,597 42,307 28,564 13,743 1,494 3,835 38,507 48.11Interest Income
(138) (1,067) (12,262) (11,733) (528) 929 0 (9,582) 4.50Replacement/Extraordinary Item
1,190 2,180 2,180 1,190 (1,315) 4,061 100.00Other Income (Expense)
(10,817) (10,876) (119,973) (119,633) (340) 59 (11,091) (119,895) .28Management Fees
517 523 6,125 5,748 377 (5) 1,208 13,066 6.56Transfers
(5,157) (8,823) 3,666 (81,623) (97,054) 15,432 Total Non-Operating Income (Expense) (7,364) (73,843) -15.90
Income Before Non-Cash Items 17,190 6,015 131,407 65,438 11,175 65,969 46,742 13,916 100.81
Non-Cash Items
(8,811) (7,670) (106,396) (94,633) (11,763)(1,140)(12,933) (174,191) 12.43Depreciation & Amortization
0 0 50,846 Non-Oper Income (Expense)
(8,811) (7,670) (1,140) (106,396) (94,633) (11,763)Total Non-Cash Items (12,933) (123,345) 12.43
Change In Net Assets 8,379 (1,655) 25,010 (29,195) 10,035 54,205 (76,603) 983 (185.67)
UNAUDITED
For Internal Use Only
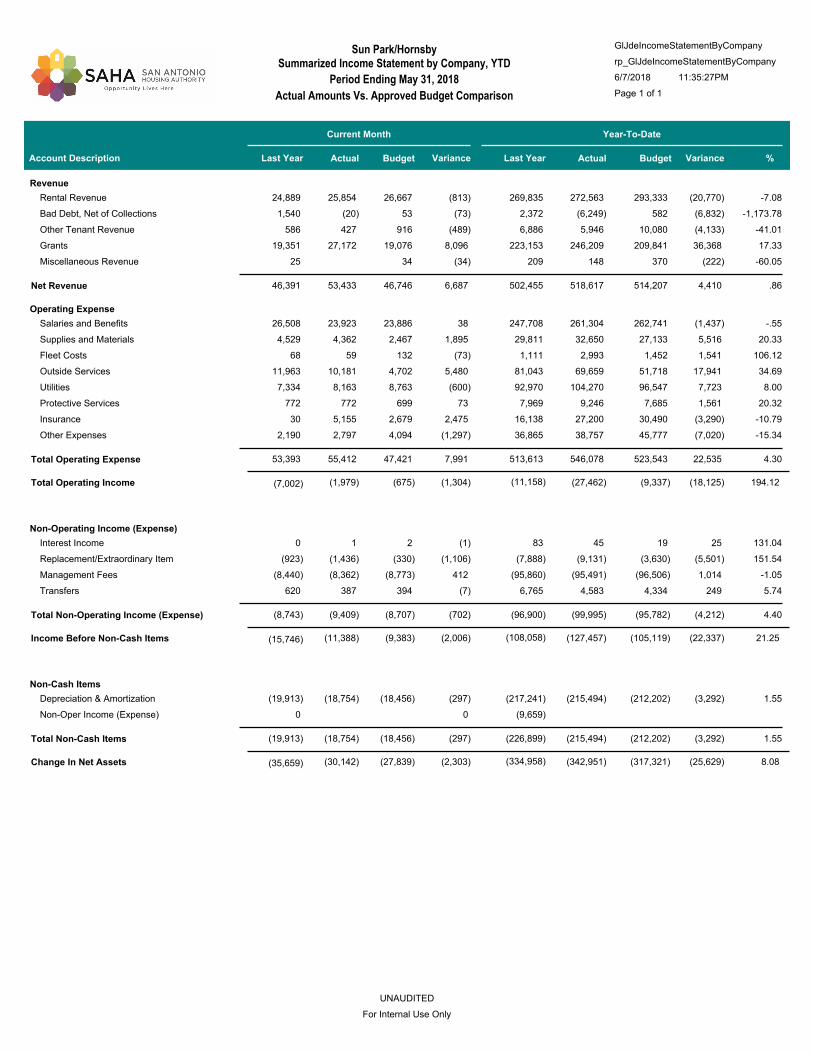
Period Ending May 31, 2018
Actual Amounts Vs. Approved Budget Comparison Page 1 of 1
6/7/2018 11:35:27PM
GlJdeIncomeStatementByCompany
Summarized Income Statement by Company, YTDSun Park/Hornsby
rp_GlJdeIncomeStatementByCompany
Account Description
Current Month Year-To-Date
Actual Budget Variance Actual Budget VarianceLast YearLast Year %
Revenue
25,854 26,667 272,563 293,333 (20,770)(813) 24,889 269,835 -7.08Rental Revenue
(20) 53 (6,249) 582 (6,832)(73) 1,540 2,372 -1,173.78Bad Debt, Net of Collections
427 916 5,946 10,080 (4,133)(489) 586 6,886 -41.01Other Tenant Revenue
27,172 19,076 246,209 209,841 36,368 8,096 19,351 223,153 17.33Grants
34 148 370 (222)(34) 25 209 -60.05Miscellaneous Revenue
53,433 46,746 6,687 518,617 514,207 4,410 Net Revenue 46,391 502,455 .86
Operating Expense
23,923 23,886 261,304 262,741 (1,437) 38 26,508 247,708 -.55Salaries and Benefits
4,362 2,467 32,650 27,133 5,516 1,895 4,529 29,811 20.33Supplies and Materials
59 132 2,993 1,452 1,541 (73) 68 1,111 106.12Fleet Costs
10,181 4,702 69,659 51,718 17,941 5,480 11,963 81,043 34.69Outside Services
8,163 8,763 104,270 96,547 7,723 (600) 7,334 92,970 8.00Utilities
772 699 9,246 7,685 1,561 73 772 7,969 20.32Protective Services
5,155 2,679 27,200 30,490 (3,290) 2,475 30 16,138 -10.79Insurance
2,797 4,094 38,757 45,777 (7,020)(1,297) 2,190 36,865 -15.34Other Expenses
55,412 47,421 7,991 546,078 523,543 22,535 Total Operating Expense 53,393 513,613 4.30
Total Operating Income (1,979) (675) (27,462) (9,337)(1,304) (18,125)(11,158)(7,002) 194.12
Non-Operating Income (Expense)
1 2 45 19 25 (1) 0 83 131.04Interest Income
(1,436) (330) (9,131) (3,630) (5,501)(1,106)(923) (7,888) 151.54Replacement/Extraordinary Item
(8,362) (8,773) (95,491) (96,506) 1,014 412 (8,440) (95,860) -1.05Management Fees
387 394 4,583 4,334 249 (7) 620 6,765 5.74Transfers
(9,409) (8,707) (702) (99,995) (95,782) (4,212)Total Non-Operating Income (Expense) (8,743) (96,900) 4.40
Income Before Non-Cash Items (11,388) (9,383) (127,457) (105,119)(2,006) (22,337)(108,058)(15,746) 21.25
Non-Cash Items
(18,754) (18,456) (215,494) (212,202) (3,292)(297)(19,913) (217,241) 1.55Depreciation & Amortization
0 0 (9,659)Non-Oper Income (Expense)
(18,754) (18,456) (297) (215,494) (212,202) (3,292)Total Non-Cash Items (19,913) (226,899) 1.55
Change In Net Assets (30,142) (27,839) (342,951) (317,321)(2,303) (25,629)(334,958)(35,659) 8.08
UNAUDITED
For Internal Use Only
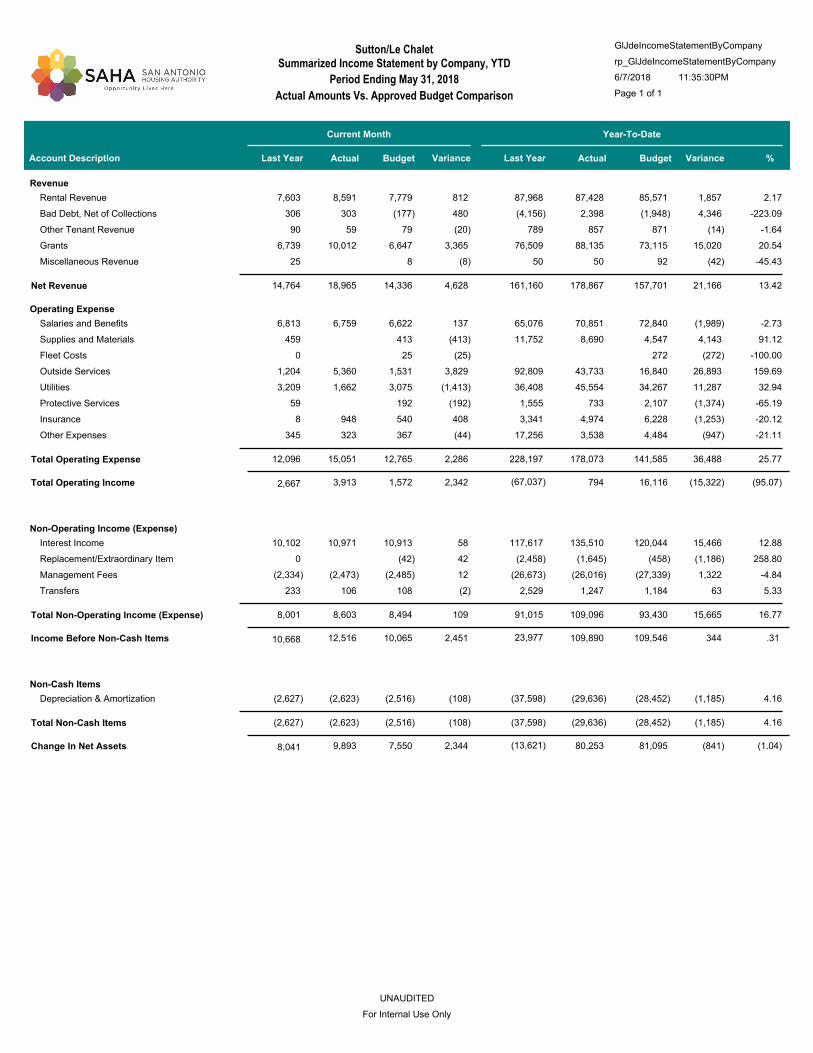
Period Ending May 31, 2018
Actual Amounts Vs. Approved Budget Comparison Page 1 of 1
6/7/2018 11:35:30PM
GlJdeIncomeStatementByCompany
Summarized Income Statement by Company, YTDSutton/Le Chalet
rp_GlJdeIncomeStatementByCompany
Account Description
Current Month Year-To-Date
Actual Budget Variance Actual Budget VarianceLast YearLast Year %
Revenue
8,591 7,779 87,428 85,571 1,857 812 7,603 87,968 2.17Rental Revenue
303 (177) 2,398 (1,948) 4,346 480 306 (4,156) -223.09Bad Debt, Net of Collections
59 79 857 871 (14)(20) 90 789 -1.64Other Tenant Revenue
10,012 6,647 88,135 73,115 15,020 3,365 6,739 76,509 20.54Grants
8 50 92 (42)(8) 25 50 -45.43Miscellaneous Revenue
18,965 14,336 4,628 178,867 157,701 21,166 Net Revenue 14,764 161,160 13.42
Operating Expense
6,759 6,622 70,851 72,840 (1,989) 137 6,813 65,076 -2.73Salaries and Benefits
413 8,690 4,547 4,143 (413) 459 11,752 91.12Supplies and Materials
25 272 (272)(25) 0 -100.00Fleet Costs
5,360 1,531 43,733 16,840 26,893 3,829 1,204 92,809 159.69Outside Services
1,662 3,075 45,554 34,267 11,287 (1,413) 3,209 36,408 32.94Utilities
192 733 2,107 (1,374)(192) 59 1,555 -65.19Protective Services
948 540 4,974 6,228 (1,253) 408 8 3,341 -20.12Insurance
323 367 3,538 4,484 (947)(44) 345 17,256 -21.11Other Expenses
15,051 12,765 2,286 178,073 141,585 36,488 Total Operating Expense 12,096 228,197 25.77
Total Operating Income 3,913 1,572 794 16,116 2,342 (15,322)(67,037) 2,667 (95.07)
Non-Operating Income (Expense)
10,971 10,913 135,510 120,044 15,466 58 10,102 117,617 12.88Interest Income
(42) (1,645) (458) (1,186) 42 0 (2,458) 258.80Replacement/Extraordinary Item
(2,473) (2,485) (26,016) (27,339) 1,322 12 (2,334) (26,673) -4.84Management Fees
106 108 1,247 1,184 63 (2) 233 2,529 5.33Transfers
8,603 8,494 109 109,096 93,430 15,665 Total Non-Operating Income (Expense) 8,001 91,015 16.77
Income Before Non-Cash Items 12,516 10,065 109,890 109,546 2,451 344 23,977 10,668 .31
Non-Cash Items
(2,623) (2,516) (29,636) (28,452) (1,185)(108)(2,627) (37,598) 4.16Depreciation & Amortization
(2,623) (2,516) (108) (29,636) (28,452) (1,185)Total Non-Cash Items (2,627) (37,598) 4.16
Change In Net Assets 9,893 7,550 80,253 81,095 2,344 (841)(13,621) 8,041 (1.04)
UNAUDITED
For Internal Use Only

Period Ending May 31, 2018
Actual Amounts Vs. Approved Budget Comparison Page 1 of 1
6/7/2018 11:35:31PM
GlJdeIncomeStatementByCompany
Summarized Income Statement by Company, YTDVilla Veramendi
rp_GlJdeIncomeStatementByCompany
Account Description
Current Month Year-To-Date
Actual Budget Variance Actual Budget VarianceLast YearLast Year %
Revenue
20,829 21,750 219,946 239,250 (19,304)(921) 16,439 212,441 -8.07Rental Revenue
2,317 767 (8,092) 8,433 (16,525) 1,550 2,964 849 -195.95Bad Debt, Net of Collections
982 545 5,816 5,991 (175) 437 563 5,240 -2.92Other Tenant Revenue
74,352 57,800 706,130 635,800 70,330 16,552 58,488 663,141 11.06Grants
6,778 521 18,861 5,729 13,132 6,257 4,636 11,138 229.22Miscellaneous Revenue
105,258 81,382 23,876 942,661 895,204 47,457 Net Revenue 83,089 892,809 5.30
Operating Expense
24,044 29,850 282,682 328,354 (45,672)(5,806) 30,595 269,727 -13.91Salaries and Benefits
7,839 4,500 62,613 49,500 13,113 3,339 6,149 56,399 26.49Supplies and Materials
1,758 396 10,442 4,355 6,087 1,362 277 4,251 139.77Fleet Costs
14,319 13,315 233,439 146,462 86,977 1,005 24,465 210,745 59.39Outside Services
14,676 12,350 164,958 136,135 28,823 2,326 13,028 134,291 21.17Utilities
805 935 7,478 10,288 (2,809)(130) 857 9,520 -27.31Protective Services
6,779 4,544 32,861 51,260 (18,398) 2,235 42 28,306 -35.89Insurance
2,268 4,272 35,816 49,586 (13,770)(2,004) 1,755 36,066 -27.77Other Expenses
72,489 70,163 2,326 830,290 775,938 54,352 Total Operating Expense 77,168 749,306 7.00
Total Operating Income 32,769 11,220 112,371 119,266 21,550 (6,894) 143,503 5,921 (5.78)
Non-Operating Income (Expense)
143 2 1,008 22 986 141 63 262 4,438.25Interest Income
(5,064) (792) (20,549) (8,708) (11,841)(4,272)(4,274) (27,823) 135.98Replacement/Extraordinary Item
(11,218) (11,838) (127,852) (130,214) 2,362 620 (11,581) (129,777) -1.81Management Fees
520 524 6,204 5,767 437 (4) 1,958 21,436 7.58Transfers
(15,619) (12,103) (3,516) (141,189) (133,134) (8,056)Total Non-Operating Income (Expense) (13,833) (135,902) 6.05
Income Before Non-Cash Items 17,151 (883) (28,818) (13,868) 18,034 (14,950) 7,601 (7,912) 107.80
Non-Cash Items
(48,136) (47,755) (529,945) (527,335) (2,610)(381)(68,545) (753,190) .49Depreciation & Amortization
(48,136) (47,755) (381) (529,945) (527,335) (2,610)Total Non-Cash Items (68,545) (753,190) .49
Change In Net Assets (30,985) (48,638) (558,763) (541,203) 17,653 (17,560)(745,589)(76,457) 3.24
UNAUDITED
For Internal Use Only

Period Ending May 31, 2018
Actual Amounts Vs. Approved Budget Comparison Page 1 of 1
6/7/2018 11:35:33PM
GlJdeIncomeStatementByCompany
Summarized Income Statement by Company, YTDWC White
rp_GlJdeIncomeStatementByCompany
Account Description
Current Month Year-To-Date
Actual Budget Variance Actual Budget VarianceLast YearLast Year %
Revenue
13,792 15,000 152,283 165,000 (12,717)(1,208) 13,994 148,857 -7.71Rental Revenue
232 365 2,549 (2,184)(232) 173 1,724 -85.69Bad Debt, Net of Collections
354 308 2,655 3,392 (737) 46 283 3,317 -21.72Other Tenant Revenue
17,215 13,060 162,925 143,664 19,261 4,155 13,245 152,361 13.41Grants
363 309 1,959 3,398 (1,439) 54 499 2,645 -42.36Miscellaneous Revenue
31,724 28,909 2,815 320,187 318,002 2,184 Net Revenue 28,194 308,905 .69
Operating Expense
11,588 11,389 120,374 125,279 (4,905) 199 19,637 134,035 -3.92Salaries and Benefits
3,663 1,030 24,091 11,335 12,757 2,632 987 18,184 112.55Supplies and Materials
45 105 703 1,151 (448)(60) 1,397 2,172 -38.92Fleet Costs
2,828 2,815 38,811 30,970 7,841 12 (426) 33,982 25.32Outside Services
4,062 4,885 47,632 54,490 (6,858)(824) 3,739 43,093 -12.59Utilities
423 2,315 4,648 (2,333)(423) 159 4,822 -50.20Protective Services
2,150 1,720 10,884 19,386 (8,502) 429 14 10,976 -43.86Insurance
2,598 4,049 30,199 45,473 (15,275)(1,451) 1,822 29,578 -33.59Other Expenses
26,932 26,417 515 275,009 292,732 (17,724)Total Operating Expense 27,330 276,842 -6.05
Total Operating Income 4,792 2,492 45,178 25,270 2,300 19,908 32,062 864 78.78
Non-Operating Income (Expense)
152 1 900 7 893 151 39 131 12,111.53Interest Income
(454) (2,690) (4,996) 2,306 454 (154) (5,428) -46.16Replacement/Extraordinary Item
(5,284) (5,448) (57,157) (59,924) 2,767 164 (5,094) (58,753) -4.62Management Fees
235 237 2,781 2,607 174 (2) 467 5,110 6.66Transfers
(4,897) (5,664) 767 (56,167) (62,306) 6,139 Total Non-Operating Income (Expense) (4,741) (58,940) -9.85
Income Before Non-Cash Items (105) (3,172) (10,989) (37,036) 3,067 26,047 (26,878)(3,877) (70.33)
Non-Cash Items
(55,250) (53,515) (628,864) (618,817) (10,047)(1,734)(57,433) (631,215) 1.62Depreciation & Amortization
262,224 262,224 0 0 100.00Non-Oper Income (Expense)
(55,250) (53,515) (1,734) (366,641) (618,817) 252,177 Total Non-Cash Items (57,433) (631,215) -40.75
Change In Net Assets (55,355) (56,687) (377,629) (655,853) 1,333 278,224 (658,093)(61,311) (42.42)
UNAUDITED
For Internal Use Only
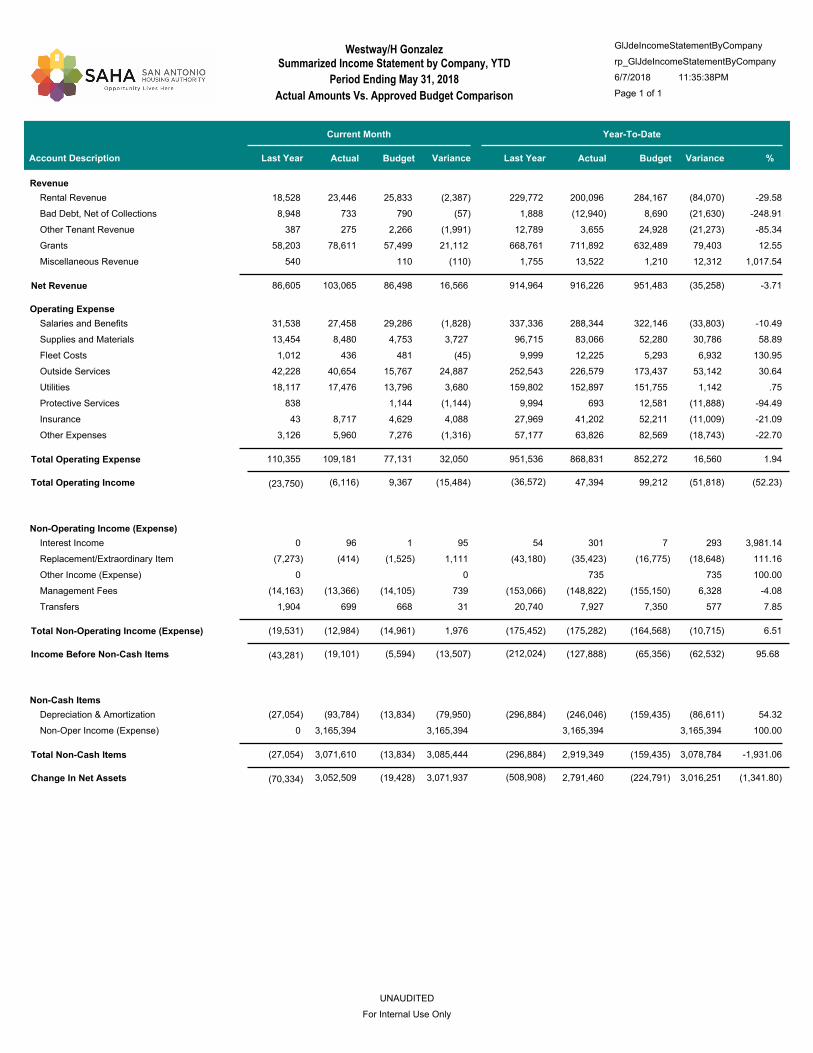
Period Ending May 31, 2018
Actual Amounts Vs. Approved Budget Comparison Page 1 of 1
6/7/2018 11:35:38PM
GlJdeIncomeStatementByCompany
Summarized Income Statement by Company, YTDWestway/H Gonzalez
rp_GlJdeIncomeStatementByCompany
Account Description
Current Month Year-To-Date
Actual Budget Variance Actual Budget VarianceLast YearLast Year %
Revenue
23,446 25,833 200,096 284,167 (84,070)(2,387) 18,528 229,772 -29.58Rental Revenue
733 790 (12,940) 8,690 (21,630)(57) 8,948 1,888 -248.91Bad Debt, Net of Collections
275 2,266 3,655 24,928 (21,273)(1,991) 387 12,789 -85.34Other Tenant Revenue
78,611 57,499 711,892 632,489 79,403 21,112 58,203 668,761 12.55Grants
110 13,522 1,210 12,312 (110) 540 1,755 1,017.54Miscellaneous Revenue
103,065 86,498 16,566 916,226 951,483 (35,258)Net Revenue 86,605 914,964 -3.71
Operating Expense
27,458 29,286 288,344 322,146 (33,803)(1,828) 31,538 337,336 -10.49Salaries and Benefits
8,480 4,753 83,066 52,280 30,786 3,727 13,454 96,715 58.89Supplies and Materials
436 481 12,225 5,293 6,932 (45) 1,012 9,999 130.95Fleet Costs
40,654 15,767 226,579 173,437 53,142 24,887 42,228 252,543 30.64Outside Services
17,476 13,796 152,897 151,755 1,142 3,680 18,117 159,802 .75Utilities
1,144 693 12,581 (11,888)(1,144) 838 9,994 -94.49Protective Services
8,717 4,629 41,202 52,211 (11,009) 4,088 43 27,969 -21.09Insurance
5,960 7,276 63,826 82,569 (18,743)(1,316) 3,126 57,177 -22.70Other Expenses
109,181 77,131 32,050 868,831 852,272 16,560 Total Operating Expense 110,355 951,536 1.94
Total Operating Income (6,116) 9,367 47,394 99,212 (15,484) (51,818)(36,572)(23,750) (52.23)
Non-Operating Income (Expense)
96 1 301 7 293 95 0 54 3,981.14Interest Income
(414) (1,525) (35,423) (16,775) (18,648) 1,111 (7,273) (43,180) 111.16Replacement/Extraordinary Item
735 735 0 0 100.00Other Income (Expense)
(13,366) (14,105) (148,822) (155,150) 6,328 739 (14,163) (153,066) -4.08Management Fees
699 668 7,927 7,350 577 31 1,904 20,740 7.85Transfers
(12,984) (14,961) 1,976 (175,282) (164,568) (10,715)Total Non-Operating Income (Expense) (19,531) (175,452) 6.51
Income Before Non-Cash Items (19,101) (5,594) (127,888) (65,356)(13,507) (62,532)(212,024)(43,281) 95.68
Non-Cash Items
(93,784) (13,834) (246,046) (159,435) (86,611)(79,950)(27,054) (296,884) 54.32Depreciation & Amortization
3,165,394 3,165,394 3,165,394 3,165,394 0 100.00Non-Oper Income (Expense)
3,071,610 (13,834) 3,085,444 2,919,349 (159,435) 3,078,784 Total Non-Cash Items (27,054) (296,884) -1,931.06
Change In Net Assets 3,052,509 (19,428) 2,791,460 (224,791) 3,071,937 3,016,251 (508,908)(70,334) (1,341.80)
UNAUDITED
For Internal Use Only

Period Ending May 31, 2018
Actual Amounts Vs. Approved Budget Comparison Page 1 of 2
6/7/2018 11:35:01PM
GlJdeIncomeStatementByLineOfBusinessByGroup
Summarized Income Statement by Line of Business, YTDrp_GlJdeIncomeStatementByLineOfBusinessByGroup
Public HousingGroup B
Account Description
Current Month Year-To-Date
Actual Budget Variance Actual Budget VarianceLast YearLast Year %
Revenue
419,501 4,548,317 4,930,383 (382,067)(28,716) 448,674 4,850,951 Rental Revenue (7.75) 448,217
(37,691) (120,017) 73,705 (193,721)(44,427)(658) (11,777)Bad Debt, Net of Collections (262.83) 6,737
13,011 180,729 248,419 (67,691)(16,689) 14,860 190,810 Other Tenant Revenue (27.25) 29,700
937,935 8,955,652 7,919,643 1,036,009 217,967 731,971 8,429,533 Grants 13.08 719,968
8,074 121,409 116,155 5,255 (2,486)(5,402) 118,697 Miscellaneous Revenue 4.52 10,560
13,686,090 13,288,305 397,785 Net Revenue 2.99 13,578,214 1,189,446 1,340,830 125,649 1,215,181
Operating Expense
388,654 4,304,610 4,356,586 (51,977)(7,370) 415,798 4,257,550 Salaries and Benefits (1.19) 396,024
95,897 839,356 602,574 236,782 41,118 70,991 703,157 Supplies and Materials 39.30 54,779
10,800 74,226 61,345 12,881 5,223 4,640 64,423 Fleet Costs 21.00 5,577
229,498 2,474,881 2,050,886 423,995 43,661 213,346 2,294,250 Outside Services 20.67 185,837
160,496 2,160,769 2,192,870 (32,100)(34,703) 195,477 2,160,749 Utilities (1.46) 195,199
10,498 98,874 162,866 (63,992)(4,308) 9,596 117,753 Protective Services (39.29) 14,806
106,710 510,285 563,567 (53,282) 57,082 570 334,036 Insurance (9.45) 49,628
57,738 760,100 878,385 (118,286)(18,905) 41,261 911,515 Other Expenses (13.47) 76,643
11,223,101 10,869,079 354,022 Total Operating Expense 3.26 10,843,434 951,678 1,060,291 81,798 978,493
Total Operating Income 280,539 2,462,989 2,419,226 43,851 43,763 2,734,780 237,767 1.81 236,687
Non-Operating Income (Expense)
(2,378) (29,734) (29,734)(2,378)(2,535) (19,094)Interest Expense 100.00
71,201 763,425 231,378 532,047 50,167 60,665 539,683 Interest Income 229.95 21,034
(4,752) (202,153) (328,914) 126,761 24,667 (20,082) (239,953)Replacement/Extraordinary Item (38.54)(29,419)
896 (381,067) (381,067) 896 164,855 Other Income (Expense) 100.00
(177,237) (2,003,679) (2,071,513) 67,834 11,083 (182,039) (2,069,465)Management Fees (3.27)(188,319)
(18,318) (187,233) 92,576 (279,809)(26,734) 20,182 215,480 Transfers (302.25) 8,416
(2,040,440) (2,076,473) 36,033 Total Non-Operating Income (Expense) (1.74)(1,408,493)(123,808) (130,588) 57,701 (188,288)
Surplus or (Deficit) Prior to Non-Cash Items 149,951 422,549 342,753 101,552 79,796 1,326,287 113,959 23.28 48,399
Non-Cash Items
(431,643) (4,826,976) (4,749,317) (77,660)(8,870)(444,332) (4,994,379)Depreciation & Amortization 1.64 (422,773)
1,608 4,091,836 2,800,637 1,291,199 (252,996) 450,845 3,423,140 Non-Oper Income (Expense) 46.10 254,603
(735,140) (1,948,680) 1,213,540 Total Non-Cash Items (62.27)(1,571,240) 6,513 (430,035) (261,866)(168,170)
Change In Net Assets (280,084) (312,592) (1,605,927)(160,313) 1,293,336 (244,953) 120,472 (80.54)(119,771)
UNAUDITED
For Internal Use Only

Period Ending May 31, 2018
Actual Amounts Vs. Approved Budget Comparison Page 2 of 2
6/7/2018 11:35:01PM
GlJdeIncomeStatementByLineOfBusinessByGroup
Summarized Income Statement by Line of Business, YTDrp_GlJdeIncomeStatementByLineOfBusinessByGroup
Public HousingGroup B
0K
200K
400K
600K
800K
1000K
1200K
1400K
1,389K1,253K
1,088K
891K
680K594K
495K371K368K368K
Management Fee -Internal
Admin - Salaries
Maint - Salaries
Electricity
Water
Unit Make Ready
Sewer
Plumbing Repairs
Admin -Hospitalization
Maint - Hospitalization
Top 10 Operating Expenses
Year-To-Date
0K
50K
100K
150K
200K
250K
300K
350K
400K
450K
414K
200K176K
114K 114K 108K73K 68K 66K 59K
Interest on Notes
Maint - Contract
Labor
Annual Leave
Unit Make Ready
Plumbing Repairs
Holiday
Appliance Parts
Solid Waste Disposal
Electrical Supplies
Maint - Overtime
Top 10 Variances Over Budget
Year-To-Date
0K
200K
400K
600K800K1,000K
1,200K
1,400K
1,600K
1,800K2017
0K
200K
400K
600K800K1,000K
1,200K
1,400K
1,600K
1,800K2018
AA
BA
Surplus (Deficit) Prior to Non-Cash Items
Year-to-Date
0K
2,000K
4,000K
6,000K
8,000K
10,000K
8,603K
4,548K
521K 307K 204K
Grant Inc-PHOperating Subsidy
Dwelling Rental
Interest on Notes
Recovery - TenantMaint
Add'l OS AddOn forEPC
Top 5 Sources of Revenue
Year-To-Date
UNAUDITED
For Internal Use Only

Period Ending May 31, 2018
Actual Amounts Vs. Approved Budget Comparison Page 1 of 1
6/7/2018 11:35:45PM
GlJdeIncomeStatementByCompany
Summarized Income Statement by Company, YTDAlazan/Guadalupe
rp_GlJdeIncomeStatementByCompany
Account Description
Current Month Year-To-Date
Actual Budget Variance Actual Budget VarianceLast YearLast Year %
Revenue
91,664 86,298 963,323 949,281 14,043 5,365 86,893 881,050 1.48Rental Revenue
(5,020) (671) (79,596) (7,381) (72,215)(4,349)(2,122) (17,666) 978.39Bad Debt, Net of Collections
2,185 2,206 25,143 24,263 880 (21) 2,437 26,940 3.63Other Tenant Revenue
333,408 251,248 3,160,128 2,763,728 396,400 82,160 254,239 2,888,057 14.34Grants
907 2,414 52,119 26,558 25,561 (1,507)(12,329) 46,008 96.25Miscellaneous Revenue
423,144 341,495 81,649 4,121,117 3,756,448 364,670 Net Revenue 329,118 3,824,390 9.71
Operating Expense
105,241 115,997 1,216,407 1,275,971 (59,564)(10,756) 108,068 1,127,843 -4.67Salaries and Benefits
50,463 24,762 382,653 272,384 110,269 25,701 31,783 275,391 40.48Supplies and Materials
6,788 2,245 35,075 24,693 10,381 4,543 2,854 26,436 42.04Fleet Costs
103,883 66,950 851,444 736,453 114,991 36,933 70,460 708,565 15.61Outside Services
37,755 42,459 465,249 467,045 (1,796)(4,704) 40,432 438,250 -.38Utilities
2,286 4,175 17,360 45,922 (28,562)(1,889) 1,126 28,578 -62.20Protective Services
29,444 14,046 143,024 159,600 (16,576) 15,397 153 88,296 -10.39Insurance
17,570 19,008 148,086 219,414 (71,328)(1,438) 4,684 136,608 -32.51Other Expenses
353,430 289,642 63,787 3,259,296 3,201,482 57,815 Total Operating Expense 259,561 2,829,967 1.81
Total Operating Income 69,714 51,853 861,821 554,966 17,861 306,855 994,423 69,557 55.29
Non-Operating Income (Expense)
(592) (7,402) (7,402)(592)(631) (4,753) 100.00Interest Expense
1,252 6 11,890 64 11,826 1,246 666 1,806 18,535.77Interest Income
(2,224) (14,374) (90,754) (158,119) 67,365 12,151 (10,285) (70,159) -42.60Replacement/Extraordinary Item
(2,797) (2,797) 0 0 21,492 100.00Other Income (Expense)
(49,164) (52,131) (570,630) (573,437) 2,807 2,967 (51,873) (575,931) -.49Management Fees
(4,301) 2,361 (45,039) 25,974 (71,013)(6,662) 1,951 31,167 -273.40Transfers
(55,029) (64,138) 9,109 (704,732) (705,518) 786 Total Non-Operating Income (Expense) (60,172) (596,379) -.11
Income Before Non-Cash Items 14,686 (12,285) 157,089 (150,552) 26,971 307,641 398,044 9,385 (204.34)
Non-Cash Items
(68,228) (62,960) (735,723) (693,029) (42,695)(5,268)(63,843) (722,525) 6.16Depreciation & Amortization
119,619 119,619 0 0 100.00Non-Oper Income (Expense)
(68,228) (62,960) (5,268) (616,104) (693,029) 76,925 Total Non-Cash Items (63,843) (722,525) -11.10
Change In Net Assets (53,542) (75,245) (459,015) (843,581) 21,703 384,566 (324,481)(54,458) (45.59)
UNAUDITED
For Internal Use Only

Period Ending May 31, 2018
Actual Amounts Vs. Approved Budget Comparison Page 1 of 1
6/7/2018 11:35:52PM
GlJdeIncomeStatementByCompany
Summarized Income Statement by Company, YTDBlanco/San Pedro Arms
rp_GlJdeIncomeStatementByCompany
Account Description
Current Month Year-To-Date
Actual Budget Variance Actual Budget VarianceLast YearLast Year %
Revenue
27,049 28,798 306,320 316,780 (10,460)(1,749) 27,658 305,430 -3.30Rental Revenue
44 (107) (3,352) (1,178) (2,175) 151 (2,517) 305 184.63Bad Debt, Net of Collections
371 332 3,917 3,650 268 39 600 5,276 7.33Other Tenant Revenue
24,929 19,253 237,248 211,780 25,468 5,676 19,528 227,292 12.03Grants
1,061 1,521 27,205 16,730 10,475 (460) 1,521 16,893 62.61Miscellaneous Revenue
53,453 49,797 3,657 571,338 547,762 23,576 Net Revenue 46,790 555,196 4.30
Operating Expense
5,339 13,967 138,031 153,634 (15,604)(8,628) 13,040 100,854 -10.16Salaries and Benefits
2,536 1,505 10,422 16,560 (6,138) 1,030 1,415 11,732 -37.07Supplies and Materials
64 418 883 4,596 (3,713)(354) 55 1,902 -80.79Fleet Costs
10,369 6,995 95,729 76,940 18,790 3,375 16,705 95,030 24.42Outside Services
11,556 11,879 149,581 132,609 16,972 (323) 17,644 126,472 12.80Utilities
654 1,426 7,189 (5,763)(654) 386 1,056 -80.16Protective Services
2,755 1,305 13,792 15,095 (1,303) 1,450 15 7,856 -8.63Insurance
1,991 3,422 27,043 39,167 (12,124)(1,431) 1,790 24,763 -30.95Other Expenses
34,610 40,144 (5,534) 436,907 445,790 (8,883)Total Operating Expense 51,049 369,666 -1.99
Total Operating Income 18,843 9,653 134,431 101,972 9,190 32,459 185,530 (4,259) 31.83
Non-Operating Income (Expense)
265 1 1,514 15 1,499 264 95 285 10,168.93Interest Income
(217) (3,974) (2,383) (1,591) 217 0 (1,135) 66.75Replacement/Extraordinary Item
(8,014) (8,531) (88,899) (93,840) 4,941 517 (8,397) (91,802) -5.27Management Fees
363 366 4,306 4,021 286 (2) 641 7,032 7.11Transfers
(7,385) (8,381) 996 (87,053) (92,188) 5,135 Total Non-Operating Income (Expense) (7,661) (85,620) -5.57
Income Before Non-Cash Items 11,458 1,272 47,378 9,783 10,186 37,595 99,910 (11,920) 384.27
Non-Cash Items
(42,380) (41,953) (470,468) (465,760) (4,709)(426)(42,681) (473,905) 1.01Depreciation & Amortization
0 0 Non-Oper Income (Expense)
(42,380) (41,953) (426) (470,468) (465,760) (4,709)Total Non-Cash Items (42,681) (473,905) 1.01
Change In Net Assets (30,922) (40,681) (423,091) (455,976) 9,760 32,886 (373,994)(54,601) (7.21)
UNAUDITED
For Internal Use Only

Period Ending May 31, 2018
Actual Amounts Vs. Approved Budget Comparison Page 1 of 1
6/7/2018 11:35:55PM
GlJdeIncomeStatementByCompany
Summarized Income Statement by Company, YTDCheryl West/TL Shaley
rp_GlJdeIncomeStatementByCompany
Account Description
Current Month Year-To-Date
Actual Budget Variance Actual Budget VarianceLast YearLast Year %
Revenue
24,825 19,948 250,478 219,429 31,049 4,877 19,984 225,651 14.15Rental Revenue
209 (979) 937 (10,770) 11,707 1,189 (4) 7,387 -108.70Bad Debt, Net of Collections
1,251 300 6,672 3,295 3,376 951 360 3,165 102.44Other Tenant Revenue
60,094 47,125 578,325 518,372 59,953 12,969 47,686 547,296 11.57Grants
150 5 1,626 60 1,566 145 25 100 2,627.42Miscellaneous Revenue
86,529 66,399 20,131 838,038 730,386 107,651 Net Revenue 68,051 783,599 14.74
Operating Expense
37,381 20,071 207,812 220,776 (12,964) 17,311 22,512 205,245 -5.87Salaries and Benefits
7,297 6,361 69,438 69,971 (533) 936 8,153 77,451 -.76Supplies and Materials
35 287 805 3,157 (2,352)(252) 357 4,339 -74.50Fleet Costs
6,359 8,815 142,990 96,967 46,023 (2,456) 16,798 147,538 47.46Outside Services
5,901 7,018 69,448 77,738 (8,289)(1,118) 6,353 75,086 -10.66Utilities
204 834 1,631 9,172 (7,541)(629) 0 942 -82.22Protective Services
9,444 4,387 41,682 49,171 (7,489) 5,057 33 26,722 -15.23Insurance
2,317 4,488 37,613 50,448 (12,835)(2,171) 1,956 41,543 -25.44Other Expenses
68,938 52,261 16,678 571,418 577,399 (5,981)Total Operating Expense 56,161 578,866 -1.04
Total Operating Income 17,591 14,138 266,619 152,987 3,453 113,633 204,733 11,890 74.28
Non-Operating Income (Expense)
485 2 3,143 22 3,121 483 136 374 14,046.04Interest Income
(1,227) (3,517) (18,076) (38,683) 20,607 2,289 (3,635) (35,252) -53.27Replacement/Extraordinary Item
(16,785) (16,785) 0 0 139,577 100.00Other Income (Expense)
(10,087) (10,497) (112,980) (115,466) 2,487 410 (10,097) (113,398) -2.15Management Fees
477 476 5,609 5,235 374 2 1,605 17,532 7.15Transfers
(10,352) (13,536) 3,184 (139,088) (148,893) 9,804 Total Non-Operating Income (Expense) (11,990) 8,834 -6.58
Income Before Non-Cash Items 7,240 602 127,531 4,094 6,637 123,437 213,567 (100) 3,014.98
Non-Cash Items
(8,632) (8,415) (93,376) (92,916) (460)(217)(8,454) (92,994) .50Depreciation & Amortization
(8,632) (8,415) (217) (93,376) (92,916) (460)Total Non-Cash Items (8,454) (92,994) .50
Change In Net Assets (1,393) (7,812) 34,156 (88,821) 6,420 122,977 120,573 (8,554) (138.45)
UNAUDITED
For Internal Use Only

Period Ending May 31, 2018
Actual Amounts Vs. Approved Budget Comparison Page 1 of 1
6/7/2018 11:35:58PM
GlJdeIncomeStatementByCompany
Summarized Income Statement by Company, YTDF Furey/C Andrews/Pin Oak II
rp_GlJdeIncomeStatementByCompany
Account Description
Current Month Year-To-Date
Actual Budget Variance Actual Budget VarianceLast YearLast Year %
Revenue
19,265 19,523 181,201 214,758 (33,556)(258) 17,019 204,605 -15.63Rental Revenue
538 (5,368) 5,915 (11,283)(538)(1,783) (5,187) -190.76Bad Debt, Net of Collections
270 339 3,226 3,732 (505)(69) 195 2,945 -13.54Other Tenant Revenue
59,037 46,632 563,886 512,957 50,929 12,405 47,188 536,302 9.93Grants
335 910 3,680 (2,770)(335) 0 1,826 -75.27Miscellaneous Revenue
78,572 67,367 11,205 743,855 741,042 2,814 Net Revenue 62,619 740,491 .38
Operating Expense
19,785 18,835 221,278 207,188 14,090 950 14,621 207,567 6.80Salaries and Benefits
2,414 3,060 39,171 33,665 5,506 (646) 2,765 42,898 16.35Supplies and Materials
219 328 4,643 3,611 1,032 (109) 146 3,739 28.60Fleet Costs
13,455 11,924 178,865 131,161 47,704 1,531 15,304 168,833 36.37Outside Services
7,147 11,055 103,784 121,895 (18,111)(3,908) 11,550 127,390 -14.86Utilities
789 8,676 (8,676)(789) 0 1,487 -100.00Protective Services
9,529 4,078 40,616 45,751 (5,134) 5,450 30 26,085 -11.22Insurance
3,817 6,115 49,339 69,133 (19,793)(2,298) 3,819 55,191 -28.63Other Expenses
56,365 56,185 180 637,696 621,079 16,617 Total Operating Expense 48,234 633,190 2.68
Total Operating Income 22,207 11,182 106,159 119,962 11,025 (13,803) 107,300 14,385 (11.51)
Non-Operating Income (Expense)
473 2 3,366 27 3,340 470 147 364 12,493.53Interest Income
(1,949) (8,200) (21,443) 13,243 1,949 (551) (19,788) -61.76Replacement/Extraordinary Item
(159,944) (159,944) 0 0 244,826 100.00Other Income (Expense)
(9,565) (10,031) (110,666) (110,343) (323) 466 (10,693) (110,068) .29Management Fees
444 445 5,287 4,900 386 (2) 1,472 16,138 7.89Transfers
(8,649) (11,533) 2,884 (270,157) (126,859) (143,298)Total Non-Operating Income (Expense) (9,624) 131,471 112.96
Income Before Non-Cash Items 13,558 (350) (163,998) (6,897) 13,909 (157,101) 238,772 4,761 2,277.94
Non-Cash Items
(14,906) (15,364) (166,826) (169,875) 3,049 458 (18,045) (199,567) -1.79Depreciation & Amortization
217,551 2,393,062 (2,393,062)(217,551) 0 (105,827) -100.00Non-Oper Income (Expense)
(14,906) 202,187 (217,093) (166,826) 2,223,187 (2,390,013)Total Non-Cash Items (18,045) (305,394) -107.50
Change In Net Assets (1,348) 201,837 (330,824) 2,216,290 (203,184) (2,547,115)(66,622)(13,284) (114.93)
UNAUDITED
For Internal Use Only

Period Ending May 31, 2018
Actual Amounts Vs. Approved Budget Comparison Page 1 of 1
6/7/2018 11:36:04PM
GlJdeIncomeStatementByCompany
Summarized Income Statement by Company, YTDLewis Chatham
rp_GlJdeIncomeStatementByCompany
Account Description
Current Month Year-To-Date
Actual Budget Variance Actual Budget VarianceLast YearLast Year %
Revenue
27,626 28,667 305,945 315,333 (9,388)(1,041) 27,058 303,377 -2.98Rental Revenue
1,039 (42) 502 (458) 960 1,080 333 4,893 -209.53Bad Debt, Net of Collections
100 113 1,810 1,238 572 (13) 253 2,388 46.25Other Tenant Revenue
26,912 19,931 247,910 219,240 28,670 6,981 20,213 228,968 13.08Grants
25 64 275 (211)(25) 0 300 -76.73Miscellaneous Revenue
55,677 48,693 6,983 556,231 535,627 20,604 Net Revenue 47,857 539,927 3.85
Operating Expense
17,647 10,623 192,114 116,856 75,258 7,023 13,974 134,754 64.40Salaries and Benefits
3,820 813 33,191 8,938 24,254 3,007 1,488 20,802 271.37Supplies and Materials
25 253 613 2,787 (2,174)(229) 0 1,086 -77.99Fleet Costs
7,294 4,937 54,980 54,311 669 2,357 2,850 50,489 1.23Outside Services
13,619 10,757 151,662 119,962 31,701 2,862 12,281 139,292 26.43Utilities
1,795 670 14,536 7,375 7,161 1,124 561 1,484 97.11Protective Services
2,810 1,309 14,057 14,978 (921) 1,501 20 9,862 -6.15Insurance
3,887 3,763 36,067 42,865 (6,797) 124 1,533 30,652 -15.86Other Expenses
50,897 33,127 17,770 497,222 368,071 129,151 Total Operating Expense 32,708 388,421 35.09
Total Operating Income 4,780 15,567 59,009 167,556 (10,786) (108,547) 151,506 15,149 (64.78)
Non-Operating Income (Expense)
173 1 1,341 15 1,326 172 68 213 8,996.20Interest Income
(642) (3,219) (7,058) 3,840 642 0 (538) -54.40Replacement/Extraordinary Item
0 0 3,986 Other Income (Expense)
(7,964) (8,267) (91,315) (90,934) (382) 303 (8,017) (90,919) .42Management Fees
372 378 4,447 4,156 291 (6) 662 7,220 6.99Transfers
(7,419) (8,529) 1,110 (88,746) (93,821) 5,075 Total Non-Operating Income (Expense) (7,287) (80,038) -5.41
Income Before Non-Cash Items (2,639) 7,037 (29,737) 73,735 (9,676) (103,473) 71,468 7,862 (140.33)
Non-Cash Items
(41,358) (41,170) (461,844) (460,896) (948)(188)(42,068) (462,745) .21Depreciation & Amortization
(41,358) (41,170) (188) (461,844) (460,896) (948)Total Non-Cash Items (42,068) (462,745) .21
Change In Net Assets (43,997) (34,132) (491,581) (387,161)(9,865) (104,420)(391,277)(34,206) 26.97
UNAUDITED
For Internal Use Only
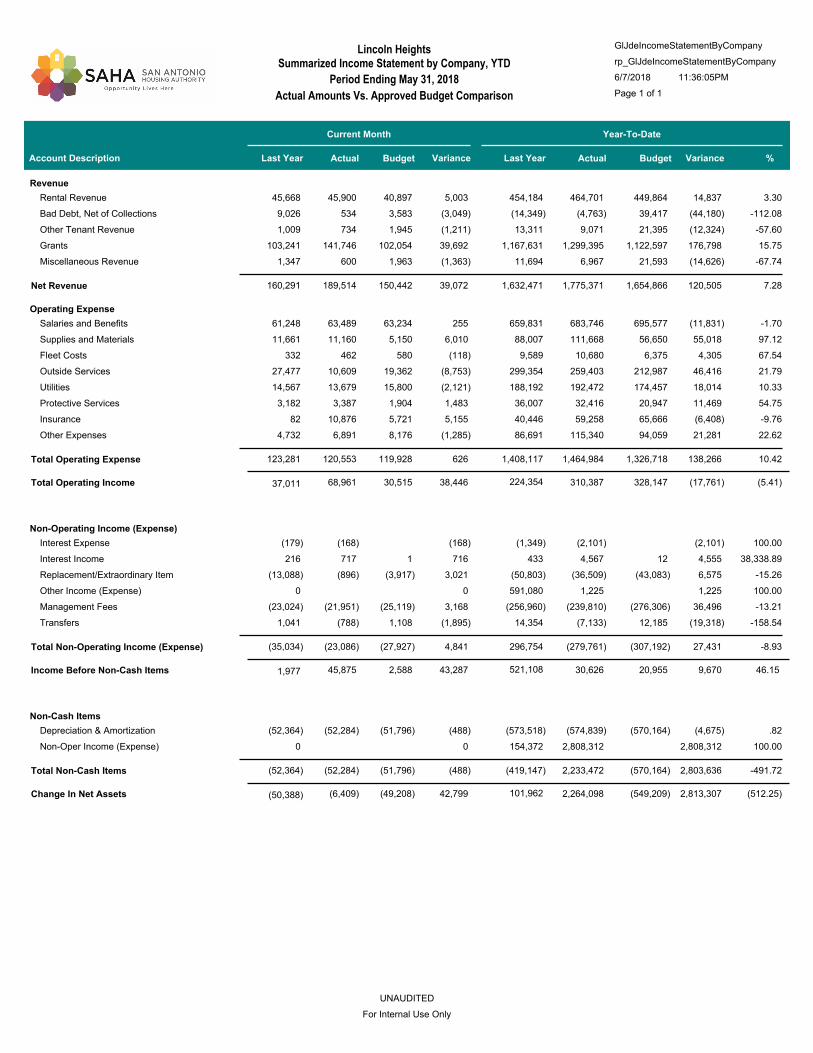
Period Ending May 31, 2018
Actual Amounts Vs. Approved Budget Comparison Page 1 of 1
6/7/2018 11:36:05PM
GlJdeIncomeStatementByCompany
Summarized Income Statement by Company, YTDLincoln Heights
rp_GlJdeIncomeStatementByCompany
Account Description
Current Month Year-To-Date
Actual Budget Variance Actual Budget VarianceLast YearLast Year %
Revenue
45,900 40,897 464,701 449,864 14,837 5,003 45,668 454,184 3.30Rental Revenue
534 3,583 (4,763) 39,417 (44,180)(3,049) 9,026 (14,349) -112.08Bad Debt, Net of Collections
734 1,945 9,071 21,395 (12,324)(1,211) 1,009 13,311 -57.60Other Tenant Revenue
141,746 102,054 1,299,395 1,122,597 176,798 39,692 103,241 1,167,631 15.75Grants
600 1,963 6,967 21,593 (14,626)(1,363) 1,347 11,694 -67.74Miscellaneous Revenue
189,514 150,442 39,072 1,775,371 1,654,866 120,505 Net Revenue 160,291 1,632,471 7.28
Operating Expense
63,489 63,234 683,746 695,577 (11,831) 255 61,248 659,831 -1.70Salaries and Benefits
11,160 5,150 111,668 56,650 55,018 6,010 11,661 88,007 97.12Supplies and Materials
462 580 10,680 6,375 4,305 (118) 332 9,589 67.54Fleet Costs
10,609 19,362 259,403 212,987 46,416 (8,753) 27,477 299,354 21.79Outside Services
13,679 15,800 192,472 174,457 18,014 (2,121) 14,567 188,192 10.33Utilities
3,387 1,904 32,416 20,947 11,469 1,483 3,182 36,007 54.75Protective Services
10,876 5,721 59,258 65,666 (6,408) 5,155 82 40,446 -9.76Insurance
6,891 8,176 115,340 94,059 21,281 (1,285) 4,732 86,691 22.62Other Expenses
120,553 119,928 626 1,464,984 1,326,718 138,266 Total Operating Expense 123,281 1,408,117 10.42
Total Operating Income 68,961 30,515 310,387 328,147 38,446 (17,761) 224,354 37,011 (5.41)
Non-Operating Income (Expense)
(168) (2,101) (2,101)(168)(179) (1,349) 100.00Interest Expense
717 1 4,567 12 4,555 716 216 433 38,338.89Interest Income
(896) (3,917) (36,509) (43,083) 6,575 3,021 (13,088) (50,803) -15.26Replacement/Extraordinary Item
1,225 1,225 0 0 591,080 100.00Other Income (Expense)
(21,951) (25,119) (239,810) (276,306) 36,496 3,168 (23,024) (256,960) -13.21Management Fees
(788) 1,108 (7,133) 12,185 (19,318)(1,895) 1,041 14,354 -158.54Transfers
(23,086) (27,927) 4,841 (279,761) (307,192) 27,431 Total Non-Operating Income (Expense) (35,034) 296,754 -8.93
Income Before Non-Cash Items 45,875 2,588 30,626 20,955 43,287 9,670 521,108 1,977 46.15
Non-Cash Items
(52,284) (51,796) (574,839) (570,164) (4,675)(488)(52,364) (573,518) .82Depreciation & Amortization
2,808,312 2,808,312 0 0 154,372 100.00Non-Oper Income (Expense)
(52,284) (51,796) (488) 2,233,472 (570,164) 2,803,636 Total Non-Cash Items (52,364) (419,147) -491.72
Change In Net Assets (6,409) (49,208) 2,264,098 (549,209) 42,799 2,813,307 101,962 (50,388) (512.25)
UNAUDITED
For Internal Use Only

Period Ending May 31, 2018
Actual Amounts Vs. Approved Budget Comparison Page 1 of 1
6/7/2018 11:36:07PM
GlJdeIncomeStatementByCompany
Summarized Income Statement by Company, YTDMadonna/Sahara Ramsey
rp_GlJdeIncomeStatementByCompany
Account Description
Current Month Year-To-Date
Actual Budget Variance Actual Budget VarianceLast YearLast Year %
Revenue
21,139 24,253 229,060 266,778 (37,718)(3,114) 19,625 216,773 -14.14Rental Revenue
200 133 (2,527) 967 (3,494) 67 (9) (998) -361.41Bad Debt, Net of Collections
226 796 5,411 10,354 (4,943)(570) 248 5,820 -47.74Other Tenant Revenue
21,186 14,164 187,443 155,800 31,643 7,022 14,362 167,854 20.31Grants
175 8 347 92 255 167 25 200 278.28Miscellaneous Revenue
42,926 39,354 3,572 419,734 433,990 (14,257)Net Revenue 34,251 389,649 -3.28
Operating Expense
19,015 17,573 184,320 193,609 (9,289) 1,442 17,850 171,523 -4.80Salaries and Benefits
693 863 21,640 9,488 12,152 (169) 384 14,393 128.08Supplies and Materials
2,237 89 3,402 975 2,427 2,148 156 2,221 248.79Fleet Costs
4,370 4,542 83,952 49,958 33,994 (172) 1,017 55,533 68.04Outside Services
6,684 6,382 84,207 92,904 (8,697) 301 7,140 80,796 -9.36Utilities
428 4,710 (4,710)(428) 0 -100.00Protective Services
2,287 1,390 12,057 15,983 (3,926) 897 22 8,658 -24.57Insurance
1,268 2,291 21,249 26,556 (5,307)(1,024) 1,317 20,516 -19.98Other Expenses
36,553 33,557 2,996 410,828 394,184 16,644 Total Operating Expense 27,887 353,639 4.22
Total Operating Income 6,373 5,796 8,906 39,806 577 (30,900) 36,010 6,364 (77.63)
Non-Operating Income (Expense)
186 1,378 1,378 186 63 124 100.00Interest Income
(41) (633) (4,568) (6,967) 2,399 592 (2,071) (14,948) -34.44Replacement/Extraordinary Item
(22,198) (22,198) 0 0 132,906 100.00Other Income (Expense)
(5,109) (5,413) (58,415) (59,538) 1,123 303 (5,277) (58,750) -1.89Management Fees
238 240 2,787 2,641 146 (2) 522 5,724 5.53Transfers
(4,726) (5,806) 1,080 (81,016) (63,863) (17,152)Total Non-Operating Income (Expense) (6,762) 65,055 26.86
Income Before Non-Cash Items 1,647 (9) (72,109) (24,057) 1,656 (48,053) 101,065 (399) 199.75
Non-Cash Items
(8,410) (8,359) (92,956) (92,390) (566)(51)(8,422) (123,596) .61Depreciation & Amortization
768,405 768,405 0 0 (4,606) 100.00Non-Oper Income (Expense)
(8,410) (8,359) (51) 675,449 (92,390) 767,839 Total Non-Cash Items (8,422) (128,202) -831.08
Change In Net Assets (6,763) (8,368) 603,339 (116,447) 1,605 719,786 (27,137)(8,821) (618.12)
UNAUDITED
For Internal Use Only

Period Ending May 31, 2018
Actual Amounts Vs. Approved Budget Comparison Page 1 of 1
6/7/2018 11:36:09PM
GlJdeIncomeStatementByCompany
Summarized Income Statement by Company, YTDPin Oak I
rp_GlJdeIncomeStatementByCompany
Account Description
Current Month Year-To-Date
Actual Budget Variance Actual Budget VarianceLast YearLast Year %
Revenue
12,320 11,667 132,146 128,333 3,813 653 12,102 126,129 2.97Rental Revenue
(85) 197 (930) 1,127 85 128 909 -121.16Bad Debt, Net of Collections
78 189 1,158 2,078 (920)(110) 180 1,597 -44.30Other Tenant Revenue
9,918 8,250 97,742 90,746 6,996 1,668 8,367 94,381 7.71Grants
25 50 275 (225)(25) 0 50 -81.82Miscellaneous Revenue
22,316 20,046 2,271 231,292 220,502 10,791 Net Revenue 20,777 223,066 4.89
Operating Expense
6,440 7,282 89,300 80,101 9,200 (842) 5,504 77,583 11.49Salaries and Benefits
2,419 887 20,068 9,757 10,311 1,532 385 9,781 105.68Supplies and Materials
36 401 (401)(36) 0 -100.00Fleet Costs
2,496 2,784 11,109 30,624 (19,515)(288)(1,763) 41,102 -63.73Outside Services
4,348 3,750 58,690 41,250 17,440 598 4,264 52,138 42.28Utilities
282 190 3,099 (2,908)(282) 0 -93.86Protective Services
546 1,065 7,003 12,075 (5,073)(519) 9 9,654 -42.01Insurance
1,563 1,925 16,796 21,762 (4,967)(362) 1,081 17,704 -22.82Other Expenses
17,812 18,011 (199) 203,156 199,068 4,087 Total Operating Expense 9,481 207,963 2.05
Total Operating Income 4,505 2,035 28,137 21,433 2,470 6,703 15,102 11,296 31.28
Non-Operating Income (Expense)
34 34 0 5 41 100.00Interest Income
(63) (4,487) (695) (3,792) 63 0 (6,798) 545.71Replacement/Extraordinary Item
0 0 14,565 Other Income (Expense)
(2,842) (3,439) (31,931) (37,832) 5,901 598 (2,867) (34,518) -15.60Management Fees
158 160 1,900 1,763 137 (3) 244 2,706 7.77Transfers
(2,684) (3,342) 658 (34,484) (36,764) 2,280 Total Non-Operating Income (Expense) (2,618) (24,004) -6.20
Income Before Non-Cash Items 1,821 (1,307) (6,347) (15,330) 3,128 8,984 (8,902) 8,678 (58.60)
Non-Cash Items
(5,321) (5,063) (57,767) (55,690) (2,077)(259)(5,132) (55,960) 3.73Depreciation & Amortization
0 0 107,863 Non-Oper Income (Expense)
(5,321) (5,063) (259) (57,767) (55,690) (2,077)Total Non-Cash Items (5,132) 51,903 3.73
Change In Net Assets (3,501) (6,370) (64,114) (71,021) 2,869 6,907 43,001 3,545 (9.73)
UNAUDITED
For Internal Use Only

Period Ending May 31, 2018
Actual Amounts Vs. Approved Budget Comparison Page 1 of 1
6/7/2018 11:36:16PM
GlJdeIncomeStatementByCompany
Summarized Income Statement by Company, YTDSpingview Convent
rp_GlJdeIncomeStatementByCompany
Account Description
Current Month Year-To-Date
Actual Budget Variance Actual Budget VarianceLast YearLast Year %
Revenue
(29,374) (29,274) (29,274)(29,374) 0 100.00Bad Debt, Net of Collections
2,669 8,333 46,791 91,667 (44,876)(5,665) 3,525 43,131 -48.96Other Tenant Revenue
0 0 Miscellaneous Revenue
(26,706) 8,333 (35,039) 17,517 91,667 (74,150)Net Revenue 3,525 43,131 -80.89
Operating Expense
3,836 3,620 35,378 39,818 (4,440) 216 6,446 57,333 -11.15Salaries and Benefits
179 461 1,964 (1,503)(179) 0 2,030 -76.52Supplies and Materials
0 0 Fleet Costs
2,309 8,809 21,261 96,902 (75,641)(6,500) 850 15,812 -78.06Outside Services
3,653 5,469 51,587 60,963 (9,377)(1,815) 3,974 49,487 -15.38Utilities
2 176 459 2,086 (1,627)(173) 6 1,311 -77.99Insurance
461 1,171 4,137 12,883 (8,746)(710) 509 8,906 -67.89Other Expenses
10,262 19,423 (9,161) 113,283 214,617 (101,334)Total Operating Expense 11,785 134,878 -47.22
Total Operating Income (36,968) (11,090) (95,766) (122,950)(25,878) 27,184 (91,748)(8,259) (22.11)
Non-Operating Income (Expense)
13 13 0 0 1 100.00Interest Income
(500) (5,500) 5,500 500 0 (2,587) -100.00Replacement/Extraordinary Item
0 0 (100)Other Income (Expense)
(19) (19) 0 0 100.00Management Fees
26,778 26,778 0 6,967 105,855 100.00Transfers
(500) 500 26,771 (5,500) 32,271 Total Non-Operating Income (Expense) 6,967 103,170 -586.75
Income Before Non-Cash Items (36,968) (11,590) (68,995) (128,450)(25,378) 59,456 11,422 (1,292) (46.29)
Non-Cash Items
(7,837) (7,837) (86,208) (86,208) 0 0 (7,837) (86,208) .00Depreciation & Amortization
(7,837) (7,837) (86,208) (86,208) 0 Total Non-Cash Items (7,837) (86,208) .00
Change In Net Assets (44,805) (19,427) (155,203) (214,659)(25,378) 59,456 (74,786)(9,129) (27.70)
UNAUDITED
For Internal Use Only

Period Ending May 31, 2018
Actual Amounts Vs. Approved Budget Comparison Page 1 of 1
6/7/2018 11:36:12PM
GlJdeIncomeStatementByCompany
Summarized Income Statement by Company, YTDSpringview
rp_GlJdeIncomeStatementByCompany
Account Description
Current Month Year-To-Date
Actual Budget Variance Actual Budget VarianceLast YearLast Year %
Revenue
29,023 39,589 336,033 435,474 (99,440)(10,565) 31,296 317,042 -22.83Rental Revenue
(5,856) 1,167 (8,639) 12,833 (21,473)(7,023) 4,460 1,284 -167.32Bad Debt, Net of Collections
4,105 4,417 62,846 48,583 14,262 (312) 4,180 46,516 29.36Other Tenant Revenue
52,849 38,473 519,684 423,203 96,481 14,376 42,362 468,777 22.80Grants
488 1,391 7,894 15,298 (7,404)(903) 2,231 13,363 -48.40Miscellaneous Revenue
80,609 85,036 (4,427) 917,818 935,391 (17,573)Net Revenue 84,529 846,982 -1.88
Operating Expense
35,714 29,741 334,977 327,151 7,826 5,973 33,813 326,144 2.39Salaries and Benefits
5,062 2,977 56,128 32,749 23,379 2,085 1,942 32,644 71.39Supplies and Materials
296 424 11,097 4,667 6,430 (128) 310 5,734 137.79Fleet Costs
28,994 14,948 241,677 164,430 77,247 14,046 18,257 186,776 46.98Outside Services
16,188 15,351 168,045 169,771 (1,725) 837 14,853 145,315 -1.02Utilities
924 1,025 10,984 11,279 (295)(101) 2,190 14,981 -2.61Protective Services
12,707 5,715 57,182 64,075 (6,893) 6,993 38 41,762 -10.76Insurance
4,794 6,232 56,481 70,942 (14,461)(1,439) 2,824 68,337 -20.38Other Expenses
104,680 76,414 28,266 936,571 845,064 91,508 Total Operating Expense 74,226 821,693 10.83
Total Operating Income (24,071) 8,622 (18,753) 90,327 (32,693) (109,080) 25,289 10,303 (120.76)
Non-Operating Income (Expense)
246 133 1,343 1,463 (120) 113 77 851 -8.21Interest Income
(460) (4,817) (5,065) 247 460 1,238 (6,908) -4.88Replacement/Extraordinary Item
500 500 0 0 100.00Other Income (Expense)
(11,892) (12,031) (134,789) (132,336) (2,453) 139 (12,121) (133,823) 1.85Management Fees
594 594 (19,846) 6,539 (26,385) 0 (5,695) (92,595) -403.49Transfers
(11,052) (11,763) 712 (157,610) (129,398) (28,211)Total Non-Operating Income (Expense) (16,501) (232,475) 21.80
Income Before Non-Cash Items (35,123) (3,142) (176,363) (39,071)(31,981) (137,291)(207,186)(6,198) 351.39
Non-Cash Items
(67,350) (67,256) (760,736) (759,698) (1,037)(94)(70,192) (774,482) .14Depreciation & Amortization
1,608 97,448 97,448 1,608 (3,193) 32,594 100.00Non-Oper Income (Expense)
(65,743) (67,256) 1,513 (663,288) (759,698) 96,411 Total Non-Cash Items (73,385) (741,887) -12.69
Change In Net Assets (100,865) (70,398) (839,651) (798,770)(30,468) (40,881)(949,073)(79,583) 5.12
UNAUDITED
For Internal Use Only

Period Ending May 31, 2018
Actual Amounts Vs. Approved Budget Comparison Page 1 of 1
6/7/2018 11:36:18PM
GlJdeIncomeStatementByCompany
Summarized Income Statement by Company, YTDTarry Towne/Escondida/Wmburg
rp_GlJdeIncomeStatementByCompany
Account Description
Current Month Year-To-Date
Actual Budget Variance Actual Budget VarianceLast YearLast Year %
Revenue
35,025 40,149 385,181 441,643 (56,462)(5,124) 36,431 388,203 -12.78Rental Revenue
137 105 (1,244) 1,250 (2,494) 33 161 (93) -199.56Bad Debt, Net of Collections
60 300 2,229 3,300 (1,071)(240) 257 2,841 -32.45Other Tenant Revenue
30,803 20,762 271,363 228,379 42,984 10,041 21,059 240,996 18.82Grants
403 403 0 0 100.00Miscellaneous Revenue
66,025 61,316 4,709 657,932 674,571 (16,639)Net Revenue 57,908 631,947 -2.47
Operating Expense
23,917 24,666 254,835 271,344 (16,509)(750) 23,208 256,978 -6.08Salaries and Benefits
488 1,651 20,108 18,159 1,949 (1,163) 1,855 26,931 10.73Supplies and Materials
166 139 2,350 1,524 826 28 330 2,488 54.18Fleet Costs
7,630 6,375 125,028 70,720 54,307 1,255 5,625 93,664 76.79Outside Services
10,709 13,051 150,362 151,132 (769)(2,342) 11,834 138,554 -.51Utilities
749 8,243 (8,243)(749) 0 -100.00Protective Services
5,086 2,757 25,209 31,433 (6,224) 2,329 38 17,139 -19.80Insurance
2,755 3,603 30,630 41,413 (10,783)(848) 1,765 31,476 -26.04Other Expenses
50,751 52,991 (2,240) 608,522 593,968 14,554 Total Operating Expense 44,654 567,228 2.45
Total Operating Income 15,274 8,325 49,410 80,604 6,950 (31,194) 64,719 13,254 (38.70)
Non-Operating Income (Expense)
383 2 2,879 17 2,862 381 108 238 16,897.46Interest Income
(118) (742) (7,975) (11,058) 3,084 623 0 (8,936) -27.89Replacement/Extraordinary Item
896 (179,313) (179,313) 896 0 232,585 100.00Other Income (Expense)
(9,195) (9,663) (100,417) (106,288) 5,871 468 (8,995) (102,872) -5.52Management Fees
418 420 4,874 4,615 258 (2) 713 7,757 5.60Transfers
(7,617) (9,983) 2,367 (279,951) (112,714) (167,237)Total Non-Operating Income (Expense) (8,174) 128,771 148.37
Income Before Non-Cash Items 7,658 (1,658) (230,541) (32,110) 9,316 (198,431) 193,490 5,080 617.97
Non-Cash Items
(12,615) (11,483) (150,069) (139,956) (10,113)(1,132)(13,279) (188,491) 7.23Depreciation & Amortization
12,886 141,749 (141,749)(12,886) 0 (8,059) -100.00Non-Oper Income (Expense)
(12,615) 1,404 (14,018) (150,069) 1,793 (151,861)Total Non-Cash Items (13,279) (196,550) -8,471.76
Change In Net Assets (4,957) (255) (380,610) (30,318)(4,702) (350,292)(3,060)(8,199) 1,155.40
UNAUDITED
For Internal Use Only

Period Ending May 31, 2018
Actual Amounts Vs. Approved Budget Comparison Page 1 of 1
6/7/2018 11:36:24PM
GlJdeIncomeStatementByCompany
Summarized Income Statement by Company, YTDVictoria Plaza/Schnabel
rp_GlJdeIncomeStatementByCompany
Account Description
Current Month Year-To-Date
Actual Budget Variance Actual Budget VarianceLast YearLast Year %
Revenue
11,699 25,331 185,246 278,640 (93,394)(13,632) 50,091 607,662 -33.52Rental Revenue
250 182 9,605 1,997 7,607 68 2,902 7,524 380.87Bad Debt, Net of Collections
(247) 9,361 5,321 23,082 (17,760)(9,607) 532 25,495 -76.95Other Tenant Revenue
70,915 56,343 687,901 619,777 68,124 14,572 57,112 616,503 10.99Grants
79 1,505 870 635 (79) 50 5,935 72.96Miscellaneous Revenue
82,617 91,296 (8,678) 889,578 924,366 (34,788)Net Revenue 110,687 1,263,118 -3.76
Operating Expense
(7,809) 14,670 167,499 161,367 6,132 (22,478) 33,521 374,164 3.80Salaries and Benefits
3,078 2,252 25,296 24,773 523 826 3,974 58,450 2.11Supplies and Materials
230 637 2,525 (1,887)(230) 80 800 -74.76Fleet Costs
7,164 9,413 118,187 109,616 8,571 (2,249) 6,693 172,732 7.82Outside Services
5,379 13,719 126,992 153,136 (26,145)(8,340) 16,567 208,533 -17.07Utilities
509 1,437 4,217 15,803 (11,586)(928) 0 9,316 -73.31Protective Services
7,219 3,015 33,044 34,010 (966) 4,204 62 34,263 -2.84Insurance
3,734 7,959 129,510 90,835 38,674 (4,225) 10,831 293,730 42.58Other Expenses
19,273 52,694 (33,421) 605,383 592,065 13,317 Total Operating Expense 71,727 1,151,987 2.25
Total Operating Income 63,344 38,602 284,196 332,301 24,742 (48,105) 111,131 38,960 (14.48)
Non-Operating Income (Expense)
(1,178) (14,729) (14,729)(1,178)(1,256) (9,458) 100.00Interest Expense
47,565 11,444 514,862 125,879 388,983 36,121 46,085 399,855 309.01Interest Income
(520) (3,634) (8,120) 4,486 520 0 (26,276) -55.25Replacement/Extraordinary Item
(766) (766) 0 0 (100) 100.00Other Income (Expense)
(17,383) (18,515) (185,506) (203,661) 18,155 1,132 (14,475) (192,943) -8.91Management Fees
(12,398) 814 (130,973) 8,955 (139,929)(13,212)(11,231) (103,832) -1,562.56Transfers
16,606 (6,777) 23,383 179,254 (76,947) 256,201 Total Non-Operating Income (Expense) 19,123 67,246 -332.96
Income Before Non-Cash Items 79,950 31,825 463,450 255,354 48,125 208,096 178,376 58,083 81.49
Non-Cash Items
(27,275) (26,815) (309,321) (305,326) (3,995)(460)(28,609) (316,237) 1.31Depreciation & Amortization
295,981 295,981 0 454,037 1,745,944 100.00Non-Oper Income (Expense)
(27,275) (26,815) (460) (13,340) (305,326) 291,986 Total Non-Cash Items 425,429 1,429,707 -95.63
Change In Net Assets 52,675 5,010 450,110 (49,972) 47,665 500,082 1,608,083 483,512 (1,000.73)
UNAUDITED
For Internal Use Only

Period Ending May 31, 2018
Actual Amounts Vs. Approved Budget Comparison Page 1 of 1
6/7/2018 11:36:28PM
GlJdeIncomeStatementByCompany
Summarized Income Statement by Company, YTDVilla Hermosa/McGuire
rp_GlJdeIncomeStatementByCompany
Account Description
Current Month Year-To-Date
Actual Budget Variance Actual Budget VarianceLast YearLast Year %
Revenue
30,187 38,826 333,341 427,090 (93,749)(8,639) 31,117 332,587 -21.95Rental Revenue
(917) 1,436 (2,452) 15,792 (18,244)(2,353)(5,771) (4,516) -115.52Bad Debt, Net of Collections
524 694 4,318 7,630 (3,311)(169) 753 7,740 -43.40Other Tenant Revenue
33,131 22,666 296,963 249,321 47,642 10,465 22,984 245,628 19.11Grants
175 21 325 231 94 154 0 265 40.69Miscellaneous Revenue
63,100 63,642 (542) 632,496 700,063 (67,567)Net Revenue 49,082 581,704 -9.65
Operating Expense
18,522 22,185 188,894 244,030 (55,136)(3,663) 21,144 176,337 -22.59Salaries and Benefits
1,512 1,177 13,494 12,946 548 335 2,652 15,378 4.24Supplies and Materials
277 181 3,050 (2,869)(277) 0 2,673 -94.07Fleet Costs
16,913 7,336 113,447 80,696 32,751 9,577 26,527 122,641 40.59Outside Services
13,515 15,497 159,679 173,326 (13,647)(1,982) 13,355 151,363 -7.87Utilities
203 727 2,465 7,994 (5,529)(523) 1,033 6,643 -69.16Protective Services
4,202 2,122 20,643 24,298 (3,656) 2,080 21 10,632 -15.04Insurance
3,853 4,552 46,215 51,567 (5,352)(699) 2,894 47,721 -10.38Other Expenses
58,720 53,872 4,848 545,019 597,908 (52,889)Total Operating Expense 67,625 533,389 -8.85
Total Operating Income 4,380 9,770 87,477 102,155 (5,390) (14,678) 48,315 (18,542) (14.37)
Non-Operating Income (Expense)
792 2 5,379 27 5,353 789 242 510 20,025.14Interest Income
(217) (8) (2,383) 2,375 217 0 (2,584) -99.64Replacement/Extraordinary Item
(988) (988) 0 0 100.00Other Income (Expense)
(8,806) (9,466) (98,921) (104,125) 5,204 660 (8,540) (101,045) -5.00Management Fees
410 411 4,775 4,516 259 (1) 552 7,098 5.73Transfers
(7,605) (9,270) 1,665 (89,763) (101,966) 12,202 Total Non-Operating Income (Expense) (7,746) (96,021) -11.97
Income Before Non-Cash Items (3,224) 500 (2,286) 189 (3,725) (2,475)(47,705)(26,289) (1,308.16)
Non-Cash Items
(57,821) (56,928) (638,344) (628,078) (10,266)(893)(57,976) (635,917) 1.63Depreciation & Amortization
0 0 590,000 Non-Oper Income (Expense)
(57,821) (56,928) (893) (638,344) (628,078) (10,266)Total Non-Cash Items (57,976) (45,917) 1.63
Change In Net Assets (61,045) (56,427) (640,629) (627,889)(4,618) (12,741)(93,622)(84,265) 2.03
UNAUDITED
For Internal Use Only

Period Ending May 31, 2018
Actual Amounts Vs. Approved Budget Comparison Page 1 of 1
6/7/2018 11:36:29PM
GlJdeIncomeStatementByCompany
Summarized Income Statement by Company, YTDVilla Tranchese
rp_GlJdeIncomeStatementByCompany
Account Description
Current Month Year-To-Date
Actual Budget Variance Actual Budget VarianceLast YearLast Year %
Revenue
48,519 48,354 532,372 531,899 473 165 48,432 528,903 .09Rental Revenue
(456) 933 (2,773) 10,267 (13,039)(1,389)(9,012) (2,071) -127.01Bad Debt, Net of Collections
198 468 1,932 5,146 (3,214)(269) 275 3,601 -62.45Other Tenant Revenue
53,449 39,238 496,971 431,623 65,348 14,211 39,782 443,736 15.14Grants
1,878 2,547 19,135 28,019 (8,884)(669) 1,728 21,366 -31.71Miscellaneous Revenue
103,588 91,541 12,047 1,047,637 1,006,953 40,684 Net Revenue 81,205 995,535 4.04
Operating Expense
33,278 30,162 351,493 331,777 19,716 3,117 36,320 358,284 5.94Salaries and Benefits
5,029 3,350 37,509 36,850 659 1,679 2,920 30,894 1.79Supplies and Materials
508 271 3,860 2,986 874 237 20 3,416 29.28Fleet Costs
7,259 12,632 127,600 138,955 (11,355)(5,374) 1,109 136,008 -8.17Outside Services
16,499 20,490 217,945 228,793 (10,848)(3,991) 17,866 215,770 -4.74Utilities
606 1,132 9,614 12,457 (2,843)(527) 1,046 11,122 -22.82Protective Services
7,044 2,116 33,972 24,631 9,342 4,928 38 12,028 37.93Insurance
3,719 5,325 48,751 61,300 (12,549)(1,607) 1,942 48,788 -20.47Other Expenses
73,941 75,479 (1,538) 830,744 837,748 (7,004)Total Operating Expense 61,261 816,310 -.84
Total Operating Income 29,647 16,062 216,893 169,205 13,585 47,688 179,224 19,944 28.18
Non-Operating Income (Expense)
(440) (5,502) (5,502)(440)(469) (3,533) 100.00Interest Expense
331 2 2,263 27 2,236 328 115 388 8,366.82Interest Income
(29) (1,304) (15,379) (14,346) (1,033) 1,275 0 (5,098) 7.20Replacement/Extraordinary Item
(14,401) (14,078) (154,743) (154,861) 118 (322)(13,848) (153,563) -.08Management Fees
(4,302) 646 (44,984) 7,109 (52,093)(4,949)(3,565) (31,846) -732.75Transfers
(18,842) (14,734) (4,108) (218,345) (162,071) (56,274)Total Non-Operating Income (Expense) (17,767) (193,653) 34.72
Income Before Non-Cash Items 10,806 1,329 (1,451) 7,134 9,477 (8,585)(14,428) 2,177 (120.34)
Non-Cash Items
(20,134) (20,024) (250,062) (248,825) (1,237)(110)(27,076) (305,855) .50Depreciation & Amortization
23,542 2,072 258,958 (256,887)(23,542) 0 -99.20Non-Oper Income (Expense)
(20,134) 3,518 (23,652) (247,990) 10,133 (258,124)Total Non-Cash Items (27,076) (305,855) -2,547.24
Change In Net Assets (9,328) 4,846 (249,441) 17,268 (14,174) (266,709)(320,283)(24,899) (1,544.57)
UNAUDITED
For Internal Use Only

Period Ending May 31, 2018
Actual Amounts Vs. Approved Budget Comparison Page 1 of 1
6/7/2018 11:36:36PM
GlJdeIncomeStatementByCompany
Summarized Income Statement by Company, YTDWheatley/Olive Pk/Village East
rp_GlJdeIncomeStatementByCompany
Account Description
Current Month Year-To-Date
Actual Budget Variance Actual Budget VarianceLast YearLast Year %
Revenue
7,641 7,583 78,891 83,417 (4,526) 58 7,402 84,747 -5.43Rental Revenue
1,085 460 1,976 5,055 (3,079) 625 3,608 8,882 -60.91Bad Debt, Net of Collections
565 99 2,040 1,085 955 466 235 1,641 87.95Other Tenant Revenue
29,476 42,079 408,328 462,867 (54,539)(12,603) 42,215 572,369 -11.78Grants
2,640 250 2,910 2,750 160 2,390 0 746 5.83Miscellaneous Revenue
41,407 50,470 (9,063) 494,145 555,174 (61,028)Net Revenue 53,460 668,386 -10.99
Operating Expense
13,298 10,681 127,826 117,488 10,338 2,618 10,035 100,694 8.80Salaries and Benefits
2,347 680 18,177 7,478 10,699 1,667 0 6,156 143.07Supplies and Materials
36 401 (401)(36) 0 -100.00Fleet Costs
2,891 2,799 60,319 30,790 29,529 92 3,025 40,625 95.90Outside Services
(1,787) 6,272 69,747 69,138 609 (8,059) 7,061 76,251 .88Utilities
584 282 4,224 3,099 1,125 302 70 6,136 36.30Protective Services
3,295 1,485 15,247 16,767 (1,520) 1,810 13 8,935 -9.07Insurance
630 537 9,298 7,802 1,496 93 665 15,986 19.18Other Expenses
21,259 22,772 (1,513) 304,838 252,962 51,876 Total Operating Expense 20,869 254,782 20.51
Total Operating Income 20,148 27,699 189,307 302,211 (7,550) (112,904) 413,604 32,592 (37.36)
Non-Operating Income (Expense)
2,968 4 39,576 40 39,536 2,964 511 1,559 99,013.90Interest Income
(217) (428) (5,042) (4,705) (337) 211 0 (3,251) 7.15Replacement/Extraordinary Item
(3,407) (4,580) (56,269) (50,378) (5,891) 1,172 (6,683) (87,390) 11.69Management Fees
155 157 1,880 1,729 151 (2) 3,288 34,714 8.73Transfers
(501) (4,847) 4,346 (19,855) (53,315) 33,460 Total Non-Operating Income (Expense) (2,885) (54,368) -62.76
Income Before Non-Cash Items 19,647 22,852 169,452 248,897 (3,205) (79,444) 359,236 29,707 (31.92)
Non-Cash Items
(2,413) (2,413) (36,204) (36,196) (9) 0 (3,485) (38,340) .02Depreciation & Amortization
312 3,434 (3,434)(312) 0 1,017,786 -100.00Non-Oper Income (Expense)
(2,413) (2,101) (312) (36,204) (32,762) (3,442)Total Non-Cash Items (3,485) 979,446 10.51
Change In Net Assets 17,234 20,751 133,248 216,135 (3,517) (82,887) 1,338,681 26,222 (38.35)
UNAUDITED
For Internal Use Only

Period Ending May 31, 2018
Actual Amounts Vs. Approved Budget Comparison Page 1 of 2
6/7/2018 11:35:18PM
GlJdeIncomeStatementByLineOfBusinessByGroup
Summarized Income Statement by Line of Business, YTDrp_GlJdeIncomeStatementByLineOfBusinessByGroup
Public Housing
Account Description
Current Month Year-To-Date
Actual Budget Variance Actual Budget VarianceLast YearLast Year %
Revenue
(102,791) (102,791) 82 Rental Revenue 100.00
85,049 85,049 12 255 Bad Debt, Net of Collections 100.00
139,435 1,984,010 1,629,846 354,164 (8,733) 147,043 1,520,106 Grants 21.73 148,168
47,024 47,024 17,054 Miscellaneous Revenue 100.00
2,013,292 1,629,846 383,446 Net Revenue 23.53 1,537,497 147,055 139,435 (8,733) 148,168
Operating Expense
(2)Salaries and Benefits
381 6,956 6,956 381 Outside Services 100.00
378 378 Utilities 100.00
15,328 104,011 85,862 18,150 7,907 7,195 79,751 Other Expenses 21.14 7,421
111,345 85,862 25,484 Total Operating Expense 29.68 79,749 7,195 15,710 8,289 7,421
Total Operating Income 123,725 1,901,946 1,543,984 (17,021) 357,962 1,457,748 139,860 23.18 140,747
Non-Operating Income (Expense)
777 5,339 41 5,297 773 108 332 Interest Income 12,773.74 4
Replacement/Extraordinary Item
(303,903) (1,377,638) (1,268,954) (108,684)(188,543)(65,770) (1,071,942)Other Income (Expense) 8.56 (115,359)
(18,456) (201,614) (197,082) (4,532)(540)(14,456) (185,735)Management Fees 2.30 (17,917)
Transfers
(1,573,913) (1,465,995) (107,919)Total Non-Operating Income (Expense) 7.36 (1,257,344)(80,118) (321,582) (188,310)(133,272)
Surplus or (Deficit) Prior to Non-Cash Items (197,856) 328,033 77,990 (205,331) 250,043 200,404 59,742 320.61 7,475
Non-Cash Items
647,352 (647,352)(58,850) 11,359 Non-Oper Income (Expense) (100.00) 58,850
647,352 (647,352)Total Non-Cash Items (100.00) 11,359 (58,850) 58,850
Change In Net Assets (197,856) 328,033 725,342 (264,181) (397,309) 211,763 59,742 (54.78) 66,325
UNAUDITED
For Internal Use Only

Period Ending May 31, 2018
Actual Amounts Vs. Approved Budget Comparison Page 2 of 2
6/7/2018 11:35:18PM
GlJdeIncomeStatementByLineOfBusinessByGroup
Summarized Income Statement by Line of Business, YTDrp_GlJdeIncomeStatementByLineOfBusinessByGroup
Public Housing
0K
200K
400K
600K
800K
1000K
1200K
1400K
1,378K
97K 94K 54K 42K 6K 4K 4K 4K 2K
Other GeneralExpenses
Management Fee -Internal
Dues and Fees
Asset ManagementFee
Bookkeeping
Lawn Services
UAC Service Fee
Audit Expense
A/R Service Fee
Legal Fees - ClientBillings
Top 10 Operating Expenses
Year-To-Date
0K
2K
4K
6K
8K
10K
12K
14K
13K
10K
6K5K
2K 2K 1K 1K 1K 0K
Dues and Fees
Management Fee -Internal
Lawn Services
Interest Inc-GeneralFund
Legal Fees - ClientBillings
Legal Fees
Other MaintenanceContracts
Training
Other AdministrativeExpenses
BOC Service Fee
Top 10 Variances Over Budget
Year-To-Date
-200K
-100K
0K100K
200K
300K
400K2017
-200K
-100K
0K100K
200K
300K
400K2018
AA
BA
Surplus (Deficit) Prior to Non-Cash Items
Year-to-Date
0K
400K
800K
1,200K
1,600K
2,000K
1,984K
47K 5K 0K 0K
Grant Inc-PHOperating Subsidy
Other Income
Interest Inc-GeneralFund
Interest-OtherRestricted
A/R Service Fee
Top 5 Sources of Revenue
Year-To-Date
UNAUDITED
For Internal Use Only

Period Ending May 31, 2018
Actual Amounts Vs. Approved Budget Comparison Page 1 of 1
6/7/2018 11:36:37PM
GlJdeIncomeStatementByCompany
Summarized Income Statement by Company, YTDConverse Ranch I
rp_GlJdeIncomeStatementByCompany
Account Description
Current Month Year-To-Date
Actual Budget Variance Actual Budget VarianceLast YearLast Year %
Revenue
(19,744) (19,744) 0 0 (3,531) 100.00Rental Revenue
14,854 14,854 0 0 100.00Bad Debt, Net of Collections
6,529 6,588 72,628 72,470 158 (59) 6,667 70,507 .22Grants
327 327 0 0 100.00Miscellaneous Revenue
6,529 6,588 (59) 68,065 72,470 (4,405)Net Revenue 6,667 66,976 -6.08
Operating Expense
219 219 0 0 100.00Outside Services
319 329 3,969 3,811 158 (10) 297 3,593 4.14Other Expenses
319 329 (10) 4,187 3,811 376 Total Operating Expense 297 3,593 9.88
Total Operating Income 6,210 6,259 63,877 68,659 (49) (4,782) 63,383 6,370 (6.96)
Non-Operating Income (Expense)
0 0 0 3 8 100.00Interest Income
(5,997) (6,259) (59,287) (68,847) 9,560 261 (4,550) (55,040) -13.89Other Income (Expense)
(724) (912) (8,366) (10,027) 1,661 187 (812) (9,203) -16.57Management Fees
0 0 Transfers
(6,722) (7,170) 449 (67,652) (78,873) 11,221 Total Non-Operating Income (Expense) (5,359) (64,235) -14.23
Income Before Non-Cash Items (512) (912) (3,775) (10,214) 399 6,439 (852) 1,012 (63.04)
UNAUDITED
For Internal Use Only

Period Ending May 31, 2018
Actual Amounts Vs. Approved Budget Comparison Page 1 of 1
6/7/2018 11:36:39PM
GlJdeIncomeStatementByCompany
Summarized Income Statement by Company, YTDConverse Ranch II, LLC
rp_GlJdeIncomeStatementByCompany
Account Description
Current Month Year-To-Date
Actual Budget Variance Actual Budget VarianceLast YearLast Year %
Revenue
(12,529) (12,529) 0 0 134 100.00Rental Revenue
12,232 12,232 0 0 133 100.00Bad Debt, Net of Collections
1,299 4,649 47,420 51,140 (3,720)(3,350) 4,704 56,203 -7.27Grants
0 0 12,179 Miscellaneous Revenue
1,299 4,649 (3,350) 47,123 51,140 (4,017)Net Revenue 4,704 68,649 -7.86
Operating Expense
184 184 0 0 100.00Outside Services
64 232 2,820 2,712 108 (169) 181 2,984 3.99Other Expenses
64 232 (169) 3,004 2,712 292 Total Operating Expense 181 2,984 10.77
Total Operating Income 1,235 4,417 44,119 48,429 (3,181) (4,309) 65,665 4,523 (8.90)
Non-Operating Income (Expense)
5 49 49 5 8 14 100.00Interest Income
(1,151) (4,417) (38,617) (48,583) 9,967 3,266 (2,498) (43,292) -20.51Other Income (Expense)
(658) (648) (7,304) (7,132) (171)(10)(760) (7,505) 2.40Management Fees
0 0 Transfers
(1,805) (5,065) 3,260 (45,872) (55,715) 9,844 Total Non-Operating Income (Expense) (3,250) (50,783) -17.67
Income Before Non-Cash Items (569) (648) (1,752) (7,287) 79 5,535 14,882 1,273 (75.95)
UNAUDITED
For Internal Use Only

Period Ending May 31, 2018
Actual Amounts Vs. Approved Budget Comparison Page 1 of 1
6/7/2018 11:36:41PM
GlJdeIncomeStatementByCompany
Summarized Income Statement by Company, YTDEast Meadows
rp_GlJdeIncomeStatementByCompany
Account Description
Current Month Year-To-Date
Actual Budget Variance Actual Budget VarianceLast YearLast Year %
Revenue
15,995 267,204 267,204 15,995 0 100.00Grants
41,785 41,785 0 0 100.00Miscellaneous Revenue
15,995 15,995 308,989 308,989 Net Revenue 0 100.00
Operating Expense
9,476 12,476 12,476 9,476 0 100.00Other Expenses
9,476 9,476 12,476 12,476 Total Operating Expense 0 100.00
Total Operating Income 6,519 296,513 6,519 296,513 0 0
Non-Operating Income (Expense)
78 1,344 1,344 78 0 0 100.00Interest Income
(179,844) (229,853) (229,853)(179,844) 0 100.00Other Income (Expense)
(1,895) (20,688) (20,688)(1,895) 0 100.00Management Fees
(181,662) (181,662) (249,196) (249,196)Total Non-Operating Income (Expense) 0 0 100.00
Income Before Non-Cash Items (175,143) 47,317 (175,143) 47,317 0 0
Non-Cash Items
58,850 647,352 (647,352)(58,850) 0 214 -100.00Non-Oper Income (Expense)
58,850 (58,850) 647,352 (647,352)Total Non-Cash Items 0 214 -100.00
Change In Net Assets (175,143) 58,850 47,317 647,352 (233,993) (600,035) 214 0 (92.69)
UNAUDITED
For Internal Use Only

Period Ending May 31, 2018
Actual Amounts Vs. Approved Budget Comparison Page 1 of 1
6/7/2018 11:36:42PM
GlJdeIncomeStatementByCompany
Summarized Income Statement by Company, YTDGardens at San Juan Square
rp_GlJdeIncomeStatementByCompany
Account Description
Current Month Year-To-Date
Actual Budget Variance Actual Budget VarianceLast YearLast Year %
Revenue
(2,211) (2,211) 0 0 3,049 100.00Rental Revenue
480 480 0 0 100.00Bad Debt, Net of Collections
49,797 495,675 547,762 (52,087)(49,797) 50,390 385,248 -9.51Grants
2,570 2,570 0 0 100.00Miscellaneous Revenue
49,797 (49,797) 496,514 547,762 (51,247)Net Revenue 50,390 388,297 -9.36
Operating Expense
9 2,490 25,717 28,382 (2,666)(2,481) 2,525 19,324 -9.39Other Expenses
9 2,490 (2,481) 25,717 28,382 (2,666)Total Operating Expense 2,525 19,324 -9.39
Total Operating Income (9) 47,307 470,798 519,379 (47,316) (48,582) 368,973 47,865 (9.35)
Non-Operating Income (Expense)
502 1 2,824 7 2,817 502 48 112 38,222.52Interest Income
(14,346) (21,907) (205,846) (240,974) 35,128 7,561 (44,358) (232,311) -14.58Other Income (Expense)
(2,511) (3,184) (27,662) (35,025) 7,363 674 (1,442) (30,272) -21.02Management Fees
0 0 Transfers
(16,354) (25,090) 8,736 (230,684) (275,992) 45,308 Total Non-Operating Income (Expense) (45,752) (262,471) -16.42
Income Before Non-Cash Items (16,363) 22,217 240,114 243,388 (38,579) (3,274) 106,503 2,113 (1.35)
UNAUDITED
For Internal Use Only

Period Ending May 31, 2018
Actual Amounts Vs. Approved Budget Comparison Page 1 of 1
6/7/2018 11:36:45PM
GlJdeIncomeStatementByCompany
Summarized Income Statement by Company, YTDHemisView Village
rp_GlJdeIncomeStatementByCompany
Account Description
Current Month Year-To-Date
Actual Budget Variance Actual Budget VarianceLast YearLast Year %
Revenue
(7,307) (7,307) 0 0 (3,257) 100.00Rental Revenue
4,709 4,709 0 0 100.00Bad Debt, Net of Collections
16,909 11,656 152,070 128,217 23,853 5,253 11,795 157,728 18.60Grants
16,909 11,656 5,253 149,472 128,217 21,255 Net Revenue 11,795 154,471 16.58
Operating Expense
787 583 7,738 6,859 878 204 583 8,784 12.81Other Expenses
787 583 204 7,738 6,859 878 Total Operating Expense 583 8,784 12.81
Total Operating Income 16,122 11,073 141,734 121,357 5,049 20,377 145,687 11,212 16.79
Non-Operating Income (Expense)
79 1 504 7 497 78 21 49 6,737.72Interest Income
(14,574) (11,073) (118,342) (121,806) 3,464 (3,501) 41,687 (92,368) -2.84Other Income (Expense)
(1,426) (1,463) (16,591) (16,098) (494) 37 (1,473) (15,809) 3.07Management Fees
0 0 Transfers
(15,921) (12,536) (3,385) (134,429) (137,896) 3,467 Total Non-Operating Income (Expense) 40,235 (108,128) -2.51
Income Before Non-Cash Items 201 (1,463) 7,305 (16,539) 1,663 23,844 37,559 51,447 (144.17)
Non-Cash Items
0 0 11,145 Non-Oper Income (Expense)
Total Non-Cash Items 0 11,145
Change In Net Assets 201 (1,463) 7,305 (16,539) 1,663 23,844 48,704 51,447 (144.17)
UNAUDITED
For Internal Use Only

Period Ending May 31, 2018
Actual Amounts Vs. Approved Budget Comparison Page 1 of 1
6/7/2018 11:36:46PM
GlJdeIncomeStatementByCompany
Summarized Income Statement by Company, YTDMidcrown Seniors Pavillion
rp_GlJdeIncomeStatementByCompany
Account Description
Current Month Year-To-Date
Actual Budget Variance Actual Budget VarianceLast YearLast Year %
Revenue
0 0 82 Rental Revenue
6,512 4,921 61,424 54,133 7,291 1,591 4,980 55,374 13.47Grants
6,512 4,921 1,591 61,424 54,133 7,291 Net Revenue 4,980 55,456 13.47
Operating Expense
0 0 (2)Salaries and Benefits
341 341 0 0 100.00Outside Services
283 246 3,046 2,851 194 37 251 3,034 6.82Other Expenses
283 246 37 3,387 2,851 536 Total Operating Expense 251 3,032 18.79
Total Operating Income 6,229 4,675 58,037 51,281 1,554 6,756 52,424 4,729 13.17
Non-Operating Income (Expense)
15 99 99 15 4 10 100.00Interest Income
(5,268) (4,675) (34,346) (51,426) 17,080 (593)(3,045) (28,316) -33.21Other Income (Expense)
(1,953) (1,977) (21,683) (21,744) 61 24 (2,356) (21,366) -.28Management Fees
0 0 Transfers
(7,206) (6,652) (554) (55,931) (73,170) 17,240 Total Non-Operating Income (Expense) (5,398) (49,672) -23.56
Income Before Non-Cash Items (977) (1,977) 2,106 (21,889) 1,000 23,995 2,752 (669) (109.62)
UNAUDITED
For Internal Use Only

Period Ending May 31, 2018
Actual Amounts Vs. Approved Budget Comparison Page 1 of 1
6/7/2018 11:36:49PM
GlJdeIncomeStatementByCompany
Summarized Income Statement by Company, YTDRefugio
rp_GlJdeIncomeStatementByCompany
Account Description
Current Month Year-To-Date
Actual Budget Variance Actual Budget VarianceLast YearLast Year %
Revenue
(14,086) (14,086) 0 0 (6,793) 100.00Rental Revenue
16,292 16,292 0 0 100.00Bad Debt, Net of Collections
16,919 13,567 164,815 149,238 15,577 3,352 13,728 153,403 10.44Grants
0 0 4,875 Miscellaneous Revenue
16,919 13,567 3,352 167,021 149,238 17,782 Net Revenue 13,728 151,485 11.92
Operating Expense
438 438 0 0 100.00Outside Services
808 678 11,218 7,849 3,369 129 678 8,323 42.92Other Expenses
808 678 129 11,656 7,849 3,806 Total Operating Expense 678 8,323 48.49
Total Operating Income 16,111 12,889 155,365 141,389 3,223 13,976 143,162 13,050 9.88
Non-Operating Income (Expense)
20 110 110 20 6 15 100.00Interest Income
(15,206) (12,889) (132,863) (141,776) 8,913 (2,317)(10,955) (115,424) -6.29Other Income (Expense)
(1,362) (1,487) (15,995) (16,354) 359 125 (1,309) (16,458) -2.20Management Fees
0 0 Transfers
(16,547) (14,375) (2,172) (148,748) (158,130) 9,382 Total Non-Operating Income (Expense) (12,257) (131,867) -5.93
Income Before Non-Cash Items (436) (1,487) 6,617 (16,742) 1,051 23,358 11,294 793 (139.52)
UNAUDITED
For Internal Use Only
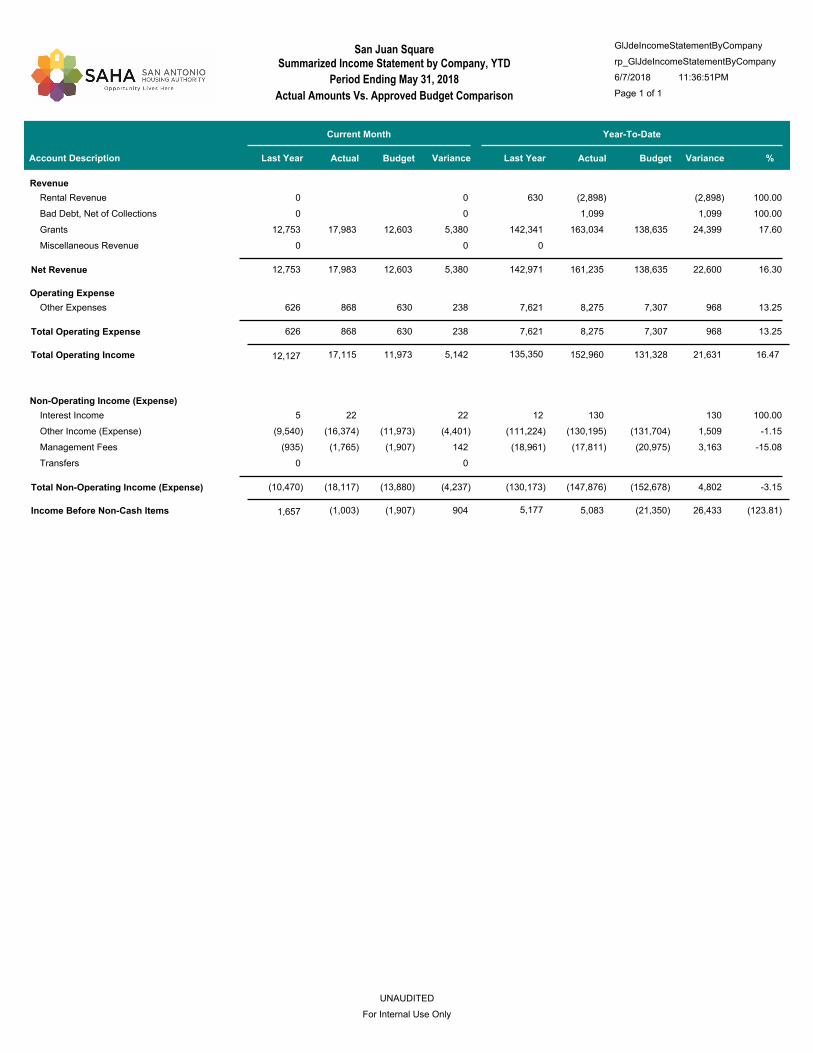
Period Ending May 31, 2018
Actual Amounts Vs. Approved Budget Comparison Page 1 of 1
6/7/2018 11:36:51PM
GlJdeIncomeStatementByCompany
Summarized Income Statement by Company, YTDSan Juan Square
rp_GlJdeIncomeStatementByCompany
Account Description
Current Month Year-To-Date
Actual Budget Variance Actual Budget VarianceLast YearLast Year %
Revenue
(2,898) (2,898) 0 0 630 100.00Rental Revenue
1,099 1,099 0 0 100.00Bad Debt, Net of Collections
17,983 12,603 163,034 138,635 24,399 5,380 12,753 142,341 17.60Grants
0 0 0 Miscellaneous Revenue
17,983 12,603 5,380 161,235 138,635 22,600 Net Revenue 12,753 142,971 16.30
Operating Expense
868 630 8,275 7,307 968 238 626 7,621 13.25Other Expenses
868 630 238 8,275 7,307 968 Total Operating Expense 626 7,621 13.25
Total Operating Income 17,115 11,973 152,960 131,328 5,142 21,631 135,350 12,127 16.47
Non-Operating Income (Expense)
22 130 130 22 5 12 100.00Interest Income
(16,374) (11,973) (130,195) (131,704) 1,509 (4,401)(9,540) (111,224) -1.15Other Income (Expense)
(1,765) (1,907) (17,811) (20,975) 3,163 142 (935) (18,961) -15.08Management Fees
0 0 Transfers
(18,117) (13,880) (4,237) (147,876) (152,678) 4,802 Total Non-Operating Income (Expense) (10,470) (130,173) -3.15
Income Before Non-Cash Items (1,003) (1,907) 5,083 (21,350) 904 26,433 5,177 1,657 (123.81)
UNAUDITED
For Internal Use Only

Period Ending May 31, 2018
Actual Amounts Vs. Approved Budget Comparison Page 1 of 1
6/7/2018 11:36:52PM
GlJdeIncomeStatementByCompany
Summarized Income Statement by Company, YTDSan Juan Square II
rp_GlJdeIncomeStatementByCompany
Account Description
Current Month Year-To-Date
Actual Budget Variance Actual Budget VarianceLast YearLast Year %
Revenue
(4,948) (4,948) 0 0 3 100.00Rental Revenue
3,614 3,614 0 0 110 100.00Bad Debt, Net of Collections
19,715 14,154 180,989 155,696 25,293 5,561 14,322 158,466 16.25Grants
19,715 14,154 5,561 179,655 155,696 23,959 Net Revenue 14,322 158,579 15.39
Operating Expense
933 720 9,109 8,337 772 213 709 8,389 9.27Other Expenses
933 720 213 9,109 8,337 772 Total Operating Expense 709 8,389 9.27
Total Operating Income 18,782 13,434 170,546 147,359 5,348 23,187 150,190 13,613 15.74
Non-Operating Income (Expense)
32 147 147 32 5 13 100.00Interest Income
(17,599) (13,446) (138,953) (147,911) 8,958 (4,153)(11,119) (126,478) -6.06Other Income (Expense)
(1,663) (1,912) (17,945) (21,027) 3,082 248 (743) (18,331) -14.66Management Fees
0 0 Transfers
(19,231) (15,358) (3,873) (156,751) (168,938) 12,188 Total Non-Operating Income (Expense) (11,857) (144,796) -7.21
Income Before Non-Cash Items (449) (1,924) 13,795 (21,579) 1,475 35,375 5,394 1,757 (163.93)
UNAUDITED
For Internal Use Only

Period Ending May 31, 2018
Actual Amounts Vs. Approved Budget Comparison Page 1 of 1
6/7/2018 11:36:54PM
GlJdeIncomeStatementByCompany
Summarized Income Statement by Company, YTDSutton Oaks
rp_GlJdeIncomeStatementByCompany
Account Description
Current Month Year-To-Date
Actual Budget Variance Actual Budget VarianceLast YearLast Year %
Revenue
(31,167) (31,167) 0 0 84 100.00Rental Revenue
26,559 26,559 0 12 12 100.00Bad Debt, Net of Collections
15,806 14,062 175,278 154,677 20,601 1,744 12,397 155,130 13.32Grants
1,593 1,593 0 0 100.00Miscellaneous Revenue
15,806 14,062 1,744 172,262 154,677 17,585 Net Revenue 12,409 155,226 11.37
Operating Expense
381 5,775 5,775 381 0 100.00Outside Services
378 378 0 0 100.00Utilities
762 703 9,122 8,200 922 59 611 8,025 11.24Other Expenses
1,143 703 440 15,275 8,200 7,075 Total Operating Expense 611 8,025 86.28
Total Operating Income 14,663 13,358 156,987 146,477 1,304 10,510 147,201 11,798 7.18
Non-Operating Income (Expense)
1 1 7 (7)(1) 4 37 -89.82Interest Income
(14,341) (13,358) (135,552) (146,943) 11,391 (983)(9,291) (122,109) -7.75Other Income (Expense)
(2,221) (2,032) (21,810) (22,354) 544 (189)(2,242) (22,913) -2.43Management Fees
0 0 Transfers
(16,563) (15,390) (1,173) (157,361) (169,289) 11,928 Total Non-Operating Income (Expense) (11,529) (144,986) -7.05
Income Before Non-Cash Items (1,900) (2,031) (374) (22,813) 132 22,438 2,215 269 (98.36)
UNAUDITED
For Internal Use Only

Period Ending May 31, 2018
Actual Amounts Vs. Approved Budget Comparison Page 1 of 1
6/7/2018 11:36:55PM
GlJdeIncomeStatementByCompany
Summarized Income Statement by Company, YTDThe Alhambra
rp_GlJdeIncomeStatementByCompany
Account Description
Current Month Year-To-Date
Actual Budget Variance Actual Budget VarianceLast YearLast Year %
Revenue
2,805 1,559 22,731 17,154 5,577 1,246 522 24,284 32.51Grants
2,805 1,559 1,246 22,731 17,154 5,577 Net Revenue 522 24,284 32.51
Operating Expense
128 78 1,188 939 249 50 15 1,444 26.46Other Expenses
128 78 50 1,188 939 249 Total Operating Expense 15 1,444 26.46
Total Operating Income 2,677 1,481 21,543 16,215 1,196 5,328 22,840 507 32.86
Non-Operating Income (Expense)
6 38 38 6 1 3 100.00Interest Income
(2,393) (1,481) (13,949) (16,296) 2,348 (912) 0 (16,128) -14.41Other Income (Expense)
(466) (600) (5,822) (6,598) 777 134 (440) (5,967) -11.77Management Fees
0 0 Transfers
(2,853) (2,081) (772) (19,732) (22,895) 3,163 Total Non-Operating Income (Expense) (439) (22,091) -13.81
Income Before Non-Cash Items (176) (600) 1,811 (6,680) 424 8,491 749 68 (127.11)
UNAUDITED
For Internal Use Only

Period Ending May 31, 2018
Actual Amounts Vs. Approved Budget Comparison Page 1 of 1
6/7/2018 11:36:57PM
GlJdeIncomeStatementByCompany
Summarized Income Statement by Company, YTDThe Park At Sutton Oaks
rp_GlJdeIncomeStatementByCompany
Account Description
Current Month Year-To-Date
Actual Budget Variance Actual Budget VarianceLast YearLast Year %
Revenue
(7,901) (7,901) 0 0 100.00Rental Revenue
5,210 5,210 0 0 100.00Bad Debt, Net of Collections
18,963 14,611 180,742 160,724 20,018 4,352 14,785 161,422 12.45Grants
750 750 0 0 100.00Miscellaneous Revenue
18,963 14,611 4,352 178,801 160,724 18,077 Net Revenue 14,785 161,422 11.25
Operating Expense
892 731 9,334 8,613 721 161 720 8,229 8.37Other Expenses
892 731 161 9,334 8,613 721 Total Operating Expense 720 8,229 8.37
Total Operating Income 18,071 13,881 169,467 152,111 4,191 17,356 153,193 14,065 11.41
Non-Operating Income (Expense)
19 2 93 19 73 18 3 60 379.49Interest Income
(16,809) (13,881) (139,835) (152,688) 12,853 (2,928)(12,101) (129,252) -8.42Other Income (Expense)
(1,812) (1,795) (19,938) (19,748) (191)(17)(1,944) (18,950) .97Management Fees
0 0 Transfers
(18,602) (15,674) (2,927) (159,681) (172,416) 12,736 Total Non-Operating Income (Expense) (14,042) (148,142) -7.39
Income Before Non-Cash Items (530) (1,793) 9,786 (20,305) 1,263 30,092 5,050 23 (148.20)
UNAUDITED
For Internal Use Only

Period Ending May 31, 2018
Actual Amounts Vs. Approved Budget ComparisonPage 1 of 2
6/7/2018 11:34:55PM
GlJdeIncomeStatementByLineOfBusiness
Summarized Income Statement by Line of Business, YTD
Beaconrp_GlJdeIncomeStatementByLineOfBusiness
Account Description
Year-To-Date
Actual Budget Variance %
Revenue
17,582,094 18,212,359 (630,264)Rental Revenue -3.46
(291,200) (308,061) 16,861 Bad Debt, Net of Collections -5.47
605,937 559,840 46,097 Other Tenant Revenue 8.23
2,465,879 2,556,083 (90,204)Grants -3.53
160,561 292,369 (131,809)Miscellaneous Revenue -45.08
20,523,271 21,312,590 (789,320)Net Revenue -3.70
Operating Expense
4,402,954 5,006,920 (603,966)Salaries and Benefits -12.06
749,405 708,424 40,980 Supplies and Materials 5.78
26,069 22,985 3,083 Fleet Costs 13.41
2,525,391 2,501,536 23,855 Outside Services .95
1,786,435 1,850,936 (64,501)Utilities -3.48
183,682 189,137 (5,454)Protective Services -2.88
748,272 1,097,090 (348,818)Insurance -31.79
8,085 (8,085)HAP Expense -100.00
1,188,059 1,052,772 135,287 Other Expenses 12.85
11,610,266 12,437,885 (827,619)Total Operating Expense -6.65
Total Operating Income 8,913,005 8,874,705 38,300 $0.43
Non-Operating Income (Expense)
(1,939,118) (1,607,892) (331,225)Interest Expense 20.60
375,191 168,863 206,328 Interest Income 122.19
(759,812) (1,379,243) 619,431 Replacement/Extraordinary Item -44.91
84,619 84,619 Other Income (Expense) 100.00
(1,415,412) (1,622,248) 206,836 Management Fees -12.75
(361,512) (361,512)Transfers 100.00
(4,016,044) (4,440,520) 424,476 Total Non-Operating Income (Expense) -9.56
Surplus or Deficit Prior to Non-Cash Items 4,896,960 4,434,185 462,776 $10.44
Non-Cash Items
(2,482,440) (2,376,529) (105,911)Depreciation & Amortization 4.46
34,379 (4,187) 38,566 Non-Oper Income (Expense) -921.17
(2,448,061) (2,380,716) (67,346)Total Non-Cash Items 2.83
UNAUDITED
For Internal Use Only

Period Ending May 31, 2018
Actual Amounts Vs. Approved Budget ComparisonPage 2 of 2
6/7/2018 11:34:55PM
GlJdeIncomeStatementByLineOfBusiness
Summarized Income Statement by Line of Business, YTD
Beaconrp_GlJdeIncomeStatementByLineOfBusiness
Account Description
Year-To-Date
Actual Budget Variance %
Change In Net Assets 2,448,899 2,053,469 395,430 $19.26
0K
4,000K
8,000K
12,000K
16,000K
20,000K
19,482K
2,368K725K 244K 243K 236K 176K 169K 123K 120K
Dwelling Rental
Grant Inc-PB HAPRents
Management Fee -Internal
Bookkeeping
Excess Utilities
Late Charges
Interest on Mortgages& Notes
Asset ManagementFee
Recovery - TenantMaint
Interest Inc-GeneralFund
Top 10 Sources of Revenue
Year-To-Date
0K
200K
400K
600K
800K
1000K
1200K
1400K
1,375K
1,113K1,099K1,015K
822K 819K 760K655K 651K
521K
Admin - Contract
Labor
Maint - Contract Labor
Operating Transfers
Out
Interest on Mortgage
Water
Admin - Salaries
Interest on Bonds
Other Contract Costs
Outside Management
Fees
Electricity
Top 10 Operating Expenses
Yer-To-Date
0K
100K
200K
300K
400K
500K
600K
700K
800K
738K
288K 260K
148K 118K 92K 91K 89K 81K 76K
Operating Transfers In
Maint - ContractLabor
Dwell Eqt-A/C Units
Flooring Replacement
Interest Inc-GeneralFund
Painting
Outside ManagementFees
Dwell Eqt-Refrigerators
Annual Leave
Casualty - InsuranceProceeds
Top 10 Variances Over Budget
Year-To-Date
0
2000000
40000006000000
8000000
100000002017
0
2000000
40000006000000
8000000
100000002018
AA
BA
Surplus (Deficit) Prior to Non-Cash Items
Year-To-Date
UNAUDITED
For Internal Use Only

Period Ending May 31, 2018
Actual Amounts Vs. Approved Budget Comparison Page 1 of 2
6/7/2018 11:35:30PM
GlJdeIncomeStatementByLineOfBusinessByGroup
Summarized Income Statement by Line of Business, YTDrp_GlJdeIncomeStatementByLineOfBusinessByGroup
BeaconSAHA Managed
Account Description
Current Month Year-To-Date
Actual Budget Variance Actual Budget VarianceLast YearLast Year %
Revenue
499,462 5,710,251 5,772,211 (61,960)(25,519) 540,046 5,875,567 Rental Revenue (1.07) 524,981
1,069 (66,470) (23,075) (43,395) 3,166 6,226 (54,527)Bad Debt, Net of Collections 188.06 (2,098)
20,937 242,358 290,648 (48,290)(5,485) 22,433 251,686 Other Tenant Revenue (16.61) 26,423
115,123 1,282,682 1,229,741 52,941 3,328 57,979 713,976 Grants 4.31 111,795
843 9,849 27,974 (18,125)(1,693) 325 12,866 Miscellaneous Revenue (64.79) 2,536
7,178,670 7,297,500 (118,830)Net Revenue (1.63) 6,799,567 627,008 637,434 (26,202) 663,636
Operating Expense
178,735 1,801,305 2,194,865 (393,560)(23,770) 182,689 1,936,182 Salaries and Benefits (17.93) 202,505
58,179 391,194 336,375 54,819 27,886 34,578 391,807 Supplies and Materials 16.30 30,293
2,428 22,801 22,435 366 389 2,048 21,615 Fleet Costs 1.63 2,040
73,501 810,181 780,200 29,981 2,887 19,917 899,973 Outside Services 3.84 70,614
78,766 853,430 798,906 54,524 6,602 62,334 761,055 Utilities 6.82 72,164
3,826 37,600 31,223 6,377 988 3,580 31,748 Protective Services 20.43 2,838
20,978 291,924 390,329 (98,404)(13,702) 212 258,370 Insurance (25.21) 34,679
24,142 346,943 374,516 (27,574)(8,517) 29,569 295,931 Other Expenses (7.36) 32,659
4,555,379 4,928,849 (373,470)Total Operating Expense (7.58) 4,596,681 334,928 440,555 (7,237) 447,792
Total Operating Income 196,879 2,623,292 2,368,651 (18,965) 254,641 2,202,887 292,080 10.75 215,844
Non-Operating Income (Expense)
(42,258) (467,757) (289,842) (177,915)(15,144)(36,245) (461,802)Interest Expense 61.38 (27,114)
12,067 92,003 1,928 90,075 11,892 2,988 11,549 Interest Income 4,672.55 175
(17,969) (249,766) (398,461) 148,695 18,014 (17,060) (262,229)Replacement/Extraordinary Item (37.32)(35,983)
76,156 83,005 83,005 76,156 134,583 365,845 Other Income (Expense) 100.00
(64,578) (697,817) (775,604) 77,787 5,931 (63,413) (697,038)Management Fees (10.03)(70,509)
138,488 138,488 Transfers 100.00
(1,101,845) (1,461,979) 360,134 Total Non-Operating Income (Expense) (24.63)(1,043,675) 20,853 (36,582) 96,849 (133,431)
Surplus or (Deficit) Prior to Non-Cash Items 160,297 1,521,446 906,671 77,884 614,775 1,159,212 312,933 67.81 82,413
Non-Cash Items
(60,325) (718,724) (616,412) (102,312)(13,322)(61,184) (672,387)Depreciation & Amortization 16.60 (47,003)
(1,449) (4,187) 2,738 381 (101,312)Non-Oper Income (Expense) (65.40)(381)
(720,173) (620,598) (99,574)Total Non-Cash Items 16.04 (773,698)(61,184) (60,325) (12,941)(47,384)
Change In Net Assets 99,972 801,274 286,073 64,942 515,201 385,514 251,749 180.09 35,030
UNAUDITED
For Internal Use Only

Period Ending May 31, 2018
Actual Amounts Vs. Approved Budget Comparison Page 2 of 2
6/7/2018 11:35:30PM
GlJdeIncomeStatementByLineOfBusinessByGroup
Summarized Income Statement by Line of Business, YTDrp_GlJdeIncomeStatementByLineOfBusinessByGroup
BeaconSAHA Managed
0K
100K
200K
300K
400K
500K
600K
555K513K
416K
346K289K 279K 273K
200K 179K 159K
Admin - Salaries
Management Fee -Internal
Interest on Mortgage
Maint - Salaries
Electricity
Water
Other Contract Costs
Sewer
Ins-Property
Maint - ContractLabor
Top 10 Operating Expenses
Year-To-Date
0K
20K
40K
60K
80K
100K
120K
140K
138K
117K
100K90K
76K 74K60K 59K 58K
44K
Operating Transfers In
Other Contract Costs
Maint - ContractLabor
Dwell Eqt-A/C Units
Casualty - InsuranceProceeds
OutsideManagement Fees
Annual Leave
Interest Inc-GeneralFund
Sewer
Appliance Parts
Top 10 Variances Over Budget
Year-To-Date
0K
200K
400K
600K800K1,000K
1,200K
1,400K
1,600K2017
0K
200K
400K
600K800K1,000K
1,200K
1,400K
1,600K2018
AA
BA
Surplus (Deficit) Prior to Non-Cash Items
Year-to-Date
0K
1,000K
2,000K
3,000K
4,000K
5,000K
6,000K
5,718K
1,283K
176K 76K 61K
Dwelling Rental
Grant Inc-PB HAPRents
Excess Utilities
Casualty - InsuranceProceeds
Late Charges
Top 5 Sources of Revenue
Year-To-Date
UNAUDITED
For Internal Use Only

Period Ending May 31, 2018
Actual Amounts Vs. Approved Budget Comparison Page 1 of 1
6/7/2018 11:37:00PM
GlJdeIncomeStatementByCompany
Summarized Income Statement by Company, YTDSAHDC Bella Claire Apts.
rp_GlJdeIncomeStatementByCompany
Account Description
Current Month Year-To-Date
Actual Budget Variance Actual Budget VarianceLast YearLast Year %
Revenue
29,494 36,576 418,118 402,336 15,782 (7,082) 37,479 406,626 3.92Rental Revenue
235 83 1,516 917 599 152 266 (4,852) 65.37Bad Debt, Net of Collections
950 850 2,802 9,350 (6,548) 100 862 8,052 -70.03Other Tenant Revenue
75 63 810 688 123 13 0 625 17.87Miscellaneous Revenue
30,754 37,572 (6,818) 423,246 413,290 9,956 Net Revenue 38,607 410,451 2.41
Operating Expense
9,049 10,256 116,953 112,816 4,136 (1,207) 15,959 158,645 3.67Salaries and Benefits
3,054 2,325 12,200 25,575 (13,375) 729 1,399 27,456 -52.30Supplies and Materials
65 292 1,168 3,208 (2,040)(227) 86 2,520 -63.60Fleet Costs
2,167 4,765 32,084 52,557 (20,473)(2,598) 2,965 42,793 -38.95Outside Services
3,207 3,834 37,938 42,362 (4,424)(627) 3,332 37,877 -10.44Utilities
8 2,084 19,515 23,571 (4,056)(2,076) 20 17,584 -17.21Insurance
3,167 2,829 28,041 32,058 (4,017) 337 696 20,984 -12.53Other Expenses
20,716 26,385 (5,668) 247,899 292,147 (44,249)Total Operating Expense 24,455 307,859 -15.15
Total Operating Income 10,038 11,187 175,348 121,143 (1,150) 54,205 102,592 14,152 44.74
Non-Operating Income (Expense)
(3,990) (3,990) (44,520) (44,520) 0 (4,125) (45,968)Interest Expense
10 1 419 10 409 9 71 215 4,128.48Interest Income
(109) (2,417) (6,705) (26,583) 19,878 2,308 1,041 (8,991) -74.78Replacement/Extraordinary Item
0 0 155,554 Other Income (Expense)
(3,695) (3,652) (40,859) (40,171) (688)(43)(3,871) (41,230) 1.71Management Fees
138,488 138,488 0 0 100.00Transfers
(7,785) (10,058) 2,273 46,823 (111,265) 158,087 Total Non-Operating Income (Expense) (6,885) 59,580 -142.08
Income Before Non-Cash Items 2,253 1,129 222,170 9,878 1,124 212,292 162,171 7,267 2,149.09
Non-Cash Items
(8,262) (6,726) (90,628) (75,605) (15,022)(1,536)(6,906) (75,966) 19.87Depreciation & Amortization
0 0 (59,443)Non-Oper Income (Expense)
(8,262) (6,726) (1,536) (90,628) (75,605) (15,022)Total Non-Cash Items (6,906) (135,409) 19.87
Change In Net Assets (6,009) (5,597) 131,543 (65,727)(413) 197,270 26,762 361 (300.13)
UNAUDITED
For Internal Use Only

Period Ending May 31, 2018
Actual Amounts Vs. Approved Budget Comparison Page 1 of 1
6/7/2018 11:37:06PM
GlJdeIncomeStatementByCompany
Summarized Income Statement by Company, YTDSAHFC Burning Tree
rp_GlJdeIncomeStatementByCompany
Account Description
Current Month Year-To-Date
Actual Budget Variance Actual Budget VarianceLast YearLast Year %
Revenue
71,255 68,813 728,493 756,938 (28,444) 2,443 69,434 745,045 -3.76Rental Revenue
(16) 180 (6,691) 1,980 (8,671)(196) 550 3,388 -437.93Bad Debt, Net of Collections
910 230 2,385 2,530 (145) 680 240 2,700 -5.73Other Tenant Revenue
175 40 1,615 440 1,175 135 140 980 267.05Miscellaneous Revenue
72,324 69,263 3,062 725,802 761,888 (36,085)Net Revenue 70,364 752,113 -4.74
Operating Expense
13,216 22,616 122,543 248,780 (126,237)(9,400) 12,973 154,946 -50.74Salaries and Benefits
4,857 3,940 14,573 43,340 (28,767) 917 4,945 40,045 -66.38Supplies and Materials
65 90 65 990 (925)(25) 0 692 -93.43Fleet Costs
2,850 6,347 67,993 69,813 (1,820)(3,497) 4,505 72,705 -2.61Outside Services
3,810 4,570 53,569 50,270 3,299 (760) 4,890 47,210 6.56Utilities
0 0 156 Protective Services
7 3,352 23,349 37,385 (14,036)(3,346) 0 25,680 -37.55Insurance
493 2,222 18,815 24,675 (5,860)(1,729) 2,436 23,231 -23.75Other Expenses
25,298 43,138 (17,839) 300,906 475,253 (174,347)Total Operating Expense 29,749 364,663 -36.69
Total Operating Income 47,026 26,125 424,896 286,634 20,901 138,262 387,450 40,615 48.24
Non-Operating Income (Expense)
(92) (1,009) 1,009 92 0 (1,843) -100.00Interest Expense
2,036 30 17,808 325 17,483 2,007 595 2,194 5,376.81Interest Income
(318) (3,783) (14,530) (41,617) 27,087 3,465 (3,897) (28,377) -65.09Replacement/Extraordinary Item
(7,200) (10,324) (76,542) (113,565) 37,023 3,124 (7,205) (78,886) -32.60Management Fees
(5,481) (14,170) 8,688 (73,263) (155,865) 82,602 Total Non-Operating Income (Expense) (10,507) (106,912) -53.00
Income Before Non-Cash Items 41,544 11,955 351,633 130,769 29,589 220,864 280,538 30,107 168.90
Non-Cash Items
(5,098) (5,040) (55,963) (55,445) (518)(58)(5,040) (55,445) .93Depreciation & Amortization
(5,098) (5,040) (58) (55,963) (55,445) (518)Total Non-Cash Items (5,040) (55,445) .93
Change In Net Assets 36,446 6,915 295,670 75,324 29,531 220,346 225,094 25,067 292.53
UNAUDITED
For Internal Use Only

Period Ending May 31, 2018
Actual Amounts Vs. Approved Budget Comparison Page 1 of 1
6/7/2018 11:37:08PM
GlJdeIncomeStatementByCompany
Summarized Income Statement by Company, YTDSAHFC Castlepoint
rp_GlJdeIncomeStatementByCompany
Account Description
Current Month Year-To-Date
Actual Budget Variance Actual Budget VarianceLast YearLast Year %
Revenue
122,369 116,769 1,324,116 1,284,458 39,658 5,600 114,712 1,273,510 3.09Rental Revenue
659 (583) 3,906 (6,417) 10,323 1,242 1,996 642 -160.87Bad Debt, Net of Collections
1,950 1,344 17,305 14,781 2,523 606 1,981 14,917 17.07Other Tenant Revenue
175 1,340 2,875 14,735 (11,860)(1,165) 325 1,675 -80.49Miscellaneous Revenue
125,153 118,869 6,284 1,348,202 1,307,558 40,644 Net Revenue 119,014 1,290,745 3.11
Operating Expense
38,623 38,598 437,833 424,580 13,252 25 42,937 423,875 3.12Salaries and Benefits
7,137 6,404 119,700 70,446 49,255 733 7,114 91,068 69.92Supplies and Materials
824 9,274 9,274 824 1,103 5,184 100.00Fleet Costs
8,977 15,708 147,350 172,792 (25,441)(6,732)(28,319) 156,708 -14.72Outside Services
13,948 10,973 154,216 121,107 33,110 2,975 14,127 105,702 27.34Utilities
204 204 0 0 100.00Protective Services
77 7,139 52,797 80,494 (27,697)(7,062) 49 56,250 -34.41Insurance
3,397 5,272 63,961 58,418 5,543 (1,875) 9,817 51,491 9.49Other Expenses
72,983 84,094 (11,111) 985,336 927,836 57,500 Total Operating Expense 46,828 890,279 6.20
Total Operating Income 52,170 34,775 362,866 379,722 17,395 (16,856) 400,466 72,186 (4.44)
Non-Operating Income (Expense)
(9,920) (120) (111,726) (1,315) (110,412)(9,800)(10,205) (179,361) 8,399.51Interest Expense
4,013 70 36,157 775 35,382 3,942 668 2,744 4,565.08Interest Income
(4,809) (7,083) (62,845) (77,917) 15,072 2,274 (1,377) (49,044) -19.34Replacement/Extraordinary Item
75,075 75,075 75,075 75,075 134,583 612,563 100.00Other Income (Expense)
(14,555) (14,339) (159,570) (157,729) (1,841)(216)(14,279) (157,238) 1.17Management Fees
49,803 (21,471) 71,274 (222,908) (236,185) 13,277 Total Non-Operating Income (Expense) 109,391 229,664 -5.62
Income Before Non-Cash Items 101,973 13,303 139,958 143,536 88,669 (3,579) 630,130 181,577 (2.49)
Non-Cash Items
(7,229) (451) (63,102) (17,234) (45,869)(6,778)(3,936) (35,920) 266.16Depreciation & Amortization
0 0 (689)Non-Oper Income (Expense)
(7,229) (451) (6,778) (63,102) (17,234) (45,869)Total Non-Cash Items (3,936) (36,609) 266.16
Change In Net Assets 94,744 12,853 76,856 126,303 81,891 (49,447) 593,522 177,641 (39.15)
UNAUDITED
For Internal Use Only

Period Ending May 31, 2018
Actual Amounts Vs. Approved Budget Comparison Page 1 of 1
6/7/2018 11:37:14PM
GlJdeIncomeStatementByCompany
Summarized Income Statement by Company, YTDSAHFC Churchill Est, LLC
rp_GlJdeIncomeStatementByCompany
Account Description
Current Month Year-To-Date
Actual Budget Variance Actual Budget VarianceLast YearLast Year %
Revenue
11,397 31,607 324,656 347,672 (23,016)(20,210) 31,227 349,028 -6.62Rental Revenue
1,792 (292) (8,135) (3,208) (4,927) 2,083 1,504 2,443 153.57Bad Debt, Net of Collections
825 458 6,850 5,042 1,808 367 675 6,555 35.87Other Tenant Revenue
50 50 600 550 50 0 125 500 9.09Miscellaneous Revenue
14,064 31,823 (17,760) 323,970 350,055 (26,085)Net Revenue 33,531 358,525 -7.45
Operating Expense
5,454 6,163 49,803 67,795 (17,992)(709) 4,073 45,985 -26.54Salaries and Benefits
1,228 1,292 17,433 14,208 3,224 (64) 1,014 17,160 22.69Supplies and Materials
2,288 2,288 0 91 1,378 100.00Fleet Costs
2,044 2,775 39,316 30,525 8,790 (731) 135 34,953 28.80Outside Services
254 286 1,937 3,188 (1,251)(31) 77 1,923 -39.24Utilities
18 2,211 15,979 24,657 (8,678)(2,193) 7 17,190 -35.19Insurance
889 1,289 15,698 14,293 1,405 (400) 1,680 11,817 9.83Other Expenses
9,888 14,016 (4,128) 142,453 154,667 (12,214)Total Operating Expense 7,075 130,406 -7.90
Total Operating Income 4,176 17,808 181,517 195,388 (13,632) (13,871) 228,119 26,455 (7.10)
Non-Operating Income (Expense)
(5,233) (5,248) (58,380) (58,542) 163 15 (5,410) (60,279) -.28Interest Expense
618 4 4,117 48 4,069 614 173 536 8,407.07Interest Income
(4,213) (1,458) (20,689) (16,042) (4,648)(2,755)(3,739) (13,790) 28.97Replacement/Extraordinary Item
1,081 1,081 1,081 1,081 0 100.00Other Income (Expense)
(2,594) (2,637) (28,720) (29,009) 289 43 (2,711) (29,196) -1.00Management Fees
(10,341) (9,339) (1,002) (102,590) (103,544) 954 Total Non-Operating Income (Expense) (11,686) (102,729) -.92
Income Before Non-Cash Items (6,165) 8,469 78,927 91,844 (14,634) (12,917) 125,390 14,769 (14.06)
Non-Cash Items
(63) (1,397) (828) (568)(63)(92) (7,102) 68.61Depreciation & Amortization
(63) (63) (1,397) (828) (568)Total Non-Cash Items (92) (7,102) 68.61
Change In Net Assets (6,228) 8,469 77,530 91,015 (14,697) (13,485) 118,289 14,677 (14.82)
UNAUDITED
For Internal Use Only

Period Ending May 31, 2018
Actual Amounts Vs. Approved Budget Comparison Page 1 of 1
6/7/2018 11:37:16PM
GlJdeIncomeStatementByCompany
Summarized Income Statement by Company, YTDSAHDC Dietrich Road Apts.
rp_GlJdeIncomeStatementByCompany
Account Description
Current Month Year-To-Date
Actual Budget Variance Actual Budget VarianceLast YearLast Year %
Revenue
16,675 17,550 190,404 193,050 (2,647)(875) 17,137 180,786 -1.37Rental Revenue
20 0 (1,200) 0 (1,200) 20 291 (14,631) -1,090,818.18Bad Debt, Net of Collections
1,413 1,950 13,430 21,450 (8,020)(537) 1,514 16,408 -37.39Other Tenant Revenue
67 175 733 (558)(67) 25 675 -76.14Miscellaneous Revenue
18,108 19,567 (1,459) 202,809 215,234 (12,425)Net Revenue 18,967 183,238 -5.77
Operating Expense
6,430 6,201 56,169 68,212 (12,043) 229 2,902 36,402 -17.66Salaries and Benefits
433 1,388 6,428 15,263 (8,834)(955) 172 9,119 -57.88Supplies and Materials
236 221 488 2,429 (1,941) 15 241 2,156 -79.91Fleet Costs
2,982 2,492 18,572 27,408 (8,836) 491 (281) 26,757 -32.24Outside Services
1,481 1,536 16,307 17,005 (699)(56) 1,340 14,874 -4.11Utilities
725 341 3,944 3,750 194 384 0 5.18Protective Services
5 1,738 13,776 19,450 (5,674)(1,733) 5 13,559 -29.17Insurance
2,712 1,948 22,117 21,893 224 764 1,873 19,454 1.03Other Expenses
15,004 15,865 (860) 137,801 175,410 (37,609)Total Operating Expense 6,252 122,322 -21.44
Total Operating Income 3,104 3,702 65,008 39,824 (598) 25,184 60,916 12,716 63.24
Non-Operating Income (Expense)
202 1 2,324 16 2,308 200 281 832 14,673.30Interest Income
(1,382) (2,523) (15,198) 12,675 1,382 2,091 (8,794) -83.40Replacement/Extraordinary Item
1,250 1,250 0 0 100.00Other Income (Expense)
(1,859) (1,947) (21,338) (21,422) 84 88 (1,861) (20,659) -.39Management Fees
(1,657) (3,328) 1,670 (20,287) (36,605) 16,318 Total Non-Operating Income (Expense) 511 (28,621) -44.58
Income Before Non-Cash Items 1,446 374 44,720 3,219 1,072 41,502 32,295 13,227 1,289.43
Non-Cash Items
(2,313) (1,964) (23,469) (23,117) (352)(348)(2,274) (26,021) 1.52Depreciation & Amortization
(2,313) (1,964) (348) (23,469) (23,117) (352)Total Non-Cash Items (2,274) (26,021) 1.52
Change In Net Assets (866) (1,590) 21,251 (19,898) 724 41,150 6,274 10,953 (206.80)
UNAUDITED
For Internal Use Only

Period Ending May 31, 2018
Actual Amounts Vs. Approved Budget Comparison Page 1 of 1
6/7/2018 11:37:18PM
GlJdeIncomeStatementByCompany
Summarized Income Statement by Company, YTDSAHFC Encanta Villa
rp_GlJdeIncomeStatementByCompany
Account Description
Current Month Year-To-Date
Actual Budget Variance Actual Budget VarianceLast YearLast Year %
Revenue
40,155 39,382 439,403 433,202 6,201 773 37,576 422,629 1.43Rental Revenue
(544) (30) (4,113) (330) (3,783)(514)(1,367) (4,916) 1,146.43Bad Debt, Net of Collections
275 308 3,850 3,392 458 (33) 425 1,983 13.51Other Tenant Revenue
50 125 300 1,375 (1,075)(75) 150 750 -78.18Miscellaneous Revenue
39,936 39,785 151 439,439 437,639 1,801 Net Revenue 36,784 420,446 .41
Operating Expense
9,618 8,700 91,488 95,702 (4,214) 917 8,628 72,392 -4.40Salaries and Benefits
5,289 1,596 15,396 17,554 (2,158) 3,693 1,116 14,474 -12.29Supplies and Materials
3,700 3,683 33,946 40,517 (6,570) 17 672 51,471 -16.22Outside Services
4,003 2,933 44,486 32,267 12,220 1,070 499 34,497 37.87Utilities
7 2,196 16,233 24,671 (8,438)(2,189) 13 17,494 -34.20Insurance
1,240 2,486 27,624 27,490 134 (1,246) 1,945 22,990 .49Other Expenses
23,858 21,596 2,262 229,174 238,200 (9,026)Total Operating Expense 12,874 213,318 -3.79
Total Operating Income 16,078 18,190 210,266 199,439 (2,111) 10,827 207,128 23,910 5.43
Non-Operating Income (Expense)
(262) (323) (2,879) 2,555 262 (113) (3,645) -88.76Interest Expense
1,022 33 7,165 361 6,804 989 312 1,259 1,882.95Interest Income
(1,395) (10,163) (15,340) 5,177 1,395 (632) (13,757) -33.75Replacement/Extraordinary Item
(3,735) (3,750) (41,082) (41,246) 163 14 (3,738) (40,413) -.40Management Fees
(2,713) (5,373) 2,660 (44,403) (59,103) 14,700 Total Non-Operating Income (Expense) (4,171) (56,557) -24.87
Income Before Non-Cash Items 13,365 12,817 165,863 140,336 548 25,527 150,571 19,739 18.19
Non-Cash Items
(598) (597) (73,689) (73,620) (69)(1)(8,047) (88,521) .09Depreciation & Amortization
(598) (597) (1) (73,689) (73,620) (69)Total Non-Cash Items (8,047) (88,521) .09
Change In Net Assets 12,768 12,220 92,174 66,716 548 25,458 62,050 11,692 38.16
UNAUDITED
For Internal Use Only

Period Ending May 31, 2018
Actual Amounts Vs. Approved Budget Comparison Page 1 of 1
6/7/2018 11:37:19PM
GlJdeIncomeStatementByCompany
Summarized Income Statement by Company, YTDSAH Finance Corporation
rp_GlJdeIncomeStatementByCompany
Account Description
Current Month Year-To-Date
Actual Budget Variance Actual Budget VarianceLast YearLast Year %
Revenue
217 (1,000) 2,383 (3,383)(217) 1,225 18,035 -141.96Rental Revenue
(1,793) (1,793) 0 0 100.00Bad Debt, Net of Collections
90,050 82,500 7,550 0 0 85,000 9.15Miscellaneous Revenue
217 (217) 87,257 84,883 2,373 Net Revenue 1,225 103,035 2.80
Operating Expense
1,305 1,313 12,212 14,448 (2,237)(9) 831 9,352 -15.48Salaries and Benefits
821 2,208 9,497 24,292 (14,795)(1,387) 411 32,637 -60.90Outside Services
36 999 999 36 137 2,331 100.00Utilities
356 181 1,504 2,051 (547) 175 (1) 1,145 -26.67Insurance
78 904 16,747 10,222 6,525 (827) 56 7,352 63.83Other Expenses
2,596 4,608 (2,012) 40,959 51,014 (10,055)Total Operating Expense 1,433 52,816 -19.71
Total Operating Income (2,596) (4,391) 46,298 33,870 1,795 12,428 50,219 (208) 36.69
Non-Operating Income (Expense)
169 134 1,646 1,479 167 34 104 988 11.31Interest Income
(4) (147) (700) (1,615) 915 143 (147) (1,634) -56.64Management Fees
(150,000) (150,000) (150,000)(150,000) 0 (20,625) 100.00Transfers
(149,835) (12) (149,823) (149,054) (136) (148,918)Total Non-Operating Income (Expense) (43) (21,271) 109,353.66
Income Before Non-Cash Items (152,431) (4,403) (102,756) 33,734 (148,028) (136,490) 28,947 (251) (404.61)
Non-Cash Items
(16) (174) 174 16 0 (111) -100.00Depreciation & Amortization
49,715 735 48,980 0 70 45,930 6,664.80Non-Oper Income (Expense)
(16) 16 49,715 561 49,154 Total Non-Cash Items 70 45,819 8,763.67
Change In Net Assets (152,431) (4,419) (53,042) 34,295 (148,012) (87,336) 74,766 (181) (254.66)
UNAUDITED
For Internal Use Only

Period Ending May 31, 2018
Actual Amounts Vs. Approved Budget Comparison Page 1 of 1
6/7/2018 11:37:23PM
GlJdeIncomeStatementByCompany
Summarized Income Statement by Company, YTDSA Homeownership Corp.
rp_GlJdeIncomeStatementByCompany
Account Description
Current Month Year-To-Date
Actual Budget Variance Actual Budget VarianceLast YearLast Year %
Revenue
1 1 0 578 6,358 100.00Rental Revenue
2,512 2,512 0 0 100.00Bad Debt, Net of Collections
3,700 250 6,080 2,750 3,330 3,450 60 1,995 121.09Miscellaneous Revenue
3,700 250 3,450 8,593 2,750 5,843 Net Revenue 638 8,353 212.46
Operating Expense
2,627 2,582 37,950 28,400 9,550 46 3,314 29,988 33.63Salaries and Benefits
278 4,333 5,485 47,667 (42,182)(4,055) 1,374 14,230 -88.49Outside Services
620 4,154 6,939 (2,784)(620) 397 4,691 -40.13Utilities
(137) 206 659 2,270 (1,611)(343) 216 1,240 -70.97Protective Services
148 109 (163) 1,367 (1,530) 39 (18) 637 -111.96Insurance
2,846 3,514 48,528 38,685 9,843 (668) 2,783 19,352 25.44Other Expenses
5,763 11,364 (5,601) 96,612 125,326 (28,714)Total Operating Expense 8,066 70,137 -22.91
Total Operating Income (2,063) (11,114) (88,020) (122,576) 9,051 34,557 (61,784)(7,428) (28.19)
Non-Operating Income (Expense)
816 757 10,086 8,331 1,754 58 1,113 11,258 21.05Interest Income
(208) (2,292) 2,292 208 0 -100.00Replacement/Extraordinary Item
(44) (272) (3,686) (2,993) (693) 228 (246) (2,692) 23.16Management Fees
772 277 495 6,399 3,047 3,353 Total Non-Operating Income (Expense) 867 8,567 110.03
Income Before Non-Cash Items (1,291) (10,837) (81,620) (119,529) 9,546 37,909 (53,217)(6,562) (31.72)
Non-Cash Items
(40) (40) (445) (478) 33 0 (74) (1,553) -6.95Depreciation & Amortization
5,271 31,442 57,977 (26,535)(5,271) 0 2,809 -45.77Non-Oper Income (Expense)
(40) 5,230 (5,271) 30,998 57,499 (26,501)Total Non-Cash Items (74) 1,255 -46.09
Change In Net Assets (1,331) (5,607) (50,622) (62,030) 4,276 11,408 (51,962)(6,635) (18.39)
UNAUDITED
For Internal Use Only

Period Ending May 31, 2018
Actual Amounts Vs. Approved Budget Comparison Page 1 of 1
6/7/2018 11:37:25PM
GlJdeIncomeStatementByCompany
Summarized Income Statement by Company, YTDHomestead
rp_GlJdeIncomeStatementByCompany
Account Description
Current Month Year-To-Date
Actual Budget Variance Actual Budget VarianceLast YearLast Year %
Revenue
86,386 82,425 915,049 906,675 8,374 3,961 82,628 904,907 .92Rental Revenue
2,680 (2,196) (22,151) (24,154) 2,004 4,876 2,664 (28,493) -8.30Bad Debt, Net of Collections
11,667 15,455 161,305 170,001 (8,697)(3,787) 12,346 158,476 -5.12Other Tenant Revenue
108 167 905 1,833 (929)(59) 68 924 -50.66Miscellaneous Revenue
100,841 95,851 4,991 1,055,107 1,054,356 752 Net Revenue 97,705 1,035,813 .07
Operating Expense
19,749 18,516 207,271 203,673 3,598 1,233 27,320 250,131 1.77Salaries and Benefits
4,563 4,525 49,034 49,775 (741) 38 4,774 56,239 -1.49Supplies and Materials
374 508 1,431 5,592 (4,161)(134) 55 2,749 -74.42Fleet Costs
6,049 9,708 93,561 106,783 (13,222)(3,658)(160) 92,989 -12.38Outside Services
25,038 23,581 245,149 262,630 (17,480) 1,456 24,230 259,413 -6.66Utilities
1,544 1,346 15,518 14,802 716 198 1,544 15,418 4.83Protective Services
8,127 4,614 44,849 51,790 (6,941) 3,513 35 37,847 -13.40Insurance
3,065 4,328 47,221 49,931 (2,710)(1,263) 1,984 40,100 -5.43Other Expenses
68,509 67,126 1,382 704,034 744,975 (40,941)Total Operating Expense 59,782 754,885 -5.50
Total Operating Income 32,332 28,724 351,073 309,381 3,608 41,692 280,928 37,924 13.48
Non-Operating Income (Expense)
(17,347) (17,403) (180,854) (181,578) 724 56 (16,393) (170,707) -.40Interest Expense
401 4 2,475 41 2,435 398 78 240 5,998.69Interest Income
(1,672) (3,833) (37,227) (42,167) 4,940 2,161 (3,151) (24,517) -11.72Replacement/Extraordinary Item
(8,949) (8,693) (94,779) (95,623) 844 (256)(8,792) (96,500) -.88Management Fees
(27,567) (29,925) 2,359 (310,384) (319,327) 8,943 Total Non-Operating Income (Expense) (28,259) (291,483) -2.80
Income Before Non-Cash Items 4,766 (1,201) 40,689 (9,946) 5,967 50,635 (10,555) 9,665 (509.10)
Non-Cash Items
(14,217) (13,258) (154,388) (151,336) (3,052)(959)(13,960) (153,558) 2.02Depreciation & Amortization
(14,217) (13,258) (959) (154,388) (151,336) (3,052)Total Non-Cash Items (13,960) (153,558) 2.02
Change In Net Assets (9,452) (14,460) (113,698) (161,282) 5,008 47,584 (164,113)(4,295) (29.50)
UNAUDITED
For Internal Use Only

Period Ending May 31, 2018
Actual Amounts Vs. Approved Budget Comparison Page 1 of 1
6/7/2018 11:37:28PM
GlJdeIncomeStatementByCompany
Summarized Income Statement by Company, YTDSAHFC La Providencia Apts.
rp_GlJdeIncomeStatementByCompany
Account Description
Current Month Year-To-Date
Actual Budget Variance Actual Budget VarianceLast YearLast Year %
Revenue
44,178 43,585 485,791 479,430 6,361 593 45,441 475,033 1.33Rental Revenue
(5,235) 1,133 (23,612) 12,467 (36,078)(6,368) 423 (6,801) -289.40Bad Debt, Net of Collections
788 2,683 11,476 29,517 (18,040)(1,895) 2,021 11,844 -61.12Other Tenant Revenue
167 871 1,833 (963)(167) 0 1,650 -52.52Miscellaneous Revenue
39,731 47,568 (7,837) 474,526 523,247 (48,721)Net Revenue 47,885 481,726 -9.31
Operating Expense
18,458 16,784 166,278 184,625 (18,347) 1,674 9,380 134,553 -9.94Salaries and Benefits
3,266 2,692 22,814 29,608 (6,794) 574 4,048 31,821 -22.95Supplies and Materials
220 900 2,425 (1,525)(220) 79 1,385 -62.90Fleet Costs
3,220 7,729 71,602 85,021 (13,418)(4,509) 5,568 101,111 -15.78Outside Services
3,912 4,142 51,259 45,754 5,505 (230) 4,114 40,493 12.03Utilities
807 402 10,434 4,421 6,013 405 1,287 7,844 136.02Protective Services
56 2,711 19,969 30,718 (10,749)(2,655) 24 31,668 -34.99Insurance
2,945 2,779 28,891 30,732 (1,841) 165 1,385 23,442 -5.99Other Expenses
32,664 37,460 (4,796) 372,147 413,304 (41,157)Total Operating Expense 25,885 372,317 -9.96
Total Operating Income 7,067 10,108 102,380 109,944 (3,041) (7,564) 109,409 22,000 (6.88)
Non-Operating Income (Expense)
(5,768) (71,954) (71,954)(5,768) 0 100.00Interest Expense
1,783 4 5,623 48 5,574 1,778 207 641 11,543.69Interest Income
(465) (3,675) (20,096) (40,425) 20,330 3,210 1,651 (19,236) -50.29Replacement/Extraordinary Item
2,158 2,158 0 0 100.00Other Income (Expense)
(5,923) (5,895) (64,715) (64,842) 127 (28)(6,031) (65,812) -.20Management Fees
(10,374) (9,565) (808) (148,984) (105,219) (43,765)Total Non-Operating Income (Expense) (4,173) (84,408) 41.59
Income Before Non-Cash Items (3,307) 542 (46,605) 4,724 (3,849) (51,329) 25,002 17,827 (1,086.47)
Non-Cash Items
(2,077) (1,570) (27,717) (22,977) (4,739)(507)(2,634) (28,787) 20.63Depreciation & Amortization
(2,077) (1,570) (507) (27,717) (22,977) (4,739)Total Non-Cash Items (2,634) (28,787) 20.63
Change In Net Assets (5,384) (1,028) (74,321) (18,253)(4,356) (56,068)(3,786) 15,193 307.18
UNAUDITED
For Internal Use Only
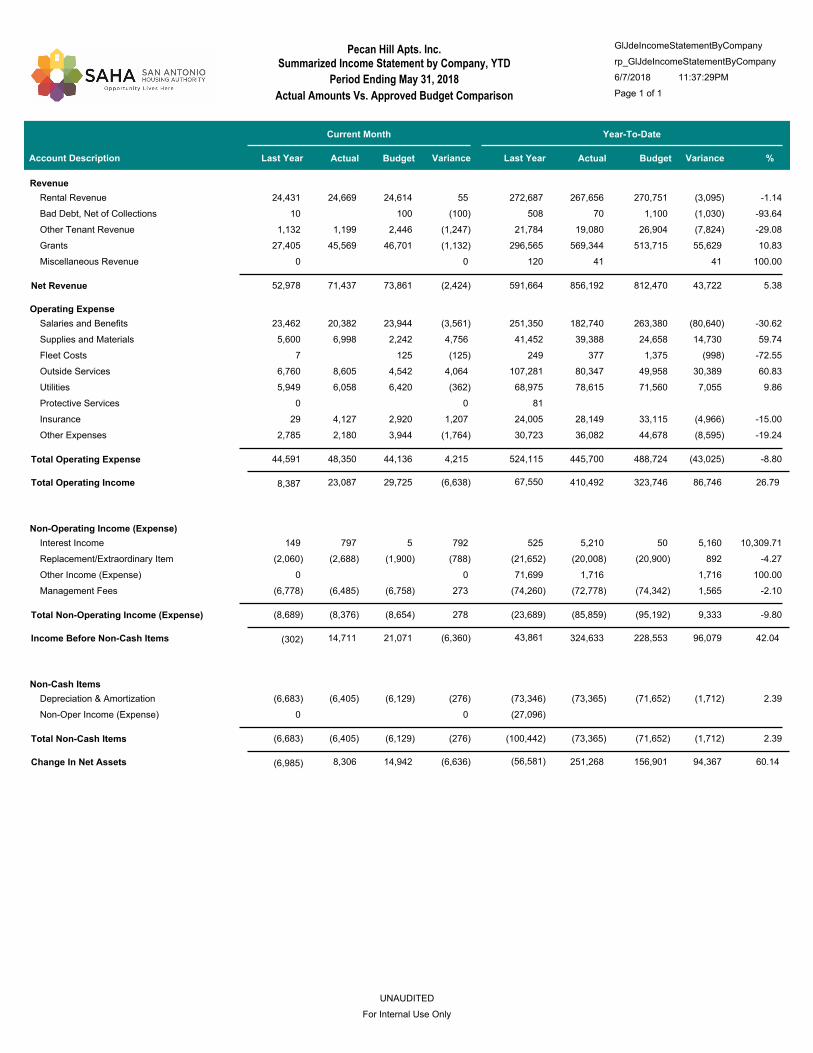
Period Ending May 31, 2018
Actual Amounts Vs. Approved Budget Comparison Page 1 of 1
6/7/2018 11:37:29PM
GlJdeIncomeStatementByCompany
Summarized Income Statement by Company, YTDPecan Hill Apts. Inc.
rp_GlJdeIncomeStatementByCompany
Account Description
Current Month Year-To-Date
Actual Budget Variance Actual Budget VarianceLast YearLast Year %
Revenue
24,669 24,614 267,656 270,751 (3,095) 55 24,431 272,687 -1.14Rental Revenue
100 70 1,100 (1,030)(100) 10 508 -93.64Bad Debt, Net of Collections
1,199 2,446 19,080 26,904 (7,824)(1,247) 1,132 21,784 -29.08Other Tenant Revenue
45,569 46,701 569,344 513,715 55,629 (1,132) 27,405 296,565 10.83Grants
41 41 0 0 120 100.00Miscellaneous Revenue
71,437 73,861 (2,424) 856,192 812,470 43,722 Net Revenue 52,978 591,664 5.38
Operating Expense
20,382 23,944 182,740 263,380 (80,640)(3,561) 23,462 251,350 -30.62Salaries and Benefits
6,998 2,242 39,388 24,658 14,730 4,756 5,600 41,452 59.74Supplies and Materials
125 377 1,375 (998)(125) 7 249 -72.55Fleet Costs
8,605 4,542 80,347 49,958 30,389 4,064 6,760 107,281 60.83Outside Services
6,058 6,420 78,615 71,560 7,055 (362) 5,949 68,975 9.86Utilities
0 0 81 Protective Services
4,127 2,920 28,149 33,115 (4,966) 1,207 29 24,005 -15.00Insurance
2,180 3,944 36,082 44,678 (8,595)(1,764) 2,785 30,723 -19.24Other Expenses
48,350 44,136 4,215 445,700 488,724 (43,025)Total Operating Expense 44,591 524,115 -8.80
Total Operating Income 23,087 29,725 410,492 323,746 (6,638) 86,746 67,550 8,387 26.79
Non-Operating Income (Expense)
797 5 5,210 50 5,160 792 149 525 10,309.71Interest Income
(2,688) (1,900) (20,008) (20,900) 892 (788)(2,060) (21,652) -4.27Replacement/Extraordinary Item
1,716 1,716 0 0 71,699 100.00Other Income (Expense)
(6,485) (6,758) (72,778) (74,342) 1,565 273 (6,778) (74,260) -2.10Management Fees
(8,376) (8,654) 278 (85,859) (95,192) 9,333 Total Non-Operating Income (Expense) (8,689) (23,689) -9.80
Income Before Non-Cash Items 14,711 21,071 324,633 228,553 (6,360) 96,079 43,861 (302) 42.04
Non-Cash Items
(6,405) (6,129) (73,365) (71,652) (1,712)(276)(6,683) (73,346) 2.39Depreciation & Amortization
0 0 (27,096)Non-Oper Income (Expense)
(6,405) (6,129) (276) (73,365) (71,652) (1,712)Total Non-Cash Items (6,683) (100,442) 2.39
Change In Net Assets 8,306 14,942 251,268 156,901 (6,636) 94,367 (56,581)(6,985) 60.14
UNAUDITED
For Internal Use Only

Period Ending May 31, 2018
Actual Amounts Vs. Approved Budget Comparison Page 1 of 1
6/7/2018 11:37:31PM
GlJdeIncomeStatementByCompany
Summarized Income Statement by Company, YTDSunshine Plaza Apts. Inc.
rp_GlJdeIncomeStatementByCompany
Account Description
Current Month Year-To-Date
Actual Budget Variance Actual Budget VarianceLast YearLast Year %
Revenue
22,771 23,341 239,321 256,747 (17,426)(570) 21,572 242,009 -6.79Rental Revenue
60 33 960 367 593 27 90 205 161.88Bad Debt, Net of Collections
453 283 1,492 3,117 (1,625) 169 432 3,526 -52.12Other Tenant Revenue
42,242 38,103 425,958 419,137 6,821 4,139 30,574 358,607 1.63Grants
4 222 46 176 (4) 0 382.89Miscellaneous Revenue
65,526 61,765 3,761 667,953 679,413 (11,460)Net Revenue 52,668 604,347 -1.69
Operating Expense
25,265 22,704 248,294 249,742 (1,448) 2,562 20,800 227,563 -.58Salaries and Benefits
5,377 2,408 57,537 26,492 31,045 2,969 3,119 35,206 117.19Supplies and Materials
864 583 6,811 6,417 394 281 385 5,302 6.14Fleet Costs
8,865 4,183 105,088 46,017 59,071 4,682 11,357 65,121 128.37Outside Services
4,696 4,750 52,735 52,250 485 (54) 4,679 49,751 .93Utilities
4,887 3,752 31,980 42,352 (10,373) 1,135 29 29,652 -24.49Insurance
2,335 3,792 38,191 43,026 (4,835)(1,457) 2,371 29,979 -11.24Other Expenses
52,289 42,172 10,117 540,635 466,295 74,340 Total Operating Expense 42,740 442,574 15.94
Total Operating Income 13,236 19,592 127,318 213,118 (6,356) (85,800) 161,773 9,927 (40.26)
Non-Operating Income (Expense)
953 7 9,049 81 8,968 946 436 2,171 11,122.73Interest Income
(317) (2,367) (33,820) (26,033) (7,787) 2,049 (2,254) (26,726) 29.91Replacement/Extraordinary Item
1,725 1,725 0 0 100.00Other Income (Expense)
(4,902) (4,006) (46,764) (44,065) (2,699)(896)(3,595) (42,451) 6.12Management Fees
(4,266) (6,365) 2,099 (69,810) (70,018) 208 Total Non-Operating Income (Expense) (5,413) (67,006) -.30
Income Before Non-Cash Items 8,970 13,227 57,508 143,100 (4,257) (85,593) 94,766 4,514 (59.81)
Non-Cash Items
(6,652) (6,652) (73,169) (73,170) 0 0 (6,652) (73,169) .00Depreciation & Amortization
(381) (1,449) (4,187) 2,738 381 0 1,661 -65.40Non-Oper Income (Expense)
(6,652) (7,032) 381 (74,618) (77,356) 2,738 Total Non-Cash Items (6,652) (71,509) -3.54
Change In Net Assets 2,319 6,195 (17,110) 65,744 (3,876) (82,855) 23,258 (2,137) (126.03)
UNAUDITED
For Internal Use Only

Period Ending May 31, 2018
Actual Amounts Vs. Approved Budget Comparison Page 1 of 1
6/7/2018 11:37:33PM
GlJdeIncomeStatementByCompany
Summarized Income Statement by Company, YTDVilla de Valencia
rp_GlJdeIncomeStatementByCompany
Account Description
Current Month Year-To-Date
Actual Budget Variance Actual Budget VarianceLast YearLast Year %
Revenue
30,113 40,321 377,245 440,952 (63,708)(10,208) 58,409 603,306 -14.45Rental Revenue
1,418 (527) (7,021) (5,796) (1,225) 1,945 (201) (2,021) 21.13Bad Debt, Net of Collections
507 415 2,383 4,565 (2,182) 92 805 5,442 -47.80Other Tenant Revenue
27,312 26,990 287,380 296,890 (9,510) 322 0 58,804 -3.20Grants
210 515 1,436 5,740 (4,304)(305)(508) 4,972 -74.98Miscellaneous Revenue
59,560 67,714 (8,153) 661,423 742,351 (80,928)Net Revenue 58,505 670,503 -10.90
Operating Expense
11,585 27,170 112,052 266,181 (154,130)(15,585) 12,755 165,415 -57.90Salaries and Benefits
15,979 1,375 36,354 18,275 18,079 14,604 1,280 27,505 98.93Supplies and Materials
24,042 7,841 117,139 89,552 27,587 16,201 16,152 144,672 30.81Outside Services
11,893 8,483 111,741 93,309 18,432 3,411 (1,386) 95,660 19.75Utilities
750 750 7,500 8,250 (750) 0 750 8,250 -9.09Protective Services
3,657 1,949 25,207 21,955 3,252 1,709 0 (12,781) 14.81Insurance
2,737 3,573 34,414 47,176 (12,762)(837) 4,340 38,849 -27.05Other Expenses
70,643 51,141 19,502 444,406 544,698 (100,292)Total Operating Expense 33,891 467,569 -18.41
Total Operating Income (11,082) 16,573 217,017 197,653 (27,655) 19,364 202,934 24,614 9.80
Non-Operating Income (Expense)
212 16 1,537 172 1,364 196 15 180 792.54Interest Income
(3,377) (6,690) (21,163) (76,240) 55,077 3,313 (4,734) (47,342) -72.24Replacement/Extraordinary Item
0 0 17,904 Other Income (Expense)
(5,601) (9,426) (60,803) (103,691) 42,889 3,825 (5,606) (61,994) -41.36Management Fees
(8,766) (16,101) 7,334 (80,429) (179,759) 99,330 Total Non-Operating Income (Expense) (10,325) (91,252) -55.26
Income Before Non-Cash Items (19,849) 472 136,588 17,894 (20,321) 118,694 111,682 14,289 663.30
Non-Cash Items
(6,178) (3,382) (68,261) (37,850) (30,411)(2,796)(3,544) (38,989) 80.34Depreciation & Amortization
0 0 (15,745)Non-Oper Income (Expense)
(6,178) (3,382) (2,796) (68,261) (37,850) (30,411)Total Non-Cash Items (3,544) (54,734) 80.34
Change In Net Assets (26,026) (2,910) 68,327 (19,956)(23,116) 88,283 56,948 10,744 (442.39)
UNAUDITED
For Internal Use Only

Period Ending May 31, 2018
Actual Amounts Vs. Approved Budget Comparison Page 1 of 2
6/7/2018 11:35:44PM
GlJdeIncomeStatementByLineOfBusinessByGroup
Summarized Income Statement by Line of Business, YTDrp_GlJdeIncomeStatementByLineOfBusinessByGroup
BeaconThird Party Managed
Account Description
Current Month Year-To-Date
Actual Budget Variance Actual Budget VarianceLast YearLast Year %
Revenue
1,079,636 11,871,844 12,440,147 (568,304)(54,960) 1,054,371 11,342,548 Rental Revenue (4.57) 1,134,596
(25,613) (225,312) (285,169) 59,857 311 19,594 (224,751)Bad Debt, Net of Collections (20.99)(25,924)
40,046 363,579 269,192 94,387 15,574 30,209 256,242 Other Tenant Revenue 35.06 24,472
110,608 1,183,197 1,326,341 (143,145)(9,968) 91,165 1,180,156 Grants (10.79) 120,576
11,843 117,730 235,350 (117,620)(9,382)(11,560) 210,307 Miscellaneous Revenue (49.98) 21,225
13,311,037 13,985,861 (674,825)Net Revenue (4.83) 12,764,502 1,183,778 1,216,520 (58,425) 1,274,945
Operating Expense
192,305 2,226,701 2,316,702 (90,001)(48,164) 207,505 2,235,891 Salaries and Benefits (3.88) 240,468
48,506 358,210 372,049 (13,839) 16,756 35,191 485,403 Supplies and Materials (3.72) 31,750
1,006 550 456 (50) 58 15,004 Fleet Costs 82.93 50
164,548 1,711,448 1,720,419 (8,971) 17,512 139,530 1,999,790 Outside Services (.52) 147,035
89,599 933,005 1,052,030 (119,025)(6,040) 67,637 944,909 Utilities (11.31) 95,639
19,850 146,082 157,914 (11,832) 5,494 10,625 163,258 Protective Services (7.49) 14,356
5,045 451,960 701,395 (249,435)(55,117) 2,951 421,686 Insurance (35.56) 60,162
8,085 (8,085)(735)HAP Expense (100.00) 735
63,626 782,303 619,694 162,609 13,429 51,194 744,584 Other Expenses 26.24 50,196
6,610,716 6,948,838 (338,122)Total Operating Expense (4.87) 7,010,524 514,692 583,478 (56,914) 640,392
Total Operating Income 633,042 6,700,320 7,037,023 (1,512) (336,703) 5,753,978 669,086 (4.78) 634,554
Non-Operating Income (Expense)
(126,334) (1,471,361) (1,318,050) (153,311)(8,558)(127,507) (1,622,540)Interest Expense 11.63 (117,776)
14,891 102,769 5,280 97,489 14,411 4,326 22,955 Interest Income 1,846.50 480
(75,439) (510,045) (980,781) 470,736 12,338 (75,770) (553,664)Replacement/Extraordinary Item (48.00)(87,777)
179,851 4,833,715 Other Income (Expense)
(91,617) (995,542) (1,021,474) 25,931 1,278 (90,777) (997,635)Management Fees (2.54)(92,895)
Transfers
(2,874,180) (3,315,026) 440,846 Total Non-Operating Income (Expense) (13.30) 1,682,831 (109,876) (278,498) 19,470 (297,968)
Surplus or (Deficit) Prior to Non-Cash Items 354,544 3,826,140 3,721,998 17,958 104,143 7,436,809 559,210 2.80 336,586
Non-Cash Items
(145,319) (1,598,981) (1,599,278) 297 (154)(169,292) (1,654,000)Depreciation & Amortization (.02)(145,164)
(1,649,318)Non-Oper Income (Expense)
(1,598,981) (1,599,278) 297 Total Non-Cash Items (.02)(3,303,317)(169,292) (145,319) (154)(145,164)
Change In Net Assets 209,225 2,227,159 2,122,719 17,804 104,440 4,133,491 389,917 4.92 191,421
UNAUDITED
For Internal Use Only

Period Ending May 31, 2018
Actual Amounts Vs. Approved Budget Comparison Page 2 of 2
6/7/2018 11:35:44PM
GlJdeIncomeStatementByLineOfBusinessByGroup
Summarized Income Statement by Line of Business, YTDrp_GlJdeIncomeStatementByLineOfBusinessByGroup
BeaconThird Party Managed
0K
200K
400K
600K
800K
1000K
1200K
1400K
1,242K
955K
760K
605K 599K 599K 543K
383K321K 290K
Admin - ContractLabor
Maint - ContractLabor
Interest on Bonds
Outside ManagementFees
Operating TransfersOut
Interest on Mortgage
Water
Other Contract Costs
Flooring Replacement
Solid Waste Disposal
Top 10 Operating Expenses
Year-To-Date
0K
100K
200K
300K
400K
500K
600K
599K
188K 169K 145K
81K 68K 58K 55K 41K 41K
Operating Transfers In
Maint - Contract Labor
Dwell Eqt-A/C Units
Flooring Replacement
Painting
Dwell Eqt-Refrigerators
Consulting Fees
Interest Inc-General
Fund
Unit Make Ready
Plumbing
Maintenance
Top 10 Variances Over Budget
Year-To-Date
0K
1,000K
2,000K
3,000K4,000K5,000K
6,000K
7,000K
8,000K2017
0K
1,000K
2,000K
3,000K4,000K5,000K
6,000K
7,000K
8,000K2018
AA
BA
Surplus (Deficit) Prior to Non-Cash Items
Year-to-Date
0K
2,000K
4,000K
6,000K
8,000K
10,000K
12,000K
14,000K
13,764K
1,085K175K 103K 98K
Dwelling Rental
Grant Inc-PB HAPRents
Late Charges
Sales & Services toTenants
Other GovernmentalGrants
Top 5 Sources of Revenue
Year-To-Date
UNAUDITED
For Internal Use Only

Period Ending May 31, 2018
Actual Amounts Vs. Approved Budget Comparison Page 1 of 1
6/7/2018 11:37:38PM
GlJdeIncomeStatementByCompany
Summarized Income Statement by Company, YTDConverse Ranch I LLC
rp_GlJdeIncomeStatementByCompany
Account Description
Current Month Year-To-Date
Actual Budget Variance Actual Budget VarianceLast YearLast Year %
Revenue
78,510 93,115 886,134 1,024,269 (138,135)(14,605) 71,846 885,610 -13.49Rental Revenue
1,012 (1,307) (5,591) (14,377) 8,786 2,319 11,563 (4,505) -61.11Bad Debt, Net of Collections
2,970 1,755 10,538 19,305 (8,767) 1,215 6,670 13,008 -45.41Other Tenant Revenue
5,997 11,015 59,287 121,161 (61,874)(5,017) 5,317 55,040 -51.07Grants
630 1,500 3,269 17,050 (13,781)(870)(4,335) 6,700 -80.83Miscellaneous Revenue
89,120 106,078 (16,958) 953,637 1,167,408 (213,771)Net Revenue 91,061 955,853 -18.31
Operating Expense
16,155 21,710 202,452 177,266 25,186 (5,555) 12,201 144,813 14.21Salaries and Benefits
2,499 1,950 32,667 24,384 8,284 549 5,351 47,096 33.97Supplies and Materials
17,215 8,532 156,227 106,121 50,106 8,684 15,035 144,524 47.22Outside Services
605 2,589 22,767 28,479 (5,712)(1,984) 1,013 26,085 -20.06Utilities
459 362 5,247 3,977 1,271 98 918 5,783 31.95Protective Services
2,941 9,708 71,570 144,133 (72,563)(6,767) 2,951 64,609 -50.34Insurance
532 5,852 (5,852)(532) 0 -100.00HAP Expense
5,062 2,980 60,872 52,699 8,173 2,082 3,536 43,900 15.51Other Expenses
44,936 48,362 (3,426) 551,802 542,911 8,891 Total Operating Expense 41,005 476,810 1.64
Total Operating Income 44,184 57,716 401,834 624,497 (13,532) (222,663) 479,042 50,056 (35.65)
Non-Operating Income (Expense)
(17,236) (17,621) (190,853) (193,828) 2,974 385 (17,509) (193,603) -1.53Interest Expense
549 19 8,182 208 7,974 530 368 1,099 3,841.62Interest Income
(1,623) (5,085) (22,787) (59,753) 36,966 3,462 (1,306) (19,392) -61.86Replacement/Extraordinary Item
0 49,641 248,206 Other Income (Expense)
(7,163) (7,587) (80,113) (83,462) 3,348 425 (7,438) (82,763) -4.01Management Fees
(25,472) (30,274) 4,802 (285,572) (336,835) 51,262 Total Non-Operating Income (Expense) 23,756 (46,454) -15.22
Income Before Non-Cash Items 18,712 27,442 116,262 287,662 (8,730) (171,400) 432,589 73,812 (59.58)
Non-Cash Items
(16,642) (17,257) (182,952) (189,831) 6,880 616 (17,257) (189,831) -3.62Depreciation & Amortization
0 0 (270,132)Non-Oper Income (Expense)
(16,642) (17,257) 616 (182,952) (189,831) 6,880 Total Non-Cash Items (17,257) (459,963) -3.62
Change In Net Assets 2,070 10,185 (66,690) 97,831 (8,115) (164,521)(27,375) 56,555 (168.17)
UNAUDITED
For Internal Use Only

Period Ending May 31, 2018
Actual Amounts Vs. Approved Budget Comparison Page 1 of 1
6/7/2018 11:37:40PM
GlJdeIncomeStatementByCompany
Summarized Income Statement by Company, YTDConverse Ranch II
rp_GlJdeIncomeStatementByCompany
Account Description
Current Month Year-To-Date
Actual Budget Variance Actual Budget VarianceLast YearLast Year %
Revenue
66,708 78,962 734,761 868,603 (133,842)(12,254) 64,250 709,338 -15.41Rental Revenue
(1,668) (2,452) (18,344) 15,892 1,668 718 56 -86.63Bad Debt, Net of Collections
2,420 1,140 10,681 12,540 (1,859) 1,280 2,556 3,216 -14.83Other Tenant Revenue
1,151 8,690 38,617 95,586 (56,970)(7,539) 3,595 43,292 -59.60Grants
150 245 4,235 3,245 990 (95)(1,286) 2,389 30.51Miscellaneous Revenue
70,429 87,369 (16,940) 785,841 961,630 (175,789)Net Revenue 69,832 758,291 -18.28
Operating Expense
10,839 19,793 77,121 164,127 (87,006)(8,954) 10,367 125,277 -53.01Salaries and Benefits
2,030 1,900 20,934 23,570 (2,636) 130 4,558 37,412 -11.18Supplies and Materials
10,843 7,424 114,039 91,465 22,574 3,419 13,110 116,045 24.68Outside Services
1,398 1,534 15,746 16,874 (1,128)(136) 809 15,946 -6.69Utilities
391 391 4,470 4,301 169 0 (163) 4,927 3.93Protective Services
29 3,621 33,002 40,404 (7,401)(3,593) 0 29,675 -18.32Insurance
203 2,233 (2,233)(203) 0 -100.00HAP Expense
6,122 2,572 68,740 34,652 34,088 3,550 5,112 65,479 98.37Other Expenses
31,651 37,438 (5,786) 334,051 377,626 (43,574)Total Operating Expense 33,792 394,761 -11.54
Total Operating Income 38,778 49,931 451,790 584,005 (11,153) (132,215) 363,530 36,040 (22.64)
Non-Operating Income (Expense)
(13,837) (14,243) (153,320) (155,912) 2,592 406 (14,364) (158,837) -1.66Interest Expense
414 6 2,296 71 2,225 408 11 50 3,126.67Interest Income
(226) (4,918) (21,027) (57,920) 36,893 4,692 (1,112) (14,036) -63.70Replacement/Extraordinary Item
0 34,844 174,221 Other Income (Expense)
(5,331) (6,221) (57,782) (68,435) 10,652 890 (4,970) (57,255) -15.57Management Fees
(18,980) (25,377) 6,396 (229,833) (282,195) 52,363 Total Non-Operating Income (Expense) 14,409 (55,856) -18.56
Income Before Non-Cash Items 19,797 24,555 221,957 301,810 (4,757) (79,852) 307,674 50,449 (26.46)
Non-Cash Items
(15,023) (15,691) (165,257) (172,597) 7,341 667 (15,691) (172,598) -4.25Depreciation & Amortization
0 0 (264,574)Non-Oper Income (Expense)
(15,023) (15,691) 667 (165,257) (172,597) 7,341 Total Non-Cash Items (15,691) (437,171) -4.25
Change In Net Assets 4,774 8,864 56,701 129,212 (4,090) (72,512)(129,497) 34,758 (56.12)
UNAUDITED
For Internal Use Only

Period Ending May 31, 2018
Actual Amounts Vs. Approved Budget Comparison Page 1 of 1
6/7/2018 11:37:46PM
GlJdeIncomeStatementByCompany
Summarized Income Statement by Company, YTDCourtland Heights PFC
rp_GlJdeIncomeStatementByCompany
Account Description
Current Month Year-To-Date
Actual Budget Variance Actual Budget VarianceLast YearLast Year %
Revenue
42,244 42,980 461,366 462,176 (810)(736) 40,366 436,722 -.18Rental Revenue
25 (699) (715) (7,686) 6,971 724 755 (8,808) -90.70Bad Debt, Net of Collections
495 250 5,204 2,750 2,454 245 1,880 4,490 89.24Other Tenant Revenue
65 425 1,715 4,675 (2,960)(360)(985) 2,725 -63.32Miscellaneous Revenue
42,829 42,956 (127) 467,570 461,914 5,656 Net Revenue 42,016 435,129 1.22
Operating Expense
7,327 9,184 83,310 76,867 6,443 (1,857) 6,848 67,050 8.38Salaries and Benefits
358 945 9,636 10,770 (1,134)(587) 3,010 10,709 -10.52Supplies and Materials
2,437 3,432 44,218 45,388 (1,170)(994) 8,493 39,494 -2.58Outside Services
4,833 2,559 29,873 28,144 1,729 2,274 2,353 26,541 6.14Utilities
0 0 Protective Services
2,261 16,869 24,945 (8,076)(2,261) 0 18,105 -32.38Insurance
2,457 2,335 31,191 33,195 (2,003) 122 2,441 34,416 -6.04Other Expenses
17,412 20,716 (3,304) 215,098 219,310 (4,211)Total Operating Expense 23,145 196,315 -1.92
Total Operating Income 25,417 22,240 252,471 242,605 3,177 9,867 238,814 18,871 4.07
Non-Operating Income (Expense)
(4,253) (4,256) (47,939) (47,943) 4 4 (4,375) (95,228) -.01Interest Expense
25 274 (274)(25) 0 724 -100.00Interest Income
(599) (3,583) (15,183) (54,717) 39,533 2,984 (5,019) (31,054) -72.25Replacement/Extraordinary Item
0 0 141,768 Other Income (Expense)
(1,510) (1,513) (16,897) (16,277) (620) 3 (1,458) (15,354) 3.81Management Fees
428,837 428,837 0 0 269,802 100.00Transfers
(6,362) (9,328) 2,966 348,817 (118,662) 467,480 Total Non-Operating Income (Expense) (10,852) 270,658 -393.96
Income Before Non-Cash Items 19,055 12,912 601,289 123,942 6,143 477,346 509,472 8,019 385.14
Non-Cash Items
(4,952) (5,157) (55,066) (56,955) 1,889 204 (5,687) (62,558) -3.32Depreciation & Amortization
0 0 (49,646)Non-Oper Income (Expense)
(4,952) (5,157) 204 (55,066) (56,955) 1,889 Total Non-Cash Items (5,687) (112,204) -3.32
Change In Net Assets 14,103 7,755 546,223 66,988 6,348 479,235 397,268 2,332 715.41
UNAUDITED
For Internal Use Only

Period Ending May 31, 2018
Actual Amounts Vs. Approved Budget Comparison Page 1 of 1
6/7/2018 11:37:48PM
GlJdeIncomeStatementByCompany
Summarized Income Statement by Company, YTDSAHFC Monterrey Park
rp_GlJdeIncomeStatementByCompany
Account Description
Current Month Year-To-Date
Actual Budget Variance Actual Budget VarianceLast YearLast Year %
Revenue
127,144 123,860 1,352,569 1,362,458 (9,889) 3,285 124,955 1,309,172 -.73Rental Revenue
(45) (4,250) (16,523) (46,753) 30,230 4,205 1,056 (28,914) -64.66Bad Debt, Net of Collections
3,814 3,000 36,966 33,000 3,966 814 2,360 31,642 12.02Other Tenant Revenue
5,083 1,396 55,700 15,354 40,346 3,687 (3,960) 24,149 262.77Miscellaneous Revenue
135,996 124,005 11,991 1,428,712 1,364,060 64,653 Net Revenue 124,410 1,336,049 4.74
Operating Expense
25,415 22,304 292,564 245,349 47,215 3,110 23,812 304,943 19.24Salaries and Benefits
6,113 6,600 46,166 72,600 (26,434)(487) 1,373 87,045 -36.41Supplies and Materials
23,633 23,487 223,165 258,353 (35,188) 146 9,999 294,325 -13.62Outside Services
10,191 9,144 106,778 100,588 6,190 1,046 4,058 71,734 6.15Utilities
1,200 1,200 14,400 13,200 1,200 0 1,200 14,800 9.09Protective Services
6,732 47,341 74,406 (27,064)(6,732) 0 53,822 -36.37Insurance
6,304 6,507 101,817 71,979 29,837 (202) 7,533 92,432 41.45Other Expenses
72,855 75,974 (3,119) 832,231 836,475 (4,244)Total Operating Expense 47,976 919,100 -.51
Total Operating Income 63,141 48,032 596,481 527,585 15,110 68,896 416,948 76,435 13.06
Non-Operating Income (Expense)
(12,838) (4,227) (187,736) (48,552) (139,184)(8,611)(4,544) (52,022) 286.67Interest Expense
2,979 1 4,456 7 4,449 2,978 23 40 59,473.13Interest Income
(4,706) (6,213) (71,104) (68,347) (2,757) 1,507 (8,384) (125,118) 4.03Replacement/Extraordinary Item
0 1,303 1,303 Other Income (Expense)
(11,258) (11,252) (120,160) (123,775) 3,615 (6)(8,273) (120,004) -2.92Management Fees
(25,824) (21,692) (4,132) (374,543) (240,665) (133,878)Total Non-Operating Income (Expense) (19,876) (295,802) 55.63
Income Before Non-Cash Items 37,318 26,340 221,938 286,920 10,978 (64,982) 121,147 56,559 (22.65)
Non-Cash Items
(1,828) (1,386) (20,113) (15,242) (4,870)(443)(1,386) (15,243) 31.95Depreciation & Amortization
(1,828) (1,386) (443) (20,113) (15,242) (4,870)Total Non-Cash Items (1,386) (15,243) 31.95
Change In Net Assets 35,489 24,954 201,825 271,677 10,535 (69,852) 105,904 55,173 (25.71)
UNAUDITED
For Internal Use Only

Period Ending May 31, 2018
Actual Amounts Vs. Approved Budget Comparison Page 1 of 1
6/7/2018 11:37:50PM
GlJdeIncomeStatementByCompany
Summarized Income Statement by Company, YTDReagan West Apartments
rp_GlJdeIncomeStatementByCompany
Account Description
Current Month Year-To-Date
Actual Budget Variance Actual Budget VarianceLast YearLast Year %
Revenue
3,439 3,159 27,538 34,734 (7,196) 280 6,683 34,075 -20.72Rental Revenue
159 (333) 613 (3,667) 4,280 493 0 (5,754) -116.73Bad Debt, Net of Collections
51 35 540 385 155 16 43 1,319 40.26Other Tenant Revenue
2,755 4,625 46,529 50,877 (4,348)(1,870) 0 38,876 -8.55Grants
5 20 1,659 220 1,439 (15) 0 (1,415) 654.09Miscellaneous Revenue
6,409 7,506 (1,096) 76,879 82,549 (5,669)Net Revenue 6,726 67,102 -6.87
Operating Expense
293 790 5,323 7,966 (2,644)(496) 490 4,320 -33.19Salaries and Benefits
469 315 3,898 4,415 (517) 154 0 4,375 -11.70Supplies and Materials
513 1,116 8,669 16,459 (7,790)(603) 506 18,692 -47.33Outside Services
1,644 724 10,764 7,967 2,797 920 845 8,470 35.10Utilities
379 155 1,517 1,705 (188) 224 0 965 -11.04Insurance
323 477 4,822 6,111 (1,289)(153) 468 7,089 -21.09Other Expenses
3,622 3,577 45 34,992 44,623 (9,631)Total Operating Expense 2,309 43,912 -21.58
Total Operating Income 2,788 3,929 41,887 37,926 (1,141) 3,962 23,190 4,417 10.45
Non-Operating Income (Expense)
124 6 694 67 627 117 9 72 933.74Interest Income
(659) (1,683) (2,231) (10,817) 8,585 1,024 0 (959) -79.37Replacement/Extraordinary Item
(866) (823) (9,568) (9,050) (517)(43)(867) (9,169) 5.72Management Fees
(1,401) (2,500) 1,099 (11,105) (19,800) 8,695 Total Non-Operating Income (Expense) (858) (10,055) -43.91
Income Before Non-Cash Items 1,386 1,429 30,782 18,126 (43) 12,656 13,135 3,559 69.82
Non-Cash Items
(456) (456) 1 0 (57) (627) -.14Depreciation & Amortization
(456) (456) 1 Total Non-Cash Items (57) (627) -.14
Change In Net Assets 1,386 1,429 30,326 17,670 (43) 12,657 12,507 3,502 71.63
UNAUDITED
For Internal Use Only

Period Ending May 31, 2018
Actual Amounts Vs. Approved Budget Comparison Page 1 of 1
6/7/2018 11:37:56PM
GlJdeIncomeStatementByCompany
Summarized Income Statement by Company, YTDSendero I PFC (Crown Meadows)
rp_GlJdeIncomeStatementByCompany
Account Description
Current Month Year-To-Date
Actual Budget Variance Actual Budget VarianceLast YearLast Year %
Revenue
175,720 168,972 1,912,261 1,858,692 53,570 6,748 171,620 1,872,755 2.88Rental Revenue
1,037 1,065 7,261 11,715 (4,454)(28) 1,157 6,930 -38.02Bad Debt, Net of Collections
17,108 8,175 161,844 89,925 71,919 8,933 7,421 87,902 79.98Other Tenant Revenue
520 8,418 4,534 92,602 (88,067)(7,899) 9,057 84,495 -95.10Miscellaneous Revenue
194,385 186,630 7,755 2,085,900 2,052,933 32,967 Net Revenue 189,255 2,052,081 1.61
Operating Expense
21,676 22,069 243,899 242,762 1,137 (394) 21,312 221,399 .47Salaries and Benefits
4,497 2,393 28,441 26,318 2,123 2,105 13,961 31,001 8.07Supplies and Materials
50 837 550 287 (50) 58 835 52.16Fleet Costs
11,605 12,686 129,112 139,551 (10,439)(1,082) 18,907 140,676 -7.48Outside Services
9,472 16,245 115,022 178,695 (63,673)(6,773) 12,054 166,741 -35.63Utilities
320 2,210 3,520 (1,310)(320) 520 3,273 -37.21Protective Services
51 5,430 37,385 60,114 (22,729)(5,379) 0 33,259 -37.81Insurance
4,770 5,762 64,454 66,062 (1,609)(993) 4,331 49,379 -2.44Other Expenses
52,070 64,956 (12,886) 621,359 717,573 (96,214)Total Operating Expense 71,144 646,563 -13.41
Total Operating Income 142,315 121,674 1,464,541 1,335,361 20,640 129,180 1,405,518 118,111 9.67
Non-Operating Income (Expense)
(32,220) (32,220) (368,640) (363,140) (5,500) 0 (33,156) (378,867) 1.51Interest Expense
2,379 140 15,011 1,538 13,473 2,239 227 2,085 876.27Interest Income
(7,241) (5,276) (48,619) (58,031) 9,411 (1,966) 16,160 (45,539) -16.22Replacement/Extraordinary Item
(10,854) (10,878) (119,405) (119,662) 257 24 (10,806) (119,076) -.22Management Fees
(47,937) (48,235) 298 (521,653) (539,295) 17,642 Total Non-Operating Income (Expense) (27,576) (541,397) -3.27
Income Before Non-Cash Items 94,378 73,440 942,888 796,066 20,938 146,822 864,120 90,536 18.44
Non-Cash Items
(32,535) (32,535) (357,888) (357,888) 0 0 (32,535) (357,888) .00Depreciation & Amortization
(32,535) (32,535) (357,888) (357,888) 0 Total Non-Cash Items (32,535) (357,888) .00
Change In Net Assets 61,842 40,905 585,000 438,178 20,938 146,822 506,232 58,000 33.51
UNAUDITED
For Internal Use Only

Period Ending May 31, 2018
Actual Amounts Vs. Approved Budget Comparison Page 1 of 1
6/7/2018 11:37:58PM
GlJdeIncomeStatementByCompany
Summarized Income Statement by Company, YTDCottage Creek I
rp_GlJdeIncomeStatementByCompany
Account Description
Current Month Year-To-Date
Actual Budget Variance Actual Budget VarianceLast YearLast Year %
Revenue
78,880 85,707 870,846 917,915 (47,069)(6,827) 70,113 770,587 -5.13Rental Revenue
(2,070) (3,200) (34,331) (35,200) 869 1,130 (4,408) (42,323) -2.47Bad Debt, Net of Collections
1,890 1,665 19,799 18,315 1,484 225 2,772 21,638 8.10Other Tenant Revenue
54,045 49,955 550,433 549,505 928 4,090 47,428 552,163 .17Grants
914 1,269 8,055 14,031 (5,977)(355)(2,386) 19,130 -42.60Miscellaneous Revenue
133,659 135,396 (1,737) 1,414,802 1,464,566 (49,764)Net Revenue 113,519 1,321,195 -3.40
Operating Expense
29,762 40,049 351,879 335,520 16,359 (10,286) 32,446 351,786 4.88Salaries and Benefits
11,430 4,975 52,829 61,400 (8,571) 6,455 8,088 54,641 -13.96Supplies and Materials
169 169 0 0 100.00Fleet Costs
27,358 16,743 183,859 219,250 (35,391) 10,615 18,810 252,620 -16.14Outside Services
11,032 14,112 117,092 155,231 (38,139)(3,079) 10,788 131,546 -24.57Utilities
8,960 4,480 55,552 49,280 6,272 4,480 3,528 44,800 12.73Protective Services
5,932 43,371 65,594 (22,223)(5,932) 0 47,019 -33.88Insurance
7,710 6,733 88,256 89,301 (1,045) 977 7,166 110,828 -1.17Other Expenses
96,253 93,024 3,229 893,008 975,576 (82,568)Total Operating Expense 80,826 993,241 -8.46
Total Operating Income 37,406 42,371 521,794 488,990 (4,966) 32,804 327,955 32,693 6.71
Non-Operating Income (Expense)
(6,318) (6,323) (71,223) (71,227) 4 5 (6,499) (191,853) -.01Interest Expense
702 96 6,681 1,052 5,629 606 133 2,598 534.99Interest Income
(9,950) (11,500) (48,144) (126,500) 78,356 1,550 (5,070) (33,802) -61.94Replacement/Extraordinary Item
0 0 845,134 Other Income (Expense)
(6,371) (6,319) (69,787) (69,513) (274)(51)(6,333) (69,404) .39Management Fees
150,000 (268,999) (268,999) 150,000 0 (269,802) 100.00Transfers
128,063 (24,047) 152,110 (451,473) (266,188) (185,285)Total Non-Operating Income (Expense) (17,770) 282,871 69.61
Income Before Non-Cash Items 165,469 18,325 70,320 222,801 147,144 (152,481) 610,826 14,923 (68.44)
Non-Cash Items
(7,313) (7,439) (82,025) (83,357) 1,332 126 (8,105) (87,134) -1.60Depreciation & Amortization
0 0 (145,636)Non-Oper Income (Expense)
(7,313) (7,439) 126 (82,025) (83,357) 1,332 Total Non-Cash Items (8,105) (232,770) -1.60
Change In Net Assets 158,156 10,886 (11,705) 139,444 147,270 (151,149) 378,056 6,818 (108.39)
UNAUDITED
For Internal Use Only

Period Ending May 31, 2018
Actual Amounts Vs. Approved Budget Comparison Page 1 of 1
6/7/2018 11:38:02PM
GlJdeIncomeStatementByCompany
Summarized Income Statement by Company, YTDCottage Creek II
rp_GlJdeIncomeStatementByCompany
Account Description
Current Month Year-To-Date
Actual Budget Variance Actual Budget VarianceLast YearLast Year %
Revenue
55,480 59,637 625,174 651,047 (25,873)(4,157) 56,366 534,186 -3.97Rental Revenue
(5,749) (4,000) (36,388) (44,000) 7,612 (1,749) 2,438 (21,441) -17.30Bad Debt, Net of Collections
1,592 725 18,466 7,975 10,491 867 461 11,506 131.55Other Tenant Revenue
46,660 46,292 488,331 509,212 (20,881) 368 34,825 490,785 -4.10Grants
1,992 650 6,913 7,850 (938) 1,342 (1,294) 14,866 -11.94Miscellaneous Revenue
99,975 103,304 (3,329) 1,102,496 1,132,084 (29,588)Net Revenue 92,795 1,029,901 -2.61
Operating Expense
21,188 31,562 253,099 263,755 (10,656)(10,374) 25,516 270,082 -4.04Salaries and Benefits
9,234 3,695 41,875 49,845 (7,970) 5,539 5,175 50,010 -15.99Supplies and Materials
16,194 12,066 125,023 166,790 (41,767) 4,128 16,528 198,074 -25.04Outside Services
7,156 10,140 76,229 111,536 (35,307)(2,984) 5,070 96,727 -31.66Utilities
7,040 3,520 43,648 38,720 4,928 3,520 2,772 38,720 12.73Protective Services
4,072 31,119 45,059 (13,939)(4,072) 0 33,271 -30.94Insurance
6,385 4,751 64,359 63,775 583 1,634 4,925 84,503 .91Other Expenses
67,197 69,806 (2,609) 635,353 739,481 (104,128)Total Operating Expense 59,985 771,386 -14.08
Total Operating Income 32,778 33,498 467,143 392,603 (720) 74,540 258,515 32,810 18.99
Non-Operating Income (Expense)
(4,309) (4,313) (48,577) (48,581) 4 4 (4,433) (135,774) -.01Interest Expense
71 784 (784)(71) 0 593 -100.00Interest Income
(5,363) (9,833) (34,261) (108,167) 73,905 4,471 (3,995) (37,543) -68.33Replacement/Extraordinary Item
0 0 574,491 Other Income (Expense)
(4,935) (4,896) (54,065) (53,852) (213)(40)(4,906) (53,709) .39Management Fees
(150,000) (159,838) (159,838)(150,000) 0 100.00Transfers
(164,607) (18,970) (145,637) (296,740) (209,815) (86,925)Total Non-Operating Income (Expense) (13,334) 348,057 41.43
Income Before Non-Cash Items (131,829) 14,528 170,402 182,787 (146,357) (12,385) 606,572 19,476 (6.78)
Non-Cash Items
(5,243) (5,445) (57,917) (60,100) 2,183 202 (5,691) (61,446) -3.63Depreciation & Amortization
0 0 (101,623)Non-Oper Income (Expense)
(5,243) (5,445) 202 (57,917) (60,100) 2,183 Total Non-Cash Items (5,691) (163,069) -3.63
Change In Net Assets (137,072) 9,083 112,485 122,688 (146,155) (10,202) 443,503 13,785 (8.32)
UNAUDITED
For Internal Use Only

Period Ending May 31, 2018
Actual Amounts Vs. Approved Budget Comparison Page 1 of 1
6/7/2018 11:38:03PM
GlJdeIncomeStatementByCompany
Summarized Income Statement by Company, YTDSAHFC Towering Oaks, LLC
rp_GlJdeIncomeStatementByCompany
Account Description
Current Month Year-To-Date
Actual Budget Variance Actual Budget VarianceLast YearLast Year %
Revenue
93,692 93,608 1,031,499 1,029,693 1,807 84 94,816 1,004,112 .18Rental Revenue
322 (1,159) (2,981) (12,745) 9,764 1,481 335 (6,393) -76.61Bad Debt, Net of Collections
1,055 600 11,683 6,600 5,083 455 895 10,079 77.01Other Tenant Revenue
370 983 4,749 10,817 (6,067)(613) 225 9,849 -56.09Miscellaneous Revenue
95,439 94,033 1,406 1,044,951 1,034,364 10,587 Net Revenue 96,271 1,017,646 1.02
Operating Expense
13,899 14,968 150,671 164,645 (13,974)(1,069) 12,540 136,838 -8.49Salaries and Benefits
6,653 1,812 27,214 19,933 7,281 4,841 756 23,018 36.53Supplies and Materials
9,260 9,292 92,993 102,208 (9,215)(31) 6,966 80,487 -9.02Outside Services
3,888 6,516 41,301 71,679 (30,378)(2,629) 3,384 61,976 -42.38Utilities
4,277 31,616 47,281 (15,665)(4,277) 0 34,576 -33.13Insurance
5,002 3,840 47,003 42,561 4,442 1,162 4,059 56,560 10.44Other Expenses
38,702 40,705 (2,004) 390,798 448,307 (57,510)Total Operating Expense 27,704 393,455 -12.83
Total Operating Income 56,737 53,328 654,153 586,057 3,410 68,096 624,192 68,567 11.62
Non-Operating Income (Expense)
(12,912) (12,949) (144,059) (144,460) 401 37 (13,349) (148,745) -.28Interest Expense
776 11 4,539 123 4,416 765 132 612 3,593.99Interest Income
(7,112) (8,815) (40,790) (96,961) 56,171 1,703 (3,608) (44,797) -57.93Replacement/Extraordinary Item
0 94,063 314,377 Other Income (Expense)
(8,094) (8,318) (90,441) (91,497) 1,056 224 (8,561) (92,217) -1.15Management Fees
(27,341) (30,071) 2,730 (270,752) (332,796) 62,044 Total Non-Operating Income (Expense) 68,678 29,230 -18.64
Income Before Non-Cash Items 29,396 23,257 383,401 253,261 6,139 130,141 653,422 137,245 51.39
Non-Cash Items
(1,502) (638) (14,224) (7,069) (7,155)(863)(2,071) (29,660) 101.21Depreciation & Amortization
0 0 (1,141)Non-Oper Income (Expense)
(1,502) (638) (863) (14,224) (7,069) (7,155)Total Non-Cash Items (2,071) (30,801) 101.21
Change In Net Assets 27,894 22,618 369,177 246,191 5,276 122,986 622,621 135,174 49.96
UNAUDITED
For Internal Use Only

Period Ending May 31, 2018
Actual Amounts Vs. Approved Budget Comparison Page 1 of 1
6/7/2018 11:38:04PM
GlJdeIncomeStatementByCompany
Summarized Income Statement by Company, YTDSAHFC Vera Cruz
rp_GlJdeIncomeStatementByCompany
Account Description
Current Month Year-To-Date
Actual Budget Variance Actual Budget VarianceLast YearLast Year %
Revenue
14,739 13,801 156,015 151,806 4,210 939 13,240 132,583 2.77Rental Revenue
20 (112) 476 (1,230) 1,706 132 (33) (3,493) -138.71Bad Debt, Net of Collections
100 970 1,100 (130)(100) 0 (4,035) -11.82Other Tenant Revenue
175 224 325 2,461 (2,137)(49) 261 584 -86.81Miscellaneous Revenue
14,934 14,012 921 157,786 154,137 3,649 Net Revenue 13,467 125,639 2.37
Operating Expense
1,238 1,347 17,715 14,817 2,898 (109) 1,235 10,518 19.56Salaries and Benefits
431 615 15,549 6,765 8,784 (184) 557 17,207 129.85Supplies and Materials
3,186 2,526 28,089 27,785 304 660 1,726 36,868 1.09Outside Services
1,407 1,594 15,880 17,538 (1,657)(188) 1,441 16,822 -9.45Utilities
2,125 2,125 0 50 4,150 100.00Protective Services
1,646 1,618 12,704 17,842 (5,138) 28 0 11,655 -28.80Insurance
2,293 1,138 25,090 12,565 12,525 1,155 1,612 16,169 99.69Other Expenses
10,200 8,838 1,362 117,152 97,311 19,841 Total Operating Expense 6,622 113,389 20.39
Total Operating Income 4,734 5,175 40,634 56,826 (441) (16,191) 12,250 6,845 (28.49)
Non-Operating Income (Expense)
(852) (64) (9,381) (775) (8,606)(788)(852) (9,458) 1,109.76Interest Expense
173 2 1,157 22 1,135 171 51 170 5,081.77Interest Income
(489) (2,975) (5,414) (32,725) 27,311 2,486 0 (12,151) -83.46Replacement/Extraordinary Item
(1,964) (1,720) (21,170) (18,915) (2,255)(245)(1,908) (19,742) 11.92Management Fees
(3,132) (4,757) 1,625 (34,808) (52,393) 17,585 Total Non-Operating Income (Expense) (2,710) (41,181) -33.56
Income Before Non-Cash Items 1,602 418 5,826 4,433 1,184 1,393 (28,932) 4,136 31.43
Non-Cash Items
(3,783) (3,783) (41,609) (41,609) 0 0 (3,783) (41,609) .00Depreciation & Amortization
(3,783) (3,783) 0 (41,609) (41,609) 0 Total Non-Cash Items (3,783) (41,609) .00
Change In Net Assets (2,181) (3,365) (35,783) (37,176) 1,184 1,393 (70,541) 353 (3.75)
UNAUDITED
For Internal Use Only

Period Ending May 31, 2018
Actual Amounts Vs. Approved Budget Comparison Page 1 of 1
6/7/2018 11:38:06PM
GlJdeIncomeStatementByCompany
Summarized Income Statement by Company, YTDWoodhill Apartments PFC
rp_GlJdeIncomeStatementByCompany
Account Description
Current Month Year-To-Date
Actual Budget Variance Actual Budget VarianceLast YearLast Year %
Revenue
343,079 370,796 3,813,679 4,078,756 (265,077)(27,717) 340,116 3,653,410 -6.50Rental Revenue
(20,325) (10,262) (134,682) (112,882) (21,800)(10,063) 6,014 (110,106) 19.31Bad Debt, Net of Collections
8,651 7,027 86,888 77,297 9,591 1,624 5,150 75,477 12.41Other Tenant Revenue
1,940 6,095 26,577 67,045 (40,468)(4,155)(6,856) 46,836 -60.36Miscellaneous Revenue
333,345 373,656 (40,311) 3,792,463 4,110,216 (317,754)Net Revenue 344,424 3,665,616 -7.73
Operating Expense
44,514 56,693 548,668 623,626 (74,958)(12,180) 60,737 598,864 -12.02Salaries and Benefits
4,792 6,550 79,001 72,050 6,951 (1,758)(7,637) 122,889 9.65Supplies and Materials
0 0 14,169 Fleet Costs
42,304 49,732 606,055 547,049 59,006 (7,428) 29,452 677,984 10.79Outside Services
37,974 30,482 381,552 335,298 46,254 7,492 25,822 322,322 13.79Utilities
1,800 4,083 18,430 44,917 (26,487)(2,283) 1,800 46,805 -58.97Protective Services
16,356 125,466 179,913 (54,448)(16,356) 0 94,730 -30.26Insurance
17,198 13,102 225,700 146,793 78,907 4,096 10,010 184,400 53.75Other Expenses
148,580 176,997 (28,417) 1,984,871 1,949,646 35,225 Total Operating Expense 120,184 2,062,164 1.81
Total Operating Income 184,765 196,659 1,807,591 2,160,570 (11,894) (352,979) 1,603,453 224,240 (16.34)
Non-Operating Income (Expense)
(21,559) (21,559) (249,631) (243,631) (6,000) 0 (28,426) (258,153) 2.46Interest Expense
6,796 103 59,753 1,133 58,620 6,693 3,374 14,911 5,173.89Interest Income
(37,471) (27,895) (200,484) (306,845) 106,361 (9,576)(63,434) (189,272) -34.66Replacement/Extraordinary Item
0 0 2,534,215 Other Income (Expense)
(33,270) (33,367) (356,155) (367,037) 10,882 97 (32,146) (355,830) -2.96Management Fees
(85,504) (82,718) (2,787) (746,517) (916,380) 169,863 Total Non-Operating Income (Expense) (120,633) 1,745,870 -18.54
Income Before Non-Cash Items 99,260 113,941 1,061,074 1,244,190 (14,681) (183,116) 3,349,323 103,607 (14.72)
Non-Cash Items
(56,498) (55,834) (621,475) (614,173) (7,302)(664)(77,030) (635,407) 1.19Depreciation & Amortization
0 0 (816,566)Non-Oper Income (Expense)
(56,498) (55,834) (664) (621,475) (614,173) (7,302)Total Non-Cash Items (77,030) (1,451,973) 1.19
Change In Net Assets 42,763 58,107 439,599 630,017 (15,345) (190,418) 1,897,350 26,577 (30.22)
UNAUDITED
For Internal Use Only

Period Ending May 31, 2018
Actual Amounts Vs. Approved Budget Comparison Page 1 of 1
6/7/2018 11:38:08PM
GlJdeIncomeStatementByCompany
Summarized Income Statement by Company, YTDHemisView Market Units
rp_GlJdeIncomeStatementByCompany
Account Description
Current Month Year-To-Date
Actual Budget Variance Actual Budget VarianceLast YearLast Year %
Revenue
203,104 208,662 997,159 1,043,312 (46,153)(5,558) 200,081 1,034,585 -4.42Rental Revenue
(2,792) 404 247 2,022 (1,775)(3,196)(516) 10,795 -87.78Bad Debt, Net of Collections
14,975 13,949 67,194 69,747 (2,554) 1,026 18,582 44,240 -3.66Other Tenant Revenue
2,328 1,015 3,195 5,073 (1,879) 1,314 (2,312) 18,403 -37.03Miscellaneous Revenue
217,616 224,031 (6,415) 1,067,795 1,120,155 (52,360)Net Revenue 215,834 1,108,023 -4.67
Operating Expense
21,955 29,417 121,231 147,087 (25,856)(7,463) 29,644 120,057 -17.58Salaries and Benefits
4,797 3,095 18,493 15,477 3,017 1,701 3,938 11,788 19.49Supplies and Materials
11,530 13,008 61,402 65,042 (3,640)(1,478) 11,394 52,509 -5.60Outside Services
12,396 12,854 56,580 64,268 (7,687)(457) 11,024 57,544 -11.96Utilities
320 478 5,797 2,390 3,407 (158) 1,163 3,251 142.54Protective Services
6,086 15,970 30,429 (14,458)(6,086) 0 15,386 -47.52Insurance
7,363 9,014 45,403 45,070 333 (1,651) 17,270 49,431 .74Other Expenses
58,360 73,952 (15,592) 324,877 369,761 (44,885)Total Operating Expense 74,433 309,966 -12.14
Total Operating Income 159,256 150,079 742,918 750,393 9,177 (7,475) 798,057 141,401 (1.00)
Non-Operating Income (Expense)
(90,771) (71,671) (454,798) (358,357) (96,441)(19,100)(91,349) (457,641) 26.91Interest Expense
897 27 3,000 134 2,866 870 35 148 2,142.06Interest Income
(5,578) (4,989) (18,930) (24,946) 6,016 (589)(3,218) (24,084) -24.12Replacement/Extraordinary Item
(415) (6,439) (2,075) (4,364) 415 0 210.33Other Income (Expense)
(8,258) (8,310) (41,219) (41,552) 334 52 (8,220) (42,074) -.80Management Fees
(103,710) (85,359) (18,351) (518,386) (426,796) (91,590)Total Non-Operating Income (Expense) (102,751) (523,651) 21.46
Income Before Non-Cash Items 55,545 64,719 224,532 323,597 (9,174) (99,065) 274,406 38,650 (30.61)
Non-Cash Items
(44,079) (44,079) (220,396) (220,396) 0 (44,079) (220,396)Depreciation & Amortization
243,851 243,851 0 0 3,212,715 100.00Non-Oper Income (Expense)
(44,079) (44,079) 23,454 (220,396) 243,851 Total Non-Cash Items (44,079) 2,992,319 -110.64
Change In Net Assets 11,466 20,640 247,987 103,201 (9,174) 144,786 3,266,726 (5,429) 140.29
UNAUDITED
For Internal Use Only

Period Ending May 31, 2018
Actual Amounts Vs. Approved Budget Comparison Page 1 of 1
6/7/2018 11:38:12PM
GlJdeIncomeStatementByCompany
Summarized Income Statement by Company, YTDHemisView Village
rp_GlJdeIncomeStatementByCompany
Account Description
Current Month Year-To-Date
Actual Budget Variance Actual Budget VarianceLast YearLast Year %
Revenue
13,155 13,217 64,968 66,083 (1,115)(62) 13,320 52,084 -1.69Rental Revenue
1,317 6,587 (6,587)(1,317) 0 -100.00Other Tenant Revenue
14,818 9,165 57,269 45,826 11,444 5,653 8,590 47,722 24.97Grants
1,623 (348) 7,115 (1,738) 8,853 1,971 1,569 6,994 -509.52Miscellaneous Revenue
29,596 23,352 6,244 129,353 116,759 12,594 Net Revenue 23,479 106,800 10.79
Operating Expense
6,568 9,806 34,677 49,029 (14,352)(3,238) 7,517 34,419 -29.27Salaries and Benefits
1,435 791 6,441 3,953 2,489 645 1,436 4,458 62.96Supplies and Materials
3,917 3,362 16,524 16,811 (287) 554 1,374 12,609 -1.71Outside Services
3,685 4,285 16,467 21,423 (4,956)(600) 3,290 18,383 -23.13Utilities
101 159 1,909 797 1,113 (58) 367 1,027 139.66Protective Services
2,020 5,323 10,099 (4,776)(2,020) 0 5,224 -47.29Insurance
1,171 2,792 8,731 13,959 (5,228)(1,621) 3,140 10,680 -37.45Other Expenses
16,877 23,214 (6,337) 90,073 116,070 (25,998)Total Operating Expense 17,124 86,800 -22.40
Total Operating Income 12,719 138 39,280 689 12,582 38,592 19,999 6,355 5,604.76
Non-Operating Income (Expense)
(25,875) (982) (129,387) (4,909) (124,478)(24,893)(25,048) (125,251) 2,535.69Interest Expense
(334) (1,672) 1,672 334 0 -100.00Replacement/Extraordinary Item
(138) (339) (692) 353 138 0 -51.00Other Income (Expense)
(2,307) (2,435) (11,470) (12,176) 706 128 (2,281) (11,686) -5.80Management Fees
(28,182) (3,890) (24,292) (141,196) (19,449) (121,747)Total Non-Operating Income (Expense) (27,328) (136,936) 625.99
Income Before Non-Cash Items (15,463) (3,752) (101,916) (18,760)(11,711) (83,156)(116,937)(20,973) 443.26
Non-Cash Items
(16,485) (16,485) (82,424) (82,424) 0 0 (16,485) (82,424) .00Depreciation & Amortization
(243,851) (243,851) 0 0 (3,212,715) 100.00Non-Oper Income (Expense)
(16,485) (16,485) 0 (326,275) (82,424) (243,851)Total Non-Cash Items (16,485) (3,295,140) 295.85
Change In Net Assets (31,948) (20,237) (428,191) (101,185)(11,711) (327,006)(3,412,077)(37,458) 323.18
UNAUDITED
For Internal Use Only

Period Ending May 31, 2018
Actual Amounts Vs. Approved Budget Comparison Page 1 of 1
6/7/2018 11:38:13PM
GlJdeIncomeStatementByCompany
Summarized Income Statement by Company, YTDMidcrowne Seniors Pavillion LP
rp_GlJdeIncomeStatementByCompany
Account Description
Current Month Year-To-Date
Actual Budget Variance Actual Budget VarianceLast YearLast Year %
Revenue
109,476 110,084 539,694 550,422 (10,728)(608) 109,596 550,977 -1.95Rental Revenue
(2,160) (360) (1,501) (1,800) 299 (1,800) 0 (29) -16.61Bad Debt, Net of Collections
1,610 2,439 9,052 12,193 (3,141)(828) 1,240 6,960 -25.76Other Tenant Revenue
5,268 2,434 17,528 12,168 5,359 2,834 3,045 13,166 44.04Grants
2,502 700 7,313 3,501 3,812 1,801 3,131 8,885 108.87Miscellaneous Revenue
116,696 115,297 1,399 572,085 576,485 (4,399)Net Revenue 117,012 579,960 -.76
Operating Expense
42,887 20,057 111,680 100,284 11,396 22,830 16,911 107,463 11.36Salaries and Benefits
2,759 3,689 7,859 18,445 (10,586)(930) 2,927 11,967 -57.39Supplies and Materials
10,851 14,974 51,180 74,869 (23,688)(4,122) 15,063 80,190 -31.64Outside Services
8,316 11,854 55,141 59,272 (4,131)(3,539) 8,355 53,622 -6.97Utilities
2,160 2,137 18,592 10,687 7,905 23 6,052 53,722 73.97Protective Services
4,999 11,623 28,037 58,113 (30,076)(6,623) 5,586 31,842 -51.75Insurance
7,606 8,554 32,613 42,769 (10,156)(948) 9,251 42,640 -23.75Other Expenses
79,579 72,888 6,691 305,102 364,438 (59,336)Total Operating Expense 64,145 381,445 -16.28
Total Operating Income 37,117 42,409 266,984 212,047 (5,293) 54,937 198,515 52,868 25.91
Non-Operating Income (Expense)
(7,033) (50,755) (136,708) (254,116) 117,408 43,722 (58,138) (162,208) -46.20Interest Expense
25 0 56 1 56 25 0 10,161.82Interest Income
(3,655) (2,974) (10,334) (14,868) 4,534 (682)(430) (5,358) -30.49Replacement/Extraordinary Item
(736) (763) (8,566) (3,813) (4,752) 27 0 124.63Other Income (Expense)
(4,647) (4,825) (23,068) (24,124) 1,056 177 (1,498) (23,502) -4.38Management Fees
(16,046) (59,317) 43,270 (178,620) (296,922) 118,301 Total Non-Operating Income (Expense) (60,065) (191,068) -39.84
Income Before Non-Cash Items 21,071 (16,907) 88,364 (84,875) 37,978 173,239 7,447 (7,197) (204.11)
Non-Cash Items
(31,211) (28,592) (156,057) (142,960) (13,097)(2,619)(28,592) (142,960) 9.16Depreciation & Amortization
(31,211) (28,592) (2,619) (156,057) (142,960) (13,097)Total Non-Cash Items (28,592) (142,960) 9.16
Change In Net Assets (10,141) (45,499) (67,693) (227,835) 35,358 160,142 (135,513)(35,789) (70.29)
UNAUDITED
For Internal Use Only

Period Ending May 31, 2018
Actual Amounts Vs. Approved Budget Comparison Page 1 of 1
6/7/2018 11:38:15PM
GlJdeIncomeStatementByCompany
Summarized Income Statement by Company, YTDO'Connor Ltd. Partnership
rp_GlJdeIncomeStatementByCompany
Account Description
Current Month Year-To-Date
Actual Budget Variance Actual Budget VarianceLast YearLast Year %
Revenue
88,921 88,551 447,055 440,520 6,536 370 88,267 441,195 1.48Rental Revenue
38 265 1,065 425 640 (227)(424) 1,251 150.66Bad Debt, Net of Collections
30 265 146 2,488 (2,342)(235) 2,045 2,334 -94.12Other Tenant Revenue
(24) 740 218 3,700 (3,482)(764)(897) 3,757 -94.11Miscellaneous Revenue
88,965 89,821 (856) 448,485 447,133 1,352 Net Revenue 88,991 448,536 .30
Operating Expense
18,782 20,510 104,452 108,580 (4,128)(1,728) 20,665 94,199 -3.80Salaries and Benefits
2,011 2,293 9,758 11,746 (1,988)(282) 2,189 9,282 -16.93Supplies and Materials
10,392 9,980 35,028 59,368 (24,340) 412 8,726 47,706 -41.00Outside Services
4,794 7,820 25,983 39,100 (13,117)(3,026) 5,377 33,643 -33.55Utilities
2 3,697 19,905 18,536 1,369 (3,696) 3 17,958 7.39Insurance
11,195 11,390 24,687 31,468 (6,781)(196) 10,888 26,802 -21.55Other Expenses
47,175 55,691 (8,516) 219,813 268,798 (48,985)Total Operating Expense 47,849 229,590 -18.22
Total Operating Income 41,790 34,131 228,672 178,335 7,659 50,337 218,946 41,142 28.23
Non-Operating Income (Expense)
(34,279) (34,278) (171,937) (171,937) 0 0 (33,933) (170,168) .00Interest Expense
231 57 1,152 284 867 175 63 227 305.20Interest Income
(2,473) (4,950) (12,667) (24,250) 11,583 2,477 (4,759) (17,393) -47.77Replacement/Extraordinary Item
(5,070) (5,070) 0 0 100.00Other Income (Expense)
(5,551) (5,606) (27,576) (27,926) 350 55 (5,638) (27,951) -1.25Management Fees
(42,071) (44,777) 2,706 (216,098) (223,828) 7,730 Total Non-Operating Income (Expense) (44,267) (215,285) -3.45
Income Before Non-Cash Items (281) (10,646) 12,574 (45,493) 10,365 58,067 3,661 (3,125) (127.64)
Non-Cash Items
(21,197) (15,477) (105,985) (77,384) (28,601)(5,720)(20,998) (104,991) 36.96Depreciation & Amortization
(21,197) (15,477) (5,720) (105,985) (77,384) (28,601)Total Non-Cash Items (20,998) (104,991) 36.96
Change In Net Assets (21,478) (26,123) (93,412) (122,877) 4,645 29,466 (101,331)(24,123) (23.98)
UNAUDITED
For Internal Use Only

Period Ending May 31, 2018
Actual Amounts Vs. Approved Budget Comparison Page 1 of 1
6/7/2018 11:38:20PM
GlJdeIncomeStatementByCompany
Summarized Income Statement by Company, YTDRefugio Street, LP
rp_GlJdeIncomeStatementByCompany
Account Description
Current Month Year-To-Date
Actual Budget Variance Actual Budget VarianceLast YearLast Year %
Revenue
140,782 143,892 676,589 719,459 (42,870)(3,110) 145,893 708,418 -5.96Rental Revenue
1,228 183 3,532 913 2,620 1,046 1,097 (1,520) 287.08Bad Debt, Net of Collections
9,425 9,479 46,203 47,396 (1,193)(54) 7,581 31,275 -2.52Other Tenant Revenue
15,206 10,696 61,404 53,479 7,924 4,510 10,955 56,699 14.82Grants
4,244 1,559 11,426 7,797 3,629 2,684 1,642 11,525 46.54Miscellaneous Revenue
170,885 165,809 5,076 799,154 829,044 (29,890)Net Revenue 167,168 806,398 -3.61
Operating Expense
28,115 37,153 157,144 185,764 (28,621)(9,038) 34,310 170,097 -15.41Salaries and Benefits
1,015 2,465 8,178 12,325 (4,147)(1,450) 1,881 21,405 -33.65Supplies and Materials
10,540 14,346 71,704 71,730 (26)(3,806) 16,344 68,513 -.04Outside Services
11,068 14,987 60,424 74,935 (14,511)(3,919) 11,714 70,996 -19.36Utilities
6,502 244 30,251 1,221 29,030 6,257 0 1,142 2,377.82Protective Services
5,433 14,427 27,165 (12,739)(5,433) 0 12,487 -46.89Insurance
6,745 7,739 40,981 38,695 2,286 (994) 20,887 46,105 5.91Other Expenses
63,985 82,367 (18,383) 383,108 411,835 (28,727)Total Operating Expense 85,136 390,746 -6.98
Total Operating Income 106,900 83,442 416,046 417,209 23,459 (1,162) 415,652 82,032 (.28)
Non-Operating Income (Expense)
(57,137) (21,560) (283,236) (108,371) (174,865)(35,577)(57,739) (287,300) 161.36Interest Expense
839 150 4,609 750 3,859 689 118 440 514.51Interest Income
(3,626) (7,624) (22,690) (38,118) 15,428 3,998 (2,699) (25,650) -40.47Replacement/Extraordinary Item
(2,527) (2,527) 0 0 100.00Other Income (Expense)
(8,691) (8,798) (42,349) (43,988) 1,639 106 (9,079) (43,366) -3.73Management Fees
(68,615) (37,831) (30,784) (346,193) (189,728) (156,466)Total Non-Operating Income (Expense) (69,398) (355,876) 82.47
Income Before Non-Cash Items 38,285 45,610 69,853 227,481 (7,325) (157,628) 59,776 12,634 (69.29)
Non-Cash Items
(36,584) (36,584) (184,525) (182,919) (1,606) 0 (36,991) (184,954) .88Depreciation & Amortization
(36,584) (36,584) 0 (184,525) (182,919) (1,606)Total Non-Cash Items (36,991) (184,954) .88
Change In Net Assets 1,701 9,027 (114,672) 44,562 (7,325) (159,234)(125,178)(24,356) (357.33)
UNAUDITED
For Internal Use Only

Period Ending May 31, 2018
Actual Amounts Vs. Approved Budget Comparison Page 1 of 1
6/7/2018 11:38:28PM
GlJdeIncomeStatementByCompany
Summarized Income Statement by Company, YTDScience Park II, LP
rp_GlJdeIncomeStatementByCompany
Account Description
Current Month Year-To-Date
Actual Budget Variance Actual Budget VarianceLast YearLast Year %
Revenue
73,866 72,782 364,547 363,640 908 1,084 72,543 359,949 .25Rental Revenue
124 150 448 425 23 (26) 0 175 5.37Bad Debt, Net of Collections
(54) 524 956 1,823 (867)(578) 1,233 1,725 -47.56Other Tenant Revenue
136 52 211 260 (49) 84 (715) 287 -18.98Miscellaneous Revenue
74,072 73,508 565 366,162 366,148 14 Net Revenue 73,061 362,136 .00
Operating Expense
17,751 19,748 94,176 96,552 (2,376)(1,997) 18,955 88,011 -2.46Salaries and Benefits
462 1,323 5,601 6,930 (1,329)(861) 1,882 4,894 -19.17Supplies and Materials
59 59 700 (641) 59 0 -91.55Fleet Costs
9,836 4,790 33,157 31,540 1,617 5,046 4,899 27,339 5.13Outside Services
4,390 5,212 22,973 26,060 (3,087)(822) 4,011 21,959 -11.84Utilities
2 2,565 16,310 12,874 3,435 (2,563) 3 14,908 26.68Insurance
11,930 11,644 24,624 32,627 (8,003) 286 10,783 28,753 -24.53Other Expenses
44,430 45,282 (852) 196,900 207,283 (10,383)Total Operating Expense 40,533 185,864 -5.01
Total Operating Income 29,643 28,226 169,262 158,865 1,417 10,397 176,272 32,528 6.54
Non-Operating Income (Expense)
(29,569) (29,569) (148,294) (148,294) 0 (29,213) (146,479)Interest Expense
109 43 463 213 251 67 47 165 117.90Interest Income
(4,005) (8,237) (18,025) 9,788 4,005 (1,899) (4,642) -54.30Replacement/Extraordinary Item
(13,314) (13,314) 0 0 100.00Other Income (Expense)
(4,582) (4,564) (22,705) (22,745) 40 (18)(4,502) (22,589) -.17Management Fees
(34,041) (38,096) 4,054 (192,087) (188,852) (3,236)Total Non-Operating Income (Expense) (35,566) (173,546) 1.71
Income Before Non-Cash Items (4,399) (9,870) (22,826) (29,987) 5,471 7,161 2,725 (3,038) (23.88)
Non-Cash Items
(12,426) (12,426) (81,262) (62,132) (19,129) 0 (18,891) (94,457) 30.79Depreciation & Amortization
(12,426) (12,426) (81,262) (62,132) (19,129)Total Non-Cash Items (18,891) (94,457) 30.79
Change In Net Assets (16,825) (22,296) (104,088) (92,119) 5,471 (11,968)(91,732)(21,929) 12.99
UNAUDITED
For Internal Use Only

Non-Consolidating Balance Sheet
Period Ending May 31, 2018
GlJdeNonConsolidatedBalanceSheet
Page 1 of 1
6/7/2018 11:36:36PM
Partnerships rp_GlJdeNonConsolidatedBalanceSheet
HemisView Market Units HemisView Village Science Park O Connor Road Refugio St. Ltd
This Year Last Year This Year Last Year This Year Last Year This Year Last Year This Year Last Year This Year
Midcrowne Pavillion
Last Year
Assets
Current Assets
Cash & Investments, Unrestricted 644,968 595,539 163,837 73,263 35 23,193 104,493 627,166 667,870 90,876 24,696 17,303
Cash & Investments, Restricted 334,081 286,871 906,314 888,460 514,048 480,727 588,539 1,163,953 1,181,160 545,400 379,693 389,941
Accounts Receivable 501,040 3,465,178 (404,801) (3,324,701) 144 40,525 40,054 78,236 71,701 50,882 67,547 140,463
Prepaid Expenses and Other Current Assets
15,970 15,386 5,323 5,129 33,612 30,545 36,816 14,427 12,273 41,091 122,211 74,971
Total Current Assets 1,496,058 4,362,975 670,674 (2,357,849) 547,838 574,990 728,250 1,883,781 1,933,003 769,901 594,147 622,679
Fixed Assets
Land, Buildings and Equipment 20,091,278 20,091,278 7,559,629 7,559,629 7,353,405 7,353,405 8,757,160 16,428,978 16,428,978 8,795,009 13,089,436 12,673,515
Construction In Progress 21,959 295,506
Accumulated Depreciation (4,220,272) (3,691,321) (1,576,897) (1,379,079) (3,406,916) (3,193,414) (3,548,605) (6,013,083) (5,569,621)(3,803,291) (4,117,411) (3,741,112)
Total Fixed Assets 15,871,006 16,399,957 5,982,732 6,180,550 3,968,448 4,159,991 4,991,719 10,415,896 10,859,357 5,208,556 8,972,025 9,227,909
Other Non-Current Assets
Other Non-Current Assets 3,316,315 3,366,854 1,110,847 1,129,197 5,687 8,771 863,408 828,333
Total Other Non-Current Assets 3,316,315 3,366,854 1,110,847 1,129,197 5,687 8,771 863,408 828,333
Total Assets 7,764,252 4,516,287 4,951,898 4,734,981 5,719,968 5,978,457 12,305,363 12,801,132 20,683,380 24,129,786 10,429,580 10,678,920
Liabilities
Current Liabilities
Trade Payable & Accruals 632,507 478,245 707,034 584,467 4,242 2,621 1,919 (1,320) (1,797) 2,383 7,168 28,103
Other Current Liabilities 2,221,617 1,993,201 2,481,578 2,184,226 1,090,655 970,954 1,251,438 4,266,919 4,102,699 1,399,467 255,193 239,834
Total Current Liabilities 2,854,124 2,471,445 3,188,613 2,768,693 1,094,897 973,575 1,401,849 4,265,599 4,100,902 1,253,357 262,361 267,938
Non-Current Liabilities
Non-Current Long Term Debt 22,683,942 22,894,112 6,555,448 6,558,327 3,521,199 3,617,080 3,798,772 8,259,597 8,613,291 3,627,582 7,046,965 7,010,281
Total Non-Current Liabilities 22,683,942 22,894,112 6,555,448 6,558,327 3,521,199 3,617,080 3,627,582 8,259,597 8,613,291 3,798,772 7,046,965 7,010,281
Total Liabilities 9,744,060 4,616,096 9,327,020 4,590,655 5,029,431 5,052,129 12,525,196 12,714,193 25,538,066 25,365,558 7,309,326 7,278,218
Equity
Equity
Invested In Capital Assets(2,744,435) (2,425,654) 410,667 607,209 1,061,412 1,172,152 1,565,149 2,040,547 2,141,269 1,446,428 3,614,476 3,831,870
Unrestricted Net Assets(2,444,332) 903,012 (3,296,789) (5,870,792) (1,675,270) (1,508,552) (1,227,359) (3,424,332) (2,865,001)(1,301,291) (873,915) (145,979)
Total Equity (4,854,686) (1,235,771) (1,979,808) (4,375,122) (99,810) 144,327 690,537 (219,832) 457,428 926,328 3,120,254 4,075,832
12,801,132 12,305,363 5,978,457 5,719,968 4,734,981 4,516,287 4,951,898 7,764,252 24,129,786 20,683,380 Total Liabilities and Equity 10,429,580 10,678,920
UNAUDITED
For Internal Use Only

Period Ending May 31, 2018
Actual Amounts Vs. Approved Budget ComparisonPage 1 of 2
6/7/2018 11:34:40PM
GlJdeIncomeStatementByLineOfBusiness
Summarized Income Statement by Line of Business, YTD
Managed Not Ownedrp_GlJdeIncomeStatementByLineOfBusiness
Account Description
Year-To-Date
Actual Budget Variance %
Revenue
61,100 62,104 (1,004)Rental Revenue -1.62
617 963 (346)Bad Debt, Net of Collections -35.96
140 550 (410)Other Tenant Revenue -74.55
75 183 (108)Miscellaneous Revenue -59.10
61,932 63,800 (1,869)Net Revenue -2.93
Operating Expense
17,097 13,841 3,255 Salaries and Benefits 23.52
19 6,554 (6,536)Supplies and Materials -99.72
Fleet Costs
2,738 11,458 (8,720)Outside Services -76.10
7,268 7,787 (519)Utilities -6.66
8,997 372 8,625 Insurance 2,319.00
3,374 2,897 477 Other Expenses 16.45
39,492 42,909 (3,417)Total Operating Expense -7.96
Total Operating Income 22,440 20,891 1,548 $7.41
Non-Operating Income (Expense)
163 5 158 Interest Income 3,418.40
(7,371) 7,371 Replacement/Extraordinary Item -100.00
(863) (866) 4 Management Fees -.43
(700) (8,233) 7,533 Total Non-Operating Income (Expense) -91.50
Surplus or Deficit Prior to Non-Cash Items 21,740 12,659 9,081 $71.74
Non-Cash Items
(15,799) (15,655) (144)Depreciation & Amortization .92
(15,799) (15,655) (144)Total Non-Cash Items .92
Change In Net Assets 5,940 (2,997) 8,937 ($298.24)
UNAUDITED
For Internal Use Only

Period Ending May 31, 2018
Actual Amounts Vs. Approved Budget ComparisonPage 2 of 2
6/7/2018 11:34:40PM
GlJdeIncomeStatementByLineOfBusiness
Summarized Income Statement by Line of Business, YTD
Managed Not Ownedrp_GlJdeIncomeStatementByLineOfBusiness
0K
10K
20K
30K
40K
50K
60K
70K
61K
0K 0K 0K 0K 0K 0K 0K 0K 0K
Dwelling Rental
Interest Inc-GeneralFund
Late Charges
Recovery - Adm Chrg
Application Fees
Admin - FICA
Admin -Hospitalization
Admin - Long TermDisability
Admin - Overtime
Admin - Retirement
Top 10 Sources of Revenue
Year-To-Date
0
1000
2000
3000
4000
5000
6000
7000
8000
7K7K
4K 4K
2K 2K 2K1K 1K 1K
Admin - Salaries
Ins-Liability
Water
Maint - Salaries
Sewer
Ins-Property
Lawn Services
Electricity
Maint - Hospitalization
Admin -Hospitalization
Top 10 Operating Expenses
Yer-To-Date
0K
1K
2K
3K
4K
5K
6K
7K
7K
2K2K
1K 1K 1K 1K 1K 1K 1K
Ins-Liability
Flooring Replacement
Ins-Property
Maint - Hospitalization
Dwell Eqt-Refrigerators
Legal Fees - ClientBillings
Dwell Eqt-WaterHeaters
Water
Dwell Eqt-Ranges
Technology/LicensingFees
Top 10 Variances Over Budget
Year-To-Date
0
4000
8000120001600020000
24000
28000
320002017
0
4000
8000120001600020000
24000
28000
320002018
AA
BA
Surplus (Deficit) Prior to Non-Cash Items
Year-To-Date
UNAUDITED
For Internal Use Only

Balance Sheet
Period Ending May 31, 2018
GlJdeBalanceSheetByLineOfBusiness
11:34:21PM6/7/2018
Page 1 of 1
Managed Not Owned rp_GlJdeBalanceSheetByLineOfBusiness
This Year Last Year
AssetsCurrent Assets
Cash & Investments, Unrestricted 23,617 16,454 Cash & Investments, RestrictedAccounts Receivable 129 (245)Prepaid Expenses and Other Current Assets 2,914 11,157
Total Current Assets 27,366 26,659
Fixed AssetsLand, Buildings and Equipment 782,581 782,581 Accumulated Depreciation (756,196) (737,228)
Total Fixed Assets 45,353 26,385
Other Non-Current AssetsOther Non-Current Assets 2,102 2,102
Total Other Non-Current Assets 2,102 2,102
Total Assets 55,147 74,821
LiabilitiesCurrent Liabilities
Trade Payable & Accruals 3,196 2,759 Other Current Liabilities 18,123 18,123
Total Current Liabilities 20,882 21,319
Non-Current LiabilitiesNon-Current Long Term Debt 464,416 479,540
Total Non-Current Liabilities 479,540 464,416
Total Liabilities 485,736 500,422
EquityInvested In Capital Assets (126,229) (122,385)Unrestricted Net Assets (304,360) (303,216)
Total Equity (425,601)(430,589)
74,821 55,147 Total Liabilities and Equity
UNAUDITED
For Internal Use Only