preliminary figures for fiscal 2018 and outlook 2019 · agenda 2 opportunities and challenges in...
TRANSCRIPT

Preliminary Figures for Fiscal 2018and Outlook 2019
Ticker: CON
ADR-Ticker: CTTAY
Twitter: @Continental_IR
http://www.continental-ir.com
January 2019

Agenda
Opportunities and Challenges in 20192 8
Opportunities and Challenges in the Medium Term3 14
2019 Outlook4 20
2
Corporation Highlights 20181 3
Preliminary Figures for Fiscal 2018 and Outlook 2019
January 2019
EDMR – Equity and Debt Market Relations

FY 2018
› Sales up by ~1% to ~€44.4 bn; organic sales growth at ~3%
› Adj. EBIT1 totaled ~€4.1 bn; adj. EBIT1 margin ~9.2%
› Free cash flow before acquisitions and US pension funding amounted to ~€1.8 bn
› Net debt at ~€1.8 bn; gearing ratio below 15% at YE 2018
› Order intake in the Automotive Group totaling ~€40 bn
Q4 2018
› Corporation adj. EBIT1 margin in Q4 2018 stood at ~9.7%
› Automotive Group organic sales growth about -2%, which is about 2%-points above global PC< production
› Automotive Group adj. EBIT1 margin in Q4 2018 at ~7.4%
› Winter tire sales up 4%; overall tire volumes in Q4 2018 up by 1% despite challenging comparables;
1) Corporation Highlights 2018Most Important KPIs
3
1Before amortization of intangibles from PPA, consolidation and special effects
2Cash flow before financing activities and acquisitions divided by net income attributable to the shareholders of the parent
Preliminary Figures for Fiscal 2018 and Outlook 2019
January 2019
EDMR – Equity and Debt Market Relations

9,85110,191 9,984
10,52411,000 11,033
10,69311,284 11,013
11,37410,788
11,250
1,164 1,167 1,1041,313
1,0591,161
772
1,100
Q1/16 Q2/16 Q3/16 Q4/16 Q1/17 Q2/17 Q3/17 Q4/17 Q1/18 Q2/18 Q3/18 Q4/18E
Sales (€ mn) Adj. EBIT (€ mn)
1) Corporation Highlights 2018Sales and Adjusted EBIT1 by Quarter
4
1Before amortization of intangibles from PPA, consolidation and special effects.
FY Sales €40,549 mn FY Sales €44,009 mn FY Sales ~€44.4 bn
Adj. EBIT1 ~€4.1 bn
1
Preliminary Figures for Fiscal 2018 and Outlook 2019
January 2019
EDMR – Equity and Debt Market Relations
~
~

6,0
11
6,1
58
5,9
58
6,3
70
6,7
54
6,6
61
6,3
44
6,8
06
6,8
14
6,9
78
6,4
11
6,6
40
557 554 491 578 563 561
258490
Q1
/16
Q2
/16
Q3
/16
Q4
/16
Q1
/17
Q2
/17
Q3
/17
Q4
/17
Q1
/18
Q2
/18
Q3
/18
Q4
/18
ESales (€ mn) Adj. EBIT (€ mn)
3,8
52
4,0
45
4,0
38
4,1
64
4,2
60
4,3
82
4,3
61
4,4
91
4,2
12
4,4
10
4,3
90
4,6
20
635 641 652759
531 631 546630
Q1
/16
Q2
/16
Q3
/16
Q4
/16
Q1
/17
Q2
/17
Q3
/17
Q4
/17
Q1
/18
Q2
/18
Q3
/18
Q4
/18
E
Sales (€ mn) Adj. EBIT (€ mn)
1) Corporation Highlights 2018Automotive Group and Rubber Group by Quarter
5
1
Automotive Group Rubber Group
1Before amortization of intangibles from PPA, consolidation and special effects.
1
Preliminary Figures for Fiscal 2018 and Outlook 2019
January 2019
EDMR – Equity and Debt Market Relations
~
~
~~

6%
2%
9%
4%
7%
12%
-2%
3%
5%
-6%
1%0%
Chassis & Safety Powertrain Interior
1) Corporation Highlights 2018Automotive: About 4%-Points Growth above Market in FY 2018
6
1 Passenger car and light truck <6t.
Growth of organic sales vs. PC & LT1 production Organic sales growth by division in 2018
Q1 Q2 Q3 Q4E
Preliminary Figures for Fiscal 2018 and Outlook 2019
January 2019
EDMR – Equity and Debt Market Relations
6%
8%
2%
-2%0
%
5%
-3%
-4%
Q1/18 Q2/18 Q3/18 Q4/18E
Automotive Group PC & LT prod. growth wwQ1 Q2 Q3 Q4E Q1 Q2 Q3 Q4E

1) Corporation Highlights 2018 CES Highlights 2019
7
Waveguide Head-up DisplayWith its latest innovation in head-up displays,
Continental has provided a solution to the
size problem of augmented reality head-up
displays and made them compatible with
vehicles. This enables augmentations in a
2.6 m x 0.87 m range over a projection
distance of 10 m – and the device itself has
been reduced in size by ~1/3.
With this enhancement of the intelligent door,
Continental is providing drivers with their very
own “doorkeeper,” ensuring that drivers can
get in and out of their vehicle safely and
comfortably. Sensors monitoring traffic from
the side prevent damage to doors, while Assist
mode makes opening and closing the door
easier and holds it securely in the desired
position, even on a slope. The system received
a CES Innovation Award for “Vehicle
Intelligence and Self-Driving Technology”.
CES 2019 Innovation Honoree Award –
Intelligent Door System
Go to press release
Go to press release
Digitalization enables mobility-related data from
connected vehicles, smartphones and infrastructure to be
harnessed to meet dynamic urban mobility requirements.
At the core of Continental’s smart city offerings lies the
data platform City Data as a Service, which not only
stores and processes data, but creates real added value
through data analysis and the application of artificial
intelligence. At CES 2019, Continental is showcasing
different solutions based on the City Data as a Service
platform such as:
- fleet management,
- intelligent streetlamp and
- intelligent intersection.
Smart cities – City Data as a Service
Continental Develops Global 5G-Hybrid-V2X Solution
and Wins First Series ProjectThe technology company Continental is developing a
flexible 5G hybrid platform that allows both: mobile
network communication, and rapid and reliable direct
exchange of data. These benefits are being realized
with a first customer award for this 5G-Hybrid-V2X
solution.
Go to press release
Preliminary Figures for Fiscal 2018 and Outlook 2019
January 2019
EDMR – Equity and Debt Market Relations
Go to press release

2019
› German and European PC & LT production still impacted by WLTP
› North America PC & LT production expected to stabilize on high level
› Chinese PC & LT production expected to slightly decrease
› ContiTech: Further Stabilization of Oil and Mining-Related Sectors
› Tire start-up new factories
Medium Term
› Rising demand vs. rather stable tire capex
› Margin enhancement program in ContiTech
› Order backlog supports Automotive Group growth
› Rising R&D expenses in Automotive, a consequence of successfully transforming the business towards electronics
and software
› High growth combined with continuous investment in R&D will limit operating leverage in the next 12-18 month
› Regional sales and customer mix becoming more balanced
2) Opportunities and Challenges in 2019
8
Preliminary Figures for Fiscal 2018 and Outlook 2019
January 2019
EDMR – Equity and Debt Market Relations

2) Opportunities and Challenges in 2019German and European PC & LT1 Production Still Impacted by WLTP
9
1Passenger car and light truck (<6t); source: IHS and own estimates
2 IHS estimate in December 2017
› Opportunities
› WLTP impacted H2 18 significantly;
issues should persist in H1 2019
› Increase of production in H2 2019 possible
› Challenges
› German car production amounts to approx. 30% of
European car production
› German production expected to stabilize
during 2019 on the level of 2018 only
› Import tariffs could impact exports
21
.8
20
.6
16
.3 18
.8
20
.0
19
.0
19
.2
19
.9
20
.8
21
.4
22
.1
21
.8
21
.8
94% 101%
80%90%
Q1 Q2 Q3 Q4E
LV production
[22.6E]2
PC & LT1 Production (mn units) – Europe
Development in Germany during 2018 (YoY)
Preliminary Figures for Fiscal 2018 and Outlook 2019
January 2019
EDMR – Equity and Debt Market Relations

2) Opportunities and Challenges in 2019North American PC & LT1 Production Expected to Stabilize on High Level
10
1Passenger car and light truck (<6t); source: IHS and own estimates
2 Source: Fed data via Bloomberg
› Opportunities
› Vehicle demand should benefit from economic
growth
› Trade deals could trigger pent-up demand
› Challenges
› 80% of car sales are financed
› Rising interest rates might impact demand
› Trade tensions might impact in- and exports of
PC & LT1
15
.1
12
.6
8.6 1
1.9
13
.1 15
.4
16
.2
17
.0
17
.5
17
.8
17
.1
16
.9
16
.9
02505007501,0001,250
0
2
4
6
8
$ bn%
U.S. Auto Loans 60M New Car Bank Rate
PC & LT1 Production (mn units) – North America
Lower Bank Rates Boosted Auto Loans in the U.S.2
Preliminary Figures for Fiscal 2018 and Outlook 2019
January 2019
EDMR – Equity and Debt Market Relations

2) Opportunities and Challenges in 2019Chinese PC & LT1 Production Expected to Decrease Slightly
11
1Passenger car and light truck (<6t); source: IHS and own estimates
› Opportunities
› Incentives could help demand
› Overall car park still at a low level
(PC</1’000 people of ~170 vs. ~670 in Germany,
~600 in Japan and ~800 in the U.S.)
› Demand for EV´s rising strongly
› Challenges
› Chinese GDP growth slowing further
› High inventories will burden production in H1 2019
› Trade tensions might dampen trade and demand
› Shift of production towards EV´s due to consumer´s
regulatory changes
8.1
8.6 1
2.8 1
6.8
17
.3
18
.2 20
.9
22
.6
23
.7 27
.1
27
.7
27
.0
26
.1
98%110%
92% 90%
Q1 Q2 Q3 Q4E
LV production
PC & LT1 Production (mn units) – China
Development in China during 2018 (YoY)
Preliminary Figures for Fiscal 2018 and Outlook 2019
January 2019
EDMR – Equity and Debt Market Relations

2) Opportunities and Challenges in 2019ContiTech: Further Stabilization of Oil and Mining-Related Sectors
12
1Source: Company filings and consensus data for BHP, Rio, Vale, Grupo Mexico,
FCX, ABX, GG, NEM, NCM, TCK/B, ANTO, NUE, AA, KGC, AEM, EGO
› Oil and mining-related exposure of ContiTech stabilized at around
15% of sales (after Hornschuch acquisition)
› Oil-related business recover further in 2019 due to increasing utilization
Preliminary Figures for Fiscal 2018 and Outlook 2019
January 2019
EDMR – Equity and Debt Market Relations
› Cost structure in mining related business aligned to benefit
from recovery ahead
› Slight Capex increase in mining-related businesses expected
Oil Price and Rig Count Data Mining Capex (mn US$)1

12
7
13
5
14
0
15
5
11
2
12
0
14
5
16
0
0
100
200
300
Q1
/15
Q2
/15
Q3
/15
Q4
/15
Q1
/16
Q2
/16
Q3
/16
Q4
/16
Q1
/17
Q2
/17
Q3
/17
Q4
/17
Q1
/18
Q2
/18
Q3
/18
Q4
/18E
Q1
/19E
Q2
/19E
Q3
/19E
Q4
/19E
TSR 20 (U.S. cents/kg) Butadiene (U.S. cents/kg)
2) Opportunities and Challenges in 2019Expected Raw Material Price Development in 2019
13
› Natural rubber moving upwards again
recently, however assumed neutral versus
2018
› Synthetic rubber price dropped in Q4 2018,
but should recover during the course of the
year and therefore deemed as cost neutral
› Carbon black and chemicals still on
elevated levels
› Based on these assumptions, raw
materials (including tariffs for steel) are
expected to have a negative impact of
about €50 mn in 2019
1Source: Bloomberg and Continental estimates for 2019
Average (Y)
TSR 20: 137
Butadiene: 90
Average (Y)
TSR 20: 138
Butadiene: 113
Average (Y)
TSR 20: 167
Butadiene: 151
Average (Y)
TSR 20: 137
Butadiene: 141
Raw material price development1 2015 - 2019E (U.S. cents/kg)
Average (Y)
TSR 20: 140
Butadiene: 140
Preliminary Figures for Fiscal 2018 and Outlook 2019
January 2019
EDMR – Equity and Debt Market Relations
13
5
13
0
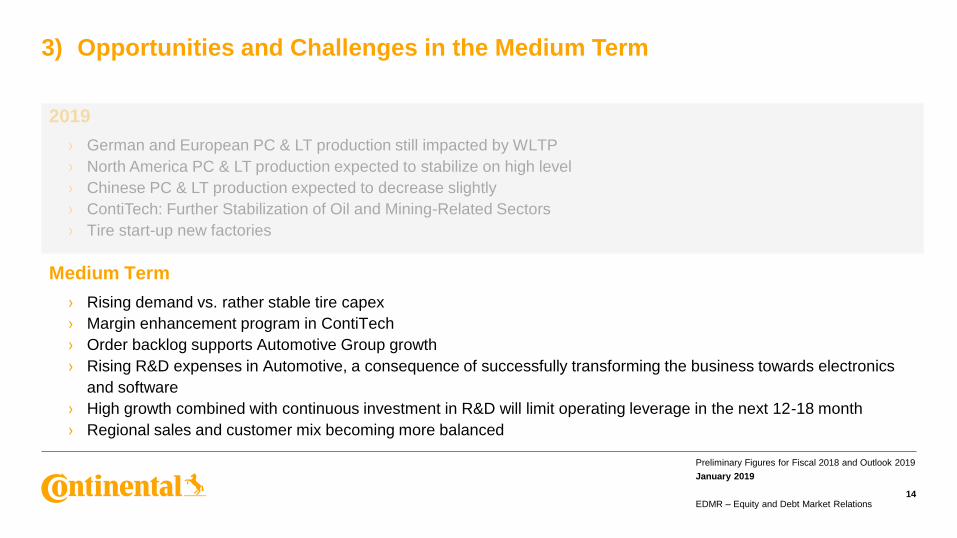
3) Opportunities and Challenges in the Medium Term
14
2019
› German and European PC & LT production still impacted by WLTP
› North America PC & LT production expected to stabilize on high level
› Chinese PC & LT production expected to decrease slightly
› ContiTech: Further Stabilization of Oil and Mining-Related Sectors
› Tire start-up new factories
Medium Term
› Rising demand vs. rather stable tire capex
› Margin enhancement program in ContiTech
› Order backlog supports Automotive Group growth
› Rising R&D expenses in Automotive, a consequence of successfully transforming the business towards electronics
and software
› High growth combined with continuous investment in R&D will limit operating leverage in the next 12-18 month
› Regional sales and customer mix becoming more balanced
Preliminary Figures for Fiscal 2018 and Outlook 2019
January 2019
EDMR – Equity and Debt Market Relations

3) Opportunities and Challenges in the Medium Term Rising Demand vs. Rather Stable Tire Capex
15
› Opportunities
› Global replacement tire market expected to grow to
1.4 billion units by 2023
› Mix improvement continues driven by growing SUV
share in the car park, espec. in Europe and China
› Europe to stay the largest replacement tire market
by volume
› Tire Capex seems to be in balance with demand
expectations
› Challenges
› Rising costs of raw materials, if tire demand comes
back in China during 2019
30% 29% 27%
25% 24% 22%12%
14%16%24%
24%24%
4%4%
4%
1,061,23
1,42
2013 2018E 2023E
Europe North America China Rest of Asia Rest of World
1Passenger and light truck replacement tire market in bn units; source: LMC (December 2018)
2Company filings and forecasts (based on public information from 16 tire companies)
0
2.000
4.000
6.000
8.000
10.000
World Market for PC & LT1 Replacement Tires
Tire Capex2 2007 to 2019E (mn €)
Preliminary Figures for Fiscal 2018 and Outlook 2019
January 2019
EDMR – Equity and Debt Market Relations

3) Opportunities and Challenges in the Medium Term ContiTech – Getting Back to Double-Digit Margins
16
› Margin enhancement program implemented
› Improvement totals €150 mn in 2020
› More than 2/3 of the enhancement program to
impact 2020
› Majority of the enhancement will stem from
process improvement
Margin enhancement program
totals €150 mn in 2020
Preliminary Figures for Fiscal 2018 and Outlook 2019
January 2019
EDMR – Equity and Debt Market Relations
Process
improvement
Others
Sales
Supply
Chain

23.6 24.526.6 ~26.8
30
35
40 ~40
2015 2016 2017 2018E
Automotive Group sales Order intake (LTS)
3) Opportunities and Challenges in the Medium TermStrong Order Intake Safeguards Growth…
17
1LTS = Life time sales Preliminary Figures for Fiscal 2018 and Outlook 2019
January 2019
EDMR – Equity and Debt Market Relations
› Order intake in the Automotive Group
increased from €30 bn in 2015 to
~€40 bn in 2018
› Order backlog totals some €90 bn
› Strong order intake well distributed
across the three Automotive divisions
1
Automotive Group: Strong Order Intake (bn €)

3) Opportunities and Challenges in the Medium Term… But Causes Sustained High R&D and Capex
18
Preliminary Figures for Fiscal 2018 and Outlook 2019
January 2019
EDMR – Equity and Debt Market Relations
1,0
36
1,0
16
1,1
26
1,2
75
1,4
97
1,7
90
~2
,00
0
5.3
%
5.1
%
5.4
%
5.4
%
6.1
%
6.7
%
~7
.5%
20
12
20
13
20
14
20
15
20
16
20
17
20
18
E
Capex (mn €) Capex ratio
R&D and capex have a lead time
of about 2-3 years and the
increase is mainly a consequence
of the strong order intake
Automotive Group R&D (mn €) Automotive Group Capex (mn €) 1
,47
5
1,5
89
1,8
36
2,0
97
2,4
31
2,6
76
~2
,80
0
7.6
%
7.9
%
8.8
%
8.9
%
9.9
%
10
.1%
~1
0.5
%
20
12
20
13
20
14
20
15
20
16
20
17
20
18
ER&D expenditure (mn €)R&D as percentage of sales

Europe40%
Americasstable
Asia30%
RoW1%
Europe49%
Americas28%
Asia22%
RoW1%
3) Opportunities and Challenges in the Medium TermToward Regional Sales Balance
19
1Rest of World
1 1
Preliminary Figures for Fiscal 2018 and Outlook 2019
January 2019
EDMR – Equity and Debt Market Relations
Sales by Region 2017 Sales by Region 2023E
Distribution of Global PC & LT Production 2017 Distribution of Global PC & LT Production 2023E
> <
23% 22% 54% 1%2017 23% 21% 55% 1%2023

24
,36
2
23
,02
2
22
,49
8
25
,26
3
24
,30
9
24
,10
1
21
,87
7
24
,37
5
23
,50
0
23
,50
0
22
,60
0
25
,00
0
6%0% 2% 1% 0% 5%
-3% -4% -3% -2%
3% 3%
Q1/1
7
Q2/1
7
Q3/1
7
Q4/1
7
Q1/1
8
Q2/1
8
Q3/1
8E
Q4/1
8E
Q1/1
9E
Q2/1
9E
Q3 1
9E
Q4 1
9E
WW production chg YOY
4) 2019 OutlookPC & LT Production Worldwide by Quarter1
20
Worldwide (mn units)
2017: 95.1 2018E: ~94.6 2019E: ~95
1 Source: IHS until 2017 and own estimates, Europe excluding Kazakhstan and Uzbekistan. Preliminary Figures for Fiscal 2018 and Outlook 2019
January 2019
EDMR – Equity and Debt Market Relations

4) 2019 OutlookMarket Outlook
21
1 Source: IHS until 2017 and own estimates, Europe excluding Kazakhstan and Uzbekistan.
Commercial Vehicle2 Production (k units)
Commercial Vehicle Replacement3 Tire Market (mn units)
PC & LT1 Production (mn units)
PC & LT1 Replacement Tire Market (mn units)
Worldwide production
to stay flat
Worldwide production
to increase by 3%
Worldwide replace-
ment tire market to
increase by 2%
Worldwide replace-
ment market to
increase by 2%
IHS and
own estimates
LMC and
own estimates
IHS and
own estimates
LMC and
own estimates
2018E 2019E Chg.
Europe 21.8 21.8 0%
North America 16.9 16.9 0%
South America 3.5 3.7 +7%
Asia 51.3 51.0 -0%
2018E 2019E Chg.
Europe 687 714 +4%
North America 590 620 +5%
South America 143 157 +10%
Asia 1,969 2,004 +2%
2018E 2019E Chg.
Europe 358 364 +2%
North America 290 290 +2%
South America 68 69 +2%
Asia 453 467 +3%
2018E 2019E Chg.
Europe 25.6 26.0 +2%
North America 25.7 26.4 +3%
South America 15.7 15.7 +0%
Asia 86.5 87.9 +2%
1 Passenger cars and light trucks <6t.2 Medium and heavy vehicles >6t.3 Radial and bias.
Preliminary Figures for Fiscal 2018 and Outlook 2019
January 2019
EDMR – Equity and Debt Market Relations

4) 2019 OutlookContinental Corporation
22
Preliminary Figures for Fiscal 2018 and Outlook 2019
January 2019
EDMR – Equity and Debt Market Relations
2018E 2019E
Consolidated sales
adj. EBIT1 margin
~€44.4 bn
~9.2%
To increase to about €45 bn – €47 bn at constant FX
about 8% – 9% adj. EBIT1 margin
Automotive Group
adj. EBIT1
~€26.8 bn
~€1.85 bnMarch 7, 2019
Rubber Group
adj. EBIT1
~€17.6 bn
~€2.3 bnMarch 7, 2019
Raw materials cost impact ~€100 mn
for the Rubber Group
~€50 mn
for the Rubber Group based on latest assumptions
Special effects ~€90 mn About -€200 mn including carve out effects
Financial result
Tax rate
~€180 mn at constant FX2
~23%
About -€220 mn at constant FX2 including IFRS 16
~27% including carve out effects
Capex
PPA amortization
~€3.1 bn
~€180 mn
~8% of sales including IFRS 16
~€200 mn
Free cash flow before acquisitions ~€1.8 bn excluding net effect of
US pension funding
€1.4 bn to €1.6 bn before carve out effects
1Before amortization of intangibles from PPA, consolidation and special effects.
2Before effects of currency translation and effects from changes in the fair value of derivative instruments, and other valuation effects.

23

24
Disclaimer
› This presentation has been prepared by Continental Aktiengesellschaft solely in connection with the conferences in New York, Detroit and Frankfurt in January 2019. It has not been
independently verified. It does not constitute an offer, invitation or recommendation to purchase or subscribe for any shares or other securities issued by Continental AG or any
subsidiary and neither shall any part of it form the basis of, or be relied upon in connection with, any contract or commitment concerning the purchase or sale of such shares or other
securities whatsoever.
› Neither Continental Aktiengesellschaft nor any of its affiliates, advisors or representatives shall have any liability whatsoever (in negligence or otherwise) for any loss that may arise
from any use of this presentation or its contents or otherwise arising in connection with this presentation.
› This presentation includes assumptions, estimates, forecasts and other forward-looking statements, including statements about our beliefs and expectations regarding future
developments as well as their effect on the results of Continental. These statements are based on plans, estimates and projections as they are currently available to the
management of Continental. Therefore, these statements speak only as of the date they are made, and we undertake no obligation to update publicly any of them in light of new
information or future events. Furthermore, although the management is of the opinion that these statements, and their underlying beliefs and expectations, are realistic as of the date
they are made, no guarantee can be given that the expected developments and effects will actually occur. Many factors may cause the actual development to be materially different
from the expectations expressed here. Such factors include, for example and without limitation, changes in general economic and business conditions, fluctuations in currency
exchange rates or interest rates, the introduction of competing products, the lack of acceptance for new products or services and changes in business strategy.
› All statements with regard to markets or market position(s) of Continental or any of its competitors are estimates of Continental based on data available to Continental. Such data are
neither comprehensive nor independently verified. Consequently, the data used are not adequate for and the statements based on such data are not meant to be an accurate or
proper definition of regional and/or product markets or market shares of Continental and any of the participants in any market.
› Unless otherwise stated, all amounts are shown in millions of euro. Please note that differences may arise as a result of the use of rounded amounts and percentages.
› Note: Due to the application of the modified retrospective approach during first time adoption of IFRS 9, Financial Instruments, and IFRS 15, Revenues from Contracts with
Customers, as at January 1, 2018, all the figures from comparative periods are shown unadjusted.
Preliminary Figures for Fiscal 2018 and Outlook 2019
January 2019
EDMR – Equity and Debt Market Relations

25
ContactEquity and Debt Markets Relations
Vahrenwalder Str. 9
30165 Hanover
Germany
e-mail: [email protected]
Fax: +49 511 938 1080
www.continental-ir.com
Michael Saemann
Analysts, Institutional Investors and
Sustainability Investors
Phone: +49 511 938 1307
e-mail: [email protected]
Marvin Kalberlah
Analysts, Institutional Investors and
Social Media
Phone: +49 511 938 14034
e-mail: [email protected]
Christopher Macke
Analysts and Institutional Investors
Phone: +49 511 938 1062
e-mail: [email protected]
Klaus Paesler
Analysts, Institutional Investors, ADR
and Private Investors
Phone: +49 511 938 1316
e-mail: [email protected]
Sabine Reese
Sustainability, ASM, CMD
Organization, IR Website, Capital
Market Disclosure Requirements
Phone: +49 511 938 1027
e-mail: [email protected]
Bernard Wang
Head of IR
Phone: +49 511 938 1068
e-mail: [email protected]
Jana Cross
Assistant to the Head of IR
Roadshow and Conference Organization
Phone: +49 511 938 1163
e-mail: [email protected]

ContinentalFinancial Calendar
26
2019
Preliminary figures for fiscal 2018 January 14, 2019
Annual Financial Press Conference March 7, 2019
Annual Shareholders’ Meeting (incl. key data for Q1 2019) April 26, 2019
Q1 Financial Report May 9, 2019
Half-Year Financial Report August 5, 2019
Nine-Month Financial Report November 11, 2019
Preliminary Figures for Fiscal 2018 and Outlook 2019
January 2019
EDMR – Equity and Debt Market Relations

ContinentalShare Data/ADR Data
27
Share Data
Type of share No-par value share
Bloomberg Ticker CON
Reuters Ticker CONG
German Security Identification Number (WKN) 543 900
ISIN DE0005439004
Shares outstanding as at December 31, 2018 200,005,983
ADR Data
Ratio 1:10 (ordinary share : ADRs)1
Bloomberg Ticker CTTAY
Reuters Ticker CTTAY.PK
ISIN US2107712000
ADR Level Level 1
Exchange OTC
Sponsor Deutsche Bank Trust Company Americas
1Before October 29, 2018 split was 1:5.
Preliminary Figures for Fiscal 2018 and Outlook 2019
January 2019
EDMR – Equity and Debt Market Relations

ContinentalBond Data
28
Issuer Continental
Rubber of America, Corp.1Continental AG Continental AG
Issue Senior Notes Senior Notes Senior Notes
Principal amount €500 mn €600 mn €750 mn
Offering price 99.739% 99.410% 99.228%
Rating at issuance date BBB (S&P)
BBB (Fitch)
BBB+ (S&P)
BBB+ (Fitch)
Ba1 (Moody’s4)
BB (S&P)
BBB (Fitch2)
Current corporation and
bond ratings3 BBB+ (Fitch), BBB+ (S&P), Baa1 (Moody’s4)
Coupon 0.5% p.a. 0.0% p.a. 3.125% p.a.
Issue date November 19, 2015 December 5, 2016 September 9, 2013
Maturity February 19, 2019 February 5, 2020 September 9, 2020
Interest payment
Annual
February 19,
Commenced February 20, 2017
Not applicableAnnual
September 9
WKN A1Z7C3 A2DARM A1X3B7
ISIN DE000A1Z7C39 XS1529561182 XS0969344083
Denomination €1,000 with minimum tradable amount €1,000
1Guaranteed by Continental AG.
2Non-contracted rating at date of issuance.
3Fitch since October 24, 2016; S&P since May 11, 2016; Moodyʼs since June 30, 2015.
4Non-contracted rating since February 1, 2014.
Preliminary Figures for Fiscal 2018 and Outlook 2019
January 2019
EDMR – Equity and Debt Market Relations

ContinentalContinental’s Credit Rating
29
BBB+ / Baa1
BBB / Baa2
BBB- / Baa3
BB+ / Ba1
BB / Ba2
BB- / Ba3
B+ / B1
B / B2
S&P, Fitch / Moody’s Standard & Poor’s1 Moody’s2
Fitch3
Before
Siemens VDO No
n-I
nv
estm
en
t
Gra
de
Investm
ent
Gra
de
1 Contracted rating since May 19, 2000.2 Non-contracted rating since February 1, 2014.3 Contracted rating since November 7, 2013.
Preliminary Figures for Fiscal 2018 and Outlook 2019
January 2019
EDMR – Equity and Debt Market Relations

ReferencesUseful Links
30
Continental Investor Relations website www.continental-ir.com
Annual and interim reports www.continental-corporation.com/en/investors/reports
2017 Fact Book (Investor presentation) www.continental-corporation.com/en/investors/reports
Investor Relations
events and presentations
www.continental-corporation.com/en/investors/events/presentations
Sustainability at Continental
(presentations for investors)
www.continental-corporation.com/en/sustainability/downloads
Corporate Social Responsibility www.continental-sustainability.com
Corporate Governance Principles www.continental-corporation.com/en/company/corporate-governance/principles-and-declarations
Continental shares www.continental-corporation.com/en/investors/share
Continental bonds and rating www.continental-corporation.com/en/investors/debt-and-rating
Continental IR on Twitter www.twitter.com/Continental_IR
Preliminary Figures for Fiscal 2018 and Outlook 2019
January 2019
EDMR – Equity and Debt Market Relations