preliminary figures for fiscal 2015 and outlook 2016€¦ · market and content growth; 40% of our...
TRANSCRIPT

Preliminary Figures for Fiscal 2015 and Outlook 2016
January 2015
www.continental-ir.com Wolfgang Schaefer – CFO
Ticker: CON ADR-Ticker: CTTAY

Preliminary Figures for Fiscal 2015 and Outlook 2016 January 2016 EDMR – Equity and Debt Markets Relations 2
AGENDA
Corporation Highlights 2015 1 3 2 14 Opportunities and Challenges in 2016 and in the Medium Term 6
3 Outlook 2016 19
5 Back-Up and Fact Sheets 2013 – 9M 2015 29 4 What to Expect from Continental in the Medium Term 21

Preliminary Figures for Fiscal 2015 and Outlook 2016 January 2016 EDMR – Equity and Debt Markets Relations
1) Corporation Highlights 2015 Most Important KPIs
3
FY 2015 › Sales up by 14% to ~€39.2 bn, organic sales growth at 4% › Adj. EBIT1 totaled ~€4.4 bn, adj. EBIT1 margin ~11.7%
› Free cash flow before acquisitions amounted to ~€2.4 bn, leading to a cash conversion2 of >85%
› Net debt below €3.9 bn after partial funding of pension obligation (€350 mn); gearing ratio <30% at YE 2015
Q4 2015 market environment3:
› Automotive Group adj. EBIT1 margin in Q4 2015 stood at 9.1% (OL4 in FY 2015 at 15%)
› Winter tire sales close to record level of prior year; overall tire volumes in Q4 2015 up by 12%; Q4 sales and EBIT in the Tire division therefore comfortably above prior year levels
› Special items recognized in ContiTech amounted to €102 mn in Q4 2015
› Term loan reduced from €1,500 mn to €350 mn in Q4 2015
1 Before amortization of intangibles from PPA, consolidation and special effects 2 Cash flow before financing activities and acquisitions divided by net income attributable to the shareholders of the parent 3 Based on preliminary data available 4 OL = operating leverage
Preliminary Figures for Fiscal 2015 and Outlook 2016 January 2016 EDMR – Equity and Debt Markets Relations
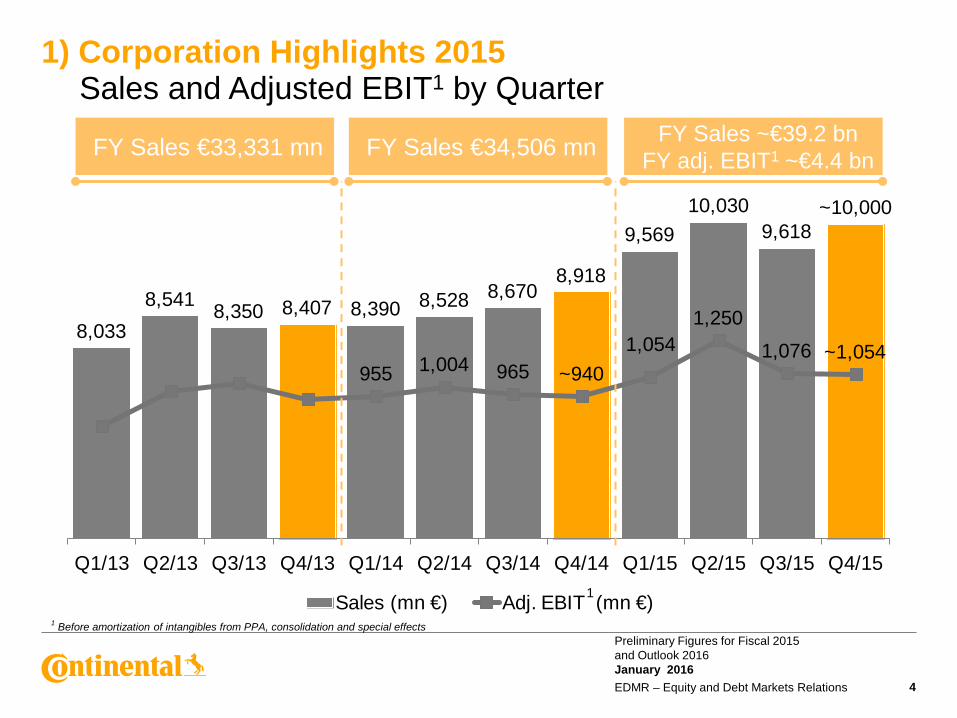
8,0338,541 8,350 8,407 8,390 8,528 8,670
8,918
9,56910,030
9,618~10,000
955 1,004 965 ~9401,054
1,2501,076 ~1,054
Q1/13 Q2/13 Q3/13 Q4/13 Q1/14 Q2/14 Q3/14 Q4/14 Q1/15 Q2/15 Q3/15 Q4/15
Sales (mn €) Adj. EBIT (mn €)
1) Corporation Highlights 2015 Sales and Adjusted EBIT1 by Quarter
4
FY Sales €33,331 mn
1 Before amortization of intangibles from PPA, consolidation and special effects
FY Sales ~€39.2 bn FY adj. EBIT1 ~€4.4 bn
1
FY Sales €34,506 mn
Preliminary Figures for Fiscal 2015 and Outlook 2016 January 2016 EDMR – Equity and Debt Markets Relations
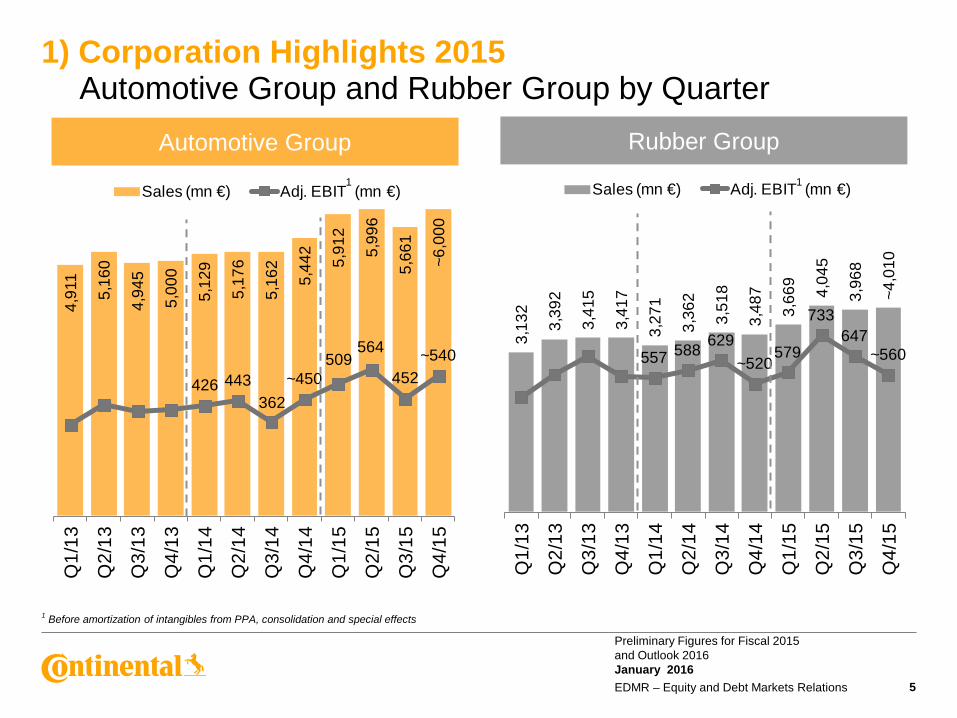
3,13
2
3,39
2
3,41
5
3,41
7
3,27
1
3,36
2
3,51
8
3,48
7
3,66
9
4,04
5
3,96
8
~4,0
10
557 588 629~520
579
733647
~560
Q1/
13
Q2/
13
Q3/
13
Q4/
13
Q1/
14
Q2/
14
Q3/
14
Q4/
14
Q1/
15
Q2/
15
Q3/
15
Q4/
15
Sales (mn €) Adj. EBIT (mn €)
4,91
1
5,16
0
4,94
5
5,00
0
5,12
9
5,17
6
5,16
2
5,44
2
5,91
2
5,99
6
5,66
1
~6,0
00
426 443362
~450509
564
452~540
Q1/
13
Q2/
13
Q3/
13
Q4/
13
Q1/
14
Q2/
14
Q3/
14
Q4/
14
Q1/
15
Q2/
15
Q3/
15
Q4/
15
Sales (mn €) Adj. EBIT (mn €)
1) Corporation Highlights 2015 Automotive Group and Rubber Group by Quarter
5
Automotive Group Rubber Group
1 Before amortization of intangibles from PPA, consolidation and special effects
1 1

Preliminary Figures for Fiscal 2015 and Outlook 2016 January 2016 EDMR – Equity and Debt Markets Relations
2) Opportunities and Challenges 2016 and in the Medium Term
6
› 2016
› Europe further recovering vs. NAFTA at peak? › China GDP growth slowed but stimulus will allow car market to grow at least by a mid
single digit › Russia – from recession to recovery? Brazil – more challenges ahead! › ContiTech: cost reduction in oil-related and restructuring in mining-related businesses,
exploiting synergies, and growing business in other areas! › Diesel, gasoline and electric – will the mix change?
› Medium Term
› Challenges for established business models in the auto industry from three trends: › Digitalization › Electrification › Shared mobility
› Size mix will further benefit from rising SUV share in EU and China

Preliminary Figures for Fiscal 2015 and Outlook 2016 January 2016 EDMR – Equity and Debt Markets Relations
15.8
15.3
15.1
12.6
8.6 11
.9
13.1 15
.4
16.2
17.0
17.5
17.5
2005
2006
2007
2008
2009
2010
2011
2012
2013
2014
2015
E
2016
E
2) Opportunities and Challenges in 2016 European Recovery vs. North America at Peak
1 Passenger car and light truck (<6t); source: IHS and own estimates
› Opportunities
› European production volume is recovering but further growth largely dependent on Italy, Spain and Germany
› Continental’s content per vehicle is highest in Europe compared to other regions
› Challenges
› NAFTA production volume is already 12% above the level preceding the global financial crisis
› We expect some growth in H1 but see H2 2016 challenged by high comparative figures and further interest rate hikes
7
PC & LT1 production (mn units) – NAFTA
20.1
20.5
21.8
20.6
16.3 18
.8
20.0
19.0
19.2
19.9
20.5
21.0
2005
2006
2007
2008
2009
2010
2011
2012
2013
2014
2015
E
2016
E
8.4 8.9 9.8
Average age of the fleet in years
10.1 10.8 11.3
Average age of the fleet in years
PC & LT1 production (mn units) – Europe

Preliminary Figures for Fiscal 2015 and Outlook 2016 January 2016 EDMR – Equity and Debt Markets Relations
› Challenges
› Chinese GDP growth has obviously slowed over the past couple of years
› Further growth increasingly dependent on stimuli but government still has plenty of measures at their disposal
› Opportunities
› China PC & LT production grew by 3% in 2015 thanks to the stimulus initiated in Q41; 2016 could benefit in addition from rural subsidy plans
› China presents Continental with both market and content growth; 40% of our order intake meanwhile with Chinese OEMs
2) Opportunities and Challenges in 2016 China – Decelerated Growth Ahead
1 Cut in purchase tax from 10% to 5% from October 1, 2015, to December 31, 2016, for vehicles with engines <1.6l
2 2015E and 2016E: IMF Oct 2015 Update 3 Passenger and light truck; source: IHS
0
2
4
6
8
10
12
Q1
10Q
2 10
Q3
10Q
4 10
Q1
11Q
2 11
Q3
11Q
4 11
Q1
12Q
2 12
Q3
12Q
4 12
Q1
13Q
2 13
Q3
13Q
4 13
Q1
14Q
2 14
Q3
14Q
4 14
Q1
15Q
2 15
Q3
1520
15E
2016
E
China GDP YOY (NSA)
China – GDP growth YOY2
8
5.2 6.7 8.1 8.612.8
16.8 17.3 18.220.9
22.6 23.2 24.1
8%
23%26%
2005 2006 2007 2008 2009 2010 2011 2012 2013 2014 2015E2016E
Chinese car production (mn units) Share in global car production
China – PC & LT3 production

Preliminary Figures for Fiscal 2015 and Outlook 2016 January 2016 EDMR – Equity and Debt Markets Relations
› Opportunities
› Russia only represented ~0.5% of Continental’s global sales in 2015; oil-related sector with some chance to recover in H2 2016
› South America only represented ~3% of Continental’s global sales in 2015
› Mid-term both markets still offer growth potential as their share in global car production is down from 8% in 2008 to 5% in 2015
› Challenges
› Both countries are forecasted to stay in recession during 2016; risk that IMF forecast is too optimistic, especially for Brazil
2) Opportunities and Challenges in 2016 Russia – from recession to recovery? Brazil – more challenges ahead!
-6-4-202468
10
Q1
10Q
2 10
Q3
10Q
4 10
Q1
11Q
2 11
Q3
11Q
4 11
Q1
12Q
2 12
Q3
12Q
4 12
Q1
13Q
2 13
Q3
13Q
4 13
Q1
14Q
2 14
Q3
14Q
4 14
Q1
15Q
2 15
Q3
1520
15E
2016
E
Brazil GDP YOY
Brazil – GDP growth YOY1
-6-4-202468
10
Q1
10Q
2 10
Q3
10Q
4 10
Q1
11Q
2 11
Q3
11Q
4 11
Q1
12Q
2 12
Q3
12Q
4 12
Q1
13Q
2 13
Q3
13Q
4 13
Q1
14Q
2 14
Q3
14Q
4 14
Q1
15Q
2 15
Q3
1520
15E
2016
E
Russia GDP YOY (NSA)
Russia – GDP growth YOY1
1 2015E and 2016E: IMF Oct 2015 Update
9

Preliminary Figures for Fiscal 2015 and Outlook 2016 January 2016 EDMR – Equity and Debt Markets Relations
0
20
40
60
80
100
2007
2008
2009
2010
2011
2012
2013
2014
2015
E
2016
E
2017
E
Mining Capex
0
500
1,000
1,500
2,000
2,500
0
50
100
150
Jan-
07Ju
l-07
Dec
-07
Jun-
08D
ec-0
8Ju
n-09
Dec
-09
Jun-
10D
ec- 1
0Ju
n-11
Dec
-11
Jun -
12D
ec-1
2Ju
n-13
Dec
-13
Jun-
14D
ec-1
4Ju
n-15
Dec
-15
Oil WTI ($/b) Oil & Gas Rotary Rig Count Data (US; rS)
2) Opportunities and Challenges in 2016 Oil and Mining Related Sectors Impacting ContiTech
Source: Company filings and consensus data for BHP, Rio, Vale, Grupo Mexico, FCX, ABX, GG, NEM, NCM, TCK/B, ANTO, NUE, AA, KGC, AEM, EGO
10
Oil price and rig count data
Mining Capex (mn US$)
› Challenges in 2016
› Oil and mining related exposure amounts to ~25% of ContiTech sales
› Measures implemented in Fluid Technology to align costs
› Restructuring initiated in Conveyor Belt Group to align capacity
› No recovery in mining-related businesses before 2017 expected
› Opportunities in the medium term
› 75% of the business in good shape
› Veyance integration implemented
› Synergies still to be exploited
› Oil-related business with some chance to recover in H2 2016

Preliminary Figures for Fiscal 2015 and Outlook 2016 January 2016 EDMR – Equity and Debt Markets Relations
HEV-related
business
Gasoline-related
business
2) Opportunities and Challenges in 2016 Relative Value of Continental’s Content in Engines1
11
Diesel-related
business
› Engine management systems for diesel piezo common rail injection (Injector, ECUs, pressure pumps)
› Exhaust aftertreatment
› Sensors and actuators
› Engine management systems for solenoid direct injection (injector, ECU, pressure pumps)
› Exhaust aftertreatment
› Sensors and actuators
› Turbochargers
› Engine management systems (gasoline/diesel)
› Exhaust aftertreatment
› Sensors and actuators
› Turbochargers and › 48V solutions or › Plug-in hybrid solutions
Well positioned in all key technologies
FEV-related
business
› High voltage axle drive
› Power electronics
› Battery management systems
› Inverters and DC/DC converters
› Electric water pumps
100%1 160% 160-260% 300%
1 Value of displayed gasoline content per car is indexed at 100%; all other values read relative to the gasoline content

Preliminary Figures for Fiscal 2015 and Outlook 2016 January 2016 EDMR – Equity and Debt Markets Relations
Shared Mobility
Electric Mobility
2) Opportunities and Challenges in the Medium Term Digitalization, Electrification and Shared Mobility
12
Digitalization
Conti’s view/position:
› Market for automated driving1 is forecasted to exceed €25 bn by 2020
› 60% of our Automotive sales in 2015 are derived from sensors, electronics or software products
› Vision Zero accidents achievable
Conti’s view/position:
› FEV2 sales to account for 2% of global car production by 2025
› Costs for battery will predominantly drive demand for FEV2
› Conti so far invested more than €1 bn in electric mobility
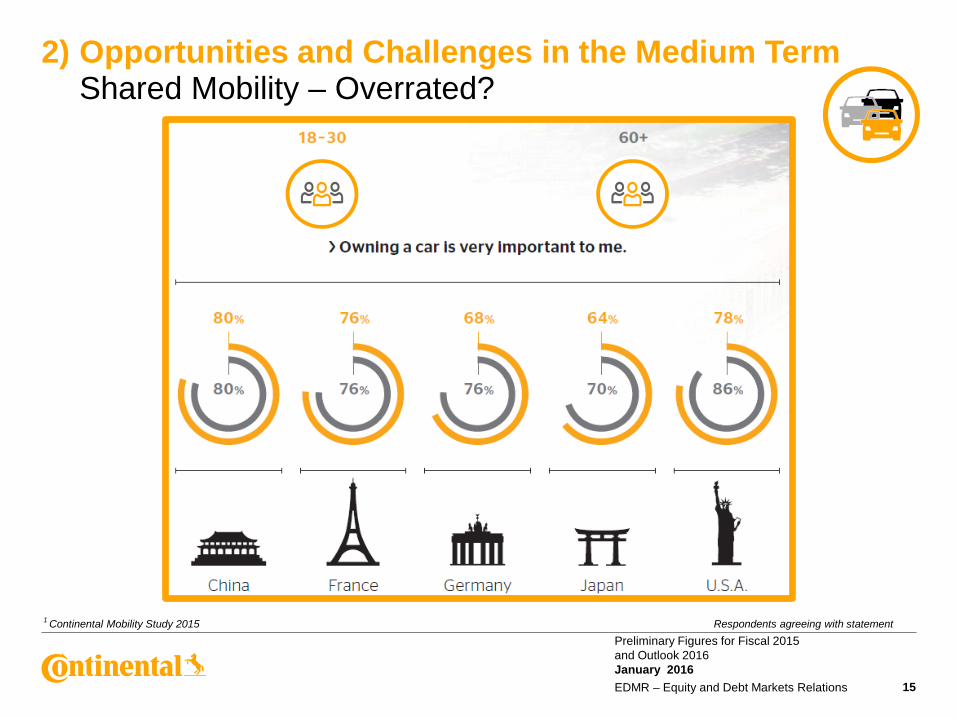
Conti’s view/position:
› VCP3 to decrease but more intense use will lead to a greater VCP3 turn
› Shared mobility therefore should not lead to a decrease in miles travelled individually
› According to our own survey4, the vast majority of people still want to own a car
All medium-term mobility scenarios still foresee tires on vehicles
1 Goldman Sachs Report, Cars 2025: Vol. 3 (Sept 2015) 2 FEV = Full Electric Vehicle 3 VCP = Vehicle Car Park 4 Continental Mobility Study 2015

Preliminary Figures for Fiscal 2015 and Outlook 2016 January 2016 EDMR – Equity and Debt Markets Relations 13
More €9.5 bn spent on R&D in the Automotive Group
Sound foundation to fund future R&D requirements
>12,000 software engineers
System integration capabilities further strengthened by Elektrobit Automotive
acquisition
Active in all relevant areas
One of the broadest product portfolios for sensors,
actuators and electronic control units (ECUs)
2) Opportunities and Challenges in the Medium Term Digitalization
1,2271,3681,4751,5891,836
~2,100
7.7% 7.5% 7.6% 7.9%8.8% 9.0%
2010 2011 2012 2013 2014 2015R&D cost (€ mn) R&D (in % of sales)
E

Preliminary Figures for Fiscal 2015 and Outlook 2016 January 2016 EDMR – Equity and Debt Markets Relations 14
2) Opportunities and Challenges in the Medium Term Electrification
› Crucial points for electric mobility
› Battery reaches a minimum of 500 km
› Lifetime of a battery minimum 200,000 km
› Charging time not longer than a coffee break
› Wireless charging via induction
› Battery cost per kilowatt-hour (kWh) has to decrease from €250-300 to below €100
Electrification volumes for regulated markets1 (mn units)
0
10
20
30
40
50
2015 2020 2025 2030
48V FHV PHEV FEV 1 Europe, NAFTA, China, Japan
Preliminary Figures for Fiscal 2015 and Outlook 2016 January 2016 EDMR – Equity and Debt Markets Relations 15
2) Opportunities and Challenges in the Medium Term Shared Mobility – Overrated?
1 Continental Mobility Study 2015 Respondents agreeing with statement

Preliminary Figures for Fiscal 2015 and Outlook 2016 January 2016 EDMR – Equity and Debt Markets Relations
33% 29% 26%
30% 25% 22%7%13%
19%22%24%
23%
8%
10%
9%
0,91
1,12
1,36
2008 2015 2020EEurope NAFTA China Rest of Asia Rest of World
0
2,000
4,000
6,000
8,000
10,000
2007 2008 2009 2010 2011 2012 2013 2014 2015E
› Opportunities
› Global replacement tire market to grow with a CAGR of 4% from 2015 to 2020E according to LMC
› Europe to stay the largest replacement tire market by volume; CAGR to accelerate to 3% from 2015 to 2020E
› China to keep double digit CAGR from 2015 to 2020E
› Challenges
› Pricing impacted by raw material price trends
› Stalling top line growth increases need for strict cost management
2) Opportunities and Challenges in the Medium Term Tire Capex Peaked in 2013
CAGR 3%
CAGR 4%
World Market for PC & LT1 rep. tires
Tire Capex2 2007 – 2015E (mn €)
1 Passenger and light truck replacement tire market in bn units; source: LMC (December 2015) 2 Company filings and forecasts (based on public information from 14 tire companies)
16

Preliminary Figures for Fiscal 2015 and Outlook 2016 January 2016 EDMR – Equity and Debt Markets Relations
21% 21%32% 34%
2005 2010 2015 2020E
6% 11%28% 32%
2005 2010 2015 2020E
4%12% 22% 28%
2005 2010 2015 2020E
46% 49% 53% 53%
2005 2010 2015 2020E
2) Opportunities and Challenges in the Medium Term Improving Tire Mix due to Rising SUV & Pickup Share
PC & LT1 Production Europe PC & LT1 Production NAFTA
1 Passenger car & light truck (<6t); source: IHS Dec 2015
Share of SUVs and Pickup Trucks
PC & LT1 Production China PC & LT1 Production Worldwide
Share of SUVs and Pickup Trucks Share of SUVs and Pickup Trucks
17
Share of SUVs and Pickup Trucks

Preliminary Figures for Fiscal 2015 and Outlook 2016 January 2016 EDMR – Equity and Debt Markets Relations
110
120
130Ja
n-07
Jul-0
7Ja
n-08
Jul-0
8Ja
n-09
Jul-0
9Ja
n-10
Jul-1
0Ja
n-11
Jul-1
1Ja
n-12
Jul-1
2Ja
n-13
Jul-1
3Ja
n-14
Jul-1
4Ja
n-15
Jul-1
5Ja
n-16
2,900
3,000
3,100
Jan-
07Ju
l-07
Jan-
08Ju
l-08
Jan-
09Ju
l -09
Jan-
10Ju
l-10
Jan-
11Ju
l-11
Jan-
12Ju
l-12
Jan-
13Ju
l-13
Jan-
14Ju
l-14
Jan-
15Ju
l-15
Jan-
16
0
50
100
150
Jan-
07Ju
l-07
Dec
-07
Jun-
08D
ec-0
8Ju
n-09
Dec
-09
Jun -
10D
ec-1
0Ju
n-11
Dec
-11
Jun-
12D
ec-1
2Ju
n-13
Dec
-13
Jun-
14D
ec-1
4Ju
n-15
Dec
-15
Oil price (WTI in $/b)
Miles traveled1 (bn miles in U.S.)
› Opportunities
› Further cost relief in the Rubber Group likely
› Import duties and FX trends positive for US and Europe
› Increased affordability of mobility should up replacement tire demand
› Vehicle and engine mix to benefit further
› Challenges
› Oil-related business under pressure
› Electric mobility likely to suffer
› Tire pricing will be impacted by recent raw material price trends
2) Opportunities and Challenges in the Medium Term Oil Price Decline is Positive for Tire Demand
1 Annual vehicle-distance traveled; source: U.S. Department of Transportation (Oct 2015) 2 Source: U.S. Bureau of Labor Statistics
U.S. Consumer Price Index2 tires (1984 =100)
18

Preliminary Figures for Fiscal 2015 and Outlook 2016 January 2016 EDMR – Equity and Debt Markets Relations
569 595
101
1,575
590 538
98
1,600
Europe NAFTA South America
Asia
2015E 2016E
22.8 22.313.2
88.0
23.5 22.712.7
90.0
Europe NAFTA South America
Asia
2015E 2016E
324277
64
415329
281
62
436
Europe NAFTA South America
Asia
2015E 2016E
20.5 17.5
3.0
46.3
21.0 17.5
2.9
47.2
Europe NAFTA South America
Asia
2015E 2016E
19
3) Outlook 2016 Market Outlook for Major Regions
Commercial Vehicle2 Prod. (k units)
CV Repl.4 Tire Market (mn units)
Source: IHS and own estimates
Source: LMC and own estimates
0%
Source: IHS and own estimates
PC & LT1 Production (mn units)
Source: LMC and own estimates
PC & LT Repl.3 Tire Market (mn units)
1 Passenger car and light truck <6t 2 Heavy vehicles >6t 3 Passenger car & light truck replacement 4 Commercial vehicle replacement (radial and biased)

Preliminary Figures for Fiscal 2015 and Outlook 2016 January 2016 EDMR – Equity and Debt Markets Relations
3) Outlook 2016 Continental Corporation
1 Before amortization of intangibles from PPA, consolidation (2015 in comparison to 2014) and special effects
Consolidated sales adj. EBIT1 margin
~€39.2 bn ~11.7%
Automotive Group adj. EBIT1
~€23.6 bn ~€2.06 bn
Rubber Group adj. EBIT1
~€15.7 bn ~€2.52 bn
Raw material cost impact
Relief of about ~€250 mn
2015E
Special effects ~-€120 mn
Net interest result Tax rate
<-€300 mn ~28%
Capex PPA
<€2.2 bn ~€140 mn
Free cash flow before acquisitions ~€2.4 bn
To increase to ~€41 bn Comfortably achieve >10.5%
March 3, 2016
March 3, 2016
Raw materials to positively affect Rubber Group results in Q1 2016 by about €30 mn
2016E
About -€100 mn
<-€250 mn ~30%
Capex at around 6% of sales PPA amortization: ~€150 mn
At least €1.8 bn
20

Preliminary Figures for Fiscal 2015 and Outlook 2016 January 2016 EDMR – Equity and Debt Markets Relations
› Rubber Group
› Rational action › Use of growth opportunities by globalizing business further › Growth of absolute EBIT
4) What to Expect from Continental in the Medium Term Value Creation via Growth
21
› Corporation › Cash in focus; continued high level of cash conversion › Strengthened balance sheet in face of a volatile economic environment › Opportunities taken when additions to the portfolio promise
additional value creation
› Automotive Group › Growth in electronics, sensors and software business › Further investment in electric mobility, lever Powertrain portfolio › Continued leading position in digitalization trends › Further explore and exploit partnerships to shape future connectivity trends

Preliminary Figures for Fiscal 2015 and Outlook 2016 January 2016 EDMR – Equity and Debt Markets Relations
11,408
24,239
34,506
>50,000
11%
-2%
20% >20%
2002 2008 2014 2020
Sales (mn €) ROCE (in %)
22
4) What to Expect from Continental in the Medium Term More than €50 bn in Sales and >20% ROCE by 2020
1Passenger cars and light trucks

Preliminary Figures for Fiscal 2015 and Outlook 2016 January 2016 EDMR – Equity and Debt Markets Relations
Thank you!
Official Sponsor of the UEFA European Football Championship™
23
Preliminary Figures for Fiscal 2015 and Outlook 2016 January 2016 EDMR – Equity and Debt Markets Relations 24
Disclaimer
› This presentation has been prepared by Continental Aktiengesellschaft solely in connection with the Commerzbank conference (18th German Investment Seminar) on January 11-12, 2016, in New York. It has not been independently verified. It does not constitute an offer, invitation or recommendation to purchase or subscribe for any shares or other securities issued by Continental AG or any subsidiary and neither shall any part of it form the basis of, or be relied upon in connection with, any contract or commitment concerning the purchase or sale of such shares or other securities whatsoever.
› Neither Continental Aktiengesellschaft nor any of its affiliates, advisors or representatives shall have any liability whatsoever (in negligence or otherwise) for any loss that may arise from any use of this presentation or its contents or otherwise arising in connection with this presentation.
› This presentation includes assumptions, estimates, forecasts and other forward-looking statements, including statements about our beliefs and expectations regarding future developments as well as their effect on the results of Continental. These statements are based on plans, estimates and projections as they are currently available to the management of Continental. Therefore, these statements speak only as of the date they are made, and we undertake no obligation to update publicly any of them in light of new information or future events. Furthermore, although the management is of the opinion that these statements, and their underlying beliefs and expectations, are realistic or of the date they are made, no guarantee can be given that the expected developments and effects will actually occur. Many factors may cause the actual development to be materially different from the expectations expressed here. Such factors include, for example and without limitation, changes in general economic and business conditions, fluctuations in currency exchange rates or interest rates, the introduction of competing products, the lack of acceptance for new products or services and changes in business strategy.
› All statements with regard to markets or market position(s) of Continental or any of its competitors are estimates of Continental based on data available to Continental. Such data are neither comprehensive nor independently verified. Consequently, the data used are not adequate for and the statements based on such data are not meant to be, an accurate or proper definition of regional and/or product markets or market shares of Continental and any of the participants in any market.
› Unless otherwise stated, all amounts are shown in millions of euro. Please note that differences may arise as a result of the use of rounded amounts and percentages.

Preliminary Figures for Fiscal 2015 and Outlook 2016 January 2016 EDMR – Equity and Debt Markets Relations 25
Contact Equity and Debt Markets Relations
Vahrenwalder Str. 9 30165 Hanover Germany e-mail: [email protected] www.continental-ir.com Rolf Woller Head of IR Phone: +49 511 938 1068 e-mail: [email protected] Ingrid Kampf Assistant to the Head of IR Roadshow and Conference Organization Phone: +49 511 938 1163 Fax: +49 511 938 1080 e-mail: [email protected]
Michael Saemann Analysts, Institutional Investors and Sustainability Investors Phone: +49 511 938 1307 e-mail: [email protected] Klaus Paesler Analysts, Institutional Investors, ADR and Private Investors Phone: +49 511 938 1316 e-mail: [email protected] Sabine Reese Sustainability, ASM, CMD Organization, IR Webpage, Capital Market Disclosure Requirements Phone: +49 511 938 1027 e-mail: [email protected] Henry Schniewind Analysts, Institutional Investors Phone: +49 511 938 1062 e-mail: [email protected] Marvin Kalberlah Social Media Phone: +49 511 938 14034 e-mail: [email protected]

Preliminary Figures for Fiscal 2015 and Outlook 2016 January 2016 EDMR – Equity and Debt Markets Relations 26
Continental Financial Calendar 2015 Annual Financial Press Conference March 5, 2015
Annual Shareholders’ Meeting (incl. key data for Q1 2015) April 30, 2015
Q1 Financial Report May 7, 2015
Half Year Financial Report August 4, 2015
Nine Month Financial Report November 9, 2015
2016 Preliminary figures for the fiscal year 2015 January 11, 2016
Annual Financial Press Conference March 3, 2016
Annual Shareholders’ Meeting (incl. key data for Q1 2016) April 29, 2016
Q1 Financial Report May 4, 2016
Half Year Financial Report August 3, 2016
Nine Month Financial Report November 10, 2016

Preliminary Figures for Fiscal 2015 and Outlook 2016 January 2016 EDMR – Equity and Debt Markets Relations 27
Continental Share Data / ADR Data Share Data Type of share No-par value share
Bloomberg Ticker CON
Reuters Ticker CONG
German Security Identification Number (WKN) 543 900
ISIN Number DE0005439004
Shares outstanding as at December 31, 2015 200,005,983
ADR Data Ratio (ordinary share: ADR) 1:5
Bloomberg Ticker CTTAY
Reuters Ticker CTTAY.PK
ISIN Number US2107712000
ADR Level Level 1
Exchange OTC
Sponsor Deutsche Bank Trust Company Americas

Preliminary Figures for Fiscal 2015 and Outlook 2016 January 2016 EDMR – Equity and Debt Markets Relations 28
Continental Bond Data
Issuer Conti-Gummi Finance B.V., Netherlands1 Continental AG Continental AG Continental Rubber of
America, Corp.1
Issue Senior Notes Senior Notes Senior Notes Senior Notes
Principal amount €750 mn €750 mn €750 mn €500 mn
Offering price 99.595% 98.950% 99.228% 99.739%
Rating at issuance date Ba1 (Moody’s4) BB (S&P) BBB (Fitch2)
Ba2 (Moody’s4) BB (S&P) BB (Fitch2)
Ba1 (Moody’s4) BB (S&P) BBB (Fitch2)
BBB (S&P) BBB (Fitch2)
Current corporation and bond ratings3 BBB (Fitch), BBB (S&P), Baa1 (Moody’s4)
Coupon 2.5% p.a. 3.0% p.a. 3.125% p.a. 0.5% p.a.
Issue date Sept. 19, 2013 Jul. 16, 2013 Sept. 9, 2013 Nov. 19, 2015
Maturity Mar. 20, 2017 Jul. 16, 2018 Sept. 9, 2020 Feb. 19, 2019
Start of period for early redemption (60-90 days’ prior notice)
--- --- --- ---
Interest payment Annual Mar. 20
Semi annual Jan. 16/Jul. 16
Annual Sept. 9
Annual Feb. 19, commencing on Feb. 20, 2017
WKN A1VC6B A1X24V A1X3B7 A1Z7C3
ISIN XS0972719412 XS0953199634 XS0969344083 DE000A1Z7C39
Denomination €1,000 with min. tradable amount €1,000
€1,000 with min. tradable amount €1,000
€1,000 with min. tradable amount €1,000
€1,000 with min. tradable amount €1,000
1 Guaranteed by Continental AG only since April 24, 2014 2 Non-contracted rating at date of issuance 3 Fitch since Jul. 15, 2013; S&P since Dec. 6, 2013; Moodyʼs since June 30, 2015 4 Non-contracted rating since Feb. 1, 2014

Preliminary Figures for Fiscal 2015 and Outlook 2016 January 2016 EDMR – Equity and Debt Markets Relations
Back-up
29

Preliminary Figures for Fiscal 2015 and Outlook 2016 January 2016 EDMR – Equity and Debt Markets Relations
(mn €)1 2010 2011 2012 2013 2014 LTM Q3 2015Cash flow statement Adjusted EBITDA2 3,662 4,247 4,822 5,094 5,318 5,897Reported EBITDA 3,588 4,228 4,967 5,095 5,134 5,853Net cash interest paid -703 -662 -575 -534 -158 -168Tax paid -493 -466 -684 -805 -775 -994Change in net working capital3 -497 -556 564 -4 -207 132Other4 -46 -256 -488 -30 175 -134Cash flow arising from operating activities 1,849 2,289 3,785 3,722 4,168 4,689Cash flow arising from investing activities -1,282 -1,798 -2,132 -1,904 -2,153 -3,299 - thereof capex in PPE and intangibles -1,324 -1,813 -2,081 -2,024 -2,110 -2,129Cash flow before financing activities 567 491 1,653 1,818 2,015 1,390Balance sheetCash and cash equivalents 1,471 1,541 2,397 2,045 3,244 1,849Derivative instruments and interest-bearing investments 202 249 536 303 364 376Total indebtedness 8,991 8,562 8,253 6,638 6,432 6,521Net indebtedness 7,317 6,772 5,320 4,289 2,824 4,296Credit ratiosNet indebtedness / adj. EBITDA2 2.0x 1.6x 1.1x 0.8x 0.5x 0.7xNet cash interest paid coverage (Ratio)5 5.2x 6.4x 8.4x 9.5x 33.7x 35.1x
30
5) Back-up Key Historical Credit Metrics – IAS 19 (rev. 2011) applied6
1 Amounts shown may contain rounding differences 2 Adjusted EBITDA starting 2010 as defined in syndicated loan but IAS 19 (rev. 2011) not applied in 2012 3 Includes changes in inventories, trade accounts receivable, trade accounts payable and discounted notes 4 Includes dividends received, income from at-equity accounted investees and other investments, including impairments, gains and losses from disposals, other non-cash items as well as changes in pension and similar obligations, and in other assets and liabilities
5 Adj. EBITDA to net cash interest paid 6 Since 2012

Preliminary Figures for Fiscal 2015 and Outlook 2016 January 2016 EDMR – Equity and Debt Markets Relations 31
Fact Sheets 2013 – 9M 2015

Preliminary Figures for Fiscal 2015 and Outlook 2016 January 2016 EDMR – Equity and Debt Markets Relations 32
5) Fact Sheets Quarterly Sales Analysis
Sales (mn €)Q1 Q2 Q3 Q4 FY Q1 Q2 Q3 Q4 FY Q1 Q2 Q3 Q4 FY
C&S 1,792.9 1,860.8 1,800.1 1,815.4 7,269.2 1,878.2 1,868.5 1,823.4 1,944.8 7,514.9 2,136.0 2,142.1 1,999.0Powertrain 1,526.1 1,606.5 1,561.3 1,566.4 6,260.3 1,579.1 1,598.4 1,638.9 1,677.9 6,494.3 1,826.5 1,819.8 1,657.4Interior 1,620.1 1,723.3 1,612.5 1,649.8 6,605.7 1,699.1 1,733.9 1,725.4 1,844.1 7,002.5 1,975.2 2,057.0 2,028.2Tires 2,222.2 2,419.0 2,478.2 2,463.8 9,583.2 2,318.3 2,405.9 2,557.8 2,502.4 9,784.4 2,419.8 2,644.4 2,654.4ContiTech 941.6 998.7 961.9 976.1 3,878.3 973.4 978.6 979.6 999.6 3,931.2 1,268.3 1,418.8 1,330.8Other / Consolidation -69.6 -67.3 -64.4 -64.4 -265.7 -58.0 -57.3 -55.6 -50.7 -221.6 -56.9 -52.4 -52.2Continental Corporation 8,033.3 8,541.0 8,349.6 8,407.1 33,331.0 8,390.1 8,528.0 8,669.5 8,918.1 34,505.7 9,568.9 10,029.7 9,617.6
Changes Y-o-Y in %Q1 Q2 Q3 Q4 FY Q1 Q2 Q3 Q4 FY
C&S 4.8 0.4 1.3 7.1 3.4 13.7 14.6 9.6Powertrain 3.5 -0.5 5.0 7.1 3.7 15.7 13.9 1.1Interior 4.9 0.6 7.0 11.8 6.0 16.2 18.6 17.5Tires 4.3 -0.5 3.2 1.6 2.1 4.4 9.9 3.8ContiTech 3.4 -2.0 1.8 2.4 1.4 30.3 45.0 35.9Continental Corporation 4.4 -0.2 3.8 6.1 3.5 14.0 17.6 10.9
2015
2015
2013 2014
2014

Preliminary Figures for Fiscal 2015 and Outlook 2016 January 2016 EDMR – Equity and Debt Markets Relations 33
5) Fact Sheets Quarterly EBITDA Analysis
EBITDA (mn €)Q1 Q2 Q3 Q4 FY Q1 Q2 Q3 Q4 FY Q1 Q2 Q3 Q4 FY
C&S 241.8 250.3 245.8 252.3 990.2 254.0 242.0 262.0 260.1 1,018.1 297.3 293.4 268.3Powertrain 158.9 168.5 160.7 162.1 650.2 157.0 125.3 -11.9 172.9 443.3 177.2 183.5 167.3Interior 202.1 220.1 214.5 213.5 850.2 223.2 244.5 229.7 248.9 946.3 252.9 299.8 252.4Tires 459.2 533.2 590.9 554.4 2,137.7 545.4 591.9 603.5 540.0 2,280.8 579.7 734.6 667.7ContiTech 135.9 157.5 139.7 143.2 576.3 143.7 132.9 144.7 130.5 551.8 129.2 169.1 159.7Other / Consolidation -28.5 -19.7 -29.1 -32.3 -109.6 -27.5 -26.6 -24.7 -27.7 -106.5 -33.1 -47.1 -23.7Continental Corporation 1,169.4 1,309.9 1,322.5 1,293.2 5,095.0 1,295.8 1,310.0 1,203.3 1,324.7 5,133.8 1,403.2 1,633.3 1,491.7
EBITDA margin in %Q1 Q2 Q3 Q4 FY Q1 Q2 Q3 Q4 FY Q1 Q2 Q3 Q4 FY
C&S 13.5 13.5 13.7 13.9 13.6 13.5 13.0 14.4 13.4 13.5 13.9 13.7 13.4Powertrain 10.4 10.5 10.3 10.3 10.4 9.9 7.8 -0.7 10.3 6.8 9.7 10.1 10.1Interior 12.5 12.8 13.3 12.9 12.9 13.1 14.1 13.3 13.5 13.5 12.8 14.6 12.4Tires 20.7 22.0 23.8 22.5 22.3 23.5 24.6 23.6 21.6 23.3 24.0 27.8 25.2ContiTech 14.4 15.8 14.5 14.7 14.9 14.8 13.6 14.8 13.1 14.0 10.2 11.9 12.0Continental Corporation 14.6 15.3 15.8 15.4 15.3 15.4 15.4 13.9 14.9 14.9 14.7 16.3 15.5
Changes Y-o-Y in %Q1 Q2 Q3 Q4 FY Q1 Q2 Q3 Q4 FY
C&S 5.0 -3.3 6.6 3.1 2.8 17.0 21.2 2.4Powertrain -1.2 -25.6 -107.4 6.7 -31.8 12.9 46.4 1,505.9Interior 10.4 11.1 7.1 16.6 11.3 13.3 22.6 9.9Tires 18.8 11.0 2.1 -2.6 6.7 6.3 24.1 10.6ContiTech 5.7 -15.6 3.6 -8.9 -4.3 -10.1 27.2 10.4Continental Corporation 10.8 0.0 -9.0 2.4 0.8 8.3 24.7 24.0
2015
2015
20152014
2013 2014
2013 2014

Preliminary Figures for Fiscal 2015 and Outlook 2016 January 2016 EDMR – Equity and Debt Markets Relations 34
5) Fact Sheets Quarterly EBIT Analysis
EBIT (mn €)Q1 Q2 Q3 Q4 FY Q1 Q2 Q3 Q4 FY Q1 Q2 Q3 Q4 FY
C&S 155.3 162.7 155.1 125.8 598.9 172.3 159.3 179.5 169.1 680.2 214.9 209.3 181.5Powertrain 52.1 58.3 49.5 19.6 179.5 64.5 32.9 -263.3 69.1 -96.8 96.7 101.0 81.3Interior 95.7 112.5 104.4 68.0 380.6 137.8 154.7 144.8 168.6 605.9 190.9 234.1 178.7Tires 365.2 440.3 494.6 452.6 1,752.7 440.7 482.4 486.8 419.5 1,829.4 454.0 604.1 536.5ContiTech 107.7 129.2 111.8 113.4 462.1 115.5 104.3 115.1 98.4 433.3 54.9 82.3 80.6Other / Consolidation -28.6 -19.8 -29.1 -32.6 -110.1 -27.6 -26.7 -25.1 -27.8 -107.2 -33.5 -47.5 -24.0Continental Corporation 747.4 883.2 886.3 746.8 3,263.7 903.2 906.9 637.8 896.9 3,344.8 977.9 1,183.3 1,034.6
EBIT margin in %Q1 Q2 Q3 Q4 FY Q1 Q2 Q3 Q4 FY Q1 Q2 Q3 Q4 FY
C&S 8.7 8.7 8.6 6.9 8.2 9.2 8.5 9.8 8.7 9.1 10.1 9.8 9.1Powertrain 3.4 3.6 3.2 1.3 2.9 4.1 2.1 -16.1 4.1 -1.5 5.3 5.6 4.9Interior 5.9 6.5 6.5 4.1 5.8 8.1 8.9 8.4 9.1 8.7 9.7 11.4 8.8Tires 16.4 18.2 20.0 18.4 18.3 19.0 20.1 19.0 16.8 18.7 18.8 22.8 20.2ContiTech 11.4 12.9 11.6 11.6 11.9 11.9 10.7 11.7 9.8 11.0 4.3 5.8 6.1Continental Corporation 9.3 10.3 10.6 8.9 9.8 10.8 10.6 7.4 10.1 9.7 10.2 11.8 10.8
Changes Y-o-Y in %Q1 Q2 Q3 Q4 FY Q1 Q2 Q3 Q4 FY
C&S 10.9 -2.1 15.7 34.4 13.6 24.7 31.4 1.1Powertrain 23.8 -43.6 -631.9 252.6 -153.9 49.9 207.0 130.9Interior 44.0 37.5 38.7 147.9 59.2 38.5 51.3 23.4Tires 20.7 9.6 -1.6 -7.3 4.4 3.0 25.2 10.2ContiTech 7.2 -19.3 3.0 -13.2 -6.2 -52.5 -21.1 -30.0Continental Corporation 20.8 2.7 -28.0 20.1 2.5 8.3 30.5 62.2
2015
2015
20152014
2013 2014
2013 2014

Preliminary Figures for Fiscal 2015 and Outlook 2016 January 2016 EDMR – Equity and Debt Markets Relations 35
5) Fact Sheets Quarterly Analysis of Adjusted EBIT1
1 Before amortization of intangibles from PPA, changes in the scope of consolidation and special effects
Adjusted EBIT1 (mn €)Q1 Q2 Q3 Q4 FY Q1 Q2 Q3 Q4 FY
C&S 179.1 166.6 186.4 215.2 209.4 182.0Powertrain 83.7 85.5 7.2 102.2 120.3 86.7Interior 162.7 190.9 168.0 191.3 234.5 183.7Tires 441.0 483.2 511.5 459.2 612.6 541.3ContiTech 115.8 104.5 117.4 119.5 120.9 105.9Other / Consolidation -27.6 -26.7 -25.1 -33.5 -47.5 -24.0Continental Corporation 954.7 1,004.0 965.4 1,053.9 1,250.2 1,075.6
Adjusted EBIT1 margin in %Q1 Q2 Q3 Q4 FY Q1 Q2 Q3 Q4 FY
C&S 9.5 8.9 10.2 10.1 9.8 9.1Powertrain 5.3 5.3 0.4 5.8 6.8 5.2Interior 9.6 11.0 9.7 9.7 11.4 9.2Tires 19.1 20.1 20.0 19.2 23.4 20.4ContiTech 11.9 10.7 12.0 11.6 11.3 10.3Continental Corporation 11.4 11.8 11.1 11.4 13.0 11.6
Changes Y-o-Y in %Q1 Q2 Q3 Q4 FY
C&S 20.2 25.7 -2.4Powertrain 22.1 40.7 1,104.2Interior 17.6 22.8 9.3Tires 4.1 26.8 5.8ContiTech 3.2 15.7 -9.8Continental Corporation 10.4 24.5 11.4
2014
2014
2015
2015
2015

Preliminary Figures for Fiscal 2015 and Outlook 2016 January 2016 EDMR – Equity and Debt Markets Relations 36
5) Fact Sheets Consolidated Statement of Income
Sales 24,923.9 25,587.6 29,216.2 8,349.6 8,669.5 9,617.6Cost of sales -19,083.9 -19,138.7 -21,608.2 -6,307.8 -6,443.8 -7,107.0
Gross margin on sales 5,840.0 6,448.9 7,608.0 2,041.8 2,225.7 2,510.6Research and development expenses -1,474.4 -1,627.6 -1,897.7 -487.4 -553.8 -623.4Selling and logistics expenses -1,219.9 -1,327.7 -1,612.3 -401.2 -454.3 -537.6Administrative expenses -524.4 -581.1 -695.4 -172.3 -199.9 -236.1Other income and expenses -128.1 -375.5 -247.7 -103.4 -308.2 -91.6Income from at-equity accounted investees 23.8 -89.7 40.5 9.0 -72.0 12.7Other income from investments -0.1 0.6 0.4 -0.2 0.3 0.0
Earnings before interest and taxes 2,516.9 2,447.9 3,195.8 886.3 637.8 1,034.6Interest income 58.3 68.3 69.3 16.8 22.0 20.0Interest expense -688.8 -283.9 -286.7 -286.9 -97.1 -138.4
Net interest expense -630.5 -215.6 -217.4 -270.1 -75.1 -118.4Earnings before taxes 1,886.4 2,232.3 2,978.4 616.2 562.7 916.2Income tax expense -237.8 -371.3 -839.9 -154.0 -47.4 -268.7
Net income 1,648.6 1,861.0 2,138.5 462.2 515.3 647.5Non-controlling interests -72.6 -62.1 -54.2 -28.1 -20.2 -11.8
Net income attributable to the shareholders of the parent 1,576.0 1,798.9 2,084.3 434.1 495.1 635.7
Basic earnings per share in EUR 7.88 8.99 10.42 2.17 2.47 3.18Diluted earnings per share in EUR 7.88 8.99 10.42 2.17 2.47 3.18
Q3 2013 Q3 2014 Q3 2015(mn €) 1-9 20151-9 20141-9 2013

Preliminary Figures for Fiscal 2015 and Outlook 2016 January 2016 EDMR – Equity and Debt Markets Relations 37
5) Fact Sheets Consolidated Statement of Financial Position – Total Assets
Assets in € millions Sept. 30, 2015 Dec. 31, 2014 Sept. 30, 2014
Goodwill 6,569.8 5,769.1 5,742.2
Other intangible assets 1,348.9 443.3 455.2
Property, plant and equipment 9,074.0 8,446.4 8,159.8
Investment property 17.0 17.5 17.9
Investments in at-equity accounted investees 343.7 298.5 302.3
Other investments 14.3 10.7 10.8
Deferred tax assets 1,571.4 1,573.4 1,468.7
Defined benefit assets 3.3 1.6 8.6Long-term derivative instruments and interest-bearing investments
335.2 301.2 269.5
Other long-term financial assets 44.5 41.9 34.2
Other long-term assets 22.6 19.7 21.4
Non-current assets 19,344.7 16,923.3 16,490.6
Inventories 3,631.7 2,987.6 3,330.3
Trade accounts receivable 7,082.6 5,846.2 6,569.3
Other short-term financial assets 487.8 382.5 382.9
Other short-term assets 945.4 731.3 731.6
Income tax receivables 107.6 60.3 92.8Short-term derivative instruments and interest-bearing investments
40.8 63.1 54.9
Cash and cash equivalents 1,849.0 3,243.8 2,013.2
Assets held for sale 15.6 3.0 2.6Current assets 14,160.5 13,317.8 13,177.6
Total assets 33,505.2 30,241.1 29,668.2

Preliminary Figures for Fiscal 2015 and Outlook 2016 January 2016 EDMR – Equity and Debt Markets Relations 38
5) Fact Sheets Consolidated Statement of Financial Position – Total Equity and Liabilities
Equity and liabilities in € millions Sept. 30, 2015 Dec. 31, 2014 Sept. 30, 2014
Subscribed capital 512.0 512.0 512.0
Capital reserves 4,155.6 4,155.6 4,155.6
Retained earnings 8,838.6 7,404.3 6,828.9
Other comprehensive income -1,283.8 -1,399.8 -1,007.9
Equity attributable to the shareholders of the parent 12,222.4 10,672.1 10,488.6
Non-controlling interests 450.9 352.5 364.1
Total equity 12,673.3 11,024.6 10,852.7
Provisions for pension liabilities and similar obligations 3,570.6 3,483.7 2,937.3
Deferred tax liabilities 336.6 178.5 188.9
Long-term provisions for other risks and obligations 325.9 306.3 314.1
Long-term portion of indebtedness 2,689.5 5,077.4 5,040.8
Other long-term financial liabilities 73.0 48.7 51.9
Other long-term liabilities 55.5 46.4 47.5
Non-current liabilities 7,051.1 9,141.0 8,580.5
Trade accounts payable 5,383.3 4,861.6 4,882.0
Income tax payables 702.8 577.3 667.5
Short-term provisions for other risks and obligations 753.6 732.7 687.4
Indebtedness 3,831.7 1,354.2 1,223.0
Other short-term financial liabilities 1,863.9 1,649.2 1,627.5
Other short-term liabilities 1,241.3 900.2 1,147.5
Liabilities held for sale 4.2 0.3 0.1Current liabilities 13,780.8 10,075.5 10,235.0
Total equity and liabilities 33,505.2 30,241.1 29,668.2

Preliminary Figures for Fiscal 2015 and Outlook 2016 January 2016 EDMR – Equity and Debt Markets Relations 39
5) Fact Sheets Consolidated Statement of Cash Flows
in € millions 2015 2014 2015 2014Net income 2,138.5 1,861.0 647.5 515.3Income tax expense 839.9 371.3 268.7 47.4Net interest expense 217.4 215.6 118.4 75.1EBIT 3,195.8 2,447.9 1,034.6 637.8Interest paid -182.6 -170.1 -92.0 -72.7Interest received 21.7 19.6 5.6 7.0Income tax paid -761.3 -542.2 -192.9 -190.2Dividends received 28.4 16.4 0.6 0.3Depreciation, amortization, impairment and reversal of impairment losses 1,332.4 1,361.2 457.1 565.5Income from at-equity accounted and other investments, incl. impairment and reversal of impairment losses
-40.9 87.9 -12.7 70.5
Gains from the disposal of assets, companies and business operations -14.2 -9.7 -2.1 -6.3Changes in
inventories -361.2 -352.4 -98.2 -58.1trade accounts receivable -861.7 -975.4 -147.9 -397.4trade accounts payable 322.8 88.1 -71.2 1.1pension and similar obligations 42.7 6.1 12.4 1.8other assets and liabilities 148.5 372.1 263.3 346.7
Cash flow arising from operating activities 2,870.4 2,349.5 1,156.6 906.0Cash flow from the disposal of property, plant and equipment, and intangible assets
23.2 68.6 3.3 42.6
Capital expenditure on property, plant and equipment, and software -1,311.7 -1,305.6 -495.9 -511.7Capital expenditure on intangible assets from development projects and miscellaneous
-61.7 -49.1 -27.7 -15.7
Cash flow from the disposal of companies and business operations 15.3 -1.0 17.0 -1.2Acquisition of companies and business operations -1,219.6 -121.4 -619.4 -53.8Cash flow arising from investing activities -2,554.5 -1,408.5 -1,122.7 -539.8
Cash flow before financing activities (free cash flow) 315.9 941.0 33.9 366.2Change in indebtedness -1,043.2 -524.6 -460.6 -339.2Successive purchases -11.1 — — —Dividends paid -650.0 -500.0 — —Dividends paid to and cash changes from equity transactions with non-controlling interests
-39.4 -28.0 1.5 -1.5
Cash and cash equivalents arising from first consolidation of subsidiaries — 0.4 — 0.2Cash flow arising from financing activities -1,743.7 -1,052.2 -459.1 -340.5
Change in cash and cash equivalents -1,427.8 -111.2 -425.2 25.7Cash and cash equivalents at the beginning of the reporting period 3,243.8 2,044.8 2,349.7 1,919.4Effect of exchange rate changes on cash and cash equivalents 33.0 79.6 -75.5 68.1Cash and cash equivalents at the end of the reporting period 1,849.0 2,013.2 1,849.0 2,013.2
January 1 to September 30 Third Quarter

Preliminary Figures for Fiscal 2015 and Outlook 2016 January 2016 EDMR – Equity and Debt Markets Relations 40
5) Fact Sheets 9M 2015 Results Reported and Adjusted (mn €) – by Division
1 Before amortization of intangibles from PPA, changes in the scope of consolidation and special effects
2014 2015 2014 2015 2014 2015 2014 2015 2014 2015 2014 2015 2014 2015
Sales 5,570.1 6,277.1 4,816.4 5,303.7 5,158.4 6,060.4 7,282.0 7,718.6 2,931.6 4,017.9 -170.9 -161.5 25,587.6 29,216.2
EBIT 511.1 605.7 -165.9 279.0 437.3 603.7 1,409.9 1,594.6 334.9 217.8 -79.4 -105.0 2,447.9 3,195.8in % of sales 9.2% 9.6% -3.4% 5.3% 8.5% 10.0% 19.4% 20.7% 11.4% 5.4% 9.6% 10.9%
Amortization of intangible assets from PPA 21.0 0.6 51.3 6.2 74.9 9.1 3.7 5.8 4.5 82.0 0.0 0.0 155.4 103.7
Total special effects 0.0 0.3 283.4 0.1 9.4 0.0 23.1 2.6 -1.7 12.6 0.0 0.0 314.2 15.6
Total consolidation effects 0.0 0.0 7.6 23.9 0.0 -3.3 -1.0 10.1 0.0 33.9 0.0 0.0 6.6 64.6
Total consolidation & special effects 0.0 0.3 291.0 24.0 9.4 -3.3 22.1 12.7 -1.7 46.5 0.0 0.0 320.8 80.2
Adjusted operating result (adj. EBIT) 1 532.1 606.6 176.4 309.2 521.6 609.5 1,435.7 1,613.1 337.7 346.3 -79.4 -105.0 2,924.1 3,379.7in % of adjusted sales 9.6% 9.7% 3.7% 6.0% 10.1% 10.1% 19.7% 21.1% 11.5% 11.1% 11.4% 12.0%
CorporationInteriorChassis & Safety Powertrain Tires ContiTech Cons./Corr.

Preliminary Figures for Fiscal 2015 and Outlook 2016 January 2016 EDMR – Equity and Debt Markets Relations 41
5) Fact Sheets 9M 2015 Results Reported and Adjusted (mn €) – by Group
1 Before amortization of intangibles from PPA, changes in the scope of consolidation and special effects
2014 2015 2014 2015 2014 2015 2014 2015
Sales 15,466.9 17,569.2 10,151.0 11,682.8 -30.3 -35.8 25,587.6 29,216.2
EBIT 782.5 1,488.4 1,744.8 1,812.4 -79.4 -105.0 2,447.9 3,195.8in % of sales 5.1% 8.5% 17.2% 15.5% 9.6% 10.9%
Amortization of intangible assets from PPA 147.2 15.9 8.2 87.8 0.0 0.0 155.4 103.7
Total special effects 292.8 0.4 21.4 15.2 0.0 0.0 314.2 15.6
Total consolidation effects 7.6 20.6 -1.0 44.0 0.0 0.0 6.6 64.6
Total consolidation & special effects 300.4 21.0 20.4 59.2 0.0 0.0 320.8 80.2
Adjusted operating result (adj. EBIT) 1 1,230.1 1,525.3 1,773.4 1,959.4 -79.4 -105.0 2,924.1 3,379.7in % of adjusted sales 8.0% 8.8% 17.5% 18.3% 11.4% 12.0%
Automotive Cons./Corr. GroupRubber

Preliminary Figures for Fiscal 2015 and Outlook 2016 January 2016 EDMR – Equity and Debt Markets Relations 42
5) Fact Sheets Shareholder Structure
Source: Based on publicly available data
Shareholder Structure as at Dec. 31, 2010
Shareholder Structure as at Dec. 31, 2011
Shareholder Structure as at Dec. 31, 2012
Shareholder Structure since Sept. 17, 2013
M.M.Warburg & CO KGaA 16.48%
M.M.Warburg & CO KGaA 5.19%
B. Metzler seel. Sohn Co. Holding AG 16.48%
B. Metzler seel. Sohn Co. Holding AG 5.19%
Schaeffler Group 42.17%
Schaeffler Group 49.90%
Schaeffler Group 49.9%
Schaeffler Group 46.0%
Free Float 39.72%
Free Float 50.1%
Free Float 54.0%
Free Float 24.87%

Preliminary Figures for Fiscal 2015 and Outlook 2016 January 2016 EDMR – Equity and Debt Markets Relations 43
5) Fact Sheets Continental’s Credit Rating
2000 2001 2002 2003 2004 2005 2006 2007 2008 2009 2010 2011 2012 2013 2014 2015
BBB+ / Baa1
BBB / Baa2
BBB- / Baa3
BB+ / Ba1
BB / Ba2
BB- / Ba3
B+ / B1
B / B2
S&P, Fitch / Moody’s Standard & Poor’s1 Moody’s 2 Fitch 3
Before Siemens
VDO
Non
-Inve
stm
ent
Gra
de
Inve
stm
ent
Gra
de
1 Contracted rating since May 2000 2 Non-contracted rating since February 1, 2014 3 Contracted rating since November 2013

Preliminary Figures for Fiscal 2015 and Outlook 2016 January 2016 EDMR – Equity and Debt Markets Relations 44
References Useful Links
Continental Investor Relations website http://www.continental-ir.com
Annual and interim reports http://www.continental-corporation.com/www/portal_com_en/themes/ir/financial_reports/
2014 Fact Book http://www.continental-corporation.com/www/portal_com_en/themes/ir/financial_reports/
Investor Relations events and presentations
http://www.continental-corporation.com/www/portal_com_en/themes/ir/events/
Sustainability at Continental (presentation and fact sheet for investors)
http://www.continental-ir.com
Corporate Social Responsibility http://www.continental-sustainability.com
Corporate Governance Principles http://www.continental-corporation.com/www/portal_com_en/themes/ir/corporate_governance/
Continental share http://www.continental-corporation.com/www/portal_com_en/themes/ir/share/
Continental bonds and rating http://www.continental-corporation.com/www/portal_com_en/themes/ir/bonds/
Continental IR mobile website http://continental.ir-portal.de