predictive value of the pendulum test for assessing knee
TRANSCRIPT

RESEARCH Open Access
Predictive value of the pendulum test forassessing knee extensor spasticityAlyssa Whelan2, Andrew Sexton1, Melony Jones3, Colleen O’Connell2,3 and Chris A. McGibbon1,2*
Abstract
Background: The pendulum test is commonly used to quantify knee extensor spasticity, but it is currentlyunknown to what extent common pendulum test metrics can detect spasticity in patients with neurologicalinjury or disease, and if the presence of flexor spasticity influences the test outcomes.
Methods: A retrospective analysis was conducted on 131 knees, from 93 patients, across four different patient cohorts.Clinical data included Modified Ashworth Scale (MAS) scores for knee extensors and flexors, and years since diagnosis.BioTone™ measures included extensor strength, passive and active range of motion, and pendulum tests of mostaffected or both knees. Pendulum test metrics included the relaxation index (RI), 1st flexion amplitude (F1amp) andplateau angle (Plat), where RI=F1amp/Plat. Two-way ANOVA tests were used to determine if pendulum test metricswere influenced by the degree of knee flexor spasticity graded by the MAS, and ANCOVA was used to test forconfounding effects of age, years since injury, strength and range of motion (ROM). In order to identify the bestpendulum test metrics, Receiver Operator Characteristic analysis and logistic regression (LR) analysis were used toclassify knees by spasticity status (none or any) and severity (low/moderate or high/severe).
Results: Pendulum test metrics for knee extensors were not influenced by degree of flexor spasticity, age, years sinceinjury, strength or ROM of the limb. RI, F1amp and Plat were > 70% accurate in classifying knees by presence of clinicalspasticity (from the MAS), but were less accurate (< 70%) for grading spasticity level. The best classification accuracywas obtained using F1amp and Plat independently in the model rather than using RI alone.
Conclusions: We conclude that the pendulum test has good predictive value for detecting the presence of extensorspasticity, independent of the existence of flexor spasticity. However, the ability to grade spasticity level as measuredby MAS using the RI and/or F1amp may be limited. Further study is warranted to explore if the pendulum test issuitable for quantifying more severe spasticity.
Keywords: Spasticity, Knee extensor, Knee flexor, Pendulum test, Relaxation index, Modified Ashworth scale,Classification, Logistic regression, Receiver operator characteristic
BackgroundMuscle spasticity can be a painful and debilitating compli-cation that negatively impacts function and quality of life inpeople with upper motor neuron injury from neurologicaldisease or trauma [1], such as acquired brain injury(trauma, stroke), cerebral palsy, multiple sclerosis andspinal cord injury. Management of spasticity typically in-volves pharmacologic intervention and/or ongoing physicaltherapy [2, 3], but a significant barrier to effective treatment
prescription is the inability to quantify spasticity in theclinic [4].Spasticity is typically assessed by inducing a rapid stretch
of the muscle, or administering a “stretch-reflex” test. Clin-ical tests such as the Modified Ashworth Scale [5] and Tar-dieu Scale [6] apply this method to quantify spasticitysubjectively, but their inter-rater reliability [7–10] and valid-ity [11] have been questioned. Several studies have exam-ined objective approaches to quantifying spasticity in theclinic using wearable sensor technologies during passivemuscle stretches [9, 12–15], but there is not yet a clear con-sensus on testing protocol and how to best translate theresulting electrophysiological and biomechanical signals
* Correspondence: [email protected] of Biomedical Engineering, University of New Brunswick,Fredericton, NB E3B 5A3, Canada2Faculty of Kinesiology, University of New Brunswick, Fredericton, NB, CanadaFull list of author information is available at the end of the article
© The Author(s). 2018 Open Access This article is distributed under the terms of the Creative Commons Attribution 4.0International License (http://creativecommons.org/licenses/by/4.0/), which permits unrestricted use, distribution, andreproduction in any medium, provided you give appropriate credit to the original author(s) and the source, provide a link tothe Creative Commons license, and indicate if changes were made. The Creative Commons Public Domain Dedication waiver(http://creativecommons.org/publicdomain/zero/1.0/) applies to the data made available in this article, unless otherwise stated.
Whelan et al. Journal of NeuroEngineering and Rehabilitation (2018) 15:68 https://doi.org/10.1186/s12984-018-0411-x

into clinically relevant measures of spasticity. As such, theModified Ashworth Scale remains a commonly usedmethod of quantifying spasticity in clinical settings.For the knee joint, the Wartenberg pendulum test [16]
offers a potential solution for translation to clinical assess-ment. The pendulum test offers a simple approach wherebygravity induces the stretch-reflex of knee muscles by drop-ping the lower-leg from a resting horizontal position, andobserving its oscillatory behavior throughout the passivemovement [17, 18]. The test’s easy implementation andexecution with commonly available sensors (e.g. electro-myography with video [19], goniometry [20, 21], and otheraccessible devices such as the Wii remote [22]) has contrib-uted to it emerging as an objective and reliable way toquantify spasticity in the knee extensors [17, 23–25]. Never-theless, there is still a lack of consensus on what pendulumtest metrics are most relevant to clinical spasticity assess-ment, and importantly, whether the pendulum test is sensi-tive to knee flexor spasticity. Thus the purpose of this studywas two-fold:
1) To determine if the measurement of extensorspasticity is influenced by flexor spasticity duringthe pendulum test in patients with neurologicalinjury or disease; and
2) To determine which pendulum test metrics are theclosest indicators of clinical muscle spasticity, asrepresented by the Modified Ashworth Scale(MAS).
MethodsThis is a retrospective analysis of knee spasticity measure-ment data from a multi-site study to evaluate wearablesensor-based systems for acquiring objective measures ofmuscle tone in the clinic.
ParticipantsEthics, consent and screeningThe study was approved by the University Research EthicsBoard (REB) and by the REB or Institutional Review Board(IRB) for each of three participating clinical sites. The threeclinical sites were medium to large rehabilitation hospitalsin eastern Canada (Stan Cassidy Centre for Rehabilitation,Fredericton, New Brunswick, and Nova Scotia Rehabilita-tion Hospital, Halifax, Nova Scotia) and U.S. (Spaulding Re-habilitation Hospital, Boston, Massachusetts). Prior to datacollection, all participants in the study provided informed,signed consent. Data were collected at the three sites be-tween September 2011 and May 2014.The site coordinator (non-therapist) approached patients
meeting the inclusion criteria and asked if they were willingto participate in the study during a future regularly sched-uled visit. Those who were willing were informed of thestudy purpose, risks, discomforts, potential benefits, and
their rights to privacy and the use of data. Once a partici-pant agreed to the outlined procedures and written consentwas obtained, they were enrolled in study. Additional de-tails of the larger study can be found elsewhere [13].Inclusion criteria were: Male or female active inpatient
or outpatient, sixteen years of age or older, and currentlyreceiving services at study site for one or more of thefollowing diagnoses: acquired brain injury (ABI: strokes,trauma, etc.), spinal cord injury (SCI: incomplete anylevel or complete C7 and below), multiple sclerosis (MS:meeting 2010 MacDonald criteria [26]), and cerebralpalsy (CP: hemiplegic or diplegic); medically stable; andexhibits some degree of abnormal tone in either upperor lower limbs, specifically at the elbow and/or kneejoint(s). Exclusion criteria were: Joint conditions such asosteoarthritis, rheumatoid arthritis, etc. that would con-found measurement of spasticity; bariatric or with littlemeasureable surface EMG signal; viral or bacterial infec-tion; open skin lesions, and; not capable of autonomousconsent.
MeasurementsClinical assessment was performed on the patient as regu-larly scheduled. This included manual assessment of kneeextensors and flexors, where the therapist used the Modi-fied Ashworth Scale (MAS). The MAS is a ubiquitous in-strument for clinical spasticity assessment, in which thetherapist performs a manual stretch-reflex and rates the pa-tient’s spasticity on a 6-point scale with categories 0, 1, 1+,2, 3 and 4, as defined elsewhere [5]. There were no partici-pants with MAS= 4, which by definition is indicative of fullrigidity [5] and cannot be assessed with a pendulum test.The participant’s age, height, weight, leg length (for the
pendulum test), diagnosis (ABI/CVA, MS, CP, or SCI), af-fected extremity (right, left or both), and the month andyear of onset or injury, were also recorded. The participantwas then assessed using the BioTone™ system, as follows.
Active and passive knee extensionWhile seated, a fibre-optic goniometer (FOG, ShapeSen-sor™, Measurand, Fredericton NB) was positioned on thelimb using the Neoprene/Velcro cuffs and secured in placeas seen in Fig. 1 (top). For passive knee extension, the ther-apist moved the participant’s limb slowly to the full exten-sion. For active knee extension, the subject was instructedto move their lower leg against gravity from a flexed to fullyextended position. For both active and passive tests, theminimum angle achieved (peak extension angle) was re-corded and used to estimate the degree of contracture andparesis.
Isometric muscle strengthKnee extensor strength was measured with the limbstrength measurement device (LSMD) shown in Fig. 1
Whelan et al. Journal of NeuroEngineering and Rehabilitation (2018) 15:68 Page 2 of 12
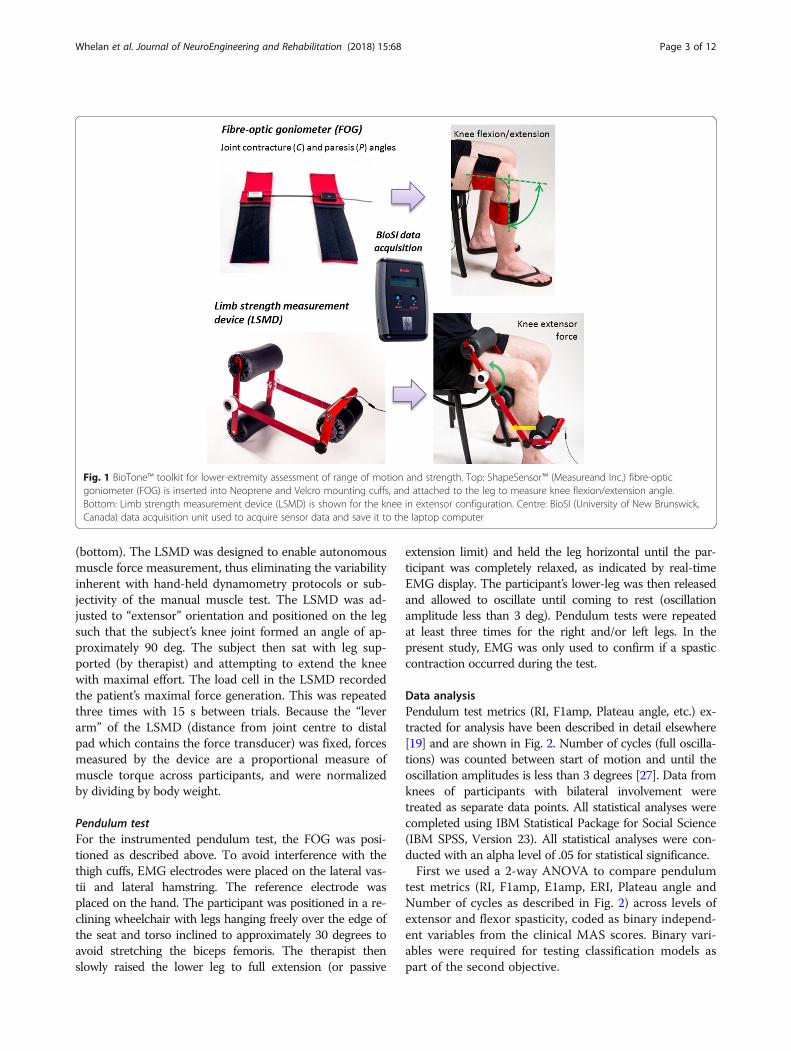
(bottom). The LSMD was designed to enable autonomousmuscle force measurement, thus eliminating the variabilityinherent with hand-held dynamometry protocols or sub-jectivity of the manual muscle test. The LSMD was ad-justed to “extensor” orientation and positioned on the legsuch that the subject’s knee joint formed an angle of ap-proximately 90 deg. The subject then sat with leg sup-ported (by therapist) and attempting to extend the kneewith maximal effort. The load cell in the LSMD recordedthe patient’s maximal force generation. This was repeatedthree times with 15 s between trials. Because the “leverarm” of the LSMD (distance from joint centre to distalpad which contains the force transducer) was fixed, forcesmeasured by the device are a proportional measure ofmuscle torque across participants, and were normalizedby dividing by body weight.
Pendulum testFor the instrumented pendulum test, the FOG was posi-tioned as described above. To avoid interference with thethigh cuffs, EMG electrodes were placed on the lateral vas-tii and lateral hamstring. The reference electrode wasplaced on the hand. The participant was positioned in a re-clining wheelchair with legs hanging freely over the edge ofthe seat and torso inclined to approximately 30 degrees toavoid stretching the biceps femoris. The therapist thenslowly raised the lower leg to full extension (or passive
extension limit) and held the leg horizontal until the par-ticipant was completely relaxed, as indicated by real-timeEMG display. The participant’s lower-leg was then releasedand allowed to oscillate until coming to rest (oscillationamplitude less than 3 deg). Pendulum tests were repeatedat least three times for the right and/or left legs. In thepresent study, EMG was only used to confirm if a spasticcontraction occurred during the test.
Data analysisPendulum test metrics (RI, F1amp, Plateau angle, etc.) ex-tracted for analysis have been described in detail elsewhere[19] and are shown in Fig. 2. Number of cycles (full oscilla-tions) was counted between start of motion and until theoscillation amplitudes is less than 3 degrees [27]. Data fromknees of participants with bilateral involvement weretreated as separate data points. All statistical analyses werecompleted using IBM Statistical Package for Social Science(IBM SPSS, Version 23). All statistical analyses were con-ducted with an alpha level of .05 for statistical significance.First we used a 2-way ANOVA to compare pendulum
test metrics (RI, F1amp, E1amp, ERI, Plateau angle andNumber of cycles as described in Fig. 2) across levels ofextensor and flexor spasticity, coded as binary independ-ent variables from the clinical MAS scores. Binary vari-ables were required for testing classification models aspart of the second objective.
Fig. 1 BioTone™ toolkit for lower-extremity assessment of range of motion and strength. Top: ShapeSensor™ (Measureand Inc.) fibre-opticgoniometer (FOG) is inserted into Neoprene and Velcro mounting cuffs, and attached to the leg to measure knee flexion/extension angle.Bottom: Limb strength measurement device (LSMD) is shown for the knee in extensor configuration. Centre: BioSI (University of New Brunswick,Canada) data acquisition unit used to acquire sensor data and save it to the laptop computer
Whelan et al. Journal of NeuroEngineering and Rehabilitation (2018) 15:68 Page 3 of 12

We created two separate models in order to determine ifthe above metrics can classify patients by no or any spasti-city, and whether we can classify present spasticity as lowor high. In the first model (Model 1), we divided knees intono spasticity (MAS = 0) and any spasticity (MAS > =1),based on their clinical assessment of knee extensor andflexor spasticity prior to the pendulum test. In the secondmodel (Model 2), we excluded the MAS= 0 knees andre-grouped knees by low/moderate spasticity (MAS= [1,1+]) and high/severe spasticity (MAS= [2, 3]), for extensorsand flexors. Although other groups could be used, the se-lected groupings had the best distribution and were consid-ered the most clinically relevant.Therefore, Model 1 had factors: Ext1 (0 =No extensor
spasticity, 1 = Any extensor spasticity) by Flx1 (0 =Noflexor spasticity, 1 = Any flexor spasticity), and Model 2 hadfactors: Ext2 (0 = Low/moderate extensor spasticity, 1 =High/severe extensor spasticity) by Flx2 (0 = Low/moderateflexor spasticity, 1 =High/severe flexor spasticity). Models
were tested for main effects of extensor spasticity and flexorspasticity, and interaction effects between extensor andflexor spasticity. Interaction effects were used to answer thefirst research question, and the main effects analysis wasused to answer the second research question, as detailedbelow:
Flexor spasticity influence on measurement of extensorspasticityTo determine if the measurement of extensor spasticity isinfluenced by flexor spasticity during the pendulum test weneed to analyze the interaction effects of the ANOVA testsfor Model 1 and Model 2. A significant interaction effectfor Model 1 would suggest that any flexor spasticity mightinfluence the outcome of the extensor spasticity assessedusing the pendulum test. A significant interaction effect forModel 2 would suggest that the amount of flexor spasticitymay be an important consideration for trusting the meas-urement of extensor spasticity using the pendulum test.
Fig. 2 BioTone™ toolkit for lower-extremity assessment of spasticity using the pendulum test. Top: Electromyographic (EMG) electrodes areplaced on extensor and flexor muscles and used to ensure muscle relation prior to the start of testing and to monitor involuntary contractionsduring the test, and fibre-optic goniometer (FOG) system used to measure knee angle during the pendulum test. Bottom: Pendulum test metricsinclude the plateau angle (Plat), first flexion amplitude (F1amp), and first extension amplitude (E1amp) which are used to compute the relaxationindex (RI) and the extension relaxation index (ERI)
Whelan et al. Journal of NeuroEngineering and Rehabilitation (2018) 15:68 Page 4 of 12

These analyses were then repeated with a variety of covari-ates (age, time since diagnosis/injury, passive and active ex-tension range and isometric extensor strength) to furtherexplore sources of variability in the pendulum test.
Assessment of pendulum test metrics for quantifyingspasticityTo determine which pendulum test metrics are the best in-dicators of clinical muscle spasticity as represented by theModified Ashworth Scale (MAS), we first need to analyzethe main effects of the ANOVA tests for Model 1 andModel 2. A significant main effect for extensor (or flexor)spasticity will indicate if the pendulum test metric is sensi-tive to spasticity state of the knee. For pendulum test met-rics with significant main effects, we then determinedwhich metric offered the best predictive value of clinicalspasticity. This was accomplished using Receiver Op-erator Characteristic (ROC) analysis to determine whichmetrics have the best predictive potential (area undercurve, AUC > .7), followed by classification analysis usinglogistic regressions on the binary spasticity groupings(Model 1 and Model 2) for each of the pendulum testmetrics. Tests for Model 1 will determine which metric isbest at discriminating any spasticity from no spasticity,and the analysis of Model 2 will determine which metric isbest at grading spasticity into low/moderate spasticity ver-sus high/severe spasticity.
ResultsNinety-three patients (65 male and 28 female) composed offour patient cohorts (45 with ABI, 14 with MS, 12 with CP,and 22 with SCI) completed the pendulum test assessmentsand had MAS scores and other measures available. A totalof 53 patients were measured unilaterally and 39 bilaterally,resulting in a total of 131 knees tested (56 ABI, 23 MS, 18CP and 34 SCI). Participant demographic data (age andyears since diagnosis) for the four cohorts are shown inTable 1. Also included are BioTone™ measures of contrac-ture (passive extension range), paresis (passive – active ex-tension range) and strength (peak isometric extensor force)for each cohort group.
MAS score for knee flexors and extensors for patientcohorts are shown in Table 2, and are grouped accordingto most affected and least affected side, with the totalnumber of knees shown in the last row. The majority offlexor knees were assigned a score of 1 (n = 31) or 1+ (n= 24). Likewise, extensor knees followed a similar patternwith 33 knees being assigned a grade of 1, and 14 beingassigned a grade of 1+, but with 16 being assigned agrade of 2. A total of 46 and 53 knee flexors and exten-sors, respectively, had a score of 0.Pendulum test outcomes are summarized in Fig. 3, and
Tables 3 and 4. Figure 3 shows pendulum test metricsagainst therapist rated MAS scores for knee extensors (top)and flexors (bottom). Data in Tables 3 and 4 show the mar-ginal means of the pendulum test scores according to thefactorial levels of each model. Table 3 shows results forModel 1 with factors Ext1 and Flx1, and Table 4 shows re-sults for Model 2 with factors Ext2 and Flx2. Table 5 showsthe resulting p-values generated for main effects and inter-action effects from testing Model 1 (top) and Model 2(bottom).
Does flexor spasticity influence the pendulum test?Statistical results in Table 5 for analysis of Model 1 re-vealed a significant effect of Ext1 for all metrics (p <0.001), except for Number of cycles (p = 0.594). No sig-nificance effect of Flx1 was present for any metrics ex-cept for E1amp (p = 0.013). Additionally, there were nosignificant Ext1 × Flx1 interactions (p > 0.05). For Model2, the only pendulum test metrics to show any statisti-cally significant differences were ERI, which had a sig-nificant Ext2 effect (p = .012) and Flx2 effect (p = .031),and E1amp which had a significant Ext2 effect. Similarto Model 1, there were no significant (p > .05) interac-tions observed for any of the pendulum test metrics.Lastly, ANCOVA were conducted using both models
to identify any confounding effects of age, time since in-jury/diagnosis, passive ROM, active-passive ROM, andextensor strength. We found that both models main-tained the same significance patterns when covariates
Table 1 Participant demographic data and BioTone™ assessment of contracture, paresis and strength
Gender Age, years Years Since Dx Contracture (Passive ROM Min, deg) Paresis (Passive ROM min-Active ROM min, deg)
Flexor Strength (N) Knees
M F Mean (SD) Mean (SD) Mean (SD) Mean (SD) Mean (SD) N
n n
ABI (n = 45) 35 10 52 (16) 4.8 (4.8) −6.96 (5.25) 7.46 (12.9) 258.1 (135.7) 56
MS (n = 14) 6 8 54 (13) 17.2 (8.7) −5.26 (4.81) 11.3 (19.2) 215.7 (134.2) 23
CP (n = 12) 5 7 34 (12) 34.3 (11.9) −4.28 (7.12) 6.50 (5.93) 160.8 (45.9) 18
SCI (n = 22) 19 3 45 (14) 6.4 (10.5) −6.11 (5.17) 13.3 (20.2) 153.1 (99.4) 34
Total (n = 93) 65 28 49 (16) 11.0 (12.9) −6.09 (5.46) 9.52 (15.7) 215.7 (126.4) 131
AB acquired brain injury including stroke; MS multiple sclerosis; CP cerebral palsy; SCI spinal cord injury
Whelan et al. Journal of NeuroEngineering and Rehabilitation (2018) 15:68 Page 5 of 12

were entered into the model. Therefore, covariates didnot confound any effects on pendulum test metrics.These results show that the pendulum test metrics stud-
ied were not significantly influenced by level of spasticity inthe antagonistic flexor muscles, and were unaffected byvariability in the covariates listed above. In addition, resultsshowed that the pendulum test metrics studied had a goodability to discriminate between no spasticity and any spasti-city of knee extensors, as grouped by the assigned MAS.However, they were not able to discriminate very well be-tween low/moderate and high/severe spasticity.
Which pendulum test metric(s) best predicts clinicalspasticity?We first conducted ROC analysis on each of the metrics toevaluate their ability to detect the presence of spasticity(Model 1) and level of spasticity (Model 2). AUC valuesfrom operator curves (in Fig. 4.) are presented in Table 6.AUC values >.7 indicate the metric is potentially a goodpredictor of the dichotomous dependent variable, and AUCof ≤.5 indicates no predictive potential (diagonal line inROC graphs in Fig. 4).For Model 1, most metrics were acceptable predictors of
Ext1, having AUC> .7, with the exception of Number of cy-cles and Plateau angle which had AUC’s of 0.66 and 0.69,respectively. Not surprisingly, Model 1 yielded poor resultsfor predicting Flx1 (Factors MAS= 0, and MAS= 1,1+,2,3)with AUC values < 0.7 for all pendulum test metrics. Model2 yielded AUC values between 0.59 and 0.71 for predictingExt2 (Factors MAS= 1,1+ and MAS= 2,3) and all were < .7for predicting Flx2 (Factors; MAS= 1,1+, and MAS = 2,3).
This analysis suggests that RI, ERI, F1amp, E1amp and(borderline) Plateau angle are individually acceptable pre-dictors of extensor spasticity as graded by the MAS, butwith no clear winner.Given that E1amp and ERI are somewhat redundant in
their nature of depicting contraction of the flexor mus-cles, and the above results suggest they have limited pre-dictive value, both were dropped from the remaininganalysis. The metrics RI and F1amp appear to be the su-perior metrics for predicting spasticity presence, per anyMAS greater than 0. Clearly RI is a function of F1amp,and Plateau angle, as shown in Fig. 2. Therefore, we nextconducted logistic regression analysis to classify extensormuscle spasticity according to Model 1 (Ext1) andModel 2 (Ext2) using RI alone, versus using F1amp andPlateau angle in the logistic regression.These results are shown in Tables 7 and 8, respectively.
For each metric the classification table is shown with result-ing sensitivities and specificities as well as positive andnegative predictive values (PPV and NPV) and overall clas-sification accuracy. The logistic regression model for eachmetric is footnoted in the tables.For Model 1 (Table 7), the best classification accuracy
value of 77.9% was for the model using F1amp and Plat-eau angle simultaneously, versus using any one of themindividually or using the RI term alone. This model hadthe highest sensitivity (.81), specificity (.7), PPV (.86) andNPV (.62). For Model 2 (Table 8.) the highest classifica-tion accuracy value was 70.9% for the model using Plat-eau angle alone, followed by 68.6% for the model usingF1amp and Plateau angle in combination. However, it isclear for Model 2 that predictively is heavily biased to-ward the negative condition; that is, the classifier wasbetter at identifying negative results (low/moderate spas-ticity: MAS = [1,1+]) than positive results (high/severespasticity: MAS= [2, 3]).These results show that F1amp and Plateau angle ex-
plained more variance in the logistic regression analysisthan RI alone, for detecting the presence of spasticity per aMAS or 1 or greater (Ext1). However, no pendulum testmetrics were suitable for discriminating between knees withhigh/severe spasticity and those with low/moderate spasti-city (Ext2) as measured by MAS.
DiscussionThe Wartenberg pendulum test [16] has been around sincethe 1950’s, but gained interest in the late 80’s/early 90’s astest for assessing muscle spasticity [17, 18, 23, 24]. Severalstudies have shown feasibility of using sensor technologieswith an instrumented pendulum test [19, 21, 28] and re-peatability and validity for assessing spasticity in patientshas generally been reported as positive [25, 29, 30]. Al-though the test has some drawbacks [31], such as beingsensitive to posture during the test [32, 33], clinical
Table 2 Modified Ashworth Scale scores for knee flexors andextensors from clinical examination
MAS score – Knee flexors MAS score – Knee extensors
0 1 1+ 2 3 0 1 1+ 2 3
n n n n n n n n n n
Most affected side
ABI (n = 34) 20 8 2 2 2 14 11 4 4 1
MS (n = 17) 6 2 4 5 0 6 1 3 4 3
CP (n = 11) 3 3 1 1 3 0 4 1 3 3
SCI (n = 20) 6 5 3 2 4 7 8 3 2 0
Total (n = 82) 35 18 10 10 9 27 24 11 13 7
Least affected side
ABI (n = 22) 6 10 4 1 1 8 8 3 1 2
MS (n = 6) 2 1 2 0 1 2 0 2 1 1
CP (n = 7) 2 2 3 0 0 3 0 3 1 0
SCI (n = 14) 3 0 5 5 1 5 4 2 1 2
Total (n = 49) 13 13 14 6 3 26 9 3 3 4
Total (n = 131) 46 31 24 16 12 53 33 14 16 11
ABI acquired brain injury including stroke; MS multiple sclerosis; CP cerebralpalsy, SCI spinal cord injury
Whelan et al. Journal of NeuroEngineering and Rehabilitation (2018) 15:68 Page 6 of 12
evidence is increasing that the pendulum test has value forobjectively quantifying spasticity of knee extensors [34–39],as well as flexors and extensor of the elbow [40, 41].Due to the velocity-dependent nature of spasticity, the
initial and second swing of the pendulum test are consid-ered key for the detection of spasticity [17]. The maximumangular velocity of the knee occurs during the initial flexionoscillation [19, 27]. This first excursion (F1amp) results inthe largest velocity of musculotendinous stretch, and hasbeen found to be sensitive to differences in spasticity in thequadriceps [23]. Bajd and Vodovnik [17] further refined theapproach by dividing F1amp by the plateau angle to quan-tify the relaxation index, RI.1
Therefore, the RI is simply F1amp adjusted for the restingposition Plateau angle (hence excursion angle), thus ac-counting for changes in muscle length and structure thatcan result from ongoing spasticity, or activity inducedchanges in resting tonic reflex. Stillman and McMeeken[19] introduced the extension relaxation index, or ERI,along with its characteristic amplitude E1amp, describing
the excursion of the first (return) extension oscillation. Intheory, this metric should be sensitive to flexor spasticity,although there is very little evidence of the use of ERI/E1amp in clinical studies.Several studies have identified F1amp and/or RI [17, 23,
27, 34, 35] as acceptable metrics for identifying spasticity ofthe quadriceps, although its reliability has been debated inother works [27]. While these metrics have been identifiedas acceptable, many patient groups with knee extensorspasticity also experience knee flexor spasticity; in ourstudy, MAS scores for extensors and flexors of patient’sknees were significantly correlated (r = .525, p < .001). Toour knowledge, no other studies have examined the influ-ence of flexor spasticity on the commonly reported pendu-lum test output metrics mentioned above. Our studyprovides convincing evidence that the degree of flexor spas-ticity does not have a significant impact upon commonlyused pendulum test metrics F1amp and RI.In addition, we quantified the predictive value of these
metrics for detecting the presence of muscle spasticity,
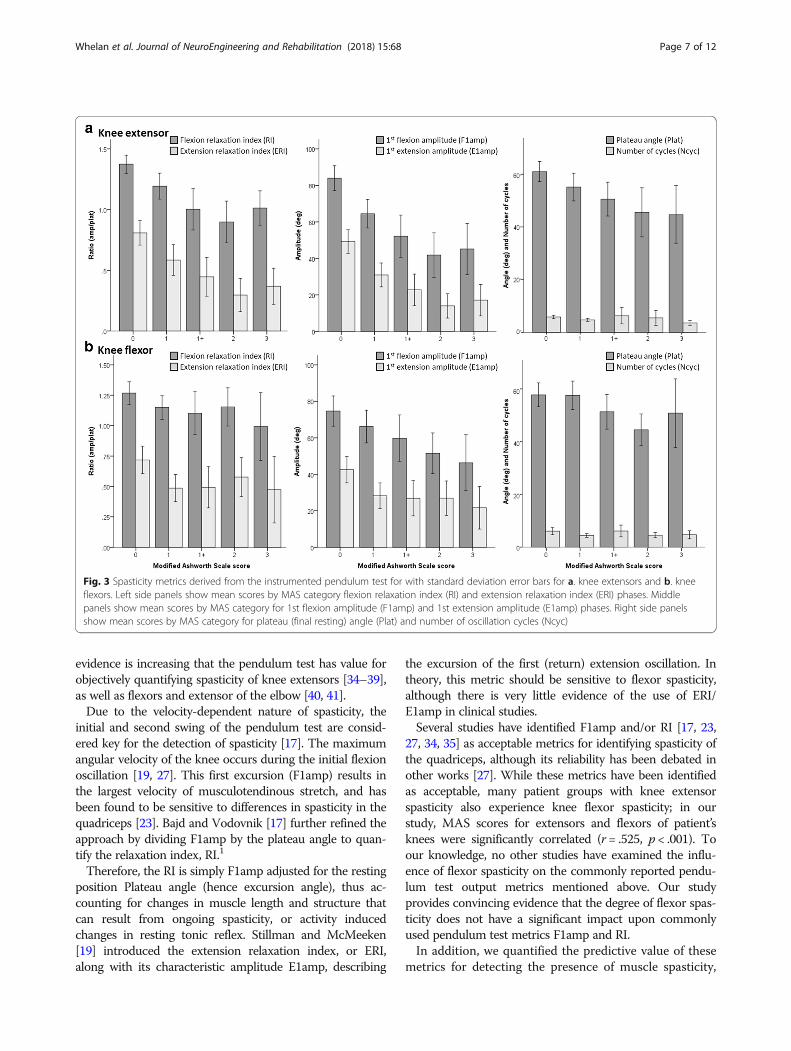
Fig. 3 Spasticity metrics derived from the instrumented pendulum test for with standard deviation error bars for a. knee extensors and b. kneeflexors. Left side panels show mean scores by MAS category flexion relaxation index (RI) and extension relaxation index (ERI) phases. Middlepanels show mean scores by MAS category for 1st flexion amplitude (F1amp) and 1st extension amplitude (E1amp) phases. Right side panelsshow mean scores by MAS category for plateau (final resting) angle (Plat) and number of oscillation cycles (Ncyc)
Whelan et al. Journal of NeuroEngineering and Rehabilitation (2018) 15:68 Page 7 of 12

and for discriminating the level of spasticity as measuredby MAS. The results demonstrate that the pendulum testis a valid tool to distinguish knee extensors with spasticity(MAS > 0), from those without spasticity (MAS = 0), butthat none of the metrics we analyzed were able to discrim-inate between knees with low/moderate (MAS= [1,1+])
and high/severe (MAS= [2, 3]) spasticity. The data in Fig. 3provide a potential explanation for this observation: notethat RI and F1amp decreased in magnitude until extensorMAS= 2 then increase for MAS = 3 to levels similar asMAS= 1+. This U-shape tendency was similarly reportedbetween RI and reflex torque from a model-based analysis[20], but was not observed in other studies [27].Figure 3 also shows that Plateau angle had a more lin-
ear relationship with extensor MAS score. This may alsoexplain, when classifying by Model 1 (no spasticity vsany spasticity), why the combination of F1amp and Plat-eau angle in the logistic regression model had betterclassification accuracy than did the models with RI,F1amp or Plateau angle individually. This supports thenotion proposed by others [41] that F1amp correspondsto stretch-reflex hyper-excitability and Plateau angle cor-responds to passive resistance to stretch of the muscle,both of which comprise (and confound [4]) the clinicalpresentation of spasticity when using the MAS. Thisfinding is consistent with the study by Fowler et al. [41],who reported that variability in resting angle (our plat-eau angle) contributed to their finding of low reliabilityof the RI for children with CP; which adds further sup-port to using F1amp and Plateau angle as separate inde-pendent variables for quantifying spasticity.Although none of the metrics we studied passed muster
for Model 2 classification (low spasticity vs high spasticity),the metric with the best overall accuracy, sensitivity andspecificity (>.7) was Plateau angle, as shown in Table 8.However, the PPV was too low (.24) to be of value for reli-ably discriminating spasticity in the clinic, and it failed toreach AUC criteria (>.7) using the ROC analysis. It is im-portant to note, however, that we only examined a few ofthe available metrics from the pendulum test. Other vari-ables or approaches may be more sensitive to discriminat-ing level of spasticity, such as time to first peak, firstexcursion velocity, and area under the pendulum curve
Table 3 Model 1 marginal means for factors Ext1 and Flx1 onpendulum test metrics (RI = relaxation index, ERI = extensionrelaxation index, F1amp = 1st flexion amplitude, E1amp = 1stextension amplitude, Plat = plateau angle, and Ncyc = numberof oscillation cycles)
MODEL 1 Flx1: Flexor spasticity
No spasticity(MAS = 0)
Any spasticity(MAS > 0)
Ext1: Extensor spasticity
Mean (SD) n Mean (SD) n
RI No spasticity 1.4 (.2) 26 1.3 (.3) 19
Any spasticity 1.1 (.3) 22 1.1 (.3) 64
ERI No spasticity .9 (.3) 26 .7 (.3) 19
Any spasticity .5 (.4) 22 .4 (.3) 64
F1amp No spasticity 88.2 (22.6) 26 78.2 (21.5) 19
Any spasticity 58.6 (26.7) 22 52.8 (24.6) 64
E1amp No spasticity 54.6 (21.6) 26 41.9 (19.6) 19
Any spasticity 28.3 (21.0) 22 22.1 (17.5) 64
Plat No spasticity 62.4 (13.3) 26 59.1 (11.8) 19
Any spasticity 52.2 (16.7) 22 49.4 (16.0) 64
Ncyc No spasticity 6.3 (2.1) 26 5.2 (2.2) 19
Any spasticity 5.8 (6.3) 22 4.9 (3.5) 64
Table 4 Model 2 marginal means for factors Ext2 and Flx2 onpendulum test metrics (RI = relaxation index, ERI = extensionrelaxation index, F1amp = 1st flexion amplitude, E1amp = 1stextension amplitude, Plat = plateau angle, and Ncyc = numberof oscillation cycles)
MODEL 2 Flx2: Flexor spasticity
Low spasticity(MAS = [1,1+])
High spasticity(MAS= [2, 3])
Ext2: Extensor spasticity
Mean (SD) n Mean (SD) n
RI Low spasticity 1.1 (.3) 30 1.1 (.5) 9
High spasticity .8 (.4) 8 1.0 (.3) 17
ERI Low spasticity .5 (.3) 30 .6 (.5) 9
High spasticity .2 (.1) 8 .4 (.3) 17
F1amp Low spasticity 60.8 (24.5) 30 48.1 (22.2) 9
High spasticity 42.9 (31.9) 8 45.9 (19.3) 17
E1amp Low spasticity 24.4 (19.2) 30 28.0 (20.7) 9
High spasticity 12.1 (13.1) 8 19.5 (12.8) 17
Plat Low spasticity 53.6 (14.4) 30 47.8 (15.1) 9
High spasticity 47.1 (21.0) 8 43.8 (16.0) 17
Ncyc Low spasticity 4.7 (2.7) 30 5.2 (1.8) 9
High spasticity 6.9 (7.7) 8 4.1 (1.8) 17
Table 5 Significant levels for 2-way ANOVA tests for pendulumtest metrics
p-values RI ERI F1amp E1amp Plat Ncyc
Model 1
Ext1 < 0.001* < 0.001* < 0.001* < 0.001* 0.001* 0.594
Flx1 0.264 0.057 0.098 0.013* 0.304 0.181
Ext1 × Flx1 0.679 0.520 0.654 0.395 0.948 0.956
Model 2
Ext2 0.103 0.021* 0.149 0.040* 0.251 0.598
Flx2 0.319 0.031* 0.477 0.269 0.319 0.262
Ext2 × Flx2 0.238 0.827 0.259 0.704 0.776 0.093
*effect is significant at p < .05Model 1: Ext1 and Flx1 are coded 0 = No spasticity vs 1 = Any spasticityModel 2: Ext2 and Flx2 are coded 0 = Low/ moderate spasticity vs 1 = High/severe spasticity
Whelan et al. Journal of NeuroEngineering and Rehabilitation (2018) 15:68 Page 8 of 12

[25, 42], stiffness and damping properties [20, 36, 43], orderiving metrics from combining kinematic informationwith electromyographic (EMG) information [44].Other studies have reported that number of cycles is an
indicator of spasticity [17, 41]. In our study, however, num-ber of cycles had the poorest classification performance ofall metrics for both Model 1 and 2 analyses. Although ouraverages for number of cycle agreed with data reported byothers [41], Fig. 3 shows that the number of cycles did notcorrespond to MAS score.
LimitationsThis study had several limitations. Firstly, the gold stand-ard used for comparison was the Modified Ashworth
Scale (MAS), which despite its ubiquity has been ques-tioned as a meaningful measure of spasticity due to theintermingling effects of hyper-excitability of the stretch re-flex and passive resistance to stretch [4, 9]. This meansthat the inability of the pendulum test metrics to discrim-inate between low/moderate and high/severe spasticity inour study may have been due to subjectivity and lack ofsensitivity of the MAS scale, rather than the ability of thependulum test to quantify the effect. Nevertheless, datafrom others [41] shows that the pendulum test was less re-liable when muscle becomes exceedingly resistant to pas-sive stretch, which stands to reason given the limitedexcursion of the limb after release in patients with severespasticity (c.f. [20, 25]).
Fig. 4 Receiver Operator Characteristic (ROC) curves for Model 1 (top panels) and Model 2 (bottom panels) for extensors (left panels) and flexors(right panels), for each of the pendulum test metrics studied
Table 6 ROC analysis area under curve (AUC) values for each pendulum test metric and for Model 1 and Model 2 prediction ofspasticity
AUC (95% CI) RI ERI F1amp E1amp Plat Ncyc
Model 1
Ext1 0.784 (0.698,0.869) 0.762 (0.672,0.852) 0.807 (0.729,0.885) 0.808 (0.726,0.890) 0.691 (0.599,0.783) 0.665 (0.567,0.762)
Flx1 0.635 (0.534,0.736) 0.652 (0.549,0.754) 0.655 (0.554,0.756) 0.675 (0.573,0.778) 0.600 (0.496,0.70) 0.631 (0.530,0.731)
Model 2
Ext2 0.659 (0.541,0.777) 0.675 (0.557,0.792) 0.695 (0.578,0.812) 0.705 (0.589,0.820) 0.655 (0.523,0.786) 0.590 (0.459,0.721)
Flx2 0.526 (0.392,0.661) 0.446 (0.314,0.580) 0.665 (0.544,0.785) 0.531 (0.400,0.662) 0.636 (.508,0.764) 0.506 (0.368,0.644)
Whelan et al. Journal of NeuroEngineering and Rehabilitation (2018) 15:68 Page 9 of 12

Another limitation is that the study was carried out atthree different hospitals across four different cohorts of pa-tients. Regarding the different sites, the BioTone™ softwarefully controlled the testing protocol (from order of testingto acquisition of all measures) and all three sites used thesame version of the system and sensors, and all sitepersonnel (physical therapists) were trained by the researchteam (M.J. and A.S.) when the system was deployed. Of
greatest concern, would be the variability across therapistsin their MAS assessments, however, this was not analyzedin the current paper. Regarding patient groups, althoughwe did not analyze effects by patient cohort (due to thelower numbers of MS and CP) the measurement approach(clinical MAS and BioTone) was independent of neuro-logical etiology, and it is expected that the relationships be-tween pendulum test metrics and clinical assessmentwould not be influenced by this fact.
ConclusionsThe pendulum test metrics studied for quantifying knee ex-tensor spasticity were not sensitive to level of flexor spasti-city (as measured by MAS), age, years since diagnosis, orphysical parameters of the limb. The pendulum test metricsRI and F1amp were good predictors of the presence of clin-ical spasticity in knee extensors, however, none of the met-rics studied were acceptable predictors of the level ofspasticity, as measured by MAS. The best logistic regres-sion model for detecting presence of spasticity used F1ampand Plateau angle as separate input terms rather than usingRI or F1amp alone. More research is needed to determineif pendulum test metrics are sensitive outcomes measuresfor managing problematic spasticity.
Endnotes1note that R2 was originally used by [17] but most au-
thors now use RI as introduced by [19].
AcknowledgementsThe authors are indebted to contributing staff and graduate students of theUNB Institute of Biomedical Engineering and Stan Cassidy Centre forRehabilitation, Nova Scotia Rehabilitation Hospital in Halifax, and SpauldingRehabilitation Hospital in Boston.
Table 7 Classification results using logistic regression for Model1 prediction of extensor spasticity from pendulum test metrics:RI, F1amp, and Plat
LR terms forModel 1 (Ext1)
ObservedExt1
Predicted Ext1 PredictivevalueNo spasticity Any spasticity
aRI No spasticity 23 22 NPV = .51
Any spasticity 12 74 PPV = .86
Overall Spec = .66 Sens = .77 CA = 74.0%bF1amp No spasticity 24 21 NPV = .53
Any spasticity 14 72 PPV = .84
Overall Spec = .63 Sens = .77 CA = 73.3%cPlat No spasticity 15 30 NPV = .33
Any spasticity 11 75 PPV = .87
Overall Spec = .58 Sens = .71 CA = 68.7%dF1amp, Plat No spasticity 28 17 NPV = .62
Any spasticity 12 74 PPV = .86
Overall Spec = .70 Sens = .81 CA = 77.9%aRI: Constant = 5.153; Beta(RI) = −3.646, p < .001bF1amp: Constant = 4.236; Beta(F1amp) = −.051, p < .001cPlat: Constant = 3.383; Beta(Plat) = −.049, p < .001dF1amp, Plat: Constant = 3.258; Beta(F1amp) = −.073, p < .001;Beta(Plat) = .045, p = .082
Table 8 Logistic regression results for Model 2 prediction of extensor spasticity from pendulum test metrics: RI, F1amp, and Plat
LR terms forModel 2 (Ext2)
Observed Ext2 Predicted Ext2 PredictivevalueLow spasticity High spasticity
aRI Low spasticity 52 5 NPV = .91
High spasticity 26 3 PPV = .10
Overall Spec = .66 Sens = .38 CA = 64.0%bF1amp Low spasticity 49 8 NPV = .86
High spasticity 20 9 PPV = .31
Overall Spec = .71 Sens = .53 CA = 67.4%cPlat Low spasticity 54 3 NPV = .95
High spasticity 22 7 PPV = .24
Overall Spec = .71 Sens = .70 CA = 70.9%dF1amp, Plat Low spasticity 50 7 NPV = .88
High spasticity 20 9 PPV = .31
Overall Spec = .71 Sens = .56 CA = 68.6%aRI: Constant = 1.006; Beta(RI) = − 1.623, p = .026bF1amp: Constant = .834; Beta(F1amp) = −.029, p = .005cPlat: Constant = 1.044; Beta(Plat) = −.035, p = .022dF1amp, Plat: Constant = .897; Beta(F1amp) = −.028, p = .072; Beta(Plat) = −.003, p = .907
Whelan et al. Journal of NeuroEngineering and Rehabilitation (2018) 15:68 Page 10 of 12

Availability of data materialsPlease contact corresponding author.
FundingThis work was supported by the Atlantic Canada Opportunities Agency,Atlantic Innovation Fund, Project # 195180.
Authors’ contributionsAW and CM conceived the research questions, performed the statisticalanalysis and wrote the manuscript draft. AS, MJ and CO collected the dataand managed the project. CM and CO acquired the funding to support theproject. All authors reviewed, edited and approved the final version of themanuscript.
Competing interestsThe authors declare that they have no competing interests.
Publisher’s NoteSpringer Nature remains neutral with regard to jurisdictional claims inpublished maps and institutional affiliations.
Author details1Institute of Biomedical Engineering, University of New Brunswick,Fredericton, NB E3B 5A3, Canada. 2Faculty of Kinesiology, University of NewBrunswick, Fredericton, NB, Canada. 3Stan Cassidy Centre for Rehabilitation,Fredericton, NB, Canada.
Received: 10 January 2018 Accepted: 5 July 2018
References1. Public Health Agency of Canada. Mapping connections: Understanding of
neurological conditions in Canada. Ottawa ON: Public Health Agency ofCanada; 2014.
2. Logan LR. Rehabilitation techniques to maximize spasticity management.Top Stroke Rehabil. 2011;18(3):203–11.
3. Kostas JP, Ristanis SE, Soucacos PN. Botulinum a toxin for treatment oflower limb spasticity in cerebral palsy gait analysis in 49 patients. ActaOrthop Scand. 2003;74(6):749–55.
4. Malhotra S, Pandyan AD, Day CR, Jones PW, Hermens H. Spasticity, animpairment that is poorly defined and poorly measured. Clin Rehabil. 2009;23(7):651–8.
5. Bohannon RW, Smith MB. Interrater reliability of a modified Ashworth scaleof muscle spasticity. Phys Ther. 1987;67(2):206–7.
6. Mackey AH, Walt SE, Lobb G, Stott NS. Intraobserver reliability of themodified Tardieu scale in the upper limb of children with hemiplegia. DevMed Child Neurol. 2004;46(4):267–72.
7. Ansari NN, Naghdi S, Younesian P, Shayeghan M. Inter- and intraraterreliability of the modified modified Ashworth scale in patients with kneeextensor poststroke spasticity. Physiother Theory Pract. 2008;24(3):205–13.
8. Ansari NN, Naghdi S, Hasson S, Mousakhani A, Nouriyan A, Omidvar Z. Inter-rater reliability of the modified modified Ashworth scale as a clinical tool inmeasurements of post-stroke elbow flexor spasticity. NeuroRehabilitation.2009;24(3):225–9.
9. Pandyan AD, Price CI, Rodgers H, Barnes MP, Johnson GR. Biomechanicalexamination of a commonly used measure of spasticity. Clin BiomechBristol Avon. 2001;16(10):859–65.
10. Akpinar P, Atici A, Ozkan FU, Aktas I, Kulcu DG, Sarı A, et al. Reliability of themodified Ashworth scale and modified Tardieu scale in patients with spinalcord injuries. Spinal Cord. 2017;55:944–9.
11. Fleuren JF, Voerman GE, Erren-Wolters CV, Snoek GJ, Rietman JS, HermensHJ, et al. Stop using the Ashworth Scale for the assessment of spasticity. JNeurol Neurosurg Psychiatry. 2009;81(1):46–52. Journal Article
12. McGibbon CA, Sexton A, Jones M, O’Connell C. Elbow spasticity duringpassive stretch-reflex: clinical evaluation using a wearable sensor system. JNeuroengineering Rehabil. 2013;10(1):61. -0003-10–61
13. McGibbon C, Sexton A, Jones M, O’Connell C. Quantification of elbowmuscle tone from an instrumented manual stretch-reflex test. Phys MedRehabil Res [Internet]. 2016 [cited 2017 Oct 29];1(5). Available from: http://oatext.com/Quantification-of-elbow-muscle-tone-from-an-instrumented-manual-stretch-reflex-test.php.
14. Calota A, Feldman AG, Levin MF. Spasticity measurement based on tonicstretch reflex threshold in stroke using a portable device. Clin NeurophysiolOff J Int Fed Clin Neurophysiol. 2008;119(10):2329–37.
15. Bar-On L, Aertbelien E, Wambacq H, Severijns D, Lambrecht K, Dan B, et al.A clinical measurement to quantify spasticity in children with cerebral palsyby integration of multidimensional signals. Gait Posture. 2013;38(1):141–7.
16. Wartenberg R. Pendulousness of the legs as a diagnostic test. Neurology.1951;1(1):18–24.
17. Bajd T, Vodovnik L. Pendulum testing of spasticity. J Biomed Eng. 1984;6(1):9–16.18. Lin DC, Rymer WZ. A quantitative analysis of pendular motion of the
lower leg in spastic human subjects. IEEE Trans Biomed Eng. 1991;38(9):906–18.
19. Stillman B, McMeeken J. A video-based version of the pendulum test:technique and normal response. Arch Phys Med Rehabil. 1995;76(2):166–76.
20. Le Cavorzin P, Hernot X, Bartier O, Carrault G, Chagneau F, Gallien P,et al. Evaluation of pendulum testing of spasticity. Ann Readaptationmed Phys rev Sci Soc Francaise reeducation Fonct Readaptation MedPhys 2002;45(9):510–516.
21. Jamshidi M, Smith AW. Clinical measurement of spasticity using thependulum test: comparison of electrogoniometric and videotape analyses.Arch Phys Med Rehabil. 1996;77(11):1129–32.
22. Yeh C-H, Hung C-Y, Wang Y-H, Hsu W-T, Chang Y-C, Yeh J-R, et al. Novelapplication of a Wii remote to measure spasticity with the pendulum test:proof of concept. Gait Posture. 2016;43:70–75.
23. Bajd T, Bowman B. Testing and modelling of spasticity. J Biomed Eng.1982;4(2):90–6.
24. Bohannon RW. Variability and reliability of the pendulum test for spasticityusing a Cybex II isokinetic dynamometer. Phys Ther. 1987;67(5):659–61.
25. Bohannon RW, Harrison S, Kinsella-Shaw J. Reliability and validity ofpendulum test measures of spasticity obtained with the Polhemus trackingsystem from patients with chronic stroke. J Neuroengineering Rehabil. 2009;6:30. (Journal Article):30–0003–6–30
26. Polman CH, Reingold SC, Banwell B, Clanet M, Cohen JA, Filippi M, et al.Diagnostic criteria for multiple sclerosis: 2010 revisions to the McDonaldcriteria. Ann Neurol 2011;69(2):292–302.
27. Fowler EG, Nwigwe AI, Ho TW. Sensitivity of the pendulum test forassessing spasticity in persons with cerebral palsy. Dev Med Child Neurol.2000;42(3):182–9.
28. Valle MS, Casabona A, Sgarlata R, Garozzo R, Vinci M, Cioni M. Thependulum test as a tool to evaluate passive knee stiffness andviscosity of patients with rheumatoid arthritis. BMC MusculoskeletDisord. 2006;7:89. Journal Article
29. White H, Uhl TL, Augsburger S, Tylkowski C. Reliability of the three-dimensional pendulum test for able-bodied children and childrendiagnosed with cerebral palsy. Gait Posture. 2007;26(1):97–105.
30. Syczewska M, Lebiedowska MK, Pandyan AD. Quantifying repeatabilityof the Wartenberg pendulum test parameters in children withspasticity. J Neurosci Methods. 2009;178(2):340–4.
31. Biering-Sørensen F, Nielsen JB, Klinge K. Spasticity-assessment: a review.Spinal Cord. 2006;44(12):708–22.
32. Fleuren JF, Nederhand MJ, Hermens HJ. Influence of posture andmuscle length on stretch reflex activity in poststroke patients withspasticity. Arch Phys Med Rehabil. 2006;87(7):981–8.
33. de Azevedo ERFBM, Maria RM, Alonso KC, Cliquet AJ. Postureinfluence on the pendulum test of spasticity in patients with spinalcord injury. Artif Organs. 2015;39(12):1033–7.
34. Szopa A, Domagalska-Szopa M, Kidoń Z, Syczewska M. Quadricepsfemoris spasticity in children with cerebral palsy: measurement withthe pendulum test and relationship with gait abnormalities. JNeuroengineering Rehabil 2014;11:166 (September).
35. Krause P, Szecsi J, Straube A. Changes in spastic muscle tone increase inpatients with spinal cord injury using functional electrical stimulation andpassive leg movements. Clin Rehabil. 2008;22(7):627–34.
36. Lotfian M, Mirbagheri MM, Kharazi MR, Dadashi F, Nourian R, Irani A,et al. Pendulum test measure correlates with gait parameters inchildren with cerebral palsy. Conf Proc Annu Int Conf IEEE Eng MedBiol Soc IEEE Eng Med Biol Soc Annu Conf. 2016;2016:1708–11.
37. Hofstoetter US, McKay WB, Tansey KE, Mayr W, Kern H, Minassian K.Modification of spasticity by transcutaneous spinal cord stimulationin individuals with incomplete spinal cord injury. J Spinal Cord Med.2014;37(2):202–11.
Whelan et al. Journal of NeuroEngineering and Rehabilitation (2018) 15:68 Page 11 of 12
38. Tancredo JR, Maria RM, Azevedo ER, Alonso KC, Varoto R, Cliquet Junior A.Clinical assessment of spasticity in individuals with spinal cord injury. ActaOrtop Bras. 2013;21(6):310–4.
39. Nordmark E, Anderson G. Wartenberg pendulum test: objectivequantification of muscle tone in children with spastic diplegia undergoingselective dorsal rhizotomy. Dev Med Child Neurol. 2002;44(1):26–33.
40. Lin CC, Ju MS, Lin CW. The pendulum test for evaluating spasticity of theelbow joint. Arch Phys Med Rehabil. 2003;84(1):69–74.
41. Huang H-W, Ju M-S, C-CK L. Flexor and extensor muscle tone evaluatedusing the quantitative pendulum test in stroke and parkinsonian patients. JClin Neurosci Off J Neurosurg Soc Australas. 2016;27:48–52.
42. Sterpi I, Caroli A, Meazza E, Maggioni G, Pistarini C, Colombo R. Lower limbspasticity assessment using an inertial sensor: a reliability study. PhysiolMeas. 2013;34(11):1423–34.
43. Joghtaei M, Arab AM, Hashemi-Nasl H, Joghataei MT, Tokhi MO. Assessmentof passive knee stiffness and viscosity in individuals with spinal cord injuryusing pendulum test. J Spinal Cord Med. 2015;38(2):170–7.
44. Yeh CH, Young HWV, Wang CY, Wang YH, Lee PL, Kang JH, et al.Quantifying spasticity with limited swinging cycles using pendulum testbased on phase amplitude coupling. IEEE Trans Neural Syst Rehabil Eng`2016;24(10):1081–1088.
Whelan et al. Journal of NeuroEngineering and Rehabilitation (2018) 15:68 Page 12 of 12