predictive distribution modeling with enhanced remote ...lestes/bongo/results_files/estes et...
TRANSCRIPT

Predictive distribution modeling with enhanced remotesensing and multiple validation techniques to supportmountain bongo antelope recovery
L. D. Estes1,2, A. G. Mwangi3, P. R. Reillo1 & H. H. Shugart2
1 Rare Species Conservatory Foundation, Loxahatchee, FL, USA
2 Center for Regional Environmental Studies, Department of Environmental Science, University of Virginia, Charlottesville, VA, USA
3 Rhino Ark Charitable Trust, Nairobi, Kenya
Keywords
Afromontane forest; bootstrap; external
validation; distribution modeling; rare species;
receiver operating characteristic; remote
sensing.
Correspondence
Lyndon D. Estes, Woodrow Wilson School,
Princeton University, Princeton, NJ 08544,
USA. Tel: +1 202 431 0496; Fax: +1 609
258 6082
Email: [email protected]
Editor: Iain Gordon
Associate Editor: Herve Fritz
Received 30 May 2010; accepted 28 February
2011
doi:10.1111/j.1469-1795.2011.00457.x
Abstract
Understanding endangered species’ spatial ecologies is fundamental to designing
effective recovery strategies. Transferable predictive distribution models (PDMs),
based on predictors describing the ranges and scales of relevant environmental
gradients, can provide this understanding. Using such models for rare species such
as the mountain bongo Tragelaphus eurycerus isaaci, an endangered antelope
being restored within its endemic range in Kenyan montane forests, is difficult
because the species’ rarity and challenging terrain complicate data collection. To
help overcome data limitations, we used advanced remote sensing (RS) and
multiple validation techniques to improve bongo PDMs, which were developed
using logistic regression and the information-theoretic approach. We derived
predictors using RS, including a new technique for measuring micro-scale vegeta-
tion structure, and assessed predictive performance using bootstrapping and
independent observations. Terrain ruggedness was the strongest habitat-use
predictor, followed by soil moisture availability, distance from law enforcement
outposts, vegetation structural complexity, and vegetation edge density. Prediction
accuracy generally ranged between 73 and 89%, but terrain ruggedness limited
model transferability. The more direct RS-based vegetation predictor improved
model transferability. Bongo restoration efforts should focus on high probability
areas delineated via a composite of all tested models. The techniques used –
particularly RS – enhanced inference quality and the transferability of distribution
models, and can be applied to other critical species and ecosystems.
Introduction
Restorative conservation measures are becoming increas-
ingly needed as numerous species’ populations decline
(Griffith et al., 1989; Ebenhard, 1995; Ceballos & Ehrlich,
2002). Successfully restoring a species requires understand-
ing its fundamental ecological requirements (Sarrazin &
Barbault, 1996), particularly the spatial distribution of
habitat use, so that conservation measures can be targeted
to appropriate areas. Spatial habitat use can be effectively
estimated using predictive distribution models (PDM) pro-
vided datasets are adequately sized, represent important
environmental gradients at relevant spatio-temporal scales,
and are temporally and spatially transferable (Vaughan &
Ormerod, 2003, 2005; Guisan & Thuiller, 2005). These
requirements are often difficult to meet when studying rare
and endangered species, whose low densities usually trans-
late to small sample sizes (Guisan & Zimmermann, 2000;
Rushton, Ormerod & Kerby, 2004). Rarity is often com-
pounded by other factors (e.g. challenging terrain), which
may force a trade-off between maximizing observations of
the focal species (e.g. Estes et al., 2008) and the need to
follow a comprehensive, fully stratified and multi-scaled
sampling design (Vaughan &Ormerod, 2003). Furthermore,
factors influencing a species’ rarefaction can lead to atypical
habitat use (e.g. Rubin et al., 2002), complicating a general-
ized understanding of its ecology.
These research complications apply to the mountain
bongo Tragelaphus eurycerus isaaci (hereafter ‘bongo’), a
critically endangered antelope sub-species (East, 1999) en-
demic to Kenyan montane forests (Fig. 1). An international
conservation effort aims to restore the bongo within its
former range, particularly in the Aberdare mountains and
on Mount Kenya (MK). This initiative’s success depends
upon implementing appropriate recovery measures, which
require an adequate understanding of the bongo’s ecological
requirements. These requirements are poorly understood
(Estes et al., 2008). Our objectives are to determine: (1) the
primary factors influencing bongo habitat use; (2) where
suitable bongo habitat is distributed; (3) where management
Animal Conservation ]] (2011) 1–12 c� 2011 The Authors. Animal Conservation c� 2011 The Zoological Society of London 1
Animal Conservation. Print ISSN 1367-9430

actions could be most effective. We use logistic regression
based on indirect bongo observations (e.g. tracks, dung,
feeding sign) to develop predictive distributions models for
the Aberdares and MK. We use remotely mapped habitat
predictors representing spatial scales relevant to bongo
(Estes et al., 2008), including quantitative vegetation struc-
ture maps based on a new technique that is more accurate
and more geographically transferable than approaches typi-
cally used in ecological models (Estes et al., 2010). To
minimize the high misidentification rates associated with
interpreting the sign of bongo and other forest ungulates, we
confirm bongo observations using mitochondrial DNA
analysis of associated dung samples (Faria et al., 2011;
Bowkett et al., 2009). We use independent observations
from MK to assess the transferability of our predictive
models, an important consideration because bongo popula-
tions in most of their habitat blocks (Fig. 1) are too small
(if not absent) to provide adequate model calibration data.
The combination of improved remote habitat mapping
and multiple validation techniques provides a template for
enhancing modeling studies of other rare species.
Methods
Background
Until the 1960s, Kenya’s bongo population likely exceeded
1000 animals, despite its narrow, restricted range, but since
then the wild population has decreased to �100 individuals
confined primarily to the Aberdare mountains (Fig. 1,
Stanley-Price, 1969; Kingdon, 1982; Reillo, 2002; Prette-
john, 2004). The precise cause of this decline is uncertain,
but interactions between rapid human population growth,
increased hunting pressure, habitat loss and epizootic events
seem likely (Gathaara, 1999; Imbernon, 1999; Kock et al.,
Figure 1 The Aberdares mountains (1), Mount Kenya (MK) (2), and the mountain bongo’s Tragelaphus eurycerus isaaci historical distribution
(dark gray patches in inset). Circles indicate bongo presence (black) and non-presence (white) plots. The gray lines denote elevation contours
at 400 m intervals. The dashed boxes show the locations of bongo observations collected in follow-up surveys (MK: 7/2006; 2/2008; Aberdares:
8/2006).
Animal Conservation ]] (2011) 1–12 c� 2011 The Authors. Animal Conservation c� 2011 The Zoological Society of London2
Modeling to support bongo recovery L. D. Estes et al.
1999; Lambrechts et al., 2003; Prettejohn, 2008). The recov-
ery project aims to (1) re-establish the MK (Fig. 1) popula-
tion using captive bongo repatriated from North America;
(2) rebuild the Aberdares’ and other remaining wild herds
through targeted management actions, with the broader
goal of improving conservation of Kenya’s important mon-
tane forests by leveraging the bongo’s status as a flagship
species (Caro & O’Doherty, 1999; Reillo, 2002, 2004; Estes
et al., 2008).
The Aberdares (3998m) and MK (5199m) are equatorial
mountains of volcanic origin (Fig. 1). Climate is defined by
the bi-modal precipitation pattern [annual rainfall range:
�950mm (leeward north-western slopes) to �2250mm
(windward south-eastern slopes)] caused by the shifting
Inter-Tropical Convergence Zone, and temperature patterns
that are shaped more by time of day and elevation than
season (Schmitt, 1991; Bussmann, 1994).
Both mountains are protected by national parks and
forest reserves administered by the Kenya Wildlife and
Forest Services, and are encircled by dense rural settlements.
A recently completed game fence encloses the Aberdares
(Butynski, 1999; Rhino Ark, 2010). Our study focused on
the forests lying within the Aberdares fenceline (1764 km2)
or above lower forest reserve boundaries on MK
(1963 km2). These forests contain a mix of bamboo and
broadleaf forests, shrublands and open glades that are
principally stratified by elevation (Schmitt, 1991; Bussmann,
1994). The bongo, which migrates seasonally along this
habitat-elevation gradient, depends on a mosaic of primary
forest, secondary forest and open glades (Kingdon, 1982), a
configuration providing shelter as well as edge conditions
where the bongo’s preferred browse – tall forbs and lianes –
can flourish (Estes et al., 2008). More detailed descriptions
of the study area and bongo ecology can be found in Estes
et al. (2008, 2010).
Survey data
We conducted surveys in the Aberdares during three clima-
tically representative periods in 2005–2006 (see Estes et al.,
2008, 2010 and supporting information Appendix S1 for
details on survey data collection methods). We collected
vegetation structural and compositional data in thirty-seven
0.04 ha circular plots centered on bongo habitat-use signs
(e.g. browsing, resting) identified by expert trackers. An
additional 90 ‘non-presence’ plots representing the range in
available habitats were collected from a point overlay
established on a 1 km2 grid (Fig. 1). Further surveys in 2006
and 2008 yielded 20 additional bongo-presence observations
(five in the Aberdares, 15 on MK) without associated
habitat information. Bongo observations were validated by
analyzing mitochondrial DNA extracted from dung samples
collected within or near sample plots (Faria et al., 2011;
supporting information Appendix S1). Using guidelines
established by Dunn (1978), bongo observations were
deemed independent based on the age differences between
habitat-use signs recorded in adjacent presence plots (sup-
porting information Appendix S1).
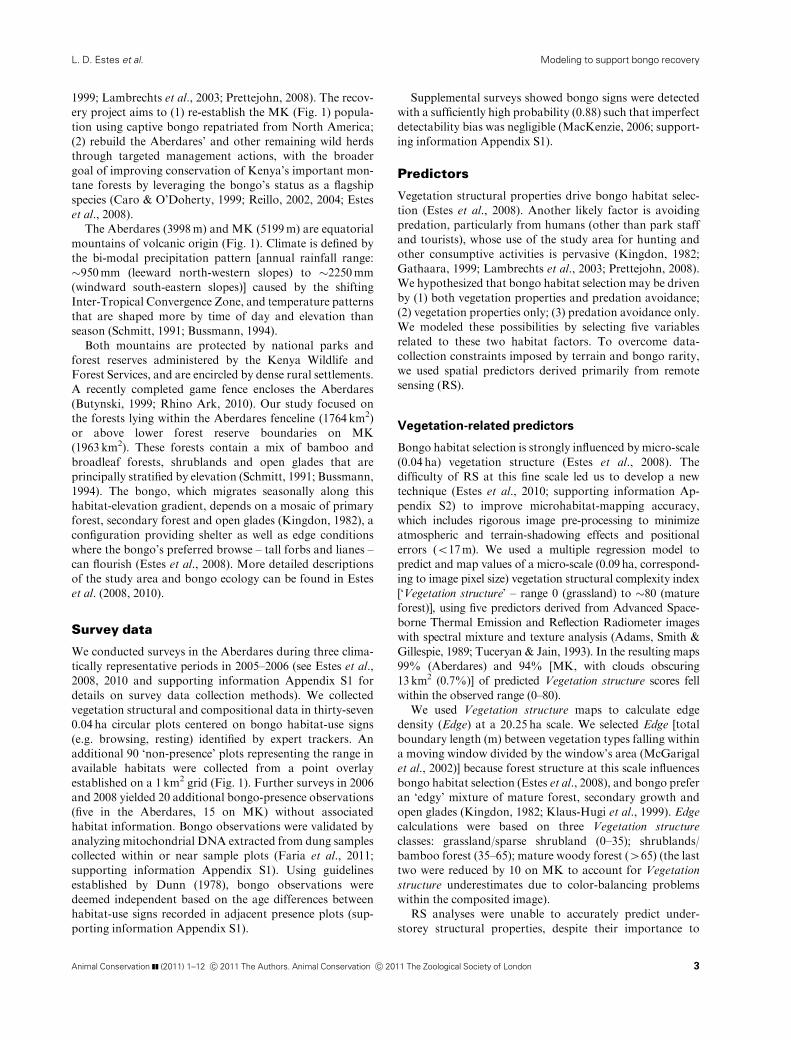
Supplemental surveys showed bongo signs were detected
with a sufficiently high probability (0.88) such that imperfect
detectability bias was negligible (MacKenzie, 2006; support-
ing information Appendix S1).
Predictors
Vegetation structural properties drive bongo habitat selec-
tion (Estes et al., 2008). Another likely factor is avoiding
predation, particularly from humans (other than park staff
and tourists), whose use of the study area for hunting and
other consumptive activities is pervasive (Kingdon, 1982;
Gathaara, 1999; Lambrechts et al., 2003; Prettejohn, 2008).
We hypothesized that bongo habitat selection may be driven
by (1) both vegetation properties and predation avoidance;
(2) vegetation properties only; (3) predation avoidance only.
We modeled these possibilities by selecting five variables
related to these two habitat factors. To overcome data-
collection constraints imposed by terrain and bongo rarity,
we used spatial predictors derived primarily from remote
sensing (RS).
Vegetation-related predictors
Bongo habitat selection is strongly influenced bymicro-scale
(0.04 ha) vegetation structure (Estes et al., 2008). The
difficulty of RS at this fine scale led us to develop a new
technique (Estes et al., 2010; supporting information Ap-
pendix S2) to improve microhabitat-mapping accuracy,
which includes rigorous image pre-processing to minimize
atmospheric and terrain-shadowing effects and positional
errors (o17m). We used a multiple regression model to
predict and map values of a micro-scale (0.09ha, correspond-
ing to image pixel size) vegetation structural complexity index
[‘Vegetation structure’ – range 0 (grassland) to �80 (mature
forest)], using five predictors derived from Advanced Space-
borne Thermal Emission and Reflection Radiometer images
with spectral mixture and texture analysis (Adams, Smith &
Gillespie, 1989; Tuceryan & Jain, 1993). In the resulting maps
99% (Aberdares) and 94% [MK, with clouds obscuring
13km2 (0.7%)] of predicted Vegetation structure scores fell
within the observed range (0–80).
We used Vegetation structure maps to calculate edge
density (Edge) at a 20.25 ha scale. We selected Edge [total
boundary length (m) between vegetation types falling within
a moving window divided by the window’s area (McGarigal
et al., 2002)] because forest structure at this scale influences
bongo habitat selection (Estes et al., 2008), and bongo prefer
an ‘edgy’ mixture of mature forest, secondary growth and
open glades (Kingdon, 1982; Klaus-Hugi et al., 1999). Edge
calculations were based on three Vegetation structure
classes: grassland/sparse shrubland (0–35); shrublands/
bamboo forest (35–65); mature woody forest (465) (the last
two were reduced by 10 on MK to account for Vegetation
structure underestimates due to color-balancing problems
within the composited image).
RS analyses were unable to accurately predict under-
storey structural properties, despite their importance to
Animal Conservation ]] (2011) 1–12 c� 2011 The Authors. Animal Conservation c� 2011 The Zoological Society of London 3
Modeling to support bongo recoveryL. D. Estes et al.

bongo (Estes et al., 2008; 2010). To provide information on
forage quality, we employed a measure of soil moisture
availability, the improved topographical relative moisture
index (hereafter ‘Moisture’, Parker, 1982; Manis, Lowry &
Ramsey, 2001; supporting information Appendix S2), which
varies between 1 (xeric) and 27 (mesic). We chose this
measure because topography exerts strong controls on soil
moisture, which is positively linked to forage nutrient
content and persistence (Lambers, Chapin & Pons, 1998;
Western et al., 1999; Vazquez-de-Aldana et al., 2000). Some
African ungulates select habitat where terrain enhances
moisture persistence and forage quality during dry seasons
(e.g. Stelfox & Hudson, 1986).We calculatedMoisture using a
90m Shuttle Radar Terrain Mapping Mission (SRTM) digi-
tal-elevation model (DEM) interpolated to 30m resolution.
Security variables
We derived two variables that can affect bongo’s ability to
escape predation: (1) distance to the nearest KWS ranger
station (Distance), an indicator of anti-poaching effort,
which we expect should be inversely related to bongo
presence; (2) an index of terrain ruggedness (Ruggedness),
which should correlate positively with bongo presence by
facilitating predator escape.We calculatedRuggedness using
the 90m SRTM DEM, defined here as the mean squared
elevation difference between each pixel and its eight neigh-
bors (Riley, DeGloria & Elliot, 1999). We averaged resulting
values using a 20.25 ha moving window, on the assumption
that ruggedness influences bongo at the patch scale.
Habitat models
We tested 31 logistic regression models using all 132 Aber-
dares observations (42 presence, 90 non-presence). Model
selection was based on the Akaike’s Information Criterion
for small sample sizes (AICc) and the associated Akaike
difference (D) and weight (w) (Burnham & Anderson, 2002;
supporting information Appendix S3). As we gave consider-
able a priori attention to variable selection, we tested all
possible models (excluding interactions) to fully explore
each predictor’s influence. We used Hosmer & Lemeshow’s
(1989) test to assess the global model’s goodness-of-fit.
Correlation coefficients for each pairwise predictor combi-
nation were o|0.5|, and variance inflation factors were
below 2.5 (Allison, 1999), indicating that multi-collinearity
was not a concern. Tests to determine the effects of three
potentially autocorrelated points revealed negligible model
bias (supporting information Appendix S3).
We then created 30m resolution predictive distribution
maps representing the three combinations of the two over-
arching habitat determinants (predation avoidance; vegeta-
tion). Maps were created with model coefficients averaged
(Burnham & Anderson, 2002, supporting information
Appendix S3) across each set of models representing the
three combinations (e.g. across the six models incorporating
only vegetation predictors). ‘Multi-model inference’ pro-
vides more conservative error estimates by incorporating
uncertainty regarding ‘best’ model structure into predictors’
confidence intervals (Burnham & Anderson, 2002). We
used frequency distributions of mapped predicted presence
probabilities (P) values to estimate potential habitat area
under different P thresholds.
To assess model predictive performance, we calculated
the area under the curve (AUC) of the receiver-operating
characteristic [ROC, a threshold-independent measure of
classification accuracy (Fielding & Bell, 1997)] for both
individual and composite (averaged) models.
To examine the degree of model over-fitting, we used the
‘.632’ bootstrap, which corrects accuracymeasures (e.g. AUC)
based on their variation when fit to re-sampled datasets
(Efron, 1983; Harrell, 2005; supporting informationAppendix
S3). We further assessed model predictive capacity using the
independent MK bongo observations. As these observations
were exclusive to bamboo forests, we compared MK P values
with those calculated for 10 Aberdares bongo plots recorded
in comparable habitat, using the Mann–Whitney–Wilcoxon
Rank Sum to assess differences in group mean P.
Results
Habitat models and predictor influence
We first ran the 31 individual models (Table 1), then created
the three composite models (Table 2) by averaging: (1) all 31
models (FullMod); (2) six models based on vegetation
variables only (VegMod); (3) the three models excluding
vegetation variables (SecMod). The results show that Rug-
gedness was the strongest predictor of bongo habitat use,
based on the strong AUCs of Ruggedness-based models
(0.84–0.90; Tables 1 and 2) and AICc-based measures [e.g.
summing wi for individual models in which this predictor
appeared indicates its relative influence (Burnham & Ander-
son, 2002), which in this case is 1 – the maximum possible
value]. Soil moisture is nearly as important in influenc-
ing habitat use (P
wi ¼ 0:97), followed by Distance
(P
wi ¼ 0:76), and Vegetation structure (P
wi ¼ 0:71), butthe patch-scaled measure of vegetation structural diversity
(Edge) was least influential (P
wi ¼ 0:31). However, all five
predictors appeared in the top six individual models [the
96% confidence set, based on summing wi (Burnham &
Anderson, 2002)], whose low Di and comparable wi indicate
substantial model selection uncertainty, which shows that
both security and vegetation aspects (particularly micro-
scale vegetation structure and soil moisture) determine
bongo habitat use. The adequate predictive performances
(AUCs40.7; Pearce & Ferrier, 2000) of most individual
models incorporating Vegetation structure andMoisture but
lacking security variables (Table 1) and VegMod (Table 2)
further support the importance of fine-scaled vegetation
features in shaping bongo habitat use.
Model performance and transferability
Applying the .632 bootstrap (5000 replicates) showed that
the individual models’ predictive abilities were robust (Table
1), with a mean reduction in AUC of only 0.009.
Animal Conservation ]] (2011) 1–12 c� 2011 The Authors. Animal Conservation c� 2011 The Zoological Society of London4
Modeling to support bongo recovery L. D. Estes et al.

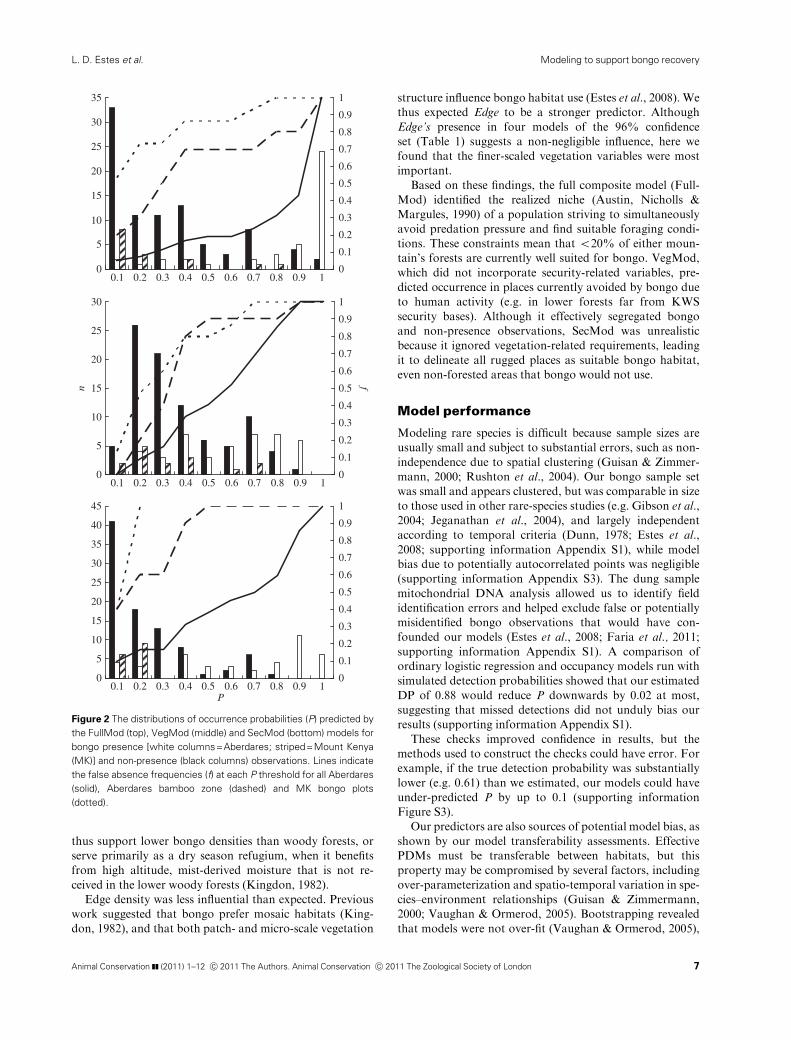
Both the independent MK bongo observations and the
Aberdares bamboo zone bongo (ABZ) plots were predicted
to have low occurrence probabilities (P) by all three compo-
site models (particularly SecMod), such that 70–100%
would be falsely classified as non-presences using a standard
P threshold of 0.5 (Fig. 2), and a majority would be mis-
classified even with the threshold P=0.3. However, Full-
Mod and SecMod predicted much larger discrepancies
between ABZ and MK P than VegMod, which found that
bongo are as likely to use bamboo forests onMK as they are
in the Aberdares (Fig. 2 and Table 2). These results indicate
that VegMod was more transferable, and this pattern of
between-mountain comparison was reflected in each set of
models underlying the composite models (supporting infor-
mation Table S2).
Habitat availability
We created habitat suitability maps (Fig. 3) using the spatial
predictors and their corresponding model-averaged coeffi-
cients. FullMod predicts that 21% of the Aberdares and 8%
ofMK are suitable at the 0.5 threshold, or 34 and 15%when
P=0.3 (Fig. 4). Under this model, deep valleys and escarp-
ments with moderate to high vegetation structural complex-
ity and soil moisture availability were predicted to have the
highest probabilities of bongo occurrence. SecMod (not
illustrated) delineated the most rugged areas as bongo
habitat, making just 15% of the Aberdares and 6% of MK
suitable at the 0.3 threshold. VegMod identified the greatest
extents of suitable bongo habitat [32% in the Aberdares and
29% of MK (P=0.5), or 53 and 55% (P=0.3)], comprised
of areas with high vegetation structural complexity and soil
moisture availability, which are conditions that predomi-
nate in lower-elevation woody forests.
Discussion
Ecological findings
The performance of Ruggedness-based models indicates that
mountain bongo strongly prefer difficult terrain (Tables 1
and 2). Distance was not as strong a predictor, but its
Table 1 Results of the 31-tested logistic regression models, including the relative rank, model structure, number of parameters (K), AICc value,
AICc differences (Di), akaike weights (wi), area under the curve (AUC) and the bootstrap-corrected AUCcorr
Rank Model K AICca Di wi AUC AUCcorr
1 Vegetation structure+Moisture+Distance+Ruggedness 5 103.77 0.00 0.34 0.899 0.888
2 Moisture+Distance+Ruggedness 4 105.03 1.26 0.18 0.892 0.884
3 Vegetation structure+Moisture+Ruggedness 4 105.35 1.58 0.15 0.889 0.882
4 Vegetation structure+Edge+Moisture+Distance+Ruggednessb 6 105.82 2.05 0.12 0.896 0.883
5 Edge+Moisture+Distance+Ruggedness 5 106.39 2.62 0.09 0.890 0.880
6 Vegetation structure+Edge+Moisture+Ruggedness 5 106.61 2.84 0.08 0.887 0.878
7 Vegetation structure+Distance+Ruggedness 4 110.22 6.45 0.01 0.881 0.872
8 Distance+Ruggedness 3 111.15 7.38 0.01 0.873 0.868
9 Edge+Moisture+Ruggedness 4 112.14 8.37 0.01 0.869 0.862
10 Vegetation structure+Edge+Distance+Ruggedness 5 112.20 8.42 0.00 0.878 0.866
11 Edge+Distance+Ruggedness 4 112.41 8.64 0.00 0.870 0.862
12 Vegetation structure+Ruggedness 3 114.28 10.51 0.00 0.866 0.861
13 Vegetation structure+Edge+Ruggedness 4 115.01 11.24 0.00 0.861 0.854
14 Moisture+Ruggedness 3 115.42 11.65 0.00 0.860 0.856
15 Edge+Ruggedness 3 119.67 15.90 0.00 0.847 0.841
16 Ruggedness 2 123.99 20.22 0.00 0.842 0.841
17 Vegetation structure+Moisture+Distance 4 142.53 38.76 0.00 0.779 0.764
18 Vegetation structure+Moisture 3 144.34 40.57 0.00 0.765 0.755
19 Vegetation structure+Distance 3 144.43 40.66 0.00 0.761 0.752
20 Vegetation structure+Edge+Moisture+Distance 5 144.53 40.76 0.00 0.784 0.759
21 Vegetation structure+Edge+Moisture 4 145.68 41.91 0.00 0.764 0.747
22 Vegetation structure+Edge+Distance 4 146.38 42.61 0.00 0.759 0.744
23 Vegetation structure 2 148.05 44.28 0.00 0.728 0.728
24 Vegetation structure+Edge 3 149.17 45.40 0.00 0.726 0.718
25 Moisture+Distance 3 151.08 47.31 0.00 0.731 0.722
26 Edge+Moisture+Distance 4 151.92 48.15 0.00 0.742 0.722
27 Distance 2 152.19 48.42 0.00 0.733 0.733
28 Edge+Distance 3 152.78 49.01 0.00 0.738 0.729
29 Edge+Moisture 3 160.04 56.27 0.00 0.681 0.664
30 Edge 2 162.36 58.59 0.00 0.645 0.644
31 Moisture 2 163.97 60.20 0.00 0.622 0.619
aAICc of null model (K=1; intercept only)=167.16.bHosmer–Lemeshow test results on full model indicate adequate fit: w2=5.42, d.f.=8, Po0.71.
Animal Conservation ]] (2011) 1–12 c� 2011 The Authors. Animal Conservation c� 2011 The Zoological Society of London 5
Modeling to support bongo recoveryL. D. Estes et al.

relative importance (P
wi ¼ 0:76) and negative association
with bongo presence (Tables 2 and S1) suggests that bongo
select areas closer to – thus more likely to be patrolled by –
park rangers. Although these measures do not directly
quantify predation risk, the most plausible explanation for
their importance is that they relate to bongo’s ability to
evade predation. We believe this risk is primarily from
humans, given the prevalence of poaching and other dis-
ruptive human activity (Kingdon, 1982; Butynski, 1999;
East, 1999; Gathaara, 1999; Lambrechts et al., 2003; Pre-
ttejohn, 2008), and that aDistance effect would be less likely
in the absence of human hunting (ranger patrols do not
deter other predators). Other large herbivores, such as mule
deer and bighorn sheep, use rugged terrain to escape
predators (e.g. Lingle, 2002; Mooring et al., 2004; Pierce,
Bowyer & Bleich, 2004), while populations of several large
African herbivores have shown positive correlations with
anti-poaching patrol effort (Leader-Williams & Albon,
1988; Hilborn et al., 2006), and increased vigilance and
habitat avoidance associated with hunting and other dis-
ruptive human activities (Laurance et al., 2006; Buij et al.,
2007; Fischer & Linsenmair, 2007). Nevertheless, direct
measures of predation risk are needed to confirm its im-
portance in determining bongo habitat.
The proxies for predation risk do not explain all bongo
habitat use. Model results showing the importance of
Moisture andVegetation structure confirmed that fine-scaled
vegetation features also influence bongo habitat use (Estes
et al., 2008). Moisture does not measure browse abundance,
but other studies suggest that it influences forage quality and
hence the habitat selection of other large African ungulates
(Stelfox & Hudson, 1986; Lambers et al., 1998; Western
et al., 1999; Vazquez-de-Aldana et al., 2000; supporting
information Appendix S2). Given these relationships, it
makes sense that bongo might prefer mesic sites, as the
available forage is likely to have higher and longer lasting
nutritive value. Additional field evidence also suggests that
the abundance of preferred bongo food plants tends to
increase with structural complexity (unpublished data), thus
areas with both high Vegetation structure and Moisture
values may provide optimal foraging conditions, or
‘core’ habitat, where forage quality is highest and most
persistent.
Historical records and our data indicate that bongo use
bamboo forests (Kingdon, 1982), but our models’ predict
low usage probabilities for this habitat. This is due to
Vegetation structure describing bamboo’s structural simpli-
city relative to other forest types (Estes et al., 2010), meaning
that vegetation-related models predicted lower P (when all
other variables were equal) for bamboo than more complex
woody forests. Assessing Vegetation structure’s influence on
habitat use within particular – rather than across all –
vegetation types could resolve this contradiction, which is
supported by our results showing that bamboo zone bongo
plots occurred in areas of higher occurrence probabilities
relative to their immediate surroundings (see inset boxes in
Fig. 3b., where P for most plots is 0.2–0.6, compared with
0.0–0.2 in the wider neighborhood). However, this step
depends on accurately mapping vegetation types, which is
difficult. Moreover, it is possible that bamboo forests
comprise less suitable bongo habitat than woody forests, as
bamboo suppresses understorey growth over much of its life
cycle (Wimbush, 1945; Schmitt, 1991), thereby reducing the
relative abundance of forage plants. The bamboo zone may
Table 2 The model averaged parameter estimates (�b), unconditional standard errors (SE) and upper and lower 95 per cent confidence limits for the
three composite models: AllMod (average of 31 models), VegMod (average of six models based on non-security predictors) and SecMod (average
of three models based on the two security variables)
Model Intercept
Vegetation
structure Edge Moisture Distance Ruggedness AUC MK ABZ MWW
FullMod�b �9.113 0.060 0.004 0.168 �0.175 0.065 0.892 m 0.21 0.40 1.86a
SE 2.876 0.031 0.005 0.061 0.087 0.013 s 0.24 0.33
Upper �3.476 0.121 0.015 0.287 �0.004 0.090 # 0.03 0.04
Lower �14.750 �0.001 �0.007 0.048 �0.345 0.039 " 0.78 0.92
VegMod�b �6.681 0.085 0.004 0.104 0.766 m 0.28 0.35 0.97
SE 1.457 0.021 0.004 0.046 s 0.19 0.20
Upper �3.826 0.127 0.012 0.194 # 0.04 0.16
Lower �9.536 0.044 �0.004 0.015 " 0.64 0.83
SecMod�b �3.651 �0.237 0.060 0.873 m 0.10 0.21 1.58
SE 0.820 0.069 0.011 s 0.05 0.15
Upper �2.045 �0.101 0.082 # 0.04 0.04
Lower �5.258 �0.374 0.037 " 0.17 0.46
a(Po0.1).
The AUCs based on predicted probabilities (P) of the averaged models are presented, as well as the mean (m), standard deviation (s), minimum
( # ) and maximum ( " ) of P at Mount Kenya (MK) and Aberdares Bamboo Zone (ABZ) bongo plots. MWW is the Mann–Whitney–Wilcoxon Z
score approximation for tests between MK and ABZ means, and its associated significance code.
Animal Conservation ]] (2011) 1–12 c� 2011 The Authors. Animal Conservation c� 2011 The Zoological Society of London6
Modeling to support bongo recovery L. D. Estes et al.
thus support lower bongo densities than woody forests, or
serve primarily as a dry season refugium, when it benefits
from high altitude, mist-derived moisture that is not re-
ceived in the lower woody forests (Kingdon, 1982).
Edge density was less influential than expected. Previous
work suggested that bongo prefer mosaic habitats (King-
don, 1982), and that both patch- and micro-scale vegetation
structure influence bongo habitat use (Estes et al., 2008). We
thus expected Edge to be a stronger predictor. Although
Edge’s presence in four models of the 96% confidence
set (Table 1) suggests a non-negligible influence, here we
found that the finer-scaled vegetation variables were most
important.
Based on these findings, the full composite model (Full-
Mod) identified the realized niche (Austin, Nicholls &
Margules, 1990) of a population striving to simultaneously
avoid predation pressure and find suitable foraging condi-
tions. These constraints mean that o20% of either moun-
tain’s forests are currently well suited for bongo. VegMod,
which did not incorporate security-related variables, pre-
dicted occurrence in places currently avoided by bongo due
to human activity (e.g. in lower forests far from KWS
security bases). Although it effectively segregated bongo
and non-presence observations, SecMod was unrealistic
because it ignored vegetation-related requirements, leading
it to delineate all rugged places as suitable bongo habitat,
even non-forested areas that bongo would not use.
Model performance
Modeling rare species is difficult because sample sizes are
usually small and subject to substantial errors, such as non-
independence due to spatial clustering (Guisan & Zimmer-
mann, 2000; Rushton et al., 2004). Our bongo sample set
was small and appears clustered, but was comparable in size
to those used in other rare-species studies (e.g. Gibson et al.,
2004; Jeganathan et al., 2004), and largely independent
according to temporal criteria (Dunn, 1978; Estes et al.,
2008; supporting information Appendix S1), while model
bias due to potentially autocorrelated points was negligible
(supporting information Appendix S3). The dung sample
mitochondrial DNA analysis allowed us to identify field
identification errors and helped exclude false or potentially
misidentified bongo observations that would have con-
founded our models (Estes et al., 2008; Faria et al., 2011;
supporting information Appendix S1). A comparison of
ordinary logistic regression and occupancy models run with
simulated detection probabilities showed that our estimated
DP of 0.88 would reduce P downwards by 0.02 at most,
suggesting that missed detections did not unduly bias our
results (supporting information Appendix S1).
These checks improved confidence in results, but the
methods used to construct the checks could have error. For
example, if the true detection probability was substantially
lower (e.g. 0.61) than we estimated, our models could have
under-predicted P by up to 0.1 (supporting information
Figure S3).
Our predictors are also sources of potential model bias, as
shown by our model transferability assessments. Effective
PDMs must be transferable between habitats, but this
property may be compromised by several factors, including
over-parameterization and spatio-temporal variation in spe-
cies–environment relationships (Guisan & Zimmermann,
2000; Vaughan & Ormerod, 2005). Bootstrapping revealed
that models were not over-fit (Vaughan & Ormerod, 2005),
P
0
5
10
15
20
25
30
35
0.1 0.2 0.3 0.4 0.5 0.6 0.7 0.8 0.9 10
0.1
0.2
0.3
0.4
0.5
0.6
0.7
0.8
0.9
1
0
5
10
15
20
25
30
0.1 0.2 0.3 0.4 0.5 0.6 0.7 0.8 0.9 10
0.1
0.2
0.3
0.4
0.5
0.6
0.7
0.8
0.9
1
0
5
10
15
20
25
30
35
40
45
0.1 0.2 0.3 0.4 0.5 0.6 0.7 0.8 0.9 10
0.1
0.2
0.3
0.4
0.5
0.6
0.7
0.8
0.9
1
fn
Figure 2 The distributions of occurrence probabilities (P) predicted by
the FullMod (top), VegMod (middle) and SecMod (bottom) models for
bongo presence [white columns=Aberdares; striped=Mount Kenya
(MK)] and non-presence (black columns) observations. Lines indicate
the false absence frequencies (f) at each P threshold for all Aberdares
(solid), Aberdares bamboo zone (dashed) and MK bongo plots
(dotted).
Animal Conservation ]] (2011) 1–12 c� 2011 The Authors. Animal Conservation c� 2011 The Zoological Society of London 7
Modeling to support bongo recoveryL. D. Estes et al.

but MK observations, although few and confined to one
habitat type, showed that the modeled species-habitat rela-
tionship varied between mountains. Bongo habitat associa-
tions should not differ greatly between the Aberdares and
MK, which are geographically, climatically and floristically
close. The limited transferability of some models is instead
related to between-mountain variations in certain predic-
tors’ environmental associations, particularly those of Rug-
gedness, the strongest but most locally biased predictor. This
bias was due to the relative gentleness of MK’s terrain
relative to the Aberdares’. Model coefficients thus under-
estimated the ruggedness effect for MK, resulting in low P
for bongo observations collected in terrain that in fact is
relatively steep (the southern cluster in Fig. 3a inset). This
result highlights the inherent local bias of indirect topo-
graphic predictors (Guisan & Zimmermann, 2000), and is
underscored by VegMod’s better fit to MK plots, due to the
dominance of Vegetation structure and Moisture, which
are more directly related to habitat use, while their under-
lying derivation methods are also more transferrable (Aus-
tin, 2007; Estes et al., 2010). Replacing Ruggedness (and
Distance) with a variable quantifying predation risk could
potentially increase model transferability.
Vegetation structure error also impacted between-moun-
tain model predictions. Unlike the Aberdares, the imagery
used to cover MK showed temporal variation (e.g. phenol-
ogy and solar illumination) that increased brightness values
in certain places (particularly around bongo samples),
Probability of occurrence Main maps
Inset maps
(a)
(b)
0.0 – 0.20.2 – 0.50.5 – 0.80.8 – 1
0.0 – 0.10.1 – 0.20.2 – 0.40.4 – 0.60.6 – 1.0
Figure 3 Bongo occurrence probabilities for the
Aberdares (left) and Mount Kenya (right), as
predicted by the FullMod (a) and VegMod (b)
models. The inset boxes focus on Aberdares
bamboo zone and Mount Kenya (black fill de-
notes no data) bongo plots (black circles with
white fill).
Animal Conservation ]] (2011) 1–12 c� 2011 The Authors. Animal Conservation c� 2011 The Zoological Society of London8
Modeling to support bongo recovery L. D. Estes et al.

causing Vegetation structure, and thus P, to be underesti-
mated. The effect on model transferability was nevertheless
minor compared with Ruggedness-based models, given the
similarity between VegMod’s ABZ and MK mean P values
and estimates of habitat suitability on both mountains
(Figs 3 and 4).
Moisture, a topographic index, may account for �50% of
the variance in measured soil moisture (Western et al., 1999),
while the correlation strength between soil moisture and
forage quality is not known. Constructing models that predict
the quality and abundance of preferred browse species is a
logical next step, if additional data become available.
All but the last three individual models had adequate-to-
good predictive ability, but showed high model selection
uncertainty (AUCZ0.73; Table 1), meaning that the rank-
ing of the ‘best’ model can change given new data (Burnham
& Anderson, 2002). To avoid this model selection bias, we
averaged models to predict bongo habitat distribution
according to the three habitat use hypotheses. The relation-
ship described by VegMod was more general to both
habitats, but FullMod provided a ‘truer’ representation of
bongo habitat use in an environment with substantial
predation risk. Both models likely underestimated the extent
of suitable bongo habitat, because they did not consider
seasonal variations in use. These models instead identified
what should be core bongo habitat suitable for the longest
periods. Developing direct measures of predation risk and
bongo food plant abundance, using a block effect to account
for structural complexity differences within vegetation
types, and sourcing better RS imagery for MK could
improve them.
Management implications
Despite FullMod’s reduced performance onMK, we believe
it is nevertheless useful – and most relevant – for informing
bongo recovery plans. Management actions should be
focused where FullMod shows the greatest extent of suitable
habitat, based on a high P threshold to ensure that high
quality habitat is identified, thereby improving the odds of
success (Pearce & Ferrier, 2000). In the Aberdares, popula-
tion recovery may be best achieved by concentrating anti-
poaching efforts in the two or three largest blocks where
P40.5–0.7 (e.g. in the north-western patch in Fig. 3a.). On
MK, potential bongo reintroduction sites can be located
using thresholds lowered to 0.3–0.4 to accommodate All-
Mod’s poorer fit. Here results suggest a site on the western
side of the mountain would be most suitable (Fig. 3a).
The suite of individual validated models could also be
used to test different management goals. For instance, if cost
constraints prevent the extension of protective measures to
new areas, Model 17 (Vegetation structure+Moisture+
Distance) could identify areas with optimal microhabitat
conditions close to existing KWS bases.
Bongo surveys need to be continued at a broad scale
throughout MK and the Aberdares, and should be targeted
using FullMod. VegMod offers insight into overall habitat
availability, and may help in estimating potential bongo popu-
lation sizes as demographic information becomes available.
General implications
Besides providing important basic ecological information
for this poorly understood animal, our study may help
explain habitat use by other large forest herbivores –
particularly the more widely spread lowland bongo (Trage-
laphus eurycerus eurycerus) of Central and West Africa – as
it presents a means to improve rare species modeling. Our
RS techniques for vegetation-structure mapping improve on
those typically used by ecologists (Estes et al., 2008, 2010),
allowing us to incorporate crucial microhabitat features in
the multi-scale models, and augment sample size. The
layered validation approach (mtDNA confirmation of ob-
servations; internal and external model performance assess-
ments) builds on recent well-recognized rare-species
modeling studies (e.g. Gibson et al., 2004; Jeganathan
et al., 2004). Such generalizable, multi-level methodologies
are increasingly needed to guide the management and
recovery of rare species and ecosystems, where ecological
data are difficult to obtain and swift conservation action
must be based upon best-available inferences.
Acknowledgements
We are extremely grateful to the following individuals for
their assistance: J. Warutere, A. Kahihia, C. Wambani, J.
0100200300400500600700800900
10001100
00.10.20.30.40.50.60.70.80.91
0100200300400500600700800900
100011001200130014001500
0.1 0.2 0.3 0.4 0.5 0.6 0.7 0.8 0.9 100.10.20.30.40.50.60.70.80.91K
m2
Proportion of total P
Figure 4 The area (km2) habitat on the Aberdares (top) and Mount
Kenya (bottom) falling into suitability classes [based on occurrence
probability (P) deciles] generated by the FullMod (black columns),
VegMod (white columns), and SecMod (striped columns) models.
Lines indicate the proportions of the two study areas falling below each
P threshold (FullMod=solid; VegMod=dashed; SecMod=dotted).
Animal Conservation ]] (2011) 1–12 c� 2011 The Authors. Animal Conservation c� 2011 The Zoological Society of London 9
Modeling to support bongo recoveryL. D. Estes et al.

Gichohi, Aberdares and MK National Parks rangers, R.
Bagine and S. Kasiki (KenyaWildlife Service); M. Prettejohn,
J. Kariuki,M. Gichuri, K. Gichuri, B. Nderitu, P. Mwangi, S.
Gichure, L. Kariuki and J. Korage (Bongo Surveillance
Project); J. Bishop (University of Cape Town); D. Kavembe,
J. Jung’a and C. Kimwele (University of Nairobi); K. Dunbar,
P. Faria and M. Bruford (Cardiff University); C. Church
(Rhino Ark); O. Hanotte and D. Adhoch (International
Livestock Research Institute); C. Lambrechts (United Na-
tions Environmental Programme); J. Porter, D. Richardson,
R. Davis, D. Carr, H. Wilbur and A. Estes (University of
Virginia); R. Estes; J. and H. Henley; F. Maina; C. Babault;
A. Babault; L. and B. Niskanen. Research funding was
provided by: NASA Headquarters (Earth System Science
Fellowship Grant NNG05GR43 H); Wildlife Conservation
Society (Conservation Research Fellowship); Explorers Club
Washington Group; University of Virginia.
References
Adams, J.B., Smith, M.O. & Gillespie, A.R. (1989). Simple
models for complex natural surfaces: a strategy for the
hyperspectral era of remote sensing. Proceedings of the
International Geoscience and Remote Sensing Symposium
(IGARSS’89) 12th Canadian Symposium on Remote
Sensing, 10–14 July 1989, Vancouver: 16–21
Allison, P.D. (1999). Logistic regression using the SAS system:
theory and application. Cary: SAS Institute.
Austin, M.P. (2007). Species distribution models and ecologi-
cal theory: a critical assessment and some possible new
approaches. Ecol. Model. 200, 1–19.
Austin, M.P., Nicholls, A.O. & Margules, C.R. (1990).
Measurement of the realized qualitative niche: environ-
mental niches of five eucalyptus species. Ecol. Monogr. 60,
161–177.
Bowkett, A., Plowman, A., Stevens, J., Davenport, T. & van
Vuuren, B. (2009). Genetic testing of dung identification
for antelope surveys in the Udzungwa Mountains, Tanza-
nia. Conserv. Genet. 10, 251–255.
Buij, R., McShea, W.J., Campbell, P., Lee, M.E., Dallmeier,
F., Guimondou, S., Mackaga, L., Guisseougou, N.,
Mboumba, S., Hines, J.E., Nichols, J.D. & Alonso, A.
(2007). Patch-occupancy models indicate human activity as
major determinant of forest elephant Loxodonta cyclotis
seasonal distribution in an industrial corridor in Gabon.
Biol. Conserv. 135, 189–201.
Burnham, K.P. & Anderson, D.R. (2002).Model selection and
multimodel inference. 2nd edn. New York: Springer-Verlag.
Bussmann, R.W. (1994). The forests of Mount Kenya: vegeta-
tion, ecology, destruction and management of a tropical
mountain forest ecosystem. Doctorate Edition. Bayreuth:
Universitat Bayreuth.
Butynski, T.M. (1999). Aberdares National Park and Aber-
dares Forest Reserves wildlife fence placement study and
recommendations. A Report for the Kenya Wildlife Service
and the Kenya Forest Department, Zoo Atlanta, Atlanta
Caro, T.M. & O’Doherty, G. (1999). On the use of surrogate
species in conservation biology. Conserv. Biol. 13, 805–814.
Ceballos, G. & Ehrlich, P.R. (2002). Mammal population
losses and the extinction crisis. Science 296, 904–907.
Dunn, J.E. (1978). Optimal sampling in radio telemetry
studies of home range. In Time series and ecological
processes: proceedings of a SIMS conference: 53–70.
Shugart, H.H. (Ed). Alta: Society for Industrial and
Applied Mathematics.
East, R. (1999). African antelope database 1998. Gland:
IUCN.
Ebenhard, T. (1995). Conservation breeding as a tool for
saving animal species from extinction. Trends Ecol. Evol.
10, 438–443.
Efron, B. (1983). Estimating the error rate of a prediction rule:
improvement on cross-validation. J. Am. Stat. Assoc. 78,
316–331.
Estes, L.D., Okin, G., Mwangi, A. & Shugart, H.H. (2008).
Habitat selection by a rare forest antelope: a multi-scale
approach combining field data and imagery from three
sensors. Remote Sens. Environ. 112, 2033–2050.
Estes, L.D., Reillo, P.R., Mwangi, A.G., Okin, G.S. &
Shugart, H.H. (2010). Remote sensing of structural com-
plexity indices for habitat and species distribution model-
ing. Remote Sens. Environ. 114, 792–804.
Faria, P.J., Kavembe, G.D., Junga,, J.O., Kimwele, C.N.,
Estes, L.D., Reillo, P.R., Mwangi,, A.G. & Bruford, M.W.
(2011). The use of non-invasive molecular techniques to
confirm the presence of mountain the presence of mountain
bongo Tragelaphus eurycerus isaaci populations in Kenya
and preliminary inference of their mitochondrial genetic
variation. Conserv. Genet. (Online DOI: 10.1007/s10592-
011-0181-5.
Fielding, A.H. & Bell, J.F. (1997). A review of methods for the
assessment of prediction errors in conservation presence/
absence models. Environ. Conserv. 24, 38–49.
Fischer, F. & Linsenmair, K.E. (2007). Changing social
organization in an ungulate population subject to poaching
and predation – the kob antelope (Kobus kob kob) in the
Comoe National Park, Cote d’Ivoire. Afr. J. Ecol. 45,
285–292.
Gathaara, G.N. (1999). Aerial survey of the destruction of
Mount Kenya, Imenti, and Ngare Ndare Forest Reserves.
Nairobi: Kenya Wildlife Service.
Gibson, L.A., Wilson, B.A., Cahill, D.M. & Hill, J. (2004).
Spatial prediction of rufous bristlebird habitat in a coastal
heathland: a GIS-based approach. J. Appl. Ecol. 41,
213–223.
Griffith, B., Scott, J.M., Carpenter, J.W. & Reed, C. (1989).
Translocation as a species conservation tool – status and
strategy. Science 245, 477–480.
Guisan, A. & Thuiller, W. (2005). Predicting species distribu-
tion: offering more than simple habitat models. Ecol. Lett.
8, 993–1009.
Guisan, A. & Zimmermann, N.E. (2000). Predictive habitat
distribution models in ecology. Ecol. Model. 135, 147–186.
Animal Conservation ]] (2011) 1–12 c� 2011 The Authors. Animal Conservation c� 2011 The Zoological Society of London10
Modeling to support bongo recovery L. D. Estes et al.

Harrell, F.E. (2005). The Design Package 2.0. For S-PLUS.
Nashville: Vanderbilt University.
Hilborn, R., Arcese, P., Borner, M., Hando, J., Hopcraft, G.,
Loibooki, M., Mduma, S. & Sinclair, A.R.E. (2006). Effec-
tive enforcement in a conservation area. Science 314, 1266.
Hosmer, D.W. & Lemeshow, S. (1989). Applied logistic
regression. New York: Wiley.
Imbernon, J. (1999). Pattern and development of land-use
changes in the Kenyan Highlands since the 1950s. Agr.
Ecosyst. Environ. 76, 67–73.
Jeganathan, P., Green, R.E., Norris, K., Vogiatzakis, I.N.,
Bartsch, A., Wotton, S.R., Bowden, C.G.R., Griffiths,
G.H., Pain, D. & Rahmani, A.R. (2004). Modelling habitat
selection and distribution of the critically endangered
Jerdon’s courser Rhinoptilus bitorquatus in scrub jungle: an
application of a new tracking method. J. Appl. Ecol. 41,
224–237.
Kingdon, J. (1982). East African mammals: an Atlas of
evolution in Africa. New York: Academic Press.
Klaus-Hugi, C., Klaus, G., Schmid, B. & Konig, B. (1999).
Feeding ecology of a large social antelope in the rainforest.
Oecologia 119, 81–90.
Kock, R.A., Wambua, J.M., Mwanzia, J., Wamwayi, H.,
Ndungu, E.K., Barrett, T., Kock, N.D. & Rossiter, P.B.
(1999). Rinderpest epidemic in wild ruminants in Kenya
1993–97. Vet. Rec. 145, 275–283.
Lambers, H., Chapin, F.S. & Pons, T.L. (1998). Plant
physiological ecology. New York: Springer-Verlag.
Lambrechts, C., Woodley, B., Church, C. & Gachanja, M.
(2003). Aerial survey of the destruction of the Aberdare
Range forests. Report by UNEP, KWS, Rhino Ark, and
KFWG. UNEP, Nairobi, Kenya
Laurance, W.F., Croes, B.M., Tchignoumba, L., Lahm, S.A.,
Alonso, A., Lee, M.E., Campbell, P. & Ondzeano, C.
(2006). Impacts of roads and hunting on Central African
rainforest mammals. Conserv. Biol. 20, 1251–1261.
Leader-Williams, N. & Albon, S.D. (1988). Allocation of
resources for conservation. Nature 336, 533–535.
Lingle, S. (2002). Coyote predation and habitat segregation of
white-tailed deer and mule deer. Ecology 83, 2037–2048.
MacKenzie, D.I. (2006). Modeling the probability of resource
use: the effect of, and dealing with, detecting a species
imperfectly. J. Wildl. Mgmt. 70, 367–374.
Manis, G., Lowry, J. & Ramsey, R.D. (2001). Preclassifica-
tion: an ecologically predictive landform model. Gap Anal.
Bull. 10, 11–12.
McGarigal, K., Cushman, S., Neel, M. & Ene, E. (2002).
FRAGSTATS: spatial pattern analysis program for
categorical maps. Computer software program produced
by the authors at the University of Massachusetts,
Amherst. Avaialable at http://www.umass.edu/landeco/
research/fragstats/fragstats.html (accessed 15 August
2008).
Mooring, M.S., Fitzpatrick, T.A., Nishihira, T.T. & Reisig,
D.D. (2004). Vigilance, predation risk, and the allee effect
in Desert Bighorn Sheep. J. Wildl. Mgmt. 68, 519–532.
Parker, A. (1982). The topographic relative moisture index:
an approach to soil-moisture assessment in mountain
terrain. Phys. Geogr. 3, 160–168.
Pearce, J. & Ferrier, S. (2000). Evaluating the predictive
performance of habitat models developed using logistic
regression. Ecol. Model. 133, 225–245.
Pierce, B.M., Bowyer, R.T. & Bleich, V.C. (2004). Habitat
selection by mule deer: forage benefits or risk of predation?
J. Wildl. Mgmt. 68, 533–541.
Prettejohn, M. (2004). Encounters with the bongo. Swara 27,
28–30.
Prettejohn, M. (2008). On the trail of the Mountain Bongo.
Swara 31, 39–45.
Reillo, P. (2002). Repatriation of Mountain Bongo to Kenya.
Antelope Spec. Group Gnusletter 21, 11–15.
Reillo, P.R. (2004). Repatriation of the Mountain Bongo
Antelope to Mt. Kenya World Heritage Site. Internal
Report of the Rare Species Conservatory Foundation.
Available at http://www.RareSpecies.org
Rhino Ark. (2010). Projects. Available at http://www.
rhinoark.org/projects.htm
Riley, S., DeGloria, S. & Elliot, R. (1999). A terrain
ruggedness index that quantifies topographic heterogene-
ity. Intermountain J. Sci. 5, 23–27.
Rubin, E.S., Boyce, W.M., Stermer, C.J. & Torres, S.G.
(2002). Bighorn sheep habitat use and selection
near an urban environment. Biol. Conserv. 104,
251–263.
Rushton, S.P., Ormerod, S.J. & Kerby, G. (2004). New
paradigms for modelling species distributions? J. Appl.
Ecol. 41, 193–200.
Sarrazin, F. & Barbault, R. (1996). Reintroduction: chal-
lenges and lessons for basic ecology. Trends Ecol. Evol. 11,
474–478.
Schmitt, K. (1991). The vegetation of the Aberdare National
Park, Kenya. Band 7: 1–250. Innsbruck: Universitatsverlag
Wagner.
Stanley-Price, M.R. (1969). The Bongo of the Cherangani
Hills. Oryx 10, 108–111.
Stelfox, J. & Hudson, R. (1986). Body condition of male
Thomson’s and Grant’s gazelles in relation to season and
resource use. Afr. J. Ecol. 24, 111–120.
Tuceryan, M. & Jain, A.K. (1993). Texture analysis. In
Handbook of pattern recognition and computer vision:
235–276. Chen, C.H., Pau, L.F. & Wang, P.S.P. (Eds).
River Edge: World Scientific Publishing Co. Inc.
Vaughan, I.P. & Ormerod, S.J. (2003). Improving the quality
of distribution models for conservation by addressing
shortcomings in the field collection of training data. Con-
serv. Biol. 17, 1601–1611.
Vaughan, I.P. & Ormerod, S.J. (2005). The continuing chal-
lenges of testing species distribution models. J. Appl. Ecol.
42, 720–730.
Vazquez-de-Aldana, B., Garcıa-Ciudad, A., Perez-Corona,
M. & Garcıa-Criado, B. (2000). Nutritional quality of
semi-arid grassland in western Spain over a 10-year period:
Animal Conservation ]] (2011) 1–12 c� 2011 The Authors. Animal Conservation c� 2011 The Zoological Society of London 11
Modeling to support bongo recoveryL. D. Estes et al.

changes in chemical composition of grasses, legumes and
forbs. Grass Forage Sci. 55, 209–220.
Western, A.W., Grayson, R.B., Bloschl, G., Willgoose, G.R.
& McMahon, T.A. (1999). Observed spatial organization
of soil moisture and its relation to terrain indices.Water
Resour. Res. 35, 797–810.
Wimbush, S.H. (1945). The African alpine bamboo. Emp.
For. J. 24, 23–39.
Supporting Information
Additional Supporting Information may be found in the
online version of this article:
Table S1. Basic statistics.
Table S2. Full model results.
Appendix S1. Survey data details.
Appendix S2. Remote sensing methodology.
Appendix S3. Habitat modeling techniques.
As a service to our authors and readers, this journal
provides supporting information supplied by the authors.
Such materials are peer-reviewed and may be re-organized
for online delivery, but are not copy-edited or typeset.
Technical support issues arising from supporting informa-
tion (other than missing files) should be addressed to
the authors.
Animal Conservation ]] (2011) 1–12 c� 2011 The Authors. Animal Conservation c� 2011 The Zoological Society of London12
Modeling to support bongo recovery L. D. Estes et al.