prediction of strength development in stabilized sandy ... · presented in tablethe soil is san. 1....
TRANSCRIPT

Abstract— Construction on soft ground poses many problems
due to low shear strength, differential settlement, construction pore pressure development etc. It has been challenging task to improve the soft grounds. The increased land use pattern has put pressure to develop techniques for ground improvement of soft soil deposits. The ground improvement techniques are generally based on densification, inclusion of reinforcement, cementation and provision of drainage etc. Generally lime and cement are widely used to improve soft clays having high water content and compressibility. In this paper, an attempt is made to identify the critical factors governing the strength development of sandy clay soil stabilized with additives. It is found that the clay-water/additive ratio i.e., Wc/A is the prime parameter controlling the strength development when the liquidity index varies between 1 and 2. Based on this parameter and Abram’s law, the strength prediction equation for various curing times and combinations of clay water content & additive content is proposed and verified. This will help to minimize the number of trials necessary to arrive at the quantity of cement to be admixed.
Keywords— Soft sandy clay, Clay-water/cement ratio, Clay-water/lime ratio, Clay-water/(lime+cement) ratio, Low-swelling clayey soil, Unconfined compression strength test.
I. INTRODUCTION OFT ground generally has high initial water content greater than optimum moisture content and close to its
liquid limit and poses severe construction problems due to low bearing capacity, total and differential settlements and excessive seepage. The land reclamation projects in coastal areas uses dredged soft soil as reclamation material. The adverse effects of increased moisture content are a concern for the geotechnical engineers. The replacement of such problematic soil is not always feasible. Several ground improvement techniques such as densification, cementation, reinforcement and drainage are attempted to mitigate the problems of soft ground. The additive technique has gained popularity and is widely used to improve the mechanical behaviour. Additives such as cement, lime and fly ash are the most common types of stabilizers used to improve the mechanical behaviour.
Cement stabilization has gained wide acceptance for improving the mechanical behaviour of soft soils with high initial water content. Cement when added to the soft soil modifies the soil in the presence of water. In order to economize, lime and fly ash can also be used in combination with cement. Cement stabilization depends on cement content, water content, degree of compaction and initial moulding water content [2], [3], [7]-[16], [19]. References [4], [5] and many others have brought out the effect of water content and
cement content on strength development.
Many constitutive models have been developed for strength prediction based on compression and shear behaviour [7], [18]-[20]. The Abram’s law [1] based on the ratio of free water content to cement content is extensively used for predicting the strength of concrete. In soils, strength is found to be independent of the absolute contents of free water and cement content in the mix. References [8], [9] and [14] have identified the clay-water/cement ratio (Wc/C) as a critical parameter influencing strength development in cement stabilized clays. It is believed that clay water content reflects the microfabric and the cement content influences the level of bonding of that fabric. Based on this parameter and Abrams' law [1], Horpibulsuk et al. [10] have revealed that for a given set of cement admixed clays, the strength development depends only on the clay-water/cement ratio (Wc/C). A generalized equation was proposed for predicting laboratory strength development in cement admixed clays at various water & cement contents and curing period.
Extending this analogy to the behaviour of soil stabilization [8], [9], [14] the clay water to cement ratio has been identified as the controlling parameter for strength gain and generalized prediction equation [10], [20] have been developed. The effect of different stabilizing agents used is different for soft soils. For the effective application of the stabilizing techniques in the field and to use proper mix proportions, it is necessary to have a basic understanding of the strength development in the form of laboratory tests on soft clays admixed with stabilizing agents. In the present work, it is intended to study the effect of cement and lime as stabilizing agents for stabilization of sandy clay at high water contents and develop methods to predict the strength. The experimental results for the strength development of cement, lime and lime+cement stabilized soft sandy clay are reported in terms of cement content, curing period and clay water to cement ratio. Based on Abraham’s law, predictive equations for strength development are proposed on the lines of Horpibulsuk et. al [15].
II. EXPERIMENTAL INVESTIGATIONS
A. Materials Sandy clay soil was collected from a local site from a depth
of 2m below the ground surface from a low lying area which is generally inundated with water during rainy season. Many foundations and road bases have failed in this area. The results of index properties, gradation and standard proctor tests are
Prediction of strength development in stabilized sandy clay at high water contents
Naveena P.C, Mamatha K.H and Dinesh S.V
S
INTERNATIONAL JOURNAL OF GEOLOGY Issue 1, Volume 7, 2013
9

presented in Table. 1. The soil is sandy clay with the group symbol CI. It is a low swelling clayey soil with the free swell ratio less than 1.35. The consistency limits are LL = 45%, PL = 21%, Ip = 24% and its natural water content is 32%. The groundwater level in the field is at 1.0m from the surface. The dry unit weight is 18.54kN/m3 & the in-situ void ratio is 0.85 and the soil was in state of saturated condition. The effective strength parameters in triaxial compression were c′ = 0kPa and φ′ = 22°.
B. Physico-Chemical Properties The Physico-chemical properties were determined as per
standard test procedures. For determining the silica content, 10gms of oven dried soil
was dissolved in concentrated HNO3 and filtered through whatsmans filter paper. The residue was heated in muffle furnace for 24 hours and the residue left gave the silica content in the soil. The filtrate obtained during the above experiment was used to prepare stock solution of 250ml for subsequent experiments.
For 25ml of stock solution 10mg Ammonium chloride and Ammonium hydroxide were added in 1:1 proportion till excess white/reddish brown precipitate appears. The solution was then subjected to centrifuge for 10 minutes and the precipitate was separated. Sodium hydroxide was then added to the residue collected from the filter paper and filtered again. The residue was placed in silica crucible and heated in a muffle furnace till red hot. Iron content was determined by the residue left in the crucible. Ammonium hydroxide was added to the filtrate obtained in the previous step till it forms precipitate and then filtered. The residue along with the filter paper is collected and placed in silica crucible and heated in muffle furnace till red hot. The residue left in the crucible gives the percentage of Aluminum present in the soil.
For 25ml of stock solution 10mg of Ammonium chloride and Ammonium hydroxide (1:1) were added till excess white/reddish brown precipitate appears. The solution was then subjected to centrifuge for 10 minutes. Filtrate was collected and ammonium carbonate was added till white precipitate was formed and then filtered. The residue along with the filter paper is then placed in silica crucible and heated in muffle furnace till red hot. The residue left in the crucible gives the percentage of Calcium present in the soil.
Ammonia was added to the filtrate collected in previous step and filtered. The residue along with the filter paper was then placed in silica crucible and heated in muffle furnace till red hot. The residue left in the crucible gives the percentage of Magnesium present in the soil.
The pH of the soil was determined by the electrometric method as per IS: 2720 (part 26) - 1987. The cation exchange capacity of the soil was determined as per IS: 2720 (Part 24) - 1976. The specific surface area of the soil was determined as per ASTM C837, Methylene blue titration method. The chemical properties of sandy clay soil are reported in Table. 2.
C. Additives Used Ordinary Portland Cement and lime were considered in the
present investigation. The chemical properties of these additives are reported in Table. 3.
Table. 1 Geotechnical properties of Sandy clay soil
Sl. No Property Parameter
values
1 Specific Gravity 2.64 2 Bulk unit weight (kN/m3) 18.54 3 In-situ void ratio 0.85
4
Grain Size Distribution (%) a Gravel - b Sand 64 c Silt 14 d Clay 22
5 Soil Classification
a I.S Soil classification CI
6
Atterberg's Limit (%) a Liquid Limit 45 b Plastic Limit 21 c Plasticity Index 24
7
Compaction Characteristics (Standard Proctor Test)
a OMC (%) 17.28
b Maximum Dry Density (kN/m3) 18.25
Fig. 1 Grain size distribution curve for sandy clay soil
D. Sample preparation Unconfined compressive strength tests (UCS) were
performed on natural and stabilized soil specimens to evaluate the suitability of stabilizers to achieve the target strength. Cement, lime and combination of lime & cement in 1:1 ratio were considered. The soil was sieved through a 2mm sieve to remove pieces of shell and other coarser particles.
INTERNATIONAL JOURNAL OF GEOLOGY Issue 1, Volume 7, 2013
10

Table. 2 Chemical properties of natural sandy clay soil
Table. 3 Chemical properties of additives
Cement treated specimens
Four different water/cement ratios were considered for each stabilizer combinations. The water content was adjusted to a range of liquidity indices (LI), ranging from LL to 2LL. The liquidity index has been used in this investigation as an indicator to refer to the initial water content of the clays in relation to their plasticity characteristics before the cement is admixed. Sandy clay soil was mixed with water content corresponding to the above levels of LI and the samples were thoroughly mixed with the different cement contents (in paste form) to attain the target Wc/C. The target Wc/C values were 5, 10, 15 and 20. The mixing time was arbitrarily fixed at 10 minutes as recommended by Miura et al. (2001). When cement is added to the soil, it absorbs water due to the hydration i.e., the chemical reaction between cement and water. For hydration process, the cement consumes water equal to 40% of its mass (Neville, 1996). This may mask the role of high water content used in the present study. Hence, the cement paste was prepared separately by mixing cement with de-ionized water equal to 0.4 times the mass of cement. Finally, both the soil paste and the cement paste were mixed thoroughly and this uniform paste was transferred to a cylindrical mould of 38mm diameter and 80mm height. The specimens were prepared by placing the stabilizer treated soils at high water content, in
three equal layers into the split mould and gently tapping it on a rubber pad to remove the entrapped air. Since high water contents were used in the present study, high vacuum silicon grease was used to prevent any leakage of water from the split mould. The specimens along with the split mould were kept in desiccators for curing. After the specimens gained enough strength, they were taken out of the split mould and once again kept in desiccators for curing. The duration of keeping the specimens along with the split mould depends on the type of soil, initial water content, type of stabilizer and stabilizer content. All the cylindrical samples were carefully wrapped in vinyl bags and they were stored in humid conditions at constant temperature (27±2°C). Cement treated samples were compacted immediately after mixing. For cement treated samples the moulding water content are 1LL, 1.5LL and 2LL. Lime treated specimens
To study the effect of the hydrated lime for stabilization of sandy clay, lime content was varied from 4 to 10%. The unconfined compressive strength specimens of soil lime mixtures were prepared by initially mixing the soil and water to form a soil paste. For lime treated samples the moulding water content are OMC, 0.5LL and 0.75LL. While preparing the specimens of soils treated with hydrated lime for the unconfined compressive strength tests, it was observed that when dry hydrated lime powder was added to the soil, it absorbed the water present in the soil and there was a noticeable change in the consistency of the soil lime mixture. This will interfere with the role of water content in soil stabilization. Therefore, some water was added to lime powder to prepare lime paste. By trial and error, it was found that by using water content equal to 100% weight of lime too much of change was not observed in the consistency of the specimen. Therefore, additional water content required for water lime ratio (lime water content) has been provided in the preparation of specimens. The soil-water and lime-water mixtures were stored in an airtight, waterproof bag for 1-24 hours prior to fabricating the test specimens as per ASTM D5102. Finally both soil paste and lime paste were mixed thoroughly and placed into the split mould. Samples were prepared by static compaction to achieve desired density. The specimens along with the split mould were kept in desiccators for curing. After the specimens gained enough strength, they were taken out of the split mould and once again kept in desiccators for curing. The specimens were cured in desiccators at 100% humidity ensuring the availability of water for cementitious reactions. They were taken out after curing periods of 7, 14 and 28 days and tested.
The untreated soil samples were tested immediately after compaction, whereas the stabilized soil samples were cured in humid conditions till the desired curing periods prior to testing. After the curing period, the samples were soaked in water for one day. Porous stones were placed at the top and bottom of the treated samples which was covered by a membrane in order to prevent the entry of water from the sides. Then the samples were submerged in water bath and allowed to saturate by capillary action for 24 hours. After this,
Parameter Sandy clay soil
SiO2 68.30% Fe2O3 6.20% Al2O3 13.3% CaO 3.10% MgO 7.5%
Others 1.6% pH 7.53
Specific surface area 30m2/gm
Cation exchange capacity
49.35milli equivalence/10
0gm Organic matter 1.86%
Parameter Ordinary Portland Cement
Lime
SiO2 21.7% 2.50% Fe2O3 4.2% 0.40% Al2O3 5.0% _ CaO 63.9% 92.40% MgO 1.2% 1.50%
Others 4% 3.20% pH 13.2 12.4
INTERNATIONAL JOURNAL OF GEOLOGY Issue 1, Volume 7, 2013
11

Table. 4 Experimental program for additive stabilized sandy clay soil compacted at MDD
the samples were air dried for 30 minutes before UCS testing. The rate of vertical displacement in UCS tests was 1mm/min. The tests were carried out until the sample fails or 20% axial strain is achieved. Table. 4 provides the details of experimental investigation. The moulding water content varies from OMC to 2LL and the additive content varies from 2.25% to 18%.
III. RESULTS AND DISCUSSIONS
A. Effect of Cement on the Strength of Sandy Clay Soil at High Water Contents
Mixing cement with soil reduces the liquid limit, plasticity index and the potential for volume change of soils. It increases the shrinkage limit and shear strength. The strength development in cement treated soils is by primary and secondary cementitious reactions in the soil cement matrix.
The primary cementation is by hydration products of Portland cement phases. A variety of different compounds and gels are formed by hydration reaction. A Portland cement particle is a heterogeneous substance, containing tricalcium silicate (C3S), dicalcium silicate (C2S), tricalcium aluminate (C3A) and a solid solution described as tetracalcium alumino – ferrite (C4AF).
Table. 5 shows the results of unconfined compressive strength test on samples stabilized with 2.25 to 18% of cement keeping clay water to cement ratio as constant (20, 15, 10 & 5) and cured for 7, 14, 28 and 56 days at 1.0LL, 1.5LL and 2.0LL water content. It is observed that, the rate of strength development in cement stabilized soils vary depending on the cement contents. The results indicate that, the water content plays an important role as recognized by factor such as water to cement ratio. The strength increases by a factor of 2 to 100
Sl.No.
Stabilizer type
Wc/A Ratio
% of additives
added
Water content
Curing period (Days)
Test condition Type of test
1 Cement (OPC 53 GRADE)
20 2.25
LL 7,14, 28 & 56 Days Soaked
Unconfined Compressive
Strength
15 3.00 10 4.50 5 9.00
20 3.38
1.5LL 7,14, 28 & 56 Days Soaked
Unconfined Compressive
Strength
15 4.50 10 6.75 5 13.50
20 4.50
2LL 7,14, 28 & 56 Days Soaked
Unconfined Compressive
Strength
15 6.00 10 9.00 5 18.00
2 Hydrated Lime
4.32 4
OMC 7,14 & 28 Days Soaked
Unconfined Compressive
Strength
2.88 6 2.16 8 1.73 10 5.63 4
0.5LL 7,14 & 28 Days Soaked
Unconfined Compressive
Strength
3.75 6 2.81 8 2.25 10 8.44 4
0.75LL 7,14 & 28 Days Soaked
Unconfined Compressive
Strength
5.63 6 4.22 8 3.38 10
3
Hydrated Lime + Cement
(1:1)
8.64 1+1 OMC 7,14 & 28
Days Soaked Unconfined
Compressive Strength 4.32 2+2
11.25 1+1 0.5LL 7,14 & 28
Days Soaked Unconfined
Compressive Strength 5.63 2+2
16.88 1+1 0.75LL 7,14 & 28
Days Soaked Unconfined
Compressive Strength 8.44 2+2
INTERNATIONAL JOURNAL OF GEOLOGY Issue 1, Volume 7, 2013
12

Table. 5 Unconfined compressive strength of cement stabilized sandy clay soil at high water contents
Water content
Wc/C Ratio
Cement content
(%)
UCC strength of untreated
sandy clay soil (kPa)
Unconfined compressive strength (kPa) Ratio of strength increase
7 Days 14Days 28Days 56Days 7/0 28/0 56/0
1LL
20 2.25
21.00
52.84 76.46 199.16 210.06 2.52 9.48 10.00 15 3 76.60 145.30 210.60 270.10 3.65 10.03 12.86 10 4.5 395.56 500.50 890.14 1074.53 18.84 42.39 51.17 5 9 674.78 840.73 1280.03 1496.30 32.13 60.95 71.25
1.5LL
20 3.38
14.00
50.56 72.16 120.30 160.46 3.61 8.59 11.46 15 4.5 85.12 120.10 165.90 230.45 6.08 11.85 16.46 10 6.75 250.15 327.68 500.60 790.35 17.87 35.76 56.45 5 13.5 425.40 610.60 1050.56 1276.44 30.39 75.04 91.17
2LL
20 4.5
10.50
48.67 73.29 103.25 145.97 4.64 9.83 13.90 15 6 54.24 110.32 150.61 164.54 5.17 14.34 15.67 10 9 104.60 189.75 359.38 492.89 9.96 34.23 46.94
5 18 152.55 271.54 732.62 1076.35 14.53 69.77 102.5
1
Table. 6 Rate of UCS strength for different cement content and curing periods
Water content
Wc/C Ratio
Cement content
(%)
Rate of strength gain (kPa per day)
0 to 7 days 7 to 14 days 14 to 28 days 28 to 56 days
LL
20 2.25 4.55 3.37 8.76 0.39 15 3.00 7.94 9.81 4.66 2.13 10 4.50 53.51 14.99 27.83 6.59 5 9.00 93.40 23.71 31.38 7.72
1.5LL
20 3.38 5.22 3.09 3.44 1.43 15 6.75 10.16 5.00 3.27 2.31 10 13.50 33.74 11.08 12.35 10.35 5 9.00 58.77 26.46 31.43 8.07
2LL
20 4.50 5.45 3.52 2.14 1.53 15 6.00 6.25 8.01 2.88 0.50 10 9.00 13.44 12.16 12.12 4.77 5 18.00 20.29 17.00 32.93 12.28
compared to the unstabilized UCS depending on the curing period and cement content.
The rate of strength gain per day is maximum during the first 7 days when the water content is at LL. When water content is 1.5LL, the rate of strength gain is maximum during 7 to 14 days. At any given water content and curing period, the rate of strength gain increases with increase in Wc/C ratio.
Effect of Cement Content Fig. 2 shows the variation of unconfined compressive
strength at different water contents on sandy clay soil stabilized with 2.25 to 18% cement under soaked condition for curing period up to 56 days. The natural soil has a very low value of UCS less than 20kPa under untreated conditions. The
unconfined compressive strength increases from a low value of 20kPa to as high as 1496.3kPa depending on cement content and curing period. It is observed that when the cement content is low, cement (Wc/C = 20 and 15) stabilized sandy clay soil shows very low strength at high water content for 7 days curing period. During this phase the primary reaction components (hydration products) are not formed fully as the cement content is low when compared to samples prepared at Wc/C ratios of 10 and 5. When the sample contains substantial cement content (Wc/C ratios of 10 and 5) the calcium silicates and calcium aluminates (hydration compounds) are formed and the cement particles bind the adjacent cement grains together during hardening and form a hardened skeleton matrix, which encloses unaltered soil particles. The silicate
INTERNATIONAL JOURNAL OF GEOLOGY Issue 1, Volume 7, 2013
13

and aluminate phases are internally mixed, so it is most likely that none is completely crystalline. When the cement content is sufficiently high, the hydration products induce cementation between the soil particles and the treated sample shows higher strength. In these cases, as the curing period increases alkaline conditions prevail in the pore fluid zone due to dissolution of hydrated lime. The silica and alumina from both clay minerals and amorphous materials on the surface of clay particles get dissolved and which in turn react with the calcium ions from the hydrolysis of cement to form insoluble compounds which hardens when cured to stabilize the soil. When the initial water content is 1LL, a minimum of 5% cement is necessary for a reasonable strength gain of 400kPa. When the initial water contents are more than 1LL (1.5LL and 2LL), very high cement content i.e., more than 10% is required for a minimum strength of 100kPa. The pattern of strength gain is similar in both cases i.e., at 1.5LL and 2LL. When the water content is in excess of LL, the stabilized strength at 7 and 14 days is relatively low even at high cement content mainly because of the increased capillary pore size and lower level of crystalline structure. In these cases, longer curing periods and lower water content to cement ratio are beneficial to attain desired strength to be able to sustain the infrastructure on soft grounds at high water contents corresponding to liquid limit and in excess of liquid limit water contents.
This has clearly brought out the importance of clay water/cement ratio on the strength of cement treated soft soils. The effect of micro fabric [4], [9], [14] also plays a significant role in the development of strength particularly at high water contents due to capillary pore. This depends on both effective stress and liquid limit water content. The pore diameter varies from 200Å up to 10000Å units as the water content increase to liquid limit [14]. This suggests that the micro fabric of sandy clay at high water content depends on the water content. Even at constant cement content of say 4.5%, the strength decreases significantly from 1074kPa to 145kPa as the water content increases from LL to 2LL. This is attributed to increased capillary pore size with increase in water content.
Fig. 2 Variation of unconfined compressive strength of sandy clay soil with cement content for various initial water contents
cured for 7, 14, 28, 56 days
Effect of Curing Period Fig. 3 shows the variation of unconfined compressive
strength with curing period at water contents of 1.0LL, 1.5LL and 2.0LL under soaked condition treated with different cement contents. At lower cement contents (<4.5%) and water contents in excess of liquid limit (i.e., 1.5LL & 2LL), the strength gain is insignificant irrespective of curing period. At high water contents, cement content in excess of 7% and curing periods greater than 7 days yields reasonable strength in excess of 400kPa.
At liquid limit water contents a minimum cement content of 3% and higher curing period of 56 days is necessary to attain a reasonable strength of 270kPa. Cement content in excess of 3% is beneficial and strength gain is significant with increase in curing period.
The UCS variation shows three distinct trends with increase in curing period. The UCS is low at 2.25% and it will attain a strength of 270kPa at 3% cement content cured for 56 days. Similar UCS values can be obtained at higher cement contents with increase in water content. With the addition of 3% cement the unconfined compressive strength increases from 77kPa to 270kPa, with the addition of 4.5% cement the unconfined compressive strength increases from 396kPa to 1075kPa, with the addition of 9% cement the unconfined compressive strength increases from 675kPa to 1496kPa with a curing period of 7 to 56 days.
Fig. 3 Variation of unconfined compressive strength of sandy clay with curing period for various initial water contents and
cement contents
B. Effect of Lime on Unconfined Compressive Strength Soil stabilization occurs when lime is added to a reactive soil
to generate long term strength gain through pozzolanic reactions. These reactions produce stable calcium silicate hydrates and calcium aluminate hydrates as the calcium from the lime reacts with the aluminates and silicates solubilized from the clay. The pozzolanic reaction will continue for a very long period of time, even for decades as long as enough lime is present and the pH remain high (above 10). As a result, lime treatment can produce high and long lasting strength gains. The key to pozzolanic reactivity and stabilization is a reactive soil, a good mix design protocol and reliable construction practices.
INTERNATIONAL JOURNAL OF GEOLOGY Issue 1, Volume 7, 2013
14

A basic understanding of clay mineralogy and proper lime-soil mix that satisfy all cation replacement and exchange reactions and provide enough residual lime for the pozzolanic reactions will ensure development of adequate strength of lime stabilized soils.
In stabilization of soil using lime, quantity of lime plays a major role. The strength of sandy clay soil increases with increase in lime content up to certain limit, then the rate of increase in strength is negligible or even decreases. This lime content is called the optimum lime content for soil. The selection of optimum amount of lime is very important factor both for economical and technical reasons. When excess lime is added, it acts as a filler material resulting in lowering strength. The optimum lime content depends on the clay content of the soil and the reactive silica. The soluble silica increases as the fineness of clay increases and the lime required to completely react with this silica increases. Water content is essential for pozzolanic reaction to produce gelatinous compounds. Effective formation of pozzolanic compounds does not take place when sufficient quantity of water is not available for soil lime reaction. On the other hand, when water is more than required, the soil particle distance increases which lead to lowering of strength because of ineffective binding by pozzolanic reaction compounds. Hence, type of clay and water content present in the system influence the optimum lime content. Thus at optimum moisture content, optimum lime content required for effective stabilization of soil is found to be 3 to 6%. Cylindrical samples were prepared at the respective optimum moisture content and water contents of 0.5LL & 0.75LL for the determination of unconfined compressive strength.
Table. 7 shows the results of unconfined compressive strength test on samples stabilized with 4, 6, 8 & 10% of lime and cured for 7, 14 & 28 days at OMC, 0.5LL & 0.75LL water contents. It is observed that, the rate of strength development in lime stabilized soils vary depending on the range of lime contents. However, the water content also plays an important role as recognized by factor such as water to lime ratio. The data in Table. 8 suggests that the strength gain per day is highest till 7 days and significant till 14 days, however the rate of increase is low between 14 to 28 days.
Fig. 4 shows the variation of unconfined compressive strength with lime content at different initial water contents on samples cured for 7 to 28 days on sandy clay soil specimens stabilized with 4, 6, 8 and 10% lime under soaked condition. UCS values show a general trend of decrease with increase in water content and increase with increase in curing period. The results show a similar trend and the treated assemblies at OMC show higher strength development. There is a linear increase in strength till 4% lime content for 14 & 28 day cured samples and beyond 4% the increase in UCS is marginal. However, for 7 day cured specimens 6% is optimum.
Fig. 5 shows the variation of unconfined compressive strength of lime stabilized sandy clay soil at different water contents obtained from unconfined compressive strength tests on 7, 14 and 28 days cured sandy clay soil stabilized with 4 to 10% lime under soaked condition. The trend of strength increase is similar in all cases. The variation in UCS values is
similar in all cases, the strength increase is significant up to 14 days and beyond 14 days there is decrease in the rate of strength development. The maximum UCS value is 300kPa for 28 day cured sample with initial water content corresponding to OMC.
0
50
100
150
200
250
300
350
0 1 2 3 4 5 6 7 8 9 10 11
Unc
onfin
ed co
mpr
essiv
e st
reng
th (k
Pa)
Lime content (%)
7 Days OMC
7 Days 0.5LL
7 Days 0.75LL
14 Days OMC
14 Days 0.5LL
14 Days 0.75LL
28 Days OMC
28 Days 0.5LL
28 Days 0.75LL
Fig. 4 Variation of unconfined compressive strength of sandy clay with lime content cured for 7, 14, and 28 days at different
moulding water contents
0
50
100
150
200
250
300
350
0 5 10 15 20 25 30
Unc
onfi
ned
com
pres
sive
str
engt
h (k
Pa)
Curing period(Days)
4% Lime OMC
4% Lime 0.5LL
4% Lime 0.75LL
6% Lime OMC
6% Lime 0.5LL
6% Lime 0.75 LL
8% Lime OMC
8% Lime 0.5LL
8% Lime 0.75LL
10% Lime OMC
10% Lime 0.5LL
10% Lime 0.75LL
Fig. 5 Variation of unconfined compressive strength of sandy clay with curing period for different lime contents and
different water contents
C. Effect of Cement and Lime on the Strength of Sandy Clay Soil at High Water Contents
Cement performs the role of a binder material that binds the constituents in soil stabilization. In fine-grained soils a pozzolanic reaction occurs between the calcium hydroxide released from cement during hydration. The soil alumina and silica are the important aspects of soil stabilization process. Cement and lime may be used successfully in stabilizing granular and fine-grained soil as well as aggregate materials due to the presence of calcium hydroxide (lime). Cement and lime have been found to be effective in stabilizing a wide variety of soils including granular materials, silts and clays.
Since lime does not contribute to desired strength, combination of cement and lime are used in 1:1 proportion for additive percentage of 1% and 2% (lime + cement) for water contents varying from OMC, 0.5LL & 0.75LL for curing periods of 7, 14 & 28 days. The cured samples were soaked as
INTERNATIONAL JOURNAL OF GEOLOGY Issue 1, Volume 7, 2013
15
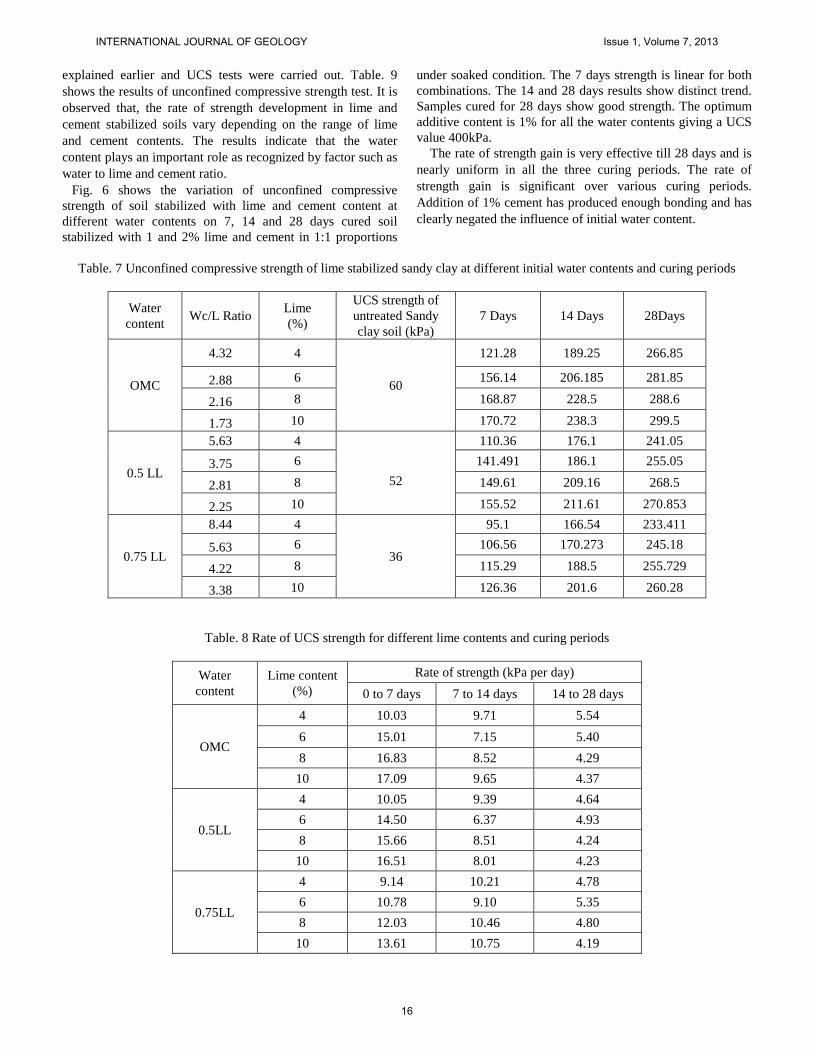
explained earlier and UCS tests were carried out. Table. 9 shows the results of unconfined compressive strength test. It is observed that, the rate of strength development in lime and cement stabilized soils vary depending on the range of lime and cement contents. The results indicate that the water content plays an important role as recognized by factor such as water to lime and cement ratio.
Fig. 6 shows the variation of unconfined compressive strength of soil stabilized with lime and cement content at different water contents on 7, 14 and 28 days cured soil stabilized with 1 and 2% lime and cement in 1:1 proportions
under soaked condition. The 7 days strength is linear for both combinations. The 14 and 28 days results show distinct trend. Samples cured for 28 days show good strength. The optimum additive content is 1% for all the water contents giving a UCS value 400kPa.
The rate of strength gain is very effective till 28 days and is nearly uniform in all the three curing periods. The rate of strength gain is significant over various curing periods. Addition of 1% cement has produced enough bonding and has clearly negated the influence of initial water content.
Table. 7 Unconfined compressive strength of lime stabilized sandy clay at different initial water contents and curing periods
Water content
Wc/L Ratio Lime
(%)
UCS strength of untreated Sandy clay soil (kPa)
7 Days 14 Days 28Days
OMC
4.32 4
60
121.28 189.25 266.85
2.88 6 156.14 206.185 281.85
2.16 8 168.87 228.5 288.6
1.73 10 170.72 238.3 299.5
0.5 LL
5.63 4
52
110.36 176.1 241.05
3.75 6 141.491 186.1 255.05
2.81 8 149.61 209.16 268.5
2.25 10 155.52 211.61 270.853
0.75 LL
8.44 4
36
95.1 166.54 233.411
5.63 6 106.56 170.273 245.18
4.22 8 115.29 188.5 255.729
3.38 10 126.36 201.6 260.28
Table. 8 Rate of UCS strength for different lime contents and curing periods
Water content
Lime content (%)
Rate of strength (kPa per day) 0 to 7 days 7 to 14 days 14 to 28 days
OMC
4 10.03 9.71 5.54 6 15.01 7.15 5.40 8 16.83 8.52 4.29
10 17.09 9.65 4.37
0.5LL
4 10.05 9.39 4.64 6 14.50 6.37 4.93 8 15.66 8.51 4.24
10 16.51 8.01 4.23
0.75LL
4 9.14 10.21 4.78 6 10.78 9.10 5.35 8 12.03 10.46 4.80
10 13.61 10.75 4.19
INTERNATIONAL JOURNAL OF GEOLOGY Issue 1, Volume 7, 2013
16
stabilized with 1% and 2% are being taken from Fig. 4 and are compared with 1:1 & 2:2 lime+cement combination. With this comparison, the strength development with 1% and 2% cement can be determined. It can be concluded that the strength development is more due to cement rather than lime.
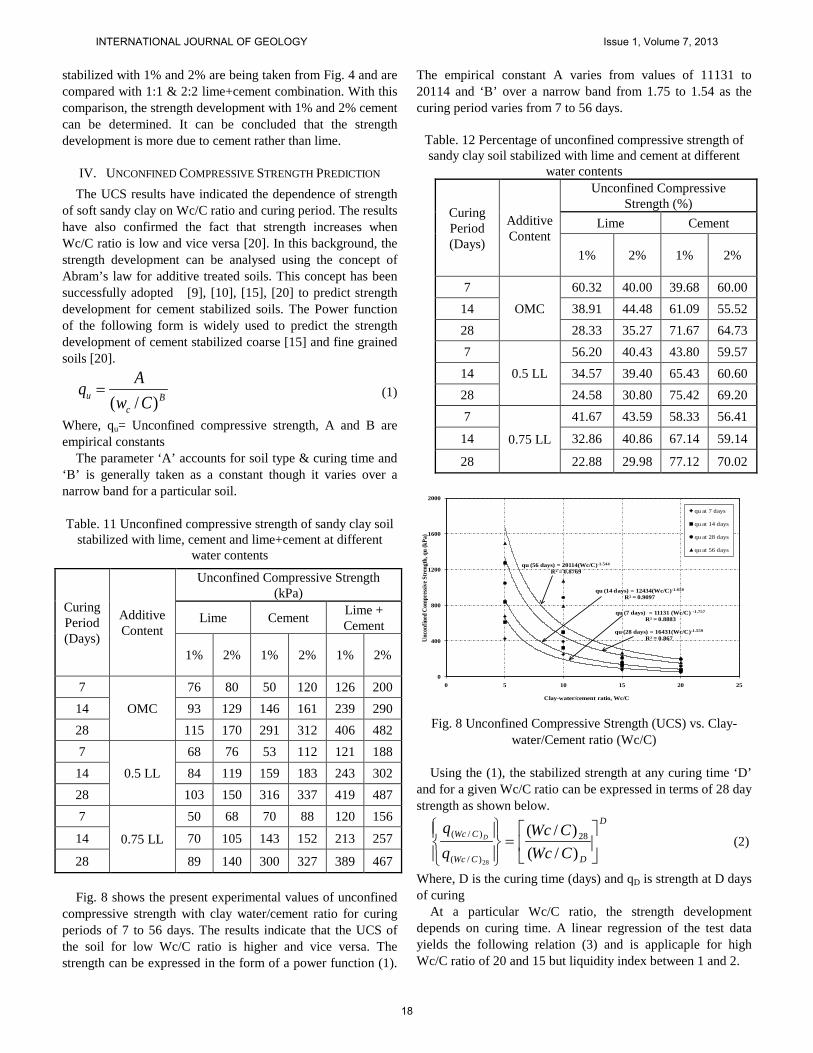
IV. UNCONFINED COMPRESSIVE STRENGTH PREDICTION The UCS results have indicated the dependence of strength
of soft sandy clay on Wc/C ratio and curing period. The results have also confirmed the fact that strength increases when Wc/C ratio is low and vice versa [20]. In this background, the strength development can be analysed using the concept of Abram’s law for additive treated soils. This concept has been successfully adopted [9], [10], [15], [20] to predict strength development for cement stabilized soils. The Power function of the following form is widely used to predict the strength development of cement stabilized coarse [15] and fine grained soils [20].
Bc
u CwAq
)/(=
(1)
Where, qu= Unconfined compressive strength, A and B are empirical constants
The parameter ‘A’ accounts for soil type & curing time and ‘B’ is generally taken as a constant though it varies over a narrow band for a particular soil.
Table. 11 Unconfined compressive strength of sandy clay soil
stabilized with lime, cement and lime+cement at different water contents
Fig. 8 shows the present experimental values of unconfined
compressive strength with clay water/cement ratio for curing periods of 7 to 56 days. The results indicate that the UCS of the soil for low Wc/C ratio is higher and vice versa. The strength can be expressed in the form of a power function (1).
The empirical constant A varies from values of 11131 to 20114 and ‘B’ over a narrow band from 1.75 to 1.54 as the curing period varies from 7 to 56 days.
Table. 12 Percentage of unconfined compressive strength of sandy clay soil stabilized with lime and cement at different
water contents
Curing Period (Days)
Additive Content
Unconfined Compressive Strength (%)
Lime Cement
1% 2% 1% 2%
7 OMC
60.32 40.00 39.68 60.00 14 38.91 44.48 61.09 55.52 28 28.33 35.27 71.67 64.73 7
0.5 LL 56.20 40.43 43.80 59.57
14 34.57 39.40 65.43 60.60 28 24.58 30.80 75.42 69.20 7
0.75 LL
41.67 43.59 58.33 56.41
14 32.86 40.86 67.14 59.14
28 22.88 29.98 77.12 70.02
qu (7 days) = 11131 (Wc/C) -1.757
R² = 0.8883
qu (14 days) = 12434(Wc/C)-1.658
R² = 0.9097
qu (28 days) = 16431(Wc/C)-1.559
R² = 0.867
qu (56 days) = 20114(Wc/C)-1.544
R² = 0.8769
0
400
800
1200
1600
2000
0 5 10 15 20 25
Unc
onfin
ed C
ompr
essiv
e Str
engt
h, q
u (k
Pa)
Clay-water/cement ratio, Wc/C
qu at 7 days
qu at 14 days
qu at 28 days
qu at 56 days
Fig. 8 Unconfined Compressive Strength (UCS) vs. Clay-
water/Cement ratio (Wc/C) Using the (1), the stabilized strength at any curing time ‘D’
and for a given Wc/C ratio can be expressed in terms of 28 day strength as shown below.
D
DCWc
CWc
CWcCWc
D
=
)/()/( 28
)/(
)/(
28
(2)
Where, D is the curing time (days) and qD is strength at D days of curing
At a particular Wc/C ratio, the strength development depends on curing time. A linear regression of the test data yields the following relation (3) and is applicaple for high Wc/C ratio of 20 and 15 but liquidity index between 1 and 2.
Curing Period (Days)
Additive Content
Unconfined Compressive Strength (kPa)
Lime Cement Lime + Cement
1% 2% 1% 2% 1% 2%
7 OMC
76 80 50 120 126 200 14 93 129 146 161 239 290 28 115 170 291 312 406 482 7
0.5 LL 68 76 53 112 121 188
14 84 119 159 183 243 302 28 103 150 316 337 419 487 7
0.75 LL
50 68 70 88 120 156
14 70 105 143 152 213 257
28 89 140 300 327 389 467
INTERNATIONAL JOURNAL OF GEOLOGY Issue 1, Volume 7, 2013
18

2253.02475.028
−= nDqqD (3)
Where, D is the curing time (days) and qD is strength at D days of curing
The generalized interrelationship for strength prediction based on Wc/C and curing period can be expressed as (4) below for cement stabilized sandy clay.
)2253.0ln2475.0()/()/(
54.1
28
)/(
)/(
28
−
=
DCWcCWc
DCWc
CWc D (4)
Where, q(Wc/C)D - strength of cement admixed sandy clay to be estimated at sandy clay-water/cement ratio (Wc/C) after D days of curing q(Wc/C)28 – strength of cement admixed sandy clay at clay-water/cement ratio (Wc/C) after 28 days of curing
The value of B in (4) is determined on trial basis for minimum error in the predicted strength.
Table. 13 shows the experimental results and predicted strength values. The predicted strength values compares well
Table. 13 U.C.S Strength Prediction for Cement treated Sandy clay soil
Water Content
Curing time
Cement content
Clay water content
Clay water/ cement,
Wc/C ratio Laboratory
strength Predicted strength
Percent error qup-
qul/qulx100 days C (%) wc(%) wc/C qul(Kpa) qup(Kpa) (%)
LL
7 2.25 45.00 20.00 52.84 51.05 3.393 14 2.25 45.00 20.00 76.46 85.21 11.449 28 2.25 45.00 20.00 199.16 119.38 40.058 56 2.25 45.00 20.00 210.06 153.55 26.903
1.5LL
7 3.375 67.50 20.00 50.56 51.05 0.964 14 3.375 67.50 20.00 72.16 85.21 18.090 28 3.375 67.50 20.00 120.3 119.38 0.764 56 3.375 67.50 20.00 160.46 153.55 4.308
LL
7 3.00 45.00 15.00 76.6 79.50 3.788 14 3.00 45.00 15.00 145.3 132.71 8.662 28 3.00 45.00 15.00 210.6 185.93 11.716 56 3.00 45.00 15.00 270.1 239.14 11.463
1.5LL
7 4.50 67.50 15.00 85.12 79.50 6.600 14 4.50 67.50 15.00 120.1 132.71 10.503 28 4.50 67.50 15.00 165.9 185.93 12.071 56 4.50 67.50 15.00 230.45 239.14 3.770
Mean Absolute Percent Error, MAPE 10.906
Table. 14 Empirical Constants of Sandy clay Soil stabilized with different additives
Additives Empirical constants
Curing Period (days) Average Values
of A & B
Optimum value of
B for minimum
percentage error
7days 14days 28days 56days
Cement A 5391.9 5945.5 8009.5 8507.3 6963.5 1.54 B 1.55 1.31 1.26 1.18 1.32
Lime A 222.5 268.7 317.9 - 269.7 0.39 B 0.41 0.24 0.10 - 0.25
Lime + Cement
A 352.2 443.5 634.4 - 476.7 0.19 B 0.41 0.24 0.17 - 0.27
with the experimental values and the mean absolute percent error (MAPE) is around 10%. The (4) can be used for strength prediction of cement treated soft sandy clay soil.
Similarly, the strength prediction equations for the sandy
clay soil treated with Lime, Lime+Cement have been developed as mentioned in (5) and (6) respectively. The
INTERNATIONAL JOURNAL OF GEOLOGY Issue 1, Volume 7, 2013
19

optimum value of A and B for different additives are reported in Table. 14. U.C.S Strength Prediction equation for Lime
)2.0ln3.0()/)/(
39.028
)/(
)/(
28
−
=
DLWcLWc
DLWc
LWc D (5)
Where, Wc /L = Clay water – Lime ratio
DLWcq )/( = Strength estimated at a clay- water/lime ratio of
(Wc/L)D
28)/( LWcq = Strength estimated at a clay- water/ lime ratio of
(WC/L)28 D = Curing time(days) qD =strength at D days of curing U.C.C. Strength Prediction equation for Lime+ Cement
)65.0ln51.0())/())/((
19.028
))/((
))/((
28
−
++
=
+
+ DCLWcCLWc
DCLWc
CLWc D (6)
Where, Wc /(L+C) = Clay water/ (Lime+Cement) ratio
DCLWcq ))/(( + = Strength estimated at a clay water/(Lime +
Cement) of (Wc/(L+C))D
28))/(( CLWcq + = Strength estimated at a clay water/ (Lime
+cement) of (WC/(L+C))28 D = Curing period in days qD = Strength at D days of curing
Tables. 15 and 16 show the experimental results and predicted strengths for both lime and lime+cement treated sandy clay soils. The predicted strength values compares well with experimental values and the mean absolute percent error (MAPE) is around 12% and 10% respectively.
Effect of Atterberg Limits on the strength prediction constantants S and B
The parameters S, B and a are listed in Table. 17.
)ln(28
DSaSSD +=
Bc
u CwAq
)/(=
Where, SD is the UCS at curing period D days S28 is the UCS at curing period 28 days A, B, are constants S and B are strength prediction parameters
From the Fig. 9, it is found that the value of parameter ‘S’ varies between 0.2 and 0.3 for clayey soils irrespective of plasticity index (Ip) of soils.
Similarly from Fig. 10, it is found that the value of parameter ‘a’ varies between 0 and 0.1 for CH soils and -0.05 to -0.30 for CM/CI soils irrespective of plasticity index (Ip) of soils.
0
10
20
30
40
50
60
70
80
90
100
0.00 0.10 0.20 0.30 0.40 0.50 0.60 0.70 0.80 0.90 1.00
Plas
ticity
Inde
x (Ip
)
Parameter S
Horpibulsuk S. et al.
Present Study
Narendra B.S. et al.
M.K. Uddin et al
Fig. 9 Strength prediction parameter (S) vs. Plasiticity Index (Ip)
Fig. 10 Strength prediction parameter (B) vs. Plasiticity Index (Ip)
V. CONCLUSIONS The conclusions drawn from this study are summarized
below. With cement stabilization, the unconfined compressive
strength increases by a factor of 2 to 100 depending on the water content, cement content and curing period.
At a particular additive content, the unconfined compressive strength decreases significantly with the increase in water content and this is due to increased capillary pore size with increase in water content.
For water contents ranging from OMC to LL, addition of lime increases the unconfined compressive strength as a function of curing period and lime content. The optimum lime content is 4% for a curing period of 28 days.
Combination of lime and cement in equal proportion of 1:1 gives better strength with the curing period when compared with lime alone.
For sandy clay treated with lime + cement, the strength development is mainly attributed of cement.
Longer curing periods and lower clay water/additive ratio is very effective for attaining desired strength.
The proposed relationships for strength prediction based on clay water/additive ratio and curing period are very useful
INTERNATIONAL JOURNAL OF GEOLOGY Issue 1, Volume 7, 2013
20
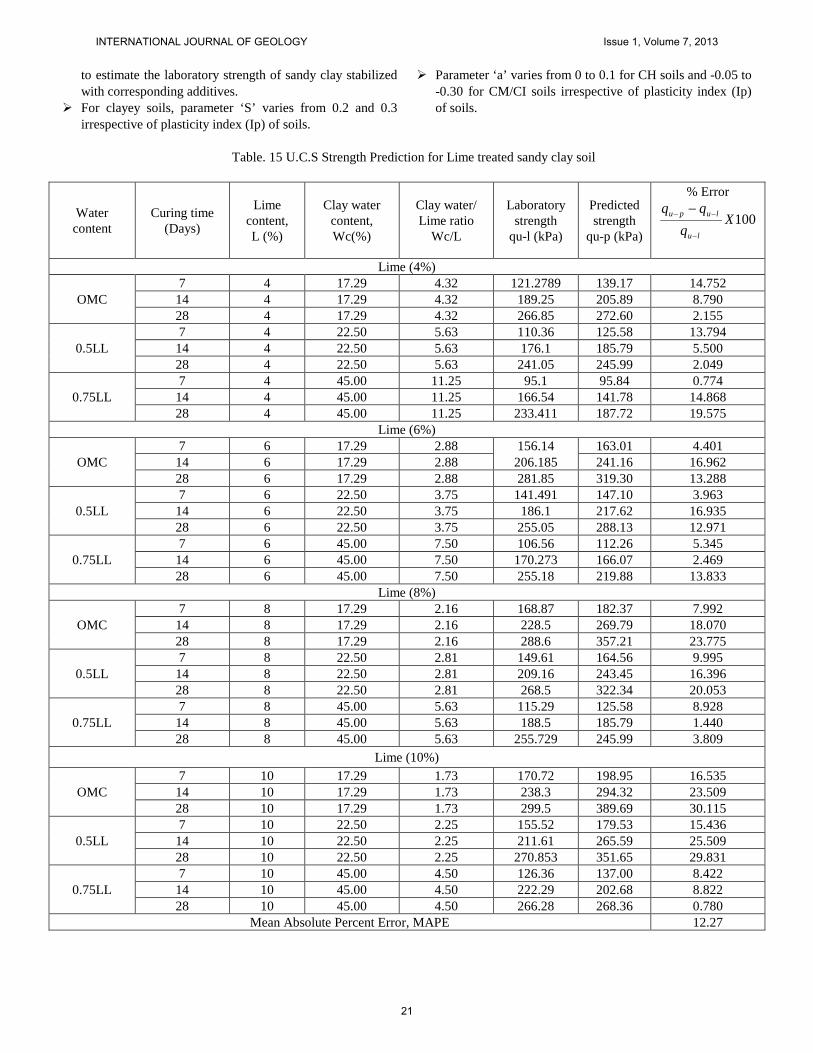
to estimate the laboratory strength of sandy clay stabilized with corresponding additives.
For clayey soils, parameter ‘S’ varies from 0.2 and 0.3 irrespective of plasticity index (Ip) of soils.
Parameter ‘a’ varies from 0 to 0.1 for CH soils and -0.05 to -0.30 for CM/CI soils irrespective of plasticity index (Ip) of soils.
Table. 15 U.C.S Strength Prediction for Lime treated sandy clay soil
Water content
Curing time (Days)
Lime content, L (%)
Clay water content, Wc(%)
Clay water/ Lime ratio
Wc/L
Laboratory strength
qu-l (kPa)
Predicted strength
qu-p (kPa)
% Error
100Xq
lu
lupu
−
−− −
Lime (4%)
OMC 7 4 17.29 4.32 121.2789 139.17 14.752
14 4 17.29 4.32 189.25 205.89 8.790 28 4 17.29 4.32 266.85 272.60 2.155
0.5LL 7 4 22.50 5.63 110.36 125.58 13.794
14 4 22.50 5.63 176.1 185.79 5.500 28 4 22.50 5.63 241.05 245.99 2.049
0.75LL 7 4 45.00 11.25 95.1 95.84 0.774
14 4 45.00 11.25 166.54 141.78 14.868 28 4 45.00 11.25 233.411 187.72 19.575
Lime (6%)
OMC 7 6 17.29 2.88 156.14 163.01 4.401
14 6 17.29 2.88 206.185 241.16 16.962 28 6 17.29 2.88 281.85 319.30 13.288
0.5LL 7 6 22.50 3.75 141.491 147.10 3.963
14 6 22.50 3.75 186.1 217.62 16.935 28 6 22.50 3.75 255.05 288.13 12.971
0.75LL 7 6 45.00 7.50 106.56 112.26 5.345
14 6 45.00 7.50 170.273 166.07 2.469 28 6 45.00 7.50 255.18 219.88 13.833
Lime (8%)
OMC 7 8 17.29 2.16 168.87 182.37 7.992
14 8 17.29 2.16 228.5 269.79 18.070 28 8 17.29 2.16 288.6 357.21 23.775
0.5LL 7 8 22.50 2.81 149.61 164.56 9.995
14 8 22.50 2.81 209.16 243.45 16.396 28 8 22.50 2.81 268.5 322.34 20.053
0.75LL 7 8 45.00 5.63 115.29 125.58 8.928
14 8 45.00 5.63 188.5 185.79 1.440 28 8 45.00 5.63 255.729 245.99 3.809
Lime (10%)
OMC 7 10 17.29 1.73 170.72 198.95 16.535
14 10 17.29 1.73 238.3 294.32 23.509 28 10 17.29 1.73 299.5 389.69 30.115
0.5LL 7 10 22.50 2.25 155.52 179.53 15.436
14 10 22.50 2.25 211.61 265.59 25.509 28 10 22.50 2.25 270.853 351.65 29.831
0.75LL 7 10 45.00 4.50 126.36 137.00 8.422
14 10 45.00 4.50 222.29 202.68 8.822 28 10 45.00 4.50 266.28 268.36 0.780
Mean Absolute Percent Error, MAPE 12.27
INTERNATIONAL JOURNAL OF GEOLOGY Issue 1, Volume 7, 2013
21

Table. 16 U.C.S Strength Prediction for Lime+Cement treated sandy clay soil
Water content
Curing time
(Days)
Lime+Cement content (%)
Clay water content, Wc (%)
Clay water/ Lime+Cement ratio
(Wc/(L+C))
Laboratory strength
qu-l(kPa)
Predicted strength
qu-p(kPa)
% Error
100Xq
lu
lupu
−
−− −
Lime+Cement (1%+1%)
OMC 7 2 17.29 8.65 119.84 140.43 17.178
14 2 17.29 8.65 239.266 285.25 19.220 28 2 17.29 8.65 406.34 430.08 5.842
0.5LL 7 2 22.50 11.25 126.28 133.57 5.774
14 2 22.50 11.25 243.07 271.33 11.626 28 2 22.50 11.25 418.57 409.09 2.266
0.75LL 7 2 33.75 16.88 156.04 123.67 20.746
14 2 33.75 16.88 213.221 251.21 17.817 28 2 33.75 16.88 389.43 378.75 2.742
Lime+Cement (2%+2%)
OMC 7 4 17.29 4.32 188.912 160.19 15.202
14 4 17.29 4.32 290.182 325.41 12.138 28 4 17.29 4.32 481.995 490.62 1.789
0.5LL 7 4 22.50 5.63 200.211 152.37 23.894
14 4 22.50 5.63 301.78 309.52 2.565 28 4 22.50 5.63 486.648 466.67 4.105
0.75LL 7 4 33.75 8.44 120.644 141.08 16.935
14 4 33.75 8.44 285.56 286.57 0.354 28 4 33.75 8.44 466.969 432.07 7.474
Mean Absolute Percent Error, MAPE 10.426
Table. 17 Stabilization of different soils with cement with liquidity index (LI) <2.50
Soil No. Soil Name
Atterberg Limits IS Classification
Dry density γdmax
(gm/cc) OMC (%) S a LL
(%) PL (%)
PI (%)
1 Bankok Clay (Sukraphiban district) 90 25 65 CH γb = 14 - 16 wn = 89% 0.283 0.039
2 Indian Sandy Clay 45 21 24 SC 18.15 17.29 0.247 -0.225 4 Indian Black Cotton Soil 97 35 62 CH 11.48 36.50 0.281 0.038 5 Indian Brown Earth Soil 60 23 37 CH 14.32 28.3 0.281 0.038 7 Indian Red Earth Soil 38 15 23 CL 1.67 17.8 0.281 0.038 8 C1 Type Soil 78 31 47 CH 8.85 wn = 70% 0.23 -0.074 9 C2 Type Soil 47 25 22 CI 9.05 wn = 62% 0.261 -0.235
10 C3 Type Soil 33 20 13 CL 9.44 wn = 53% 0.2 -0.003
REFERENCES [1] Abrams, D. A. (1918). “Design of concrete mixtures”, structural
materials research material, Bulletin 1, Lewis Institute, Chicago. [2] Clough, G. W., Sitar, N., Bachus, R. C. & Rad, N. S. (1981).
“Cemented sands under static loading”, journal of geotechnical engineering division, ASCE, Vol.107, No.GT6, pp.799-817.
[3] Kamon, M. & Bergado, D. T. (1992). “Ground improvement techniques”, proceedings of 9th asian regional conference on soil mechanics and foundation engineering, pp.526-546.
[4] Nagaraj, T. S., Miura, N., Yaligar, P. & Yamadera, A. (1996). “Predicting strength development by cement admixture based on water content”, Proc. IS-Tokyo'96, the second international conference on ground improvement geosystems, grouting and deep mixing, Yonekura, R. et al, (eds), Tokyo, 14 – 17 May 1996, 1: 431-436.
[5] Neville, A. M. (1996). “Properties of concrete” fourth edition, Prentice Hall.
[6] Uddin, K., Balasubramaniam, A. S., and Bergado, D. T. (1997). “Engineering behavior of cement treated bangkok soft clay”, geotechnical engineering-SEAGS, Vol. 28, No. 1, 89-119.
INTERNATIONAL JOURNAL OF GEOLOGY Issue 1, Volume 7, 2013
22

[7] Kasama, K., Ochiai, H. & Yasufuku, N. (2000). “Stress-Strain Behaviour of Lightly Cemented Clay Based on an Extended Critical State Concept”, Soils and Foundations, Vol.40, No.5, pp.37-47.
[8] Horpibulsuk, S. and Miura, N. (2001). “A new approach for studying behavior of cement stabilized clays”, Proc. 15th international conference on soil mechanics and geotechnical engineering (ISSMGE), Istanbul, Turkey,3, 1759–1762.
[9] Miura N, Horpibulsuk, S and Nagaraj, T. S. (2001). “Engineering behavior of cement stabilized clay at high water content”, soils found. 41(5): 33-45.
[10] Horpibulsuk S, Miura N and Nagaraj TS. 2003. “Assessment of strength development in cement admixed high water content clays with Abram’s law as a basis”, geotechnique. 53(4): 439-444.
[11] Horpibulsuk, S., Bergado, D. T. and Lorenzo, G. A. (2004a), “Compressibility of cement admixed clays at high water content”, geotechnique, 54(2), 151–154.
[12] Horpibulsuk, S., Miura, N. and Bergado, D. T. (2004b). “Undrained shear behavior of cement admixed clay at high water content”, journal of geotechnical and geo-environmental engineering, ASCE,130(10), 1096–1105.
[13] Horpibulsuk, S., Miura, N., Koga, H. and Nagaraj, T. S. (2004c). “Analysis of strength development in deep mixing—A field study”, ground improvement journal, 8(2), 59–68.
[14] Horpibulsuk S, Miura N and Nagaraj T S., (2005). “Clay-water/cement ratio identity for cement admixed soft clays”, journal of geotechnical and geo-environmental, ASCE, 131(2), 187-192.
[15] Horpibulsuk, S., Katkan, W., Sirilerdwattana, W. and Rachan, R. (2006). “Strength development in cement stabilized low plasticity and coarse grained soils”, laboratory and field study, soils and foundations, 46(3), 351–366.
[16] Horpibulsuk, S., Shibuya, S., Fuenkajorn, K. and Katkan, W. (2007), “Assessment of engineering properties of Bangkok clay” Canadian geotechnical journal, 44(2), 173–187.
[17] Horpibulsuk, S., Rachan, R. and Raksachon, Y. (2009). “Role of fly ash on strength and microstructure development in blended cement stabilized silty clay”, soils and Foundations, 49(1), 85–98.
[18] Horpibulsuk, S., Liu, M. D., Liyanapathirana, D. S. and Suebsuk, J. (2010a). “Behaviour of cemented clay simulated via the theoretical framework of the Structured Cam Clay model”, Computers and Geotechnics, 37, 1–9.
[19] Suebsuk, J., Horpibulsuk, S. & Liu, M.D. (2010b). “Modified structured cam clay: a constitutive model for destructured, naturally structured and artificially structured clays”, computers and geotechnics, Vol.37, pp.956-968.
[20] Suksun Horpibulsk, Runglawan Rachan, Apichat suddeepong and Avirut chinkulkijniwati, (2011). “Strength development in cement admixed bangkok clay: laboratory and field investigations”, soils and foundations, Japanese geotechnical society, Vol. 51, No. 2, 239-251, Apr. 2011,
[21] M. M. Rahman, A. Siddique and M. K. Uddin, (2012). “Clay water/cement ratio is the prime parameter for fine grained soil improvement at high water content”, DUET journal, Vol. 1, Issue 3.
[22] ASTM D5102 “Standard test method for unconfined compressive strength of compacted soil-lime mixtures”.
[23] Narendra B. S., “Stabilisation of soft soils in high water contents”, Ph.D thesis, Indian institute of science, India.
[24] Indrani, “Resilient modulus of subgrade soils”, M.Tech thesis, National institute of technology, Karnataka, India.
P C Naveena: He is working as senior geotechnical engineer in Atkins India Pvt. Ltd., Bangalore, India. He is pursuing Ph.D. in the Department of Civil Engineering at Siddaganga Institute of Technology, Tumkur, India under Visvesvaraya Institute of Technology. He obtained his M.Tech degree in Geotechnical Engineering from National Institute of
Technology Karnataka, Surathkal in 2003. He has more than 10 years of varied working experience in the field of geotechnical engineering. He is extensively involved in design of various foundation systems, slope stability analysis, slope protection measures and ground improvement works for major
projects. His expertise includes geotechnical investigation and interpretation for various National Highways, State Highways in India and Motorways, Railways in UK. He is also having research and teaching experience in geotechnical engineering. He has published 10 technical papers in various National, International Conferences and Journal. He is Life Member of Indian Geotechnical Society (IGS), Member of Indian Road Congress (IRC) and Graduate Member of Institution of Civil Engineers (ICE) UK
K H Mamatha: She is pursuing Ph.D. in the dept. Of Civil Engg at Siddaganga Institute of Technology, Tumkur, India under Visvesvaraya Institute of Technology. She obtained her M.Tech degree in Transportation Engineering and Managament from the same institution in the year 2012. She is working in the area of Pavement Materials. She has two
publications in national conferences. S V Dinesh: He is working as Professor in the dept. Of Civil Engg at Siddaganga Institute of Technology, Tumkur, India. He obtained his Ph.D degree from Indian Institute of Science, Bangalore in 2003. He is working in the area of Constitutive behavior of granular material, Numerical modeling of Geomaterials using DEM, Liquifaction potential & dynamic
properties of soils, Soil stabilization, Pavement analysis and Behavior of contaminated soils. He has more than 20 years of teaching experience. He is the recipient of NPEEE fellowship from MHRD, Govt. of India for International Research training. He has more than 50 publications in various journals and conferences. He has guided Ph.D students. He has also involved in many sponsered research and consultancy projects. He is life member of Indian Geotechnical Society (IGS), Indian Society of Earthquake Technology (ISET). Indian Road Congress (IRC), Associate member of American Society of Civil Engineers (ASCE).
INTERNATIONAL JOURNAL OF GEOLOGY Issue 1, Volume 7, 2013
23