prediction of phosphorus concentration in an unconfined...
TRANSCRIPT

UNIVERSITI PUTRA MALAYSIA
PREDICTION OF PHOSPHORUS CONCENTRATION IN AN
UNCONFINED AQUIFER USING VISUAL MODFLOW
SEYED REZA SAGHRAVANI
FK 2009 44

To my parents for Encourage and Support

ii
PREDICTION OF PHOSPHORUS CONCENTRATION IN AN UNCONFINED AQUIFER USING VISUAL MODFLOW
By
SEYED REZA SAGHRAVANI
Thesis Submitted to the School of Graduate Studies, Universiti Putra Malaysia, in Fulfilment of the Requirement for the Degree of Master of
Science, May 2009

Abstract of thesis submitted to the senate of Universiti Putra Malaysia in fulfillment of the requirement for the degree of Master of Science
PREDICTION OF PHOSPHORUS CONCENTRATION IN AN UNCONFINED AQUIFER USING VISUAL MODFLOW
By
SEYED REZA SAGHRAVANI
May 2009
Chairman: Associate Professor Sa’ari Bin Mustapha, PhD Faculty: Engineering Groundwater as a source of water for municipal, industrial, and agricultural
purposes plays a key role in many societies around the world and should be
safeguarded against pollution. Nutrients such as phosphorus can be
transported to other places by groundwater and has adverse effect on
ecosystem of water bodies. Phosphorus causes turbidity in water and
eutrophication in surface water and aquatic situation to terrestrial constantly.
The objective of this study is to predict groundwater flow direction and
spreading of phosphorus in an aquifer located at the Engineering Complex of
the Universiti Putra Malaysia. Fertilizers, as main source of phosphorus were
used before in study area. Also the fertilizers are currently used at an area
located south of the Engineering Complex and it has an adverse effect on
quality of groundwater. Visual MODFLOW, is a powerful software package,
was used to predict the changes of groundwater flow patterns and
concentration of phosphorus for period of 10 and 50 years respectively. These
two periods were selected because adsorption and slow movement of
phosphorus in groundwater usually take long time. However, mobility of
phosphorus is resumed as the adsorption capacity of phosphorus in the soil is
reached.
Data from 11 constructed wells within the study area were collected to
determine groundwater level from surface, thickness of geological formation,
and concentration of phosphorus. Groundwater movement direction was
determined by the triangular linear interpolation and the field data obtained
from the observation wells indicate that groundwater flow is from Southeast to
Northwest. The concentration of orthophosphorus, as the dominant form of
phosphorus was measured in laboratory using spectrophotometer. The results
show that concentrations of orthophosphorus in vicinity of the swamp are 0.64
mg/l, and 0.5 mg/l, in the pond is 0.22 mg/l, in western part of the area is 0.13
mg/l and in the center of study area is 0.31 mg/l. These concentrations of
phosphorus in the study area show that the highest concentration occurs in the
swamp and the concentration decreases with distance from the swamp down to
the value of 0.13 mg/l. Visual MODFLOW, which include MODFLOW and
MT3DMS, was employed to predict the direction of groundwater flow and
concentration of phosphorus for periods of 10 and 50 years. During these
periods two types of Constant Head Boundary (CHB) were used. In the first
type, the CHB was placed in the northern part of the area and movement of
groundwater during the prediction periods was implemented without any
iii

change in hydraulic head. The result shows that phosphorus does not flow to
the pond but might be transferred out of the study area due to groundwater
flow. In the second type, the CHB was located by the pond to record the fate of
phosphorus whenever water depth in the pond drops two meters. The result
indicates that the pollutant is directly transferred to the pond from the swamp
especially via layer No.2 and this can be related to its high hydraulic
conductivity. Prediction of contaminated groundwater shows that the
concentration of phosphorus increases at the end of prediction period at the
study area and this can be attributed to its migration from the swamp area.
iv

Abstrak tesis ini dikemukakan kepada senat Universiti Putra Malaysia sebagai memenuhi keperluan untuk memperolehi ijazah Master Sains
PENJANGKAAN KEPEKATAN FOSFORUS DI DALAM AKUIFER TIDAK TERKURUNG DENGAN MENGGUNAKAN VISUAL MODFLOW
Oleh
SEYED REZA SAGHRAVANI
Mei 2009 Pengerusi: Profesor Madya Sa’ari Bin Mustapha, PhD Fakulti: Kejuruteraan Air bawah tanah sebagai satu sumber air untuk perbandaran, perindustrian,
dan pertanian memainkan peranan utama kepada semua masyarakat di
seluruh dunia dan ia seharusnya dilindungi daripada pencemaran. Nutrien
seperti fosforus boleh diangkut kepelbagai tempat oleh air bawah tanah yang
akan memberi kasan buruk ke atas ekosistem jasad air. Fosforus boleh
menyebabkan kekeruhan air dan eutrofikasi di dalam air permukaan dan situasi
akuatik bagi persekitaran benua. Objektif bagi kajian ini adalah untuk membuat
jangkaan arah aliran air bawah tanah dan penumpuan kepekatan fosforus di
dalam akuifer yang berada di bawah Kompleks Kejuruteraan, Universiti Putra
Malaysia. Baja kimia sebagai punca utama fosforus telah pernah digunakan di
dalam kawasan kajian. Pada waktu ini baja kimia digunakan di dalam satu
kawasan yang terletak di selatan Kompleks Kejuruteraan tersebut. Penggunan
baja ini memberi kesan buruk terhadap kualiti air bawah tanah. Perision “Visual
MODFLOW”, satu perisian yang baik, telah digunakan untuk membuat
v

jangkaan bagi perubahan aliran bawah tanah dan kepekatan pencemaran
dalam tempoh 10 tahun dan 50 tahun yang akan datang. Kedua-dua tempoh ini
dipilih kerana proses “adsorption” dan pergerakan fosforus di dalam air bawah
tanah adalah perlahan. Walau bagaimana pun, pergerakan fosforus akan terus
bermula apabila kapasiti “adsorption” fosforus dicapai.
Data dari II telaga yang dibina di dalam kawasan kajian telah digunakan untuk
mendapatkan maklumat-maklumat berkenaan kedudukan aras air tanah,
ketebalan formasi geologi serta kepekatan fosforus. Arah pergerakan air
bawah tanah telah ditentukan dengan kaedah interpolasi linear segi tiga. Data
lapangan yang diperolehi dari telaga pemerhatian menunjukkan aliran air
bawah tanah adalah dari arah Tenggara menghala ke Barat Laut. Kepekatan
orthofosforus sebagai bentuk fosforus yang dominan telah diukur dalam
makmal dengan menggunakan spektrofotometer dan menunjukkan kepekatan
fosforus di sekitar enapcemar adalah pada 0.64 mg/l, dan 0.5 mg/l, di dalam
kolam adalah 0.22 mg/l, di kawasan sebelah barat kawasan kajian adalah 0.13
mg/l dan di kawasan pusat kajian pada 0.31 mg/l. Dengan demikian kepekatan
fosforus di dalam kawasan kajian adalah paling tinggi dalam enapcemar dan
berkurangan mengikut pertambahan jarak sehingga nilai 0.13 mg/l. Visual
MODFLOW yang terdiri dari MODFLOW dan MT3DMS telah digunakan untuk
membuat jangkaan aliran air bawah tanah dan keadaan pencemaran pada
tempoh 10 dan 50 tahun akan datang. Sepanjang tempoh ini dua jenis had
sempadan (Sempadan Tekanan Malar, STM) telah digunakan. Bagi jenis
vi

pertama STM diletakkan di utara dan pemodelan pergerakan air bawah tanah
semasa tempoh telah dilaksanakan jangkaan tanpa sebarang perubahan
dalam sifat hulu hidraulik kawasan. Hasil pemodelan menunjukkan
pencemaran tidak mengalir ke dalam kolam dari kawasan enapcemar tetapi ia
mungkin akan dibawa keluar dari kawasan kajian mengikuti arah aliran air
bawah tanah. Bagi jenis kedua STM telah ditempatkan di kolam bagi
merekodkan keadaan pencemaran apabila kedudukan paras air tanah jatuh
dua meter di dalam kolam. Keputusan jangkaan menunjukkan pencemaran
berpindah secara langsung ke dalam kolam dari kawasan enapcemar terutama
melalui lapisan No.2. Ini adalah disebabkan kekonduksian hidraulik yang tinggi
bagi lapisan tersebut. Jangkaan pencemaran air bawah tanah menunjukkan
kepekatan fosforus meningkat pada penghujung tempoh jangkaan dalam
kawasan kajian. Ini boleh dikaitkan dengan perpindahannya dari kawasan
enapcemar.
vii

ACKNOWLEDGEMENTS
All praise to Almighty Allah, the most merciful and the most gracious and
Blessings and salutation on our Beloved Messenger (Peace Be Upon Him).
I would like to express my deep and sincere gratitude to my supervisor, Dr.
Sa’ari Bin Mustapha, with his knowledge and his logical way of thinking have
been of great value for me. It is difficult to overstate my appreciation to
committee members, Dr. Shaharin Bin Ibrahim and Dr. Mohd. Kamil Bin Yusoff,
who shared with me a lot of their experience during research.
I would also like to thank Mr. Mohamed Azwan Bin Mohamed Zawawi with his
enthusiasm, his Inspiration, and his great efforts to explain things clearly and
simply for me.
My deepest gratitude goes to Dr. Seyed Fazlolah Saghravani and Dr. Behnaz
Dahrazma for their detailed and constructive comments and their important
support throughout this work.
Lastly, it is a pleasure to thanks the many people who made this thesis
possible.
viii

ix

This thesis submitted to the Senate of Universiti Putra Malaysia and has been
accepted as fulfilment of the requirement for the degree of Master of Science.
The members of the Supervisory Committee were as follows: Sa’ari bin Mustapha, PhD Associate Professor Faculty of Engineering Universiti Putra Malaysia (Chairman) Mohd Kamil bin Yusoff, PhD Associate Professor Faculty of Environmental Studies Universiti Putra Malaysia (Member) Shaharin bin Ibrahim, PhD Associate Professor Faculty of Environmental Studies Universiti Putra Malaysia (Member) _____________________________ HASANAH MOHD. GHAZALI, PhD Professor and Dean School of Graduate Studies Universiti Putra Malaysia Date: 11 September 2009
x

xi
DECLARATION
I hereby declare that the thesis is based on my original work except for
quotations and citations which have been duly acknowledged. I also declare
that it has not been previously or concurrently submitted for any other degree at
UPM or other institutions.
SEYED REZA SAGHRAVANI
Date: 25 August 2009

TABLE OF CONTENTS
PagesDEDICATION i ABSTRACT ii ABSTRAK v ACKNOWLEDGEMENTS viii APPROVAL SHEETS ix DECLARATION FORM xi LIST OF TABLES xiv LIST OF FIGURES xv LIST OF APPENDICES xvii LIST OF ABBREVIATIONS xviii
CHAPTER 1
1 INTRODUCTION 1 OVERVIEW 1 STATEMENT OF THE PROBLEM 2 OBJECTIVES OF RESEARCH 3 SCOPE OF RESEACH 3 SIGNIFICANCE OF THE STUDY 4
2 LITERATURE REVIEW 6 POLUTION OF GOUNDWATER 6 DEFINITIONS 6 SOURCES OF GROUNDWATER CONTAMINATION 7 PHOSPHORUS IN GROUNDWATER 12 PHOSPHORUS CYCLE 19 FORMS OF PHOSPHORUS 21 MODELING IN HYDROGEOLOGY 23
SIMULATION OF GROUNDWATER FLOW AND GROUNDWATER CONTAMINATION 33
MODFLOW AND VISUAL MODFLOW 34 SUMMARY 39
3 RESEARCH METHODOLOGY 41
GENERAL DESCRIBTION OF STUDY AREA 41 CONSTRUCTION OF OBSERVATION WELLS 46 INSTALLATION OF PVC INTO WELLS 47 DETERMINE THE ELEVATION OF OBSERVATION
WELLS 47 AUTOMATIC LEVEL SURVEYING 47 REAL TIME KINEMATIC GLOBAL POSITIONING
SYSTEM 48 STATISTICAL ANALYSIS 48
xii

MEASUREMENT WATER LEVEL IN WELLS 49 DETERMINATION OF FLOW DIRECTION 49 GROUNDWATER SAMPLING AND ANALYSIS 50 SAMPLE COLLECTION 50 ORTHOPHOSPHORUS MEASUREMENT 51 CALCULATION OF EVAPOTRANSPIRATION 51 MODELING 52 GROUNDWATER FLOW MODEL 52 MODEL CALIBRATION AND VALIDATION 54 INPUT DATA 56 SOIL PROPERTIES OF STUDY AREA 56 DEFINITION OF BOUNDARY CONDITIONS 57 OUTPUT 59
4 RESULTS AND DISCUSSION 61
GENERAL 61 GROUNDWATER FLOW DIRECTION 61 CHEMICAL ANALYSIS 67 SIMULATION BY VISUAL MODFLOW 71 MODEL INPUT DATA 71 SOIL HYDRAULIC PROPERTIES 71 BOUNDARY CONDITIONS 74 MODELING RESULTS 78 VALIDATION OF RESULTS 78 3650-DAYS SIMULATION PERIOD 78 18250-DAYS SIMULATION PERIOD 87
5 CONCLUSIONS AND RECOMMENDATIONS 95 GENERAL 95 SUMMARY OF RESULT 96 RECOMMENDATIONS 98
BIBLIOGRAPHY 99
APPENDICES 107
BIODATA OF STUDENT 154
LIST OF PUBLICATIONS 155
xiii
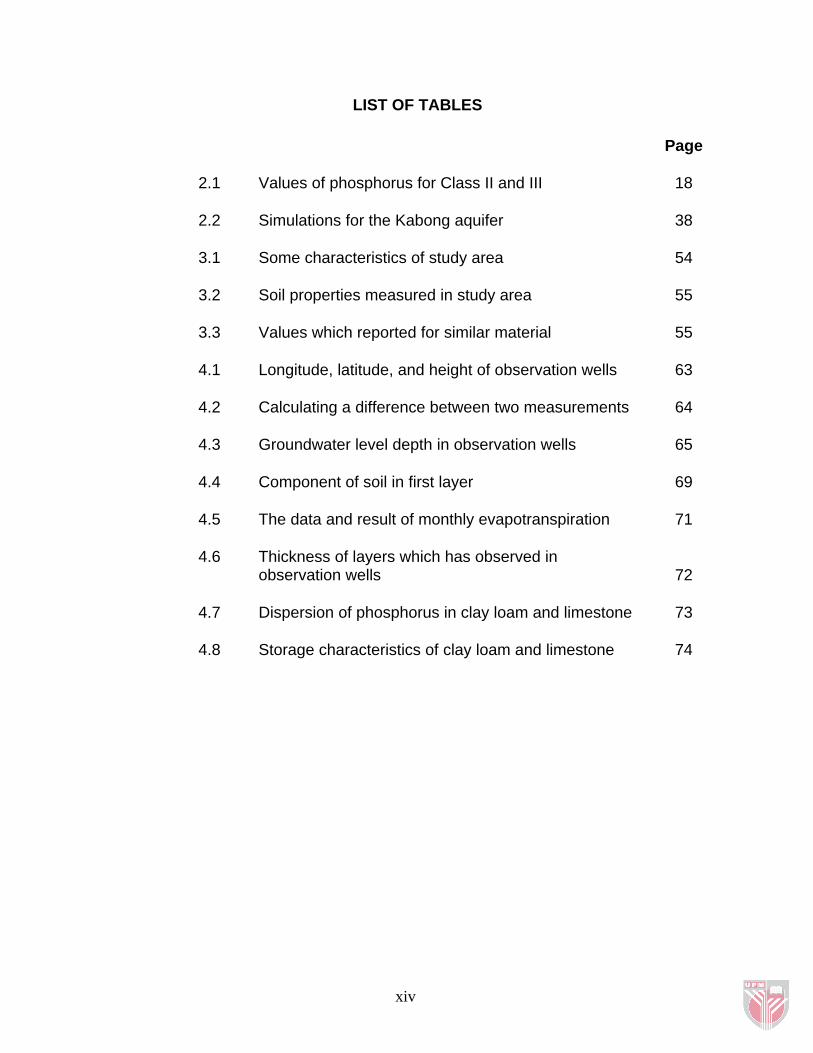
LIST OF TABLES
Page
2.1 Values of phosphorus for Class II and III 18
2.2 Simulations for the Kabong aquifer 38
3.1 Some characteristics of study area 54
3.2 Soil properties measured in study area 55
3.3 Values which reported for similar material 55
4.1 Longitude, latitude, and height of observation wells 63
4.2 Calculating a difference between two measurements 64
4.3 Groundwater level depth in observation wells 65
4.4 Component of soil in first layer 69
4.5 The data and result of monthly evapotranspiration 71
4.6 Thickness of layers which has observed in observation wells
72
4.7 Dispersion of phosphorus in clay loam and limestone 73
4.8 Storage characteristics of clay loam and limestone
74
xiv

LIST OF FIGURES
Page
2.1 Distribution of point source of pollution in Malaysia 12
2.2 Simplified phosphorus cycle 20
2.3 The phosphorus cycle, phosphorus movement, and phosphorus-enrichment processes 21
2.4
2.5
Finite-element grid for an aquifer 30
Block-centered finite-difference grid 31
2.6 Mesh-centered finite-difference grid 32
2.7 A discretized Hypothetical aquifer system 35
2.8A Migration after 1 year 39
2.8B Migration after 10 years 39
3.1 General View of Study Area 42
3.2 Elevation Contour lines from MSL 43
3.3 Geological map of study area 45
3.4 Location of observation wells 46
3.5 Basic concept of RTK-GPS 48
3.6 Water level indicator 49
3.7 Determination of Groundwater movement direction 50
3.8 Guelph permeameter equipment 58
3.9 Flowchart of research methodology 60
4.1 Locations of observation wells in study area 62
4.2 Illustration of groundwater movement direction 66
xv

4.3 Concentration of phosphorus in the study area (mg/l) 67
4.4 Texture triangle to determine type of soil 70
4.5 Location of Constant Head Boundary (CHB) and wall boundary
76
4.6 CHB in the Northwest of study area and wall boundary
77
4.7 Groundwater pollution concentration in study area after 3650 days in layer No.1 in steady state 80
4.8 Groundwater pollution concentration in study area after 3650 days in layer No.2 in steady state 82
4.9 Groundwater pollution concentration in study area after 3650 days in layer No.1 in transient state 84
4.10 Groundwater pollution concentration in study area after 3650 days in layer No.2 in transient state
86
4.11 Groundwater pollution concentration in study area after 18250 days in layer No.1 in steady state 88
4.12 Cross-sectional views of subsurface phosphorus concentration contours
90
4.13 Groundwater pollution concentration in study area after 18250 days in layer No.2 in steady state 91
4.14 Groundwater pollution concentration in study area after 18250 days in layer No.1 in transient state 93
4.15 Groundwater pollution concentration in study area after 18250 days in layer No.2 in transient state 94
xvi

LIST OF APPENDICES Page
A
Variation of phosphorus concentration in layer No.1 and No.2 of the study Area 107
B Figures of the study area 117
C Climate parameters obtained from UPM weather station, Serdang, Selangor (2007) 126
D National water quality standard for Malaysia (2004) 139
E Graph and simulation results of calibration and validation 142
F T-test result 145
G Fan diagrams of aquifer layers within the study area 147
H Results of Guelph permeameter test 150
xvii

xviii
LIST OF ABBREVIATIONS
MODFLOW Modular Three-dimensional Finite-difference Groundwater Flow
MT3DMS Modular Three-dimensional Multi Species Transport Model
OTA Office of Technology Assessment
UNTAA United Nation Technical Aid Assistance
DOE Malaysian Department of Environment
NGMP National Groundwater Monitoring Program
USEPA United Nation Environmental Protection Agency
INWQSM Interim National Water Quality Standard for Malaysia
GMS Groundwater Modeling System
USGS United State Geological Survey
MGO Modular Groundwater Optimizer
WHO World Health Organization
RTK Real-time Kinematic
GPS Global Positioning System
MSL Mean Sea Level
CHB Constant Head Boundary
HFB Horizontal Flow Barrier

CHAPTER 1
INTRODUCTION 1.1. Overview The rapid rate of urbanization and increasing demand for water is the major
reason for considering groundwater as an alternative of surface water. Overuse
in addition with misuse of water can be prologue to contamination of
groundwater with harmful and poisonous substances. Recent studies have
indicated that, human activities can alter the natural composition of groundwater
through the disposal or distribution of chemicals and microbial matter over the
land surface and into the soil, or through injection of wastes directly into
groundwater.
Finding the new techniques to protect, prevent from pollution, and finding the
sources of contamination for polluted groundwater are of major environmental
concerns of modern societies. These subjects are the modern issues in
hydrology and hydrogeology. Groundwater flow and contamination transport
models are supplementary tools for the assessment and decision making about
the fate of groundwater pollution. Reliable and adequate data is needed for
modeling the hydrologic systems. The data and models are used for estimation
of potential impacts of contamination and leachability of soil body and land

surface sources on the groundwater. The data also enables one to estimate the
transportation of contaminants by the groundwater.
1.2. Statement of the Problem
Groundwater as a source of potable water supply is often polluted due to
human activity. Through widespread use of fertilizers and disposal of sewage
into the groundwater in most parts of the country, it has been noted that
accumulation as well as transportation of some nutrient such as phosphorus
has been increased in some groundwater. This research is designed to deal
with the identification of phosphorus transport in groundwater and a selected
area is used as a case study.
The present research was conducted to evaluate the current stage of the
groundwater contamination by phosphorus at the Engineering Complex of the
Universiti Putra Malaysia in terms of the degree of pollution with phosphorus.
The Engineering Complex used to be a paddy field before construction of
current Engineering Complex. Currently fertilizers are being used at the south of
this area where the Faculty of Architecture and Landscape is located. Since the
aquifer slope down toward Northwest, groundwater flow is suspected to carry
the pollutants into the study area.
Although the phosphorus in the groundwater did not show a significant threat to
public health yet, but some alarming signs such as accelerated growth of
2

aquatic vegetation and algae have been observed. With the current phase of
increased phosphorus concentratio in the groundwater, this substance may
affect the aquatic system through eutrophication in the long term. The excess in
the use of fertilizers containing phosphorus accelerates the generation of the
consequence problems.
1.3. Objectives of Research
The objectives of this research are:
a) To determine groundwater flow direction at the Engineering Complex,
Universiti Putra Malaysia.
b) To measure the concentration of phosphorus in the groundwater at the
Engineering Complex.
c) To predict direction of groundwater flow and phosphorus concentration in
groundwater at area of the Engineering Complex.
1.4. Scope of Research
a) Determining the groundwater table in observation wells by RTK-GPS
from Mean Sea Level (MSL) and consequently finding the local
groundwater flow direction by interpolation.
b) Measurement of the orthophosphorus as a dominant form of phosphorus
by ascorbic acid method (Hach, 1988) in the study area.
3
c) Obtaining the required data for two layers from field work and literature to
employ Visual MODFLOW as a computational tool for this research.
1.5. Significance of the Study
Simulation by computer for analyzing flow and fate of solute in groundwater
systems has played an effective role in approaches to groundwater remediation
and environmental management. It will be essential to have proper software to
assess all part of the hydrological cycle which will help to manage water
ecosystem and forecasting future events for decision making.
Visual MODFLOW is one of the powerful groundwater modeling softwares,
which is able to simulate groundwater flow in a wide range of natural systems.
The programs can combine proprietary extension, such as MODFLOW
surfactant, MT3DMS, and a 3D model explorer to find the impacts of
contamination in both surface and subsurface. It is interesting to note that
Visual MODFLOW is used widely throughout the world and it can be applied to
many modeling applications extensively.
In the research area, Visual MODFLOW is used to determine the groundwater
behavior in connection with the pond and swamp as well as estimation of
phosphorus migration which is increased progressively and loading for a long
period of time. Result of this simulation will be useful for environmental
4

5
management of groundwater in the faculty of engineering Complex, University
Putra Malaysia.