prediction of hetp for randomly packed towers operation ... technology 33 2003 145.pdf · a steady...
TRANSCRIPT
Prediction of HETP for randomly packed towers operation:integration of aqueous and non-aqueous mass transfer
characteristics into one consistent correlation
Simon Piche, Stephane Levesque, Bernard P.A. Grandjean, Faıcal Larachi *
Department of Chemical Engineering and CERPIC, Laval University, Laval, Que., Canada G1K 7P4
Received 1 October 2002; received in revised form 2 December 2002; accepted 9 December 2002
Abstract
Height equivalent to a theoretical plate (HETP) calculations, essential for the design of randomly packed distillation
columns were extracted from the open literature to generate a working database including over 2350 measurements
(only total molar reflux data). The merging of mass transfer characteristics from non-aqueous and aqueous separation
experiments has instigated the generation of a consistent correlation predicting HETP. Based on results presented
elsewhere for absorption and stripping conditions (Ind. Eng. Chem. Res. 41 (2002) 4911), a set of artificial neural
network (ANN) correlations for the gas�/liquid interfacial area (aw) and the pure local mass transfer coefficients (kg,
g�/G or L) was proposed with the following dimensionless structures: aw/aT�/f (ReL, FrL, EoL, I , x , K ) and Shg�/
f (Reg, Frg, Scg, x ). The gas�/liquid interfacial area and the pure local mass transfer coefficients were extracted using a
reconciliation procedure which combined actually measured interfacial areas with pseudo-interfacial areas inferred
from the actually measured volumetric mass transfer coefficients (kLaw, KLaw, kGaw, KGaw*/absorption and stripping)
and HETP (distillation). The neural network weights of the two aw and kg correlations were adjusted using a least-
squared composite criterion simultaneously over the six mass transfer parameters’ databases. The optimized set of
ANN correlations yielded an average absolute relative error (AARE) of 21.3% for the 2357 HETP measurements
available. Likewise, the measured interfacial area and volumetric mass transfer coefficients (3770 data) were correlated
with an AARE of approximately 26.5%, which undeniably proves the intimate correspondence of absorption and
distillation mass transfer characteristics in randomly packed towers. HETP predictions remain as well in accordance
with the physical evidence reported in the literature.
# 2003 Elsevier B.V. All rights reserved.
Keywords: Random packed bed; Distillation; Absorption; Stripping; HETP; Mass transfer; Neural network; Database
1. Introduction
Randomly packed bed technology intended for
non-aqueous mixtures separation has been the
ground of intense research for the last 30 years
or so. Fundamentally, packed beds are used to
* Corresponding author. Tel.: �/1-418-656-3566; fax: 1-418-
656-5993.
E-mail address: [email protected] (F. Larachi).
Separation and Purification Technology 33 (2003) 145�/162
www.elsevier.com/locate/seppur
1383-5866/03/$ - see front matter # 2003 Elsevier B.V. All rights reserved.
doi:10.1016/S1383-5866(03)00005-4

Nomenclature
AARE average absolute relative error, AARE�1
NaN
i�1j yexp(i) � ypred(i)
yexp(i) j/aT bed specific surface area (m�1)aw gas�/liquid interfacial area (m�1)CL, CG packing-specific constants for Billet and Schultes correlation (�/)CPK packing-specific constant for Wagner et al. correlation (�/)Da a phase diffusion coefficient (m2 s�1)DC column diameter (m)dN packing nominal diameter (m)dpv sphere diameter equivalent with particle volume, 6(1�/o )aT
�1f�1 (m)
EoL liquid phase Eotvos numberFra a phase Froude numberg gravitational acceleration (m s�2)G gas mass flow rate (kg m�2 s�1)G ? gas molar flow rate (mol s�1)HETP height equivalent to a theoretical plate (m)Hj hidden neuronshT operating liquid holdup per bed volumeHTUOG gas-phase overall height of a transfer unit (m)I modified relative stabilizing indexK bed characterizing numberka a phase-film mass transfer coefficient (m s�1)Ka overall a phase-side mass transfer coefficient (m s�1)L liquid mass flow rate (kg m�2 s�1)L ? liquid molar flow rate (mol s�1)m thermodynamic partition coefficientMa a phase molecular weight (g mol�1)P pressure (Pa)Q optimized cost functionRea a phase Reynolds numberS normalized output variableSca a phase Schmidt numberSha
O overall a phase Sherwood numberSha a phase-film Sherwood numberSh� a a phase volumetric film Sherwood number, kaawaT
�2Da�1
T temperature (K)Ua a phase superficial velocity (m s�1)Ui normalized input variablesxi molar fraction of specie i in liquid phase
z bed height coordinate (m)Z bed height (m)
a interfacial area per bed specific surface areax Lockhart�/Martinelli parametero bed porosityf particle sphericityl stripping factor
Greek letters
S. Piche et al. / Separation and Purification Technology 33 (2003) 145�/162146

promote gas�/liquid contacting which can be
translated into higher inter-phase volumetric
mass transfer and better column efficiency. It is
actually well-employed in many industrial opera-
tions involving absorption and stripping processes.
Modern random packings creating sufficiently
high surface area and high throughput environ-
ments will often render this technology more
attractive for distillation processes compared to
tray columns, for example Ref. [2]. As a rule of
thumb, packed towers should be selected when a
liquid mixture hosts inconvenient properties for
tray columns (i.e. high stripping factor, high gas
density) [3]. Although structured packings are
more convenient for distillation, their actual costs
still prevent their proliferation over random pack-
ings. Therefore, based on the current market
status, the progress of inquiring tools for the
assessment of distillation randomly packed towers
remains essential for the well-being of this tech-
nology.
Performance analysis, scale-up and tower design
revolves on the understanding of macroscopic
gas�/liquid hydraulic behaviour as well as inter-
phase mass transfer and thermodynamic funda-
mentals. The overall efficiency defined in terms of
height equivalent to a theoretical plate (HETP)
adheres to the fudging of separate variables
emanating from those engineering fields (Eq.
(1)). Gas�/liquid interfacial area (aw), the most
intriguing variable in distillation, depends entirely
on the gas�/liquid flow behaviour across the solid
medium while the interface-sensitive mass transfer
coefficients (kG, kL), also affected by the hydro-
dynamics, remains bound to molecular diffusivity
drive in the gas and liquid films. Such variables
(aw, kG, kL) can be evaluated using previously
published sets of correlations/models allowingknowledge of the operating conditions (i.e. pres-
sure, liquid loading rate). On the other hand,
involvement of thermodynamics consolidated into
the stripping factor (l�/mG/L) remains rather
peculiar since the gas�/liquid equilibrium con-
stantly changes along the liquid flow path down-
stream of the column. This fact implicitly suggests
a steady change in the HETP as well. Forsimplification, equimolar composition of the bin-
ary mixture is used as the main premise for the
evaluation, or rather the approximation, of the
partition coefficient (m ) as well as the gas and
liquid physical properties (i.e. rG, mL, etc.). Un-
fortunately, it renders the HETP approach more a
rule of thumb concept rather than an exact science.
HETP�lnl
l� 1HTUOG
�ln(mG?=L?)
mG?=L? � 1
�UG
kGaw
�mUL
kLaw
�(1)
Nevertheless, the procurement of separate cor-
relations for aw, kG and kL emerging from the two-
film resistance concept is still accepted to be quite
useful for extracting the areal effect from the inter-
phase transfer effect in the volumetric masstransfer coefficient (kgaw). In doing so, several
investigators attempted the split by proposing
correlations for the interfacial area (aw) and local
mass transfer coefficients (kL and kG) apart,
resulting thus in three structurally different corre-
lations, eventually estimating not only overall
ma a phase viscosity (kg m�1 s�1)ra a phase density (kg m�3)s standard deviation, s�
ffiffiffiffiffiffiffiffiffiffiffiffiffiffiffiffiffiffiffiffiffiffiffiffiffiffiffiffiffiffiffiffiffiffiffiffiffiffiffiffiffiffiffiffiffiffiffiffiffiffiffiffiffiffiffiffiffiffiffiffiffiffiffiffiffiffiffiffiffiffiffiffiffiffiffiffiffiffiffiffiffiffiffiffiffiffiffiffiaN
i�1½j yexp(i) � ypred(i)
yexp(i) j�AARE�2=(N�1)
s/
sC packing criticalsurface tension (N m�1)
sL surface tension (N m�1)vi j, vj neural network fitting parameters
g gas or liquidG gasL liquidvol volatile compoundint interface
Subscripts
S. Piche et al. / Separation and Purification Technology 33 (2003) 145�/162 147

Table 1
Summary of important correlations predicting the HETP
Onda et al. [4]a
kL�0:0051
�rLUL
awmL
�2=3� mL
rLDL
��1=2� rL
mLg
��1=3
(aTdN)4=10 (2) kG�2
�rGUG
aTmG
�7=10� mG
rGDG
�1=3� DG
aTd2N
�(3)
aw
aT
�1�exp
��1:45
�sC
sL
�3=4�rLUL
aTmL
�1=10�aTU 2L
g
��1=20�rLU2L
aTsL
�2=10�(4)
Bravo and Fair [5]a
aw
aT
�6:249s0:5
L
Z0:4
�mLUL
sL
�0:392�rGUG
aTmG
�0:392
(5)kG, kL are computed from the Onda et al. correlation (Eqs. (2) and
(3))
Billet and Schultes [6]a
kL�CL
�rLg
mL
�1=6�aTDL
4o
�1=2�UL
aT
�1=3
(6) kG�CG
aTDG
(4o2 � 4ohT)1=2
�rGUG
aTmG
�3=4� mG
rGDG
�1=3
(7)
�aw
aT
�O
�1:5(4o)1=2
�rLUL
aTmL
��2=10�rLU 2L
aTsL
�3=4�aTU2L
g
��0:45
(8)For absorption, desorption and distillation with dsL/dzE/0
aw
aT
��
aw
aT
�O
��
1�2:4�10�4j dsL
dxvol
(x � xint)
aTDLmLj0:5� (9)
For distillation with dsL/dzB/0
Wagner et al. [10]
HETP�CPK
Z0:5
aT
�p(o � hT)UG
4DG
�0:5�1�
�hTDGMLrG
(o � hT)DLMGrL
G?
L?
�0:5���1 � o � hT
1 � o
�0:66
�1
��1
(10)
Norton Chemicals [2,12]
Atmospheric distillation (0.4�/4 atm) RestrictionsHEPT�exp(C1�0:187lnsL�0:213lnmL) (11) sL�/4�/36 dynes/cm
C1�/1.13 (dN�/25 mm), 1.35 (dN�/38 mm), 1.65 (dN�/50 mm) mL�/0.08�/0.83 Cp
Pressure distillation (�/4 atm)HEPT�C2�0:213ln(ML) (12) ML�/22�/72 g/mol
i.e. C2�/1.49 (IMTP #40), 1.35 (IMTP #25), 1.65 (IMTP #50)
a HETP are calculated with Eq. (1).
S.
Pich
eet
al.
/S
epa
ratio
na
nd
Pu
rificatio
nT
echn
olo
gy
33
(2
00
3)
14
5�
/16
21
48

mass transfer coefficients (Kgaw) for absorption/stripping separation but HETP as well [4�/6]. As a
matter of fact, the first known three-equation
structure from Onda et al. work [4] suggests
similarities, allowing reasonable error, in the
mass transfer response for both aqueous and
non-aqueous separation processes although some
antagonistic arguments can be noted. Indeed, the
Onda et al. correlations (Table 1), althoughdeveloped on grounds of gas absorption, deso-
rption and vaporization experiments, remain gen-
erally applicable for the prediction of HETP [7].
Bravo and Fair [5] identifying a lack in Onda’s aw
equation proposed another empirical aw correla-
tion based on over 200 experiments while using
Onda’s kL and kG equations to complete HETP
predictions (Table 1). Yet, some disagreementswere noted by Yang and Chuang [3] as for the
validity of this correlation which presupposed a
disputable effect of bed height (aw8/Z�0.4) and an
increasing effect of surface tension (aw8/sL0.108) on
interfacial area, a relationship that is opposite to
the low wettability (sL�/) low interfacial area (aw¡/)
expectation.
Recently, Billet and Schultes [6] proposed an-other three-equation semi-empirical procedure
(Table 1) which requires, besides the usual operat-
ing conditions, the theoretical liquid hold-up value
and also two packing-specific constants account-
ing for shape, material and size. It has been
successfully tested over a wide range of aqueous-
type experiments [8]. Based on their own database
reportedly spanning over 50 test system (aqueousand non-aqueous) and 70 types of dumped and
structured packings, the correlation yielded a
relative average deviation of 12% for absorption/
stripping experiments and 14% for rectification
systems [9]. Billet and Schultes set of equations
was actually the first to explicitly link aqueous and
non-aqueous mass transfer characteristics alto-
gether while applying appropriate distinctions fordistillation type experiments. The main distinction
resides on the Marangoni factor (dsL/dz) encoun-
tered for ever changing surface tension due to
varying liquid compositions along the liquid flow
path (z ). The relevance of this concept in distilla-
tion will be thoroughly discussed in a later section.
Wagner et al. [10] also derived a model predicting
HETP using the Higbie’s penetration theory tocalculate the mass transfer rate (kL and kG) and
considerations from the hydrodynamics model
(pressure drop, liquid hold-up) of Stichlmair et
al. [11] to evaluate the interfacial area. The
combination of those premises has led to the
explicit formulation of HETP expressed in Table
1.
Simplified HETP correlations have also beendeveloped as a loophole out of more complex
calculations. Understandingly, packed towers effi-
ciency is said to be mainly influenced by the size
and shape of the packing rather than the fluids
physical properties. For a gross estimation of the
HETP, several potential factors can be omitted.
Norton Chemicals correlations [2,12] which only
use packing size constants, liquid viscosity andsurface tension represent good examples (Table 1).
In a previous work, a set of neural network
correlations predicting the interfacial area (ANN-
aw) and the pure local mass transfer coefficients
(ANN-kg, kg�/kL or kG) was developed using a
comprehensive database (3770 measurements) of
gas�/liquid interfacial area and volumetric mass
transfer coefficients (kgaw, Kgaw) retraced in theopen literature [1]. The database was exclusive to
absorption and stripping. The modeling approach
was revolving around the use of a reconciliation
procedure which combines actually measured
interfacial areas with pseudo-interfacial areas
intuited from the actually measured volumetric
mass transfer coefficients. Fig. 1a exposes the
various steps undertaken throughout the modelingprocess which have resulted into the following
artificial neural network (ANN) correlations
[Shg�/f(Reg, Frg, Scg, x ) and aw/aT�/f(ReL, FrL,
EoL, x , K )]. Having demonstrated good level of
precision and robustness in terms of phenomen-
ological consistency, this empirical modeling ap-
proach could easily be extended to HETP
prediction allowing appropriate discriminatoryparameters for non-aqueous systems as adopted
by Billet and Schultes with the Marangoni term.
Furthermore, HETP modeling using a neural
network approach has already been conducted
for trayed [13] and structured packing [14] distilla-
tion columns confirming thus the potentiality of
this method for the present case in hand.
S. Piche et al. / Separation and Purification Technology 33 (2003) 145�/162 149

2. Mass transfer correlation development
2.1. Databases overview
The cited literature pertaining to the absorption/stripping database was divulged in a previous
publication [1]. It regroups 325 measurements on
the interfacial area, 1100 measurements on the
liquid-film coefficient (kLaw), 361 measurements
on the gas-film coefficient (kGaw), 1242 measure-
ments on the liquid-overall coefficient (KLaw) and
742 measurements on the gas-overall coefficient
(KGaw). Table 2 (1st column) summarizes thebreadth of operating variables characteristic to
these five mass transfer characteristics. The dis-
tillation database is constituted of 2357 HETP
measurements taken from 22 references spanning
between 1960 and 2001 [7,10,15�/34]. All experi-
ments were conducted at total molar reflux (G?�/
L?) with standard binary mixtures (chlorobenzene/
ethylbenzene, ethylbenzene/styrene, benzene/tolu-
ene, methanol/ethanol, trans -decalin/cis -decalin,
ethanol/water, n-hexane/cyclohexane, n-hexane/
n-heptane, isopropanol/water, iso-octane/toluene,
toluene/methylcyclohexane, cyclohexanone/cyclo-
hexanol, o -xylene/p -xylene, benzene/1,1-dichlor-
oethylene, trichloroethylene/n -heptane, n -
heptane/toluene). The liquid physical properties
were established on an equimolar composition
basis. If information on the liquid physical proper-
ties were not explicitly given by the author, the
following methods were employed to estimate the
liquid density (weighted average), liquid viscosity
(Grunberg and Nissan method), surface tension
(Macleod�/Sugden method) and liquid diffusion
coefficient (Siddiqi�/Lucas correlation) [35]. The
resulting gas phase equilibrium composition was
also used as basis for the calculation of gas density
Fig. 1. Modeling organization charts for (a) the ANN-awI and ANN-kg
I correlations developed from absorption and stripping
experiments [1] (b) the actual ANN-awII and ANN-kg
II correlations developed from absorption, stripping and distillation experiments.
S. Piche et al. / Separation and Purification Technology 33 (2003) 145�/162150

(ideal gas law), gas viscosity (Wilke correlation),
gas diffusion coefficient (Chapman�/Enskog the-
ory) and equilibrium constant (m ). Operating
variables pertaining to the distillation database
are displayed in Table 2 (2nd column). Both
databases also exhibit results on 24 packingvarieties, summarized in Table 3, spanning from
classical packings (e.g. Pall ring) to modern high-
porosity, low-pressure drop packings (e.g. IMTP
ring).
2.2. Artificial neural network optimisation
procedure
A four-step procedure similar to the one advo-cated previously [1] was implemented to develop
the ANN-awII and ANN-kg
II correlations (Fig. 1b).
The general strategy surrounding the implementa-
tion of ANNs (NNFIT software [36]) and the
identification of the Buckingham P dimensionless
input groups best correlated with the output mass
transfer dimensionless group is similar to the one
discussed in several past works [37�/39].
In a first step, the ANN-awI and ANN-kg
I
correlations developed for predicting mass transfer
coefficients in aqueous solutions [1] was tested
over the HETP database. It has demonstrated a
fairly good sense of predictability (average abso-
lute relative error (AARE)�/76%) allowing that it
was not specifically developed for non-aqueous
liquid separation. At some extent, it also confirms
the compatibility of the chosen dimensionless
numbers predicting mass transfer parameters for
both aqueous and non-aqueous liquid separation.
Yet, modifications of the interfacial area correla-
tion have to be made in order to take the
Marangoni factor into account. Accordingly, a
customized relative stability index (I) (Eq. (13))
was added to the ANN-aw correlation architecture
(Table 4). It represents the ratio between the rate
of surface tension change per molar fraction of the
most volatile component and the mixture surface
Table 2
Anatomy of the absorption/stripping and distillation databases
Absorption/stripping experiments (3770 data) Distillation experiments (2357 data)
flow rate range: 0.1�/0.5
Operating pressure, P [atm] 0.9�/13.6 0.026�/2.0
Operating temperature, T (K) 276�/316 258�/408
Liquid mass flow rate, L [kg m�2 s�1] 0.07�/76 0.1�/5.0
Gas mass flow rate, G [kg m�2 s�1] �/0�/5.55
Packing nominal diameter, dN [mm] 6.0�/76.2 9.5�/88.9
Bed porosity, o [%] 40.0�/98.0 62.4�/98.7
Bed surface area, aT [m�1] 87�/764 62�/553
Tower diameter, DC [m] 0.04�/1.40 0.09�/1.22
Bed height, Z [m] 0.1�/5.9 0.8�/10.7
Liquid density, rL [kg m�3] 802�/1190 600�/969
Liquid viscosity, mL�/103 [Pa s] 0.61�/26 0.23�/1.40
Surface tension, sL�/102 [N m�1] 2.2�/7.7 1.1�/2.9
Marangoni effect, dsL/dxvol�/102 [N m�1] 0 �/1.0�/2.7
Liquid diffusion coefficient, DL�/109 [m2 s�1] 0.1�/6.3 1.2�/6.2
Gas density, rG [kg m�3] 0.18�/16.1 0.12�/5.5
Gas viscosity, mG�/105 [Pa s] 1.3�/2.1 0.2�/1.2
Gas diffusion coefficient, DG�/105 [m2 s�1] 0.7�/8.4 0.2�/7.2
HETP [m] 0.09�/1.48
Interfacial area, aw [m2 m�3] 7�/244
Liquid-film coefficient, kLaw�/103 [s�1] 0.81�/83
Gas-film coefficient, kGaw [s�1] 0.95�/15
Global liquid-side coefficient, KLaw�/103 [s�1] 0.23�/82
Global gas-side coefficient, KGaw [s�1] 0.02�/23
S. Piche et al. / Separation and Purification Technology 33 (2003) 145�/162 151

tension. The Marangoni effect (dsL/dxvol) wasevaluated using a simple finite difference method
around xvol�/0.5 (i.e. [sL(0.6)�/sL(0.4)]/0.2). For
binary non-aqueous solutions, the index will be
either negative or positive depending on the liquids
to be separated while aqueous solutions does not
create any Marangoni effect (I�/0).
I �1
sL(0:5)
�dsL
dxvol
(0:5)
�(13)
It is conceived here that the ANN-kg correlation
structure requires no adjustment for accurate
prediction of either kG or kL in aqueous andnon-aqueous conditions. Therefore, a decision was
made to use the ANN-kgI input/output structure as
the basis of further improvements. The ANN-kgarchitecture and its general expression are given in
Table 5. It leads to the second modeling step where
pseudo-film mass transfer coefficients (kg) were
calculated for all HETP and mass transfer coeffi-cient measurements using the ANN-kg
I correlation
(Fig. 1b). This in turn allowed the extraction of
pseudo-interfacial areas which were merged with
actually measured interfacial areas and used for
the development of the new ANN-aw correlation
(third step). Both ANN-aw and ANN-kg correla-
tions obtained up to this stage remain initiatory
correlations requiring further optimizationthrough a refined tuning of their weights. A
postulation is made that the inputs intervening in
the initiatory ANN-aw and ANN-kg correlations
still remain the best explicatory inputs after the
ANN weights have been tuned. This implicitly
assumes that the initiatory ANNs accomplished
already a sufficient representational level of the
mass transfer parameters.The fourth step consisted in reconciling between
the six mass transfer characteristics. This was
accomplished through minimization of a cost
function Q (Eq. (14)) which includes the predic-
tion errors on the HETP, interfacial area and all
four volumetric mass transfer coefficients. Simul-
taneous optimization of ANN-aw and ANN-kgweights (vi j,vj) was achieved using Powell’s algo-rithm [40] by minimization of:
Q�X325
i�1
(logaexp� logacal)2
�X361
i�1
(logSh+G;exp� logSh+
G;cal)2
�X1100
i�1
(logSh+L;exp� logSh+
G;cal)2
�X742
i�1
(logShO+G;exp� logShO+
G;cal)2
�X1242
i�1
(logShO+L;exp� logShO+
L;cal)2
�X2357
i�1
(logHETPexp� logHETPcal)2 (14)
For each iterative step during minimization, the
local volumetric mass transfer coefficients (kgaw)
were calculated by multiplying the predictions for
Table 3
Database summary of ANN-awII and ANN-kg
II correlations
effectiveness (in terms of AARE, %) relative to the packing
elements
Packing type
data # (aw�/kgaw�/Kgaw/HETP) aw kgaw Kgaw HETP
Raschig ring (1630/439) 21.7 23.9 33.1 26.5
Pall ring (491/1225) 26.6 16.5 17.1 19.5
Intalox saddle (347/79) 34.8 19.5 26.4 18.3
Berl saddle (358/60) 19.8 33.7 47.7 42.9
Hiflow ring (167/198) 19.1 14.6 16.1
IMTP ring (0/154) 20.0
Tellerette (143/0) 45.6 13.6
Cascade mini-ring (26/87) 19.8 15.2
Nor-Pac (NSW) ring (86/14) 14.1 17.6 24.6
Super Intalox saddle (96/0) 19.1
Hedgehog (95/0) 18.9
Jaeger Hackettes (18/67) 8.2 14.4
Sphere (68/0) 16.0 30.1
Jaeger Top-Pak (42/17) 26.1 31.0 22.4
Nutter ring (22/36) 14.4 16.4
Bundle ring (48/0) 10.0
Spiral tile (18/28) 27.7 56.2
Oblique triangle (30/0) 28.9
VSP ring (0/24) 34.9
Hy-Pak ring (15/0) 25.2
Flat triangle (15/0) 104.0
Glitsch 30Pmk ring (0/14) 17.5
Fleximax (0/10) 16.1
Ralu ring (6/0) 52.3
S. Piche et al. / Separation and Purification Technology 33 (2003) 145�/162152
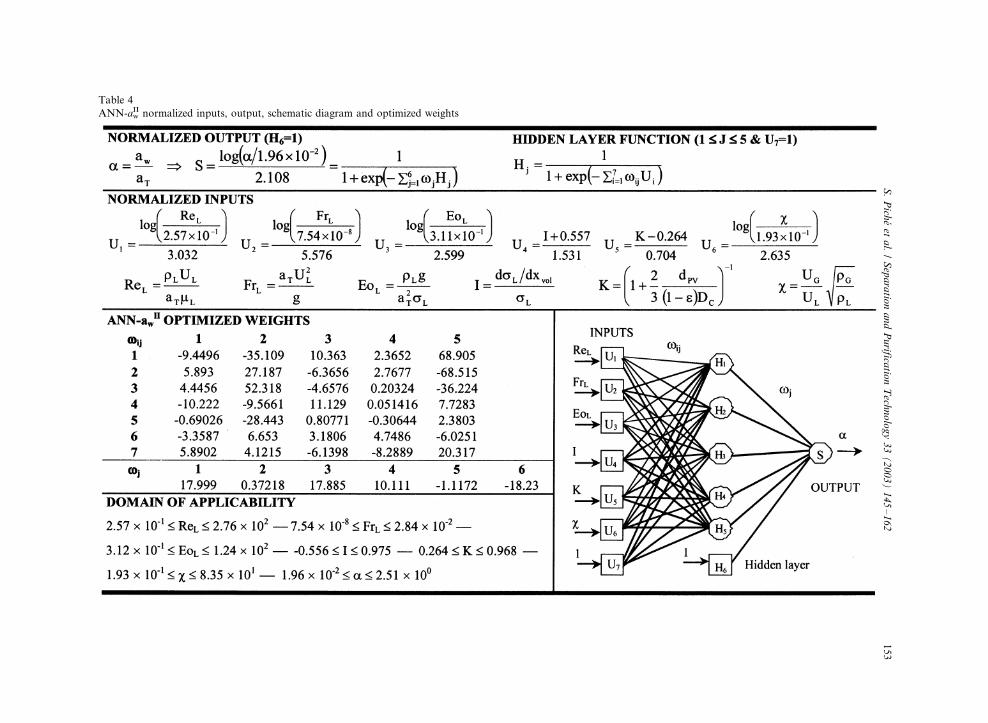
Table 4
ANN-awII normalized inputs, output, schematic diagram and optimized weights
S.
Pich
eet
al.
/S
epa
ratio
na
nd
Pu
rificatio
nT
echn
olo
gy
33
(2
00
3)
14
5�
/16
21
53
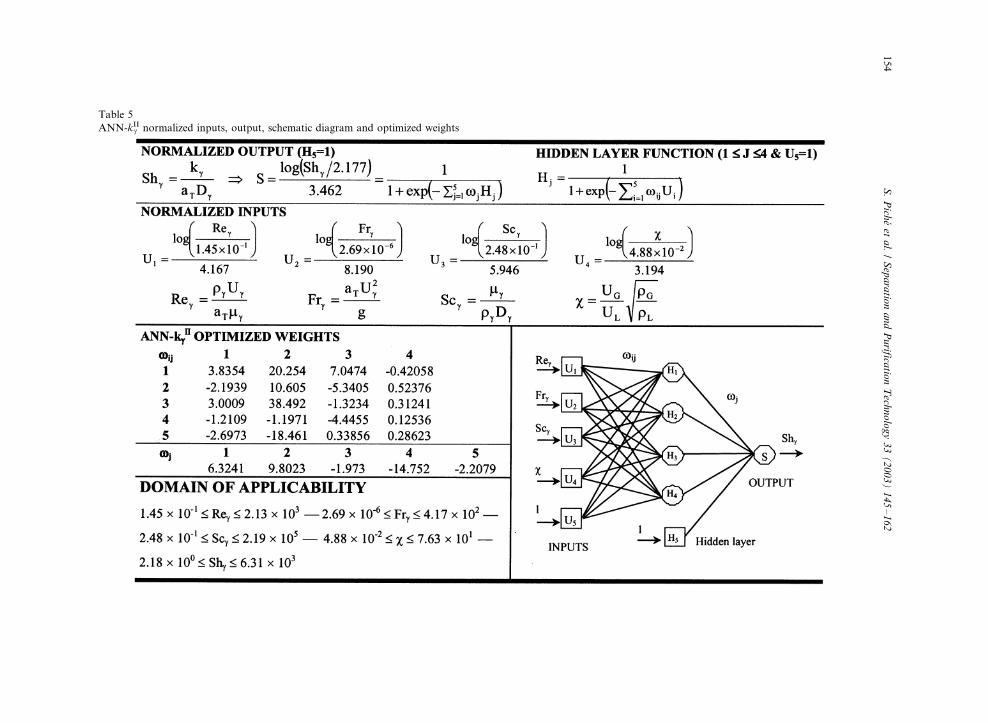
Table 5
ANN-kgII normalized inputs, output, schematic diagram and optimized weights
S.
Pich
eet
al.
/S
epa
ratio
na
nd
Pu
rificatio
nT
echn
olo
gy
33
(2
00
3)
14
5�
/16
21
54

aw and kg while comparing them with theirexperimental counterparts. Using a similar pro-
cess, overall volumetric mass transfer coefficients
(Kgaw) were calculated and compared in conjunc-
tion with the two-film theory and knowledge of
partition coefficient. HETP was calculated using
Eq. (1). Tables 4 and 5 contain the final optimized
weights for ANN-awII and ANN-kg
II, respectively. A
‘downloadable’ simulator is also made available atthe following web addresses: http://www.gch.ula-
val.ca/grandjea or http://www.gch.ulaval.ca/flara-
chi.
3. Performance analysis
3.1. Statistical evaluation
Statistical comparison between the Piche et al.
ANN correlations [1] developed from absorptionand stripping experiments and the new ANN-aw
II
and ANN-kgII correlations is summarized in Table
6. As mentioned previously, Piche et al. ANN
correlations display rather imprecise results over
the HETP measurements (AARE�/76%) while
keeping good track of the aw, kgaw and Kgaw
experiments (AARE�/9/23%). In contrast, the
new ANN correlations, while predicting goodHETP (AARE�/21%), also offer good results
over the aqueous-type experiments although it is
not as accurate as the Piche et al. correlations
(AARE�/9/27%). Of course, this particular in-
congruity comes from the inherent difficulty of
modeling, in the same framework, two databases
which exhibit very different operating positions.Added to the fact that HETP measurements are
only approximations from the real mass transfer
coefficients, it should be understood that predic-
tion of volumetric mass transfer coefficients for
absorption and stripping with the latter correla-
tion will be less effective. Nonetheless, homogene-
ity of the optimized correlations (ANN-awII, ANN-
kgII) for predicting mass transfer in both aqueous
and non-aqueous environments remains well illu-
strated in Fig. 2. Interfacial area (Fig. 2b) and
local coefficients (Fig. 2c) present good consis-
tency within the 9/2s scope (40% envelopes) while
HETP (Fig. 2a) and overall coefficients (Fig. 2d)
reported as KLaw values (KLaw�/mKGaw) manifest
slightly more scatter which seems logical consider-
ing the fact that the inaccuracy comes from threedifferent sources: aw, kG and kL.
The statistical performance on account of pack-
ing elements (Table 3) exposes the ability of the
new set of equations to predict, generally success-
fully, the HETP (4th column) over a wide range of
packing physical properties. Needless to say,
exceptions will always take place in such empirical
correlation (i.e. Berl saddle, VSP ring) which inthis case does not create much of an issue since
these packings involve a small fraction of the
experimental database.
3.2. Influence of physical properties on predicting
HETP
ANN correlations ability to provide good
phenomenological representations over wide
Table 6
Statistical comparison between the Piche et al. [1] correlation (based on aqueous systems) and the new correlation (based on aqueous
and non-aqueous systems)
No. of data AARE (%) AARE s (%)
Piche et al. This work Piche et al. This work
HETP 2357 75.7 21.3 99.9 18.4
Interfacial area, aw 325 22.5 23.6 16.1 18.1
Liquid-film coefficient, kLaw 1100 22.5 22.1 19.0 19.4
Gas-film coefficient, kGaw 361 21.8 26.9 15.6 18.6
Global coefficients, KLaw and KGaw 1984 26.2 29.4 24.6 33.5
TOTAL 6127 44.1 24.5 51.6 23.5
S. Piche et al. / Separation and Purification Technology 33 (2003) 145�/162 155

ranges of operating conditions can be verified with
the help of a sensitivity analysis on physical
properties. Several ANN-awII, ANN-kL
II and
ANN-kGII simulations combined into HETP that
were performed by ascribing different values for
one studied variable while the others holding
constant, providing thus more insights on the
influence of operating variables on the HETP.
For this study, the corresponding physical proper-
ties of 1 in. metal Cascade mini-ring and equimo-
lar chlorobenzene/ethylbenzene mixture at
atmospheric pressure were used for the simulations
(Figs. 3�/6) unless otherwise stated. Other default
values are: column diameter (0.5 m), bed height (3
m) and liquid mass flow rate (5 kg m�2 s�1) with
total molar reflux. A summary of the following
parametric study findings is presented in Table 7.
3.2.1. Operating conditions
Simulations expressed in Fig. 3a adhere clearlyto the general behaviour of HETP against the
liquid loading rate [41]. At very low flow rates (i.e.
L B/0.5 kg m�2 s�1, Fig. 3a), the packing remains
partially wetted resulting into very low interfacial
area and sky-high HETP. As the liquid load
increases, the wetted packing fraction is progres-
Fig. 2. Parity plots of the ANN correlations (a*/ANN-awII and ANN-kg
II coupled prediction on the HETP; b*/ANN-awII prediction on
the interfacial area database; c*/ANN-awII and ANN-kg
II coupled prediction on the film coefficients (kLaw, kGaw); c*/ANN-awII and
ANN-kgII coupled prediction on the overall coefficients (KLaw)). Dotted lines represent 9/40% envelopes.
S. Piche et al. / Separation and Purification Technology 33 (2003) 145�/162156

sively enhanced until extensive wetting is achieved
(i.e. aw$/aT). A sharp decrease in the HETP is
observed in this region. It is believed that an
additional increase of the flow rate in the pre-
loading zone will continuously decrease the HETP
through enhanced liquid�/vapour mixing until the
loading point is reached (see Fig. 3a, loading point
predicted by Billet and Schultes correlation [42]).
From this point on, the HETP reaches a plateau
all through the loading regime where maximum
separation efficiency is achieved. Packed towers
are usually designed in this region. This high-
efficiency plateau will end next to the flooding
regime which is characterized by instability, en-
trainment and thus poor efficiency. It must be
Fig. 3. Simulations representing the effect of operating vari-
ables on HETP (a*/effect of liquid mass flow rate; b*/effect of
operating pressure). Loading and flooding capacities were
calculated from Billet and Schultes correlation [42].
Fig. 4. Simulations representing the effect of important liquid
and gas physical properties on HETP (a*/effect of gas density;
b*/effect of gas and liquid diffusion coefficients; c*/effect of
liquid viscosity).
S. Piche et al. / Separation and Purification Technology 33 (2003) 145�/162 157

emphasized that the current scheme presented in
Fig. 3a can vary from case-to-case, especially in
the pre-loading zone. Several reasons have been
advanced going from liquid maldistribution to the
varying liquid�/vapour mixing intensity within the
packed bed structure [2]. Still, the pre-wetted zone
(high HETP), loading zone (lowest HETP, best
performance) and flooding zone (increasing
HETP) normally follow the characteristic scheme
described above.
Under vacuum conditions, HETP significantly
increases as the pressure decreases (Fig. 3b). This
trend is confirmed for every flow environment
(pre-loading to flooding) even though the overall
consequence seems less important for low flow
inputs. Several explanations could be advanced to
interpret this tendency since the absolute value of
HETP is dependent on the physical properties
which in turn are dependent of the equilibrium
temperature and pressure. It finally comes to a
case-to-case analysis. However, it could be ex-
pected that a decrease of pressure which results in
lower interfacial area [1] is one major reason for
the high HETPs in the vacuum region. Under high
pressure conditions (P�/1�/5 atm), different trends
can be observed for each flow regime. In the pre-
loading zone (i.e. L�/1 kg m�2 s�1, Fig. 3b),
HETP seems to reach a minimum at some critical
pressure where after it starts to slowly increase.
This observation was also confirmed by Yang and
Chuang [3]. Yet, as the flooding point is ap-
proached, a pressure increase neither improve
Fig. 5. Simulations representing the effect of (a) packing type
and (b) column diameter on HETP.Fig. 6. Simulations representing the effect of (a) absolute
surface tension and (b) surface tension gradient on HETP.
S. Piche et al. / Separation and Purification Technology 33 (2003) 145�/162158

nor it reduce mass transfer efficiency in the
column. Again a combination of several factors
could only explain this observation. It should at
least be suspected that for low gas�/liquid flow
rates (i.e. less interfacing gas and liquid fluxes) asubstantial increase of the operating pressure will
not improve the interfacial area potentiality (aw�/
as P �/) as it will rapidly reach a quasi-maximum
while pure mass transfer coefficients will progres-
sively decline (kG¡/ as P �/), thus resulting into an
increasing HETP (kGaw¡/ at high P ), see circle
symbol in Fig. 3b. On the other hand, greater gas�/
liquid flow rates will improve the interfacial areawhich should ultimately push back the critical
pressure where HETP starts to increase.
3.2.2. Physical properties
The influence of vapour density which is closely
related to the operating pressure is shown in Fig.
4a. Two distinct simulation curves are sketched.
The first one (empty circles) describes the pure
hydraulic influence of vapour density on HETP.
Logically, an increase of vapour density results in
a sharp decrease on HETP due to increasinginterfacial area. Yet, an antagonistic factor where
molecule gas diffusivity decreases with density (i.e.
DG¡/ and kG¡/ as mG�/, see dotted line in Fig. 4a)
neutralizes the hydrodynamic improvement of
high vapour density on the overall efficiency.
This is well represented by the second simulation
curve (empty triangles) which combines variation
of vapour density with appropriate values ofvapour diffusion coefficient (Chapman�/Enskog
theory). Note that the right-side vertical axis in
Fig. 4a is oriented downwards. Regarding mole-
cular diffusivity, Fig. 4b illustrates how systems
maintaining high diffusion coefficients achieve
better separation results. This state of affair is
apparent at high vapour diffusion coefficients
(empty circles). The fact that the vapour diffusion
coefficient has more weight on the absolute HETP
in contrast to the liquid diffusion coefficient
implicitly suggests that the mass transfer resistance
for distillation is concentrated in the vapour film.
Liquid viscosity is also considered as a matter of
high interest for distillation. Generally, the mass
transfer efficiency is hampered by high liquid
viscosity which knowingly produces poor inter-
facial area (empty circles, Fig. 4c). Furthermore,
the Stokes�/Einstein dependence that usually pre-
vails between viscosity and diffusivity (see dotted
line, Fig. 4c) suggest a further reduction of the
overall efficiency (high HETP) for high viscosity
systems (empty triangles, Fig. 4c) [35]. Still, the
hydrodynamics effect of liquid viscosity is more
significant on the absolute HETP in contrast to the
mass transfer resistance factor in the liquid film
(see Fig. 4b, empty triangles). Other fluid proper-
ties such as liquid density and vapour viscosity
only slightly influence the HETP and are not
represented here. Yang and Chuang [3] however
made the following observations: a) HETP very
slightly decreases with liquid density, b) HETP
moderately increases with vapour viscosity.
It is widely recognized that packing properties
plays a pre-dominant role in defining the HETP.
Most rule of thumbs analyses are based on the
packing type and size [2]. Norton Chemical
simplified correlations are good examples (Table
1). In this case, the lowest HETP (in the loading
zone) directly depends of the packing nominal size
with some adjustments on account of liquid
viscosity and surface tension. Fig. 5a demonstrates
the validity of these assertions as 1 in. packings
(higher surface area) produce lower HETP than 3
in. packings for example. In such a case, the final
Table 7
Summary of the parametric study (variation of HETP with increment of the parameter)
L rG mL DL DG aT DC sL dsL/dz
Pre-loading regime ¡/¡/¡/ ¡/¡/-�/ �/�/ ¡/ ¡/¡/¡/ ¡/¡/¡/ �/ �/�/ �/�/-¡/¡/
Loading regime ¡/-�/ ¡/
Flooding regime �/�/�/ ¡/
�/*/slightly increases, �/�/*/increases, �/�/�/*/largely increases, ¡/*/slightly decreases, ¡/¡/*/decreases, ¡/¡/¡/*/largely decreases.
S. Piche et al. / Separation and Purification Technology 33 (2003) 145�/162 159

decision on the choice of a packing (i.e. 1 in. CMRvs 1 in. Pall ring) resides on the hydrodynamic
efficiency (i.e. flooding capacity, pressure drop).
Column diameter plays a rather limited role on the
tower’s efficiency. As shown in Fig. 5b, the HETP
barely decreases for small columns (respectively
higher effective packing surface area, aT ?�/aT�/4/
DC).
3.2.3. Surface tension and the Marangoni effect
The significance of the absolute surface tension
on the HETP, although contained in several
correlations remains minor for the normal area
of operation (i.e. loading regime). As shown in
Fig. 6a, an increase of the surface tension causing
the liquid to contract itself only slightly reduces
the interfacial area (HETP�/ as sL�/) at high liquid
flow rates. In this state of operation, tricklingliquid film conditions is quasi-inexistent which
obviously lessens the influence of surface tension.
On the other hand, the liquid film dependence on
such an interface-sensitive constituent is more
significant at lower flow rates (i.e. L�/1
kg m�2 s�1, Fig. 6a). For this instance, the
simulated HETP increases by approximately 10
cm between 15 and 30 dynes cm�1 while it onlyincreases by 4�/5 cm for the higher simulated flow
rates.
Surface tension is also known to vary from top
to bottom of the column due to the ever changing
mixture composition. This in turn induces a
Marangoni effect (dsL/dz) which is known to
influence the interfacial area [42,43]. Systems
with increasing surface tension along the liquidflow path (i.e., downwards) are referred to as
positive systems (dsL/dz �/0) whereas, for negative
systems, surface tension decreases (dsL/dz B/0)
liquid streamwise. With supporting test results,
Billet and Schultes [6] observed a reduction of the
interfacial area for negative systems whereas the
Marangoni effect becomes minor for neutral and
positive systems. These observations were trans-posed into their interfacial area equation (see Eq.
(9) in Table 1). Equilibrium between the surface
tension gradient shear stress and liquid film shear
stress is their main reason to explain this beha-
viour. If the surface tension decreases across the
flow path, the liquid film becomes unstable and
tends to break up thus reducing the interfacial
area. While agreeing with these terms, Xu et al.
[43] still considered that positive systems should
reinforce the liquid film and increase the interfacial
area, an aspect that was not taken into considera-
tion by Billet and Schultes. Yet these explanations
do not totally sit with the simulations expressed in
Fig. 6b. This is especially the case for the pre-
loading zone.
A possible explanation could reside on the
combination of two antagonist sub-factors from
the Marangoni behaviour: (a) film stability effect
and (b) film recession/spread effect. The latter
notion rests on the fact that a reduction of surface
Fig. 7. Schematic diagram representing the possible influence
of Marangoni sub-factors (film stability and expansion effects)
on the interfacial area.
S. Piche et al. / Separation and Purification Technology 33 (2003) 145�/162160
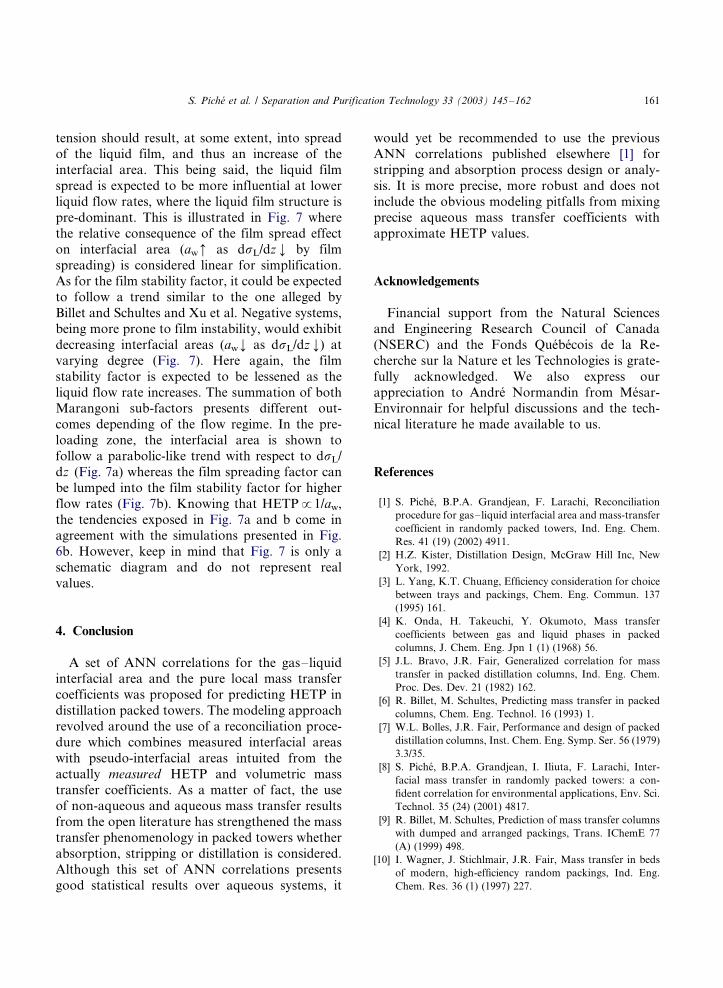
tension should result, at some extent, into spreadof the liquid film, and thus an increase of the
interfacial area. This being said, the liquid film
spread is expected to be more influential at lower
liquid flow rates, where the liquid film structure is
pre-dominant. This is illustrated in Fig. 7 where
the relative consequence of the film spread effect
on interfacial area (aw�/ as dsL/dz ¡/ by film
spreading) is considered linear for simplification.As for the film stability factor, it could be expected
to follow a trend similar to the one alleged by
Billet and Schultes and Xu et al. Negative systems,
being more prone to film instability, would exhibit
decreasing interfacial areas (aw¡/ as dsL/dz ¡/) at
varying degree (Fig. 7). Here again, the film
stability factor is expected to be lessened as the
liquid flow rate increases. The summation of bothMarangoni sub-factors presents different out-
comes depending of the flow regime. In the pre-
loading zone, the interfacial area is shown to
follow a parabolic-like trend with respect to dsL/
dz (Fig. 7a) whereas the film spreading factor can
be lumped into the film stability factor for higher
flow rates (Fig. 7b). Knowing that HETP8/1/aw,
the tendencies exposed in Fig. 7a and b come inagreement with the simulations presented in Fig.
6b. However, keep in mind that Fig. 7 is only a
schematic diagram and do not represent real
values.
4. Conclusion
A set of ANN correlations for the gas�/liquidinterfacial area and the pure local mass transfer
coefficients was proposed for predicting HETP in
distillation packed towers. The modeling approach
revolved around the use of a reconciliation proce-
dure which combines measured interfacial areas
with pseudo-interfacial areas intuited from the
actually measured HETP and volumetric mass
transfer coefficients. As a matter of fact, the useof non-aqueous and aqueous mass transfer results
from the open literature has strengthened the mass
transfer phenomenology in packed towers whether
absorption, stripping or distillation is considered.
Although this set of ANN correlations presents
good statistical results over aqueous systems, it
would yet be recommended to use the previousANN correlations published elsewhere [1] for
stripping and absorption process design or analy-
sis. It is more precise, more robust and does not
include the obvious modeling pitfalls from mixing
precise aqueous mass transfer coefficients with
approximate HETP values.
Acknowledgements
Financial support from the Natural Sciences
and Engineering Research Council of Canada
(NSERC) and the Fonds Quebecois de la Re-
cherche sur la Nature et les Technologies is grate-
fully acknowledged. We also express our
appreciation to Andre Normandin from Mesar-Environnair for helpful discussions and the tech-
nical literature he made available to us.
References
[1] S. Piche, B.P.A. Grandjean, F. Larachi, Reconciliation
procedure for gas�/liquid interfacial area and mass-transfer
coefficient in randomly packed towers, Ind. Eng. Chem.
Res. 41 (19) (2002) 4911.
[2] H.Z. Kister, Distillation Design, McGraw Hill Inc, New
York, 1992.
[3] L. Yang, K.T. Chuang, Efficiency consideration for choice
between trays and packings, Chem. Eng. Commun. 137
(1995) 161.
[4] K. Onda, H. Takeuchi, Y. Okumoto, Mass transfer
coefficients between gas and liquid phases in packed
columns, J. Chem. Eng. Jpn 1 (1) (1968) 56.
[5] J.L. Bravo, J.R. Fair, Generalized correlation for mass
transfer in packed distillation columns, Ind. Eng. Chem.
Proc. Des. Dev. 21 (1982) 162.
[6] R. Billet, M. Schultes, Predicting mass transfer in packed
columns, Chem. Eng. Technol. 16 (1993) 1.
[7] W.L. Bolles, J.R. Fair, Performance and design of packed
distillation columns, Inst. Chem. Eng. Symp. Ser. 56 (1979)
3.3/35.
[8] S. Piche, B.P.A. Grandjean, I. Iliuta, F. Larachi, Inter-
facial mass transfer in randomly packed towers: a con-
fident correlation for environmental applications, Env. Sci.
Technol. 35 (24) (2001) 4817.
[9] R. Billet, M. Schultes, Prediction of mass transfer columns
with dumped and arranged packings, Trans. IChemE 77
(A) (1999) 498.
[10] I. Wagner, J. Stichlmair, J.R. Fair, Mass transfer in beds
of modern, high-efficiency random packings, Ind. Eng.
Chem. Res. 36 (1) (1997) 227.
S. Piche et al. / Separation and Purification Technology 33 (2003) 145�/162 161

[11] J. Stichlmair, J.L. Bravo, J.R. Fair, General model for
prediction of pressure drop and capacity of countercurrent
gas/liquid packed columns, Gas Sep. Purif. 3 (1989) 19.
[12] R.F. Strigle, Jr., Packed Tower Design and Applications
Random and Structured Packings, second ed., Gulf
Publishing Company, Houston, 1994.
[13] E. Olivier, R.B. Eldridge, Prediction of trayed distillation
column mass transfer performance by neural networks,
Ind. Eng. Chem. Res. 41 (14) (2002) 3436.
[14] G.S. Pollock, R.B. Eldridge, Neural network modeling of
structured packing height equivalent to a theoretical plate,
Ind. Eng. Chem. Res. 39 (5) (2000) 1520.
[15] V. Linek, J. Sinkule, K. Brekke, A critical evaluation of the
use of absorption mass transfer data for the design of
packed distillation columns, Trans. IChemE 73 (A4) (1995)
398.
[16] D.E. Nutter, Nutter rings: a random packing developed
for consistent performance, IChemE Symp. Ser. 104 (1987)
A129.
[17] R. Billet, Packed Column Analysis and Design, Ruhr
Universitat, Bochum, Germany, 1989.
[18] B. Bennada, P. Moszkowicz, M. Prost, M. Otterbein, K.
Mohammedi, Simulation of hydrodynamics behaviour and
mass transfer efficiency of reduced pressure distillation,
Chem. Eng. Technol. 19 (1996) 308.
[19] D. Cornell, W.G. Knapp, H.J. Close, J.R. Fair, Mass
transfer efficiency*/packed columns (Part 2), Chem. Eng.
Progr. 56 (8) (1960) 48.
[20] R. Billet, Packed Towers in Processing and Environmental
Technology, VCH Verlagsgesellschaft, Weinheim, Ger-
many, 1995.
[21] F.J. Zuiderweg, D.E. Nutter, Evidence of vapor back-
mixing in packed columns in the case of high pressure
distillation, IChemE Symp. Ser. 128 (1992) A481.
[22] R. Bressat, D. Goury, M. Otterbein, M. Vincent, Influence
de la pression sur les anneaux Raschig en distillation sous
vide, Infect. Chim. 289 (1987) 153.
[23] E. Elsby, N. Ashton, A. Arrowsmith, Packing performance
in vacuum distillation, IChemE Symp. Ser. 104 (1987)
A143.
[24] R. Billet, Optimisation and comparison of mass transfer
columns, IChemE Symp. Ser. 32 (1969) 4�/42.
[25] J.S. Eckert, L.F. Walter, What affect packed bed distilla-
tion, Hydrocarb. Process. Pet. Refiner 42 (2) (1964) 107.
[26] R. Schmidt, The lower capacity limits of packed towers,
IChemE Symp. Ser. 56 (1979) 3.1/1.
[27] K.Y. Wu, G.K. Chen, Large-scale pilot columns and
packed column scale-up, IChemE Symp. Ser. 104 (1987)
B225.
[28] S.F. Strigle, F. Rukovena, Packed distillation column
design, Chem. Eng. Progr. 75 (3) (1979) 86.
[29] R.F. Strigle Jr., M.J. Dolan, A new approach to packed
distillation column design, Canadian Process Equipment
and Control News (October 1983) 82.
[30] F.H. Yin, C.G. Sun, A. Afacan, K. Nandakumar, K.T.
Chuang, CFD modeling of mass-transfer processes in
randomly packed distillation columns, Ind. Eng. Chem.
Res. 39 (2000) 1369.
[31] A. Senol, Mass transfer efficiency of randomly-packed
column: modeling considerations, Chem. Eng. Proc. 40
(2001) 41.
[32] W.L. Bolles, J.R. Fair, Improved mass-transfer model
enhances packed-column design, Chem. Eng. 89 (14)
(1982) 109.
[33] F.C. Silvey, G.J. Keller, Performance of three sizes of
ceramic Raschig rings in a 4 ft diameter column, IChemE
Symp. Ser. 32 (1969) 4�/18.
[34] A. Shariat, J.G. Kunesh, Packing efficiency testing on a
commercial scale with good (and not so good) reflux
distribution, Ind. Eng. Chem. Res. 34 (1995) 1273.
[35] R.C. Reid, J.M. Prausnitz, B.E. Poling, The Properties of
Gases and Liquids, fourth ed., McGraw Hill Inc, New
York, 1987.
[36] P. Cloutier, C. Tibirna, B.P.A. Grandjean, J. Thibaults,
available from http://www.gch.ulaval.ca/�/nnfit Laval
University, Canada, 1996.
[37] Z. Bensetiti, F. Larachi, B.P.A. Grandjean, G. Wild,
Liquid saturation in cocurrent upflow fixed-bed reactors:
a state-of-the-art correlation, Chem. Eng. Sci. 52 (21/22)
(1997) 4239.
[38] F. Larachi, Z. Bensetiti, B.P.A. Grandjean, G. Wild, Two-
phase frictional pressure drop in flooded-bed reactors: a
state-of-the-art correlation, Chem. Eng. Technol. 21 (1998)
887.
[39] S. Piche, F. Larachi, B.P.A. Grandjean, Flooding capacity
in packed towers: database, correlations and analysis, Ind.
Eng. Chem. Res. 40 (1) (2001) 476.
[40] W. Press, B.P. Flannery, S.A. Teukolsky, W.T. Vetterling,
Numerical Recipes: The Art of Scientific Computing,
Cambridge University Press, New York, 1988.
[41] B. Hanley, B. Dunbobbin, D. Bennett, A unified model for
countercurrent vapor/liquid packed columns (2-equations
for the mass-transfer coefficients, mass-transfer area, the
HETP, and the dynamic liquid holdup), Ind. Eng. Chem.
Res. 33 (5) (1994) 1222.
[42] R. Billet, M. Schultes, Fluid dynamics and mass transfer in
the total capacity range of packed columns up to the flood
point, Chem. Eng. Technol. 18 (6) (1995) 371.
[43] Z.P. Xu, A. Afacan, K.T. Chuang, Predicting mass
transfer in packed columns containing structured pack-
ings, Trans. IChemE 78 (A) (2000) 91.
S. Piche et al. / Separation and Purification Technology 33 (2003) 145�/162162