prediction of cavitation dynamics in marine · pdf filemethod to predict also complex...
TRANSCRIPT
21 / © Wärtsilä
PREDICTION OF CAVITATION
DYNAMICS IN MARINE
APPLICATIONS
A.I. OPREA & N. BULTEN
WÄRTSILÄ GLOBAL R&D, NETHERLANDS
STAR GLOBAL CONFERENCE 2012

21 / © Wärtsilä
Introduction & Summary
Introduction:
Cavitation = liquid changes into vapour state due to a decrease of the
pressure (bellow the vapour pressure)
Start of the cavitation modeling work using STAR-CD begins September
2007 (PhD work)
Goal: predict cavitation propulsion units by means of CFD simulations
Cavitation prediction will improve the understanding and consequently
the performance can be increased/improved
Presentation summary:
Numerical settings
Wetted and cavitating results on:
2D NACA0015 section
3D Twist -11 hydrofoil
LE Skew propeller
Conclusions
3/28/2012 2 CAVITATION MODELLING USING RANS APPROACH / I.Oprea & N.Bulten
Skew Propeller
3D:Twist 11
2D: NACA 0015

21 / © Wärtsilä
Basis of the simulations:
– STAR-CD v4.10.
– RANS solver
– Two-equation RNG k-ε turbulence model + modified turbulent
viscosity
– Wall functions approach
– VOF method + Rayleigh model, for cavitation modeling
Solver approach:
– 2nd order MARS in space
– 1st order Euler implicit in time
– SIMPLE algorithm
3/28/2012 3 CAVITATION MODELLING USING RANS APPROACH / I.Oprea & N.Bulten
General numerical settings

21 / © Wärtsilä
2D NACA0015 section: case presentation
2D NACA0015 test case conditions:
• NACA0015 profile
• Angle of attack: 6 degrees
• O-grid approach
• Inlet velocity: 6m/s
• Outlet pressure: 20kPa => sigma=1.0
• Slip walls
• Time step: 0.00001(cavitation)
2c 4c
3/28/2012 4 CAVITATION MODELLING USING RANS APPROACH / I.Oprea & N.Bulten

21 / © Wärtsilä
2D NACA0015 section: wetted flow results
• Pressure coefficient distribution:
• Lift and drag:
CFD Experiment
Lift 0.667 0.658
Drag 0.014 0.014
Within 1% deviation
1.5% deviation from the
analytical value 1
3/28/2012 5 CAVITATION MODELLING USING RANS APPROACH / I.Oprea & N.Bulten

21 / © Wärtsilä
2D NACA0015n section: cavitating flow results
• Cavity volume variation over one period:
EXP: 16Hz (Arndt & co., 2000) In literature frequency variations from 11 to 24HZ
T~0.06s
f ~16Hz
3/28/2012 6 CAVITATION MODELLING USING RANS APPROACH / I.Oprea & N.Bulten
21 / © Wärtsilä
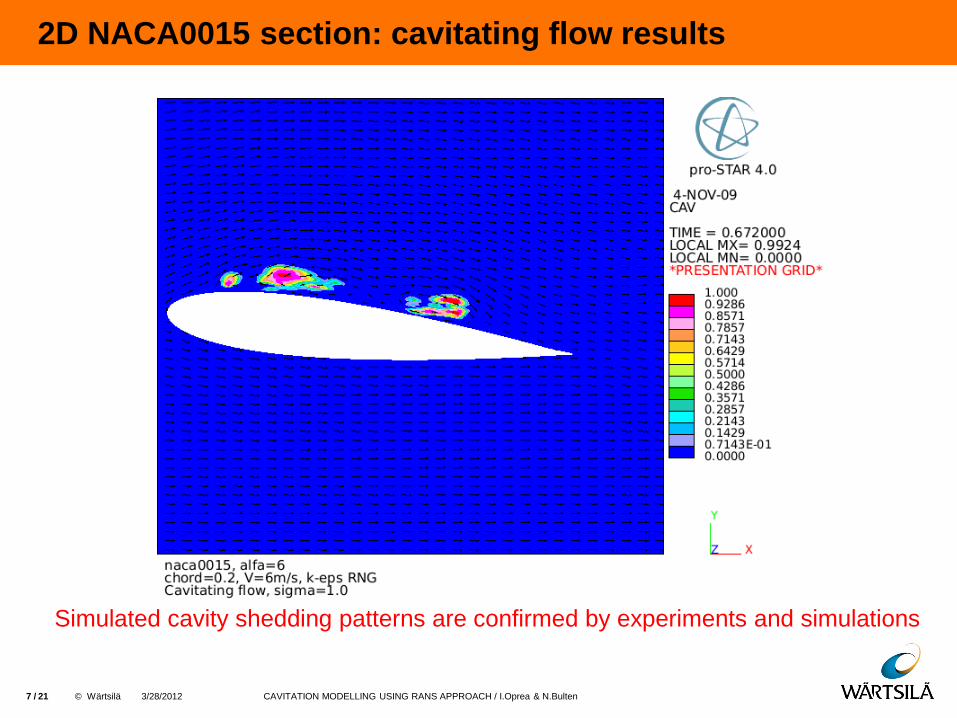
2D NACA0015 section: cavitating flow results
3/28/2012 7 CAVITATION MODELLING USING RANS APPROACH / I.Oprea & N.Bulten
Simulated cavity shedding patterns are confirmed by experiments and simulations

21 / © Wärtsilä
3D Twist-11 hydrofoil: case presentation
3D test case:
• NACA0009 profile
• O-grid approach
• Angle of attack: -2 (root) & 9 (mid) degrees
• Inlet velocity: 6.97m/s
• Outlet pressure: 29.0kPa=> sigma=1.07
• Time step: 0.00001(cavitation)
v
3/28/2012 8 CAVITATION MODELLING USING RANS APPROACH / I.Oprea & N.Bulten

21 / © Wärtsilä
3D Twist-11 hydrofoil: wetted flow results
• Pressure coefficient distribution:
• Lift prediction:
Mid-span low pressure due to
the foil design
Pressure and lift well predicted on the wetted flow case
3/28/2012 9 CAVITATION MODELLING USING RANS APPROACH / I.Oprea & N.Bulten
21 / © Wärtsilä
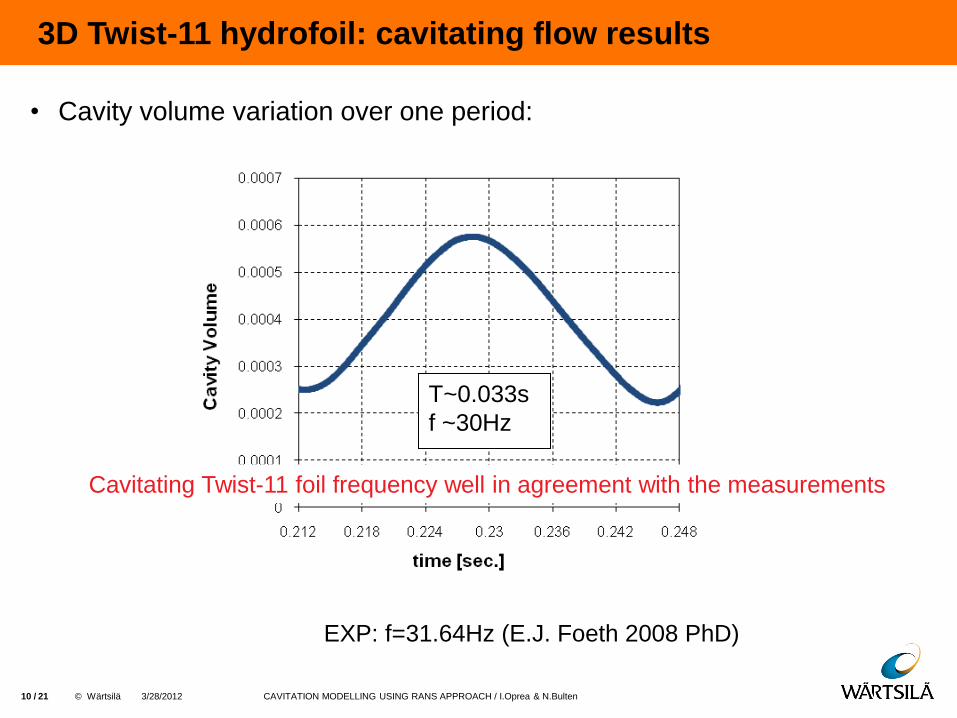
3D Twist-11 hydrofoil: cavitating flow results
• Cavity volume variation over one period:
EXP: f=31.64Hz (E.J. Foeth 2008 PhD)
T~0.033s
f ~30Hz
Cavitating Twist-11 foil frequency well in agreement with the measurements
3/28/2012 10 CAVITATION MODELLING USING RANS APPROACH / I.Oprea & N.Bulten

21 / © Wärtsilä 3/28/2012 11 CAVITATION MODELLING USING RANS APPROACH / I.Oprea & N.Bulten
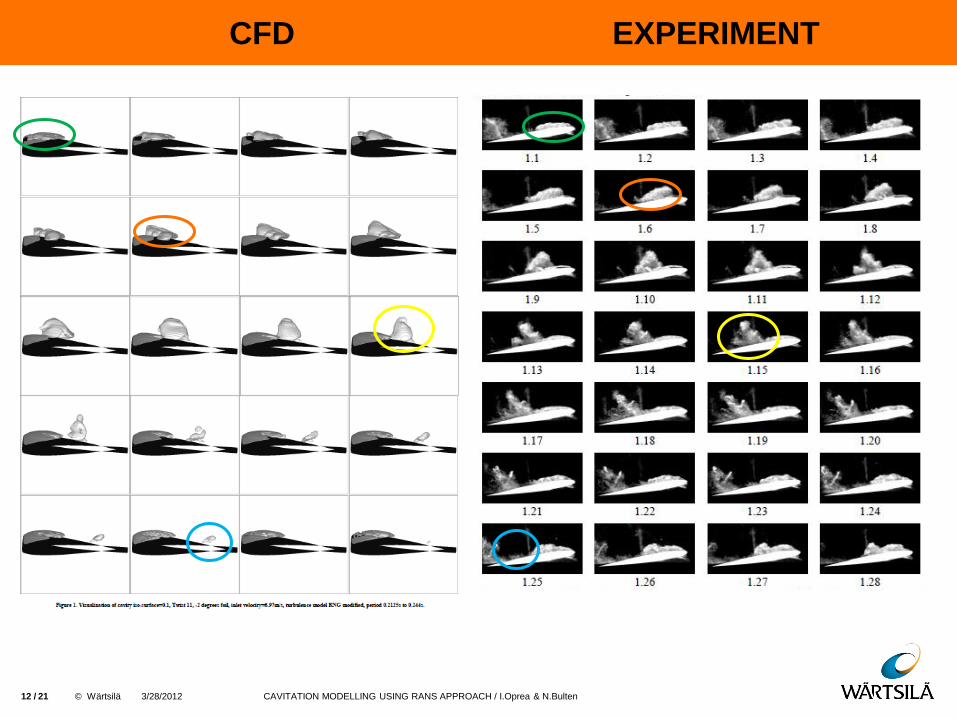
CFD EXPERIMENT
21 / © Wärtsilä 3/28/2012 12 CAVITATION MODELLING USING RANS APPROACH / I.Oprea & N.Bulten
CFD EXPERIMENT
21 / © Wärtsilä 3/28/2012 13 CAVITATION MODELLING USING RANS APPROACH / I.Oprea & N.Bulten
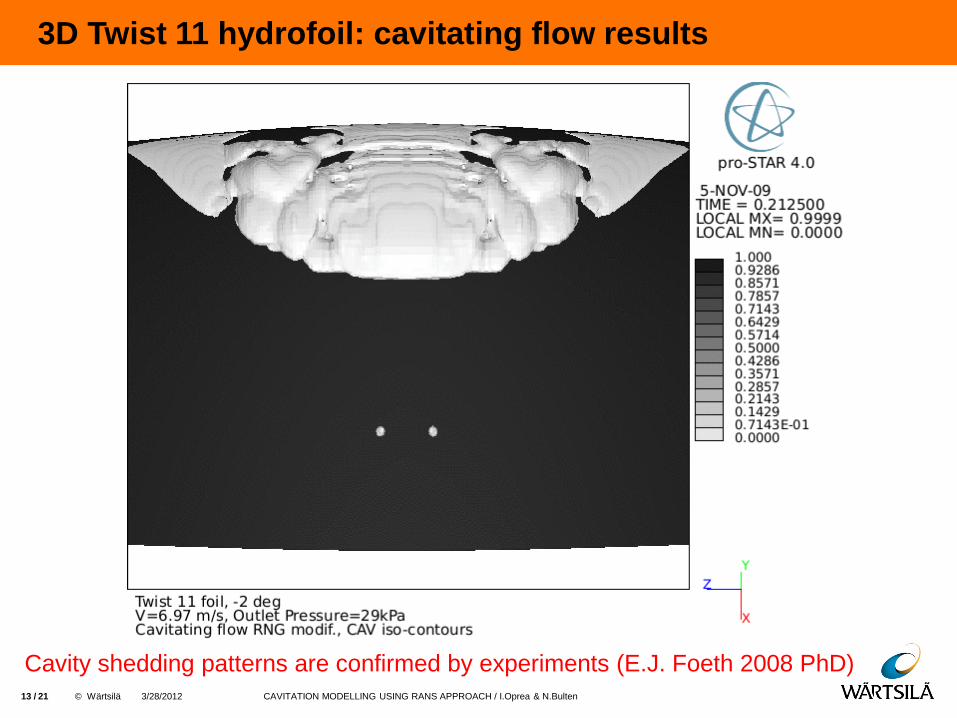
3D Twist 11 hydrofoil: cavitating flow results
Cavity shedding patterns are confirmed by experiments (E.J. Foeth 2008 PhD)

21 / © Wärtsilä
• For on period of shedding lift coefficient variation is:
3/28/2012 14 CAVITATION MODELLING USING RANS APPROACH / I.Oprea & N.Bulten
3D Twist 11 hydrofoil: cavitating flow results

21 / © Wärtsilä
2D & 3D benchmark test cases conclusions
• Wetted flow results on NACA0015 and Twist-11foil have been validated
and the results are well in agreement with measurements
• Cavitating flow on NACA0015 and Twist-11 foil do predict complex
cavity shapes well in agreement with the measurement observations
• Please note that these results could not be obtained with the standard
RNG k-ε turbulence model
• Safe to apply the current CFD method on a real propeller test case
• Wetted and cavitating flow results of the model scale skew propeller are
presented in the following
3/28/2012 15 CAVITATION MODELLING USING RANS APPROACH / I.Oprea & N.Bulten

21 / © Wärtsilä
Skew propeller: case presentation
• Propeller diameter=0.2333m
• Propeller RPM=840
• 4 million cells (1 million within the
tip vortex location based on
Q-factor & Cp grid refinement for one blade)
• Open water curves
3/28/2012 16 CAVITATION MODELLING USING RANS APPROACH / I.Oprea & N.Bulten
5242 Dn
TorqueKq
Dn
ThrustKt
nD
vJ ad
0
0.1
0.2
0.3
0.4
0.5
0.6
0.7
0.8
0.9
1
0 0.2 0.4 0.6 0.8 1 1.2
Kt,
10
Kq
, E
ffic
ien
cy
Advance Ratio, J
Kt CFD
10Kq CFD
Eta0 CFD
Kt EXP
10Kq EXP
Eta0 EXP
V
RPM
Performance is inline with the measurements

21 / © Wärtsilä
Skew propeller: wetted flow case
• Pressure coefficient (Cp) contour
on blade at Kt=0.32:
• Cp and Q-factor downstream
of propeller:
3/28/2012 17 CAVITATION MODELLING USING RANS APPROACH / I.Oprea & N.Bulten
i
j
j
i
i
i
x
u
x
u
x
uQ
2
2
1
2)(2
1nD
pCp
Tip vortex (low pressure + high Q-factor)
Q>0 => rotation is dominant and the region
is determining a vortex tube

21 / © Wärtsilä
• Blade pressure coefficient
contour and iso-surface=-2.27
at Kt=0.32:
• Cp downstream of propeller
(cavitation influence) and
vapor content
3/28/2012 18 CAVITATION MODELLING USING RANS APPROACH / I.Oprea & N.Bulten
Skew propeller: cavitating flow case
Lower pressure within the tip vortex core when cavitation is enabled

21 / © Wärtsilä
Skew propeller: tip vortex cavitation observations
• CFD simulations
(Pressure coefficient iso-surface=-2.27)
• Experiments
(HSVA, EU Leading Edge project)
3/28/2012 CAVITATION MODELLING USING RANS APPROACH / I.Oprea & N.Bulten 19
Predicted leading edge-tip vortex cavitation in agreement with the
experiment observations

21 / © Wärtsilä
Conclusions
• RANS simulations + modified RNG k-ε turbulence model + Rayleigh
cavitation model => cavitation simulation well agreement with the
measurement for the 2D NACA0015 and 3D Twist11 test cases
• Simulations on the skew propeller test case reveals the capability of the
method to predict also complex sheet-tip vortex cavitation on real
propeller design
• Based on the CFD cavitating simulations the design of future propellers
should benefit in terms of performance, noise and vibration
3/28/2012 20 CAVITATION MODELLING USING RANS APPROACH / I.Oprea & N.Bulten

21 / © Wärtsilä 3/28/2012 21 CAVITATION MODELLING USING RANS APPROACH / I.Oprea & N.Bulten
Questions?