prediction and simulation of mass spectrafiehnlab.ucdavis.edu/downloads/staff/...course-7.pdf5...
TRANSCRIPT
1
Welcome!
Mass Spectrometry meets Cheminformatics
WCMC Metabolomics Course 2013
Tobias Kind
Course 7: Prediction and simulation
of mass spectra
Biology
Chemistry
Informatics
http://fiehnlab.ucdavis.edu/staff/kind CC-BY License

2
History of artificial intelligence and mass spectrometry
Dendral project at Stanford University (USA)
Started in 1960s
Pioneered approaches in artificial intelligence (AI)
Aim:
Prediction of isomer structures from mass spectra
Idea: Self-learning or intelligent algorithm
Participants:
Lederberg, Sutherland, Buchanan, Feigenbaum,
Duffield, Djerassi, Smith, Rindfleisch, many others…
Status:
Failed; but inspirational until today (50 years later)
[Dendral PDF]
Figure: Heuristic DENDRAL:
A Program for Generating Explanatory Hypotheses in Organic Chemistry
Overview: DENDRAL: a case study of the first expert system for scientific
hypothesis formation; Artificial Intelligence 61 (1993) 209-261

3
Prediction and simulation of mass spectra
A) Prediction of the isomer structure or substructures from a given mass spectrum
The structure is directly deduced from the mass spectrum or generated by
a molecular isomer generator or existing structures can be found in a structure database
B) Simulation of a mass spectrum from a given isomer structure
The mass spectral peaks and abundances are generated by a machine learning algorithm
The structures can be obtained from a isomer database (PubChem, LipidMaps)
or a sequence database (Swiss-Prot, NCBI) in case of proteins
(mainlib) Coronene
40 60 80 100 120 140 160 180 200 220 240 260 280 3000
50
100
100 122 136
150
168 222 246 268
300
(mainlib) Coronene
40 60 80 100 120 140 160 180 200 220 240 260 280 3000
50
100
100 122 136
150
168 222 246 268
300

4
Prediction of substructures from mass spectra
Picture source: amdis.net
Working examples for EI mass spectra:
Varmuza classifiers in AMDIS and MOLGEN-MS
Substructure algorithm (Stein S.E.)
Implemented in NIST-MS search program
Mass spectral classifiers for supporting systematic structure elucidation
Varmuza K., Werther W., J. Chem. Inf. Comput. Sci., 36, 323-333 (1996).
Chemical Substructure Identification by Mass Spectral Library Searching
S.E. Stein, J. Am. Soc. Mass Spectrom., 1995, 6, (644-655)

5
Substructures deduced from mass spectra for
generation of isomer structures
Picture source: amdis.net
1) Molecular formula must be known - can be detected from molecular ion and isotopic pattern
2) Good-list (substructure exists) and bad-list (substructure not existent) approach
3) Sub-structures are combined in deterministic or stochastic (random) manner
4) Database or molecular isomer generator (combinatorial, graph theory) approach for
generating or finding possible structure candidates
Example:
Molecular formula C6ClH5O;
calculated from molecular ion
Goodlist:
Badlist:
Database (Chemspider): 25 hits
(including all possible existing structures)
MOLGEN Demo:
All constructed isomers: 8372
-benzene
-hydroxy
-chlorine
Total: 3 possible results

6
Aristo – ontology classification of EI mass spectra
http://www.ionspectra.org/aristo/

7
Application: Decision tree supported substructure
prediction of metabolites from GC-MS profiles
Source: Metabolomics. 2010 Jun;6(2):322-333. Epub 2010 Feb 16.
Decision tree supported substructure prediction of metabolites from GC-MS profiles.
Hummel J, Strehmel N, Selbig J, Walther D, Kopka J.
Decision tree Spectrum Compound structure
http://gmd.mpimp-golm.mpg.de/

8
Submit: mass spectral information.
Result: Ranked hit list of molecules
http://msbi.ipb-halle.de/MetFrag/
METFRAG: In silico fragmentation for mass spectral identification

9
Simulation of mass spectra
Why is simulation of mass spectral fragmentation important?
Imagine – you have a structure database of all molecules
Imagine – you can simulate mass spectra for all these molecules
Imagine – you can match your experimental spectra against a database of calculated spectra
Isomer DB Heuristic or de-novo
algorithm to generate
MS or MS/MS spectra MS DB
of theoretical spectra
10 30 50 70 90 110 130 150 170 1900
50
10031
43
60
73
119
131144
10 30 50 70 90 110 130 150 170 1900
50
10031
43
60
73
119
131144
Theoretical spectrum is depiction only, not truly simulated.
(*)
(*)

10
General methods for simulation of mass spectra
Heuristics or
rule based algorithms
Ab-initio or de-novo
first principle methods
Superior, because they solve
the problem at the root;
Slower to implement
Solve practical problems;
Faster to implement
EI-MS
CID-MS
CID-MS/MS
LipidBlast
QCEIMS
QCEIMS: Towards first principles calculation of electron impact mass spectra of molecules.; Grimme S.; Angew Chem Int Ed Engl. 2013 Jun
10;52(24):6306-12. doi: 10.1002/anie.201300158;
LipidBlast: LipidBlast in silico tandem mass spectrometry database for lipid identification. Kind T, Liu KH, Lee do Y, Defelice B, Meissen JK, Fiehn O.
Nature Methods. 2013 Aug;10(8):755-8. doi: 10.1038/nmeth.2551.
Approach Domain Example

11
Simulation of alkane mass spectra (I)
Approach
Use of artificial neural networks (ANN) (machine learning)
Electron impact spectra 70 eV
Substructure descriptors were used for calculation
Selection of 44 m/z positions – training was performed for correct intensity
117 noncyclic alkanes and 145 noncyclic alkenes
training set: 236 molecules
prediction set: 26 compounds
Problems
Prediction or validation set very small (should be 30%)
Prediction of molecular ion (usually very low abundant)
Overfitting possible, works only for selected substance classes
Source: WIKI
Source: Jalali-Heravi M. and Fatemi M. H.; Simulation of mass spectra of noncyclic alkanes and alkenes using artificial neural network

12
Simulation of alkane mass spectra (II)
Source: Jalali-Heravi M. and Fatemi M. H.; Simulation of mass spectra of noncyclic alkanes and alkenes using artificial neural network
Analytica Chimica Acta; Elsevier permission use for coursepack/classroom material
2,3,3-trimethylpentane (a and b) and 2,3,4-trimethylpentane (c and d). OKVWYBALHQFVFP-UHFFFAOYAT RLPGDEORIPLBNF-UHFFFAOYAR
Structures: Chemspider

13
Simulation or prediction of oligosaccharide spectra
(carbohydrate sequencing)
See Oscar and FragLib
See GlySpy
Source: Congruent Strategies for Carbohydrate Sequencing.
3. OSCAR: An Algorithm for Assigning Oligosaccharide Topology from MSn Data
http://www.pubmedcentral.nih.gov/articlerender.fcgi?artid=1435829
Consistent building blocks (sugars)
Consistent fragmentation allows in-silico fragment prediction
Pre-calculated fragments from known structures can be stored in database (use NIST-MS-Search)
Algorithm works also on-the-fly without database
De-novo algorithms work for truly unknown structures

14
Simulation of peptide fragmentations
(De-novo sequencing of peptides)
Principle:
De-novo sequencing of peptides (determine amino acid sequences)
De-novo algorithms can perform permutations and combinatorial calculations
from all 20 amino acids (superior if the sequence is not found in a database)
Highly dependent on good mass accuracy (less than 1 ppm) of precursor ion and MS/MS fragments
Generate match score by matching in-silico fragments against experimental MS/MS spectrum
Problems:
Leucine and isoleucine have same mass
Post translational modifications (PMTs)
Missing fragment peaks
Picture source: MWTWIN help file2 (Monroe/PNNL)
Picture 2 source: Tandem mass spectrometry data quality assessment by self-convolution
Keng Wah Choo and Wai Mun Tham http://www.biomedcentral.com/1471-2105/8/352

In-silico fragmentation with MassFrontier
using fragmentation library of 20,000 mechanisms from literature
Result fragmentations are represented as bar code spectra (same abundance)

16
Simulation of lipid tandem mass spectra (I)
Picture: Thanks to Yetukuri et al. BMC Systems Biology 2007 1:12 doi:10.1186/1752-0509-1-12
Single examples
Similar structures; plus CH2 in side chains sn1 and sn2; double bonds possible
Similar and almost constant fragmentation rules
Loss of head group (diagnostic ion in MS and MS/MS spectrum)
Loss of rest one (R1) and rest two (R2) can be observed in MS/MS spectrum

17
Combinatorial scaffold library design
sn1 = alkyl or acyl rest
sn2 = alkyl or acyl rest
head group
C10
C12
C14
C16
Scaffold (conserved) Linker Functional group (variable)
+ LipidMaps nomenclature name generation
+ accurate isotopic fragment calculation
+ mass spectral peak annotation
+ heuristic peak abundance modeling (CID voltage dependent)
+ conversion into mass spectral library format
choline
inositol
glycerol
Source: LipidBlast

18
Simulation of lipid tandem mass spectra (II)
Spectrum Source:Lipidmaps.org
C45H82NO8PGPCho269.2481303.2324526.3297544.3403492.3453510.355920:4(5Z,8Z,11Z,14Z)/17:0437796.5856
C45H82NO8PGPCho303.2324269.2481492.3453510.3559526.3297544.340317:0/20:4(5Z,8Z,11Z,14Z)437796.5856
C43H74NO10PGPSer269.2481301.2168526.2569544.2675494.2882512.298820:5(5Z,8Z,11Z,14Z,17Z)/17:0537796.5128
C43H74NO10PGPSer301.2168269.2481494.2882512.2988526.2569544.267517:0/20:5(5Z,8Z,11Z,14Z,17Z)537796.5128
C40H77O13PGPIns227.2011269.2481569.309587.3196527.2621545.272717:0/14:0031797.5180
C40H77O13PGPIns269.2481227.2011527.2621545.2727569.309587.319614:0/17:0031797.5180
FormulaHGsn2 acid(-)sn1 acid(-)M-sn2-H2O+HM-sn2+HM-sn1-H2O+HM-sn1+HAbbrev.DBCMass
Experimental
Mass spectrum
In-silico prediction
of MS/MS mass spectral fragments
Simulation of tandem mass spectra
or MS/MS fragment data from
LipidMaps

19
LipidBlast MS/MS mass spectral modeling
In-silico mass spectra:
• m/z fragments and abundance calculation required
• statistical (computer derived) and heuristic rules (experience of a human expert) 19
732.555 [Da].dta PC 32:1; [M+H]+; GPCho(16:0/ 16:1(7Z))Head to Tail MF=437 RMF=666
360 380 400 420 440 460 480 500 520 540 560 580 600 620 640 660 680 700 720 740
0
50
100
50
100
393.40846996748957
496.3987288063696
549.406572225188 613.2630013581689
673.3751991201706
713.4246597050723
673.48083
Experimental MS/MS
precursor m/z = 732.55
in-silico MS/MS match
precursor m/z = 732.55
[M+H]-H2O (-18)
[M+H]-C3H9N (-59)
[M+H]-C5H14NO4P (-183)
[M+H]-sn2
[M+H]-sn1
[M+H]-sn2-H2O
[M+H]-sn1-H2O
20
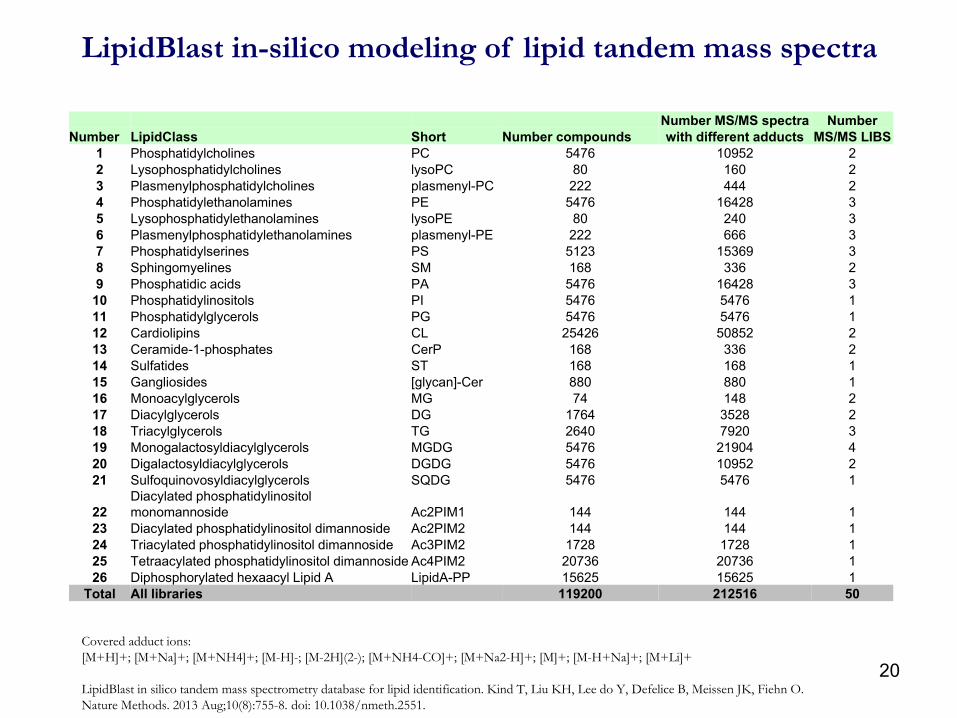
LipidBlast in-silico modeling of lipid tandem mass spectra
Number MS/MS spectra Number
Number LipidClass Short Number compounds with different adducts MS/MS LIBS
1 Phosphatidylcholines PC 5476 10952 2
2 Lysophosphatidylcholines lysoPC 80 160 2
3 Plasmenylphosphatidylcholines plasmenyl-PC 222 444 2
4 Phosphatidylethanolamines PE 5476 16428 3
5 Lysophosphatidylethanolamines lysoPE 80 240 3
6 Plasmenylphosphatidylethanolamines plasmenyl-PE 222 666 3
7 Phosphatidylserines PS 5123 15369 3
8 Sphingomyelines SM 168 336 2
9 Phosphatidic acids PA 5476 16428 3
10 Phosphatidylinositols PI 5476 5476 1
11 Phosphatidylglycerols PG 5476 5476 1
12 Cardiolipins CL 25426 50852 2
13 Ceramide-1-phosphates CerP 168 336 2
14 Sulfatides ST 168 168 1
15 Gangliosides [glycan]-Cer 880 880 1
16 Monoacylglycerols MG 74 148 2
17 Diacylglycerols DG 1764 3528 2
18 Triacylglycerols TG 2640 7920 3
19 Monogalactosyldiacylglycerols MGDG 5476 21904 4
20 Digalactosyldiacylglycerols DGDG 5476 10952 2
21 Sulfoquinovosyldiacylglycerols SQDG 5476 5476 1
22
Diacylated phosphatidylinositol
monomannoside Ac2PIM1 144 144 1
23 Diacylated phosphatidylinositol dimannoside Ac2PIM2 144 144 1
24 Triacylated phosphatidylinositol dimannoside Ac3PIM2 1728 1728 1
25 Tetraacylated phosphatidylinositol dimannoside Ac4PIM2 20736 20736 1
26 Diphosphorylated hexaacyl Lipid A LipidA-PP 15625 15625 1
Total All libraries 119200 212516 50
Covered adduct ions:
[M+H]+; [M+Na]+; [M+NH4]+; [M-H]-; [M-2H](2-); [M+NH4-CO]+; [M+Na2-H]+; [M]+; [M-H+Na]+; [M+Li]+
LipidBlast in silico tandem mass spectrometry database for lipid identification. Kind T, Liu KH, Lee do Y, Defelice B, Meissen JK, Fiehn O.
Nature Methods. 2013 Aug;10(8):755-8. doi: 10.1038/nmeth.2551.

21
LipidBlast MS/MS search with NIST MS search program
using precursor search and dot-product match can be used by practitioners
Experimental MS/MS list Experimental MS/MS list
Library hit scores Library hit scores
exp. MS/MS exp. MS/MS
in-silico MS/MS in-silico MS/MS
in-silico MS/MS in-silico MS/MS
exp. MS/MS exp. MS/MS
Search speed ~ 100 MS/MS spectra per second (without GUI)
22
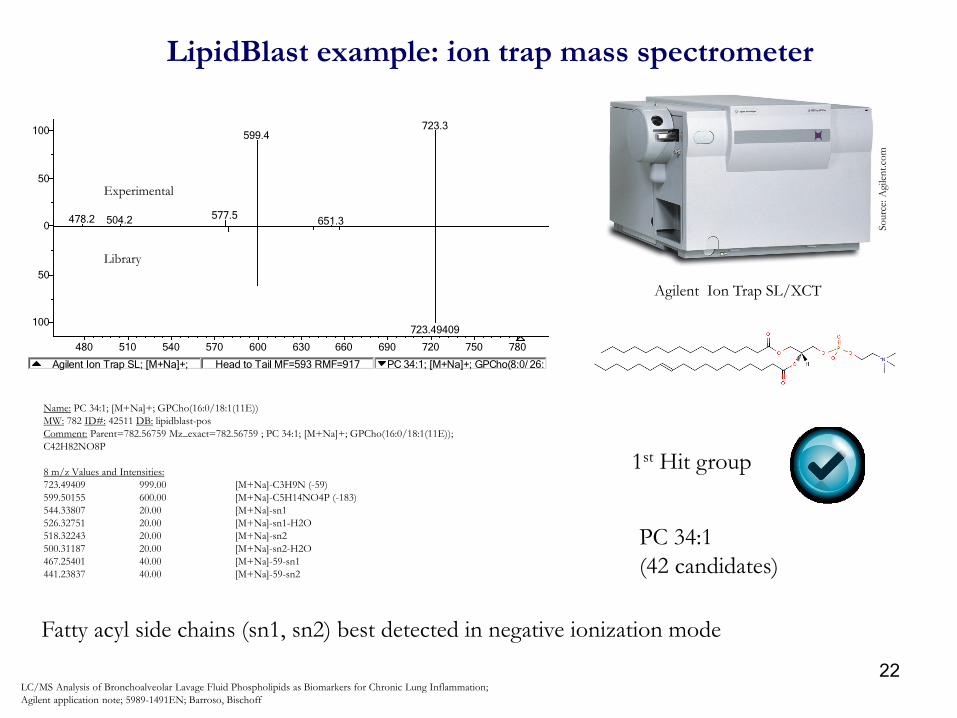
LipidBlast example: ion trap mass spectrometer
Agilent Ion Trap SL; [M+Na]+; PC 34:1; [M+Na]+; GPCho(8:0/ 26:1(5Z))Head to Tail MF=593 RMF=917
480 510 540 570 600 630 660 690 720 750 780
0
50
100
50
100
478.2 504.2 577.5
599.4
651.3
723.3
723.49409
Experimental
Library
LC/MS Analysis of Bronchoalveolar Lavage Fluid Phospholipids as Biomarkers for Chronic Lung Inflammation;
Agilent application note; 5989-1491EN; Barroso, Bischoff
1st Hit group
PC 34:1
(42 candidates)
Agilent Ion Trap SL/XCT
So
urc
e: A
gile
nt.
com
Name: PC 34:1; [M+Na]+; GPCho(16:0/18:1(11E))
MW: 782 ID#: 42511 DB: lipidblast-pos
Comment: Parent=782.56759 Mz_exact=782.56759 ; PC 34:1; [M+Na]+; GPCho(16:0/18:1(11E));
C42H82NO8P
8 m/z Values and Intensities:
723.49409 999.00 [M+Na]-C3H9N (-59)
599.50155 600.00 [M+Na]-C5H14NO4P (-183)
544.33807 20.00 [M+Na]-sn1
526.32751 20.00 [M+Na]-sn1-H2O
518.32243 20.00 [M+Na]-sn2
500.31187 20.00 [M+Na]-sn2-H2O
467.25401 40.00 [M+Na]-59-sn1
441.23837 40.00 [M+Na]-59-sn2
Fatty acyl side chains (sn1, sn2) best detected in negative ionization mode

23
LipidBlast example : Hybrid Ion-Trap (IT) and Time-of-Flight (TOF)
Source: A Chloroplastic UDP-Glucose Pyrophosphorylase from Arabidopsis Is the Committed Enzyme for the First Step of Sulfolipid Biosynthesis
Y Okazaki, M Shimojima, Y Sawada et al. The Plant Cell 21:892-909 (2009);
Shimadzu's LCMS-IT-TOF
So
urc
e: s
chim
adzu
.co
m
SHIMADZU LCMS-IT-TOF; [M-H]-; SQDG 34:3; [M-H]-; SQDG(16:0/ 18:3(6Z,9Z,12Z))Head to Tail MF=147 RMF=619
250 300 350 400 450 500 550 600 650 700 750 800
0
50
100
50
100
255.009
537.267
Name: SQDG 34:3; [M-H]-; SQDG(16:0/18:3(6Z,9Z,12Z))
MW: 815 ID#: 106150 DB: lipidblast-neg
Comment: Parent=815.49792 Mz_exact=815.49792 ; SQDG 34:3; [M-H]-;
SQDG(16:0/18:3(6Z,9Z,12Z)); C43H76O12S
559.25784 300.00 [M-H]-sn1
537.27348 300.00 [M-H]-sn2
277.21662 100.00 sn2 FA
255.23226 100.00 sn1 FA
225.00690 999.00 fragment C6H9O7S
Experimental
Library
1st Hit
SQDG 34:3
(8 candidates)

24
LipidBlast example : ion trap mass spectrometer
Thermo Finnigan LCQ/LTQ
Finnigan LCQ DECA ion trap mass spectrometer ; [M-H]-; LipidA PP [14/ 14/ 10/ 16/ 3O-(14)/ 3O-(14)]; [M-H]-;Head to Tail MF=719 RMF=916
1320 1360 1400 1440 1480 1520 1560 1600 1640 1680 1720 1760 1800
0
50
100
50
100
1324.0
1454.2
1552.2
1596.1
1698.2
1552.00785
1796.3Experimental
Library
Structural analysis of lipid A from Escherichia coli O157:H7:K- using thin-layer chromatography and ion-trap mass spectrometry;
Chang-Soo Lee, Yun-Gon Kim, Hwang-Soo Joo, Byung-Gee Kim; J Mass Spectrom. 2004 May;39(5):514-25.
2nd Hit
Lipid A (PP)
(16 candidates)
Name: LipidA PP [14/14/14/14/3O-(12)/3O-(14)]; [M-H]-;
MW: 1796 ID#: 64304 DB: lipidblast-neg
Comment: Parent=1796.21157 Mz_exact=1796.21157 ; LipidA PP [14/14/14/14/3O-(12)/3O-(14)]; [M-H]-;
C94H178N2O25P2; LipidA-PP-[R2(14:0)(3-OH)/R3(14:0)(3-OH)/R2'(14:0)/R3('14:0)/R2'-3-O-(12:0)/R3'-
3O-(14:0)]
9 largest peaks:
1552.00785 999.00 | 1698.23467 600.00 |
1796.21157 500.00 | 1498.05715 300.00 |
1470.02587 300.00 |
1596.03405 250.00 | 1568.00277 250.00 |
1454.03095 250.00 | 1714.22959 50.00 |
9 m/z Values and Intensities:
1796.21157 500.00 [M-H]-
1714.22959 50.00 [M-H]-PO3H
1698.23467 600.00 [M-H]-PO4H3
1596.03405 250.00 [M-H]-PO4H3-R2'-O-FA
1568.00277 250.00 [M-H]-PO4H3-R3'-O-FA
1552.00785 999.00 [M-H]-R2 acyl FA || [M-H]-R3 acyl FA
1498.05715 300.00 [M-H]-PO4H3-R2'-O-FA
1470.02587 300.00 [M-H]-PO4H3-R3'-O-FA
1454.03095 250.00 [M-H]-R2-PO4H3 || [M-H]-R3-PO4H3

25
So
urc
e: W
ater
s.co
m
Waters Synapt HDMS; [M+Na]+; PC 32:0; [M+Na]+; GPCho(16:0/ 16:0)Head to Tail MF=393 RMF=635
120 180 240 300 360 420 480 540 600 660 720
0
50
100
50
100
86.0943
146.9827
184.0753478.3405
573.4851
697.47840
697.4801
756.5524
Source: Direct Tissue Imaging and Characterization of Phospholipids Using MALDI SYNAPT HDMS System; Waters 2008; 720002444en
Emmanuelle Claude, Marten Snel, Therese McKenna, James Langridge;
Name: PC 32:0; [M+Na]+; GPCho(16:0/16:0)
MW: 756 ID#: 42167 DB: lipidblast-pos
Comment: Parent=756.55190 Mz_exact=756.55190 ; PC 32:0; [M+Na]+; GPCho(16:0/16:0); C40H80NO8P
5 m/z Values and Intensities:
697.47840 999.00 [M+Na]-C3H9N (-59)
573.48586 600.00 [M+Na]-C5H14NO4P (-183)
518.32238 20.00 [M+Na]-sn1 || [M+Na]-sn2
500.31182 20.00 [M+Na]-sn1-H2O || [M+Na]-sn2-H2O
441.23832 40.00 [M+Na]-59-sn1 || [M+Na]-59-sn2
Experimental
Library
Waters HDMS Synapt
1st Hit
PC 32:0
LipidBlast example : hybrid quadrupole ion mobility
spectrometry time-of-flight

26
The Last Page - What is important to remember:
Fragmentation and rearrangement rules and ion physics can be programmed into algorithms
Abundance calculations are problematic
Prediction of isomer substructures from mass spectra is possible
Works for reproducible mass spectra
A simplified simulation of mass spectra and simulation of fragmentation pattern
is only possible for certain molecule classes
Works only for peptides, lipids, oligosaccharides, alkanes
Does not work for all other molecules
Does not work with complex (side chain) modifications
Validation, Validation, Validation.
Proof must be given that algorithm works for large diverse sets of molecules (n=100..100,000)
27
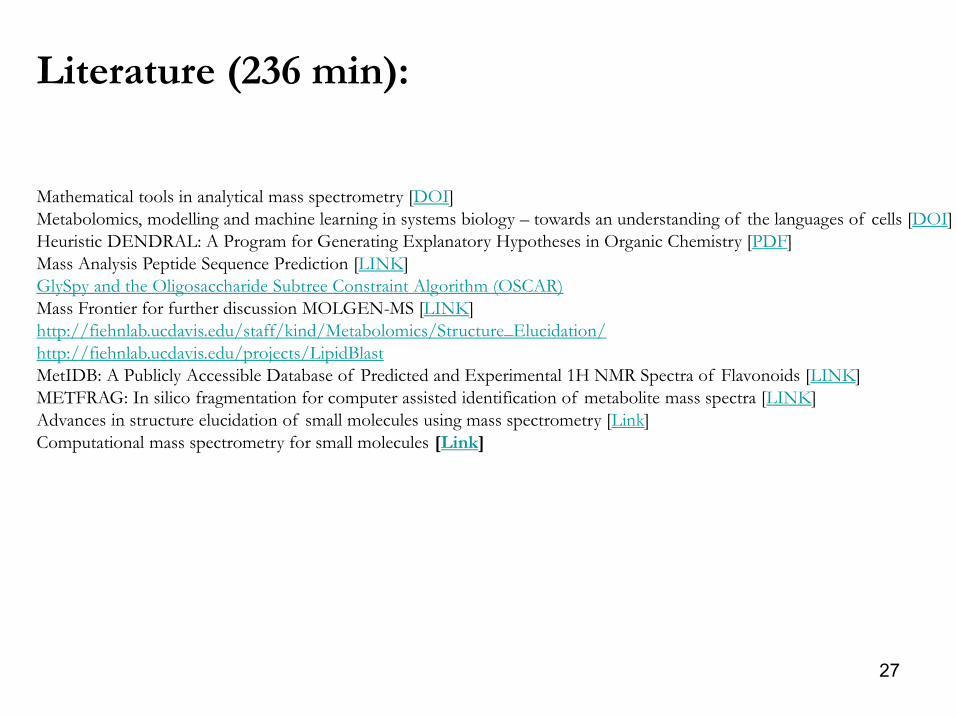
Literature (236 min):
Mathematical tools in analytical mass spectrometry [DOI]
Metabolomics, modelling and machine learning in systems biology – towards an understanding of the languages of cells [DOI]
Heuristic DENDRAL: A Program for Generating Explanatory Hypotheses in Organic Chemistry [PDF]
Mass Analysis Peptide Sequence Prediction [LINK]
GlySpy and the Oligosaccharide Subtree Constraint Algorithm (OSCAR)
Mass Frontier for further discussion MOLGEN-MS [LINK]
http://fiehnlab.ucdavis.edu/staff/kind/Metabolomics/Structure_Elucidation/
http://fiehnlab.ucdavis.edu/projects/LipidBlast
MetIDB: A Publicly Accessible Database of Predicted and Experimental 1H NMR Spectra of Flavonoids [LINK]
METFRAG: In silico fragmentation for computer assisted identification of metabolite mass spectra [LINK]
Advances in structure elucidation of small molecules using mass spectrometry [Link]
Computational mass spectrometry for small molecules [Link]