prediction and identification of some forbidden lines in the ne i sequence
TRANSCRIPT

P R E D I C T I O N A N D I D E N T I F I C A T I O N O F S O M E
F O R B I D D E N L I N E S I N T H E N e I S E Q U E N C E
(Research Note)
S. O. KASTNER
Spectroscopy Branch, Laboratory for Solar Physics and Astrophysics, NASA-Goddard Space Flight Center, Greenbelt, Md. 20771, U.S.A.
(Received 28 February; in revised form 18 April, 1974)
The magnetic quadrupole transition 2p 53s (3P2)_2p 6 (~S0), predicted by Garstang
to have an appreciable transition probability in the higher ions of the Ne I sequence,
has recently been observed in Fe xvII with high resolution by Parkinson (1973), at 17.086 A. This fixes the value of the 2p53s(ap1-3p2) interval in Fe xvII as 15500
cm- ~. The value of this interval is otherwise known only for Ne I and Mg m. Values
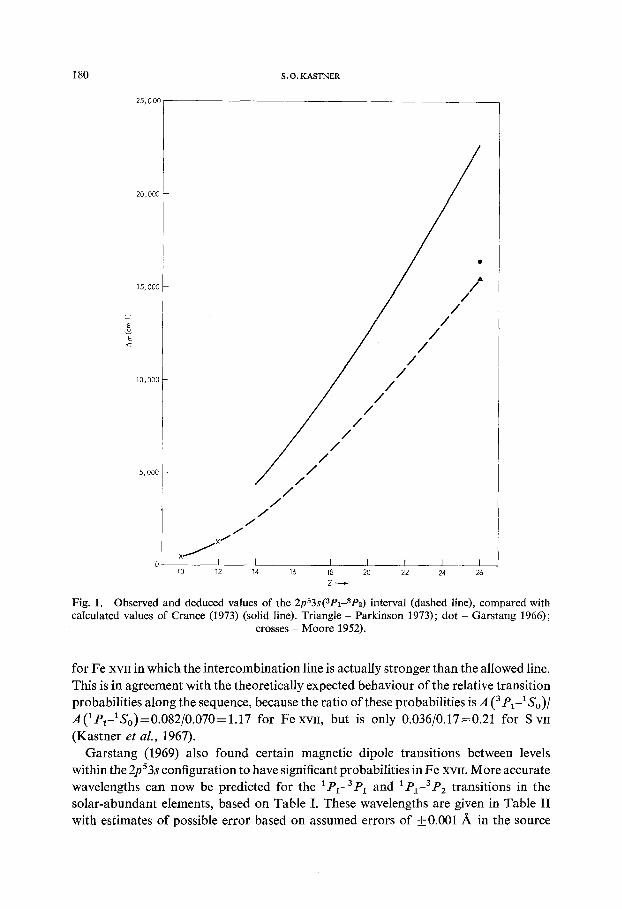
of this interval predicted by calculations of Crance (1973) are plotted in Figure 1, as
are three points corresponding to the above observations. It is seen that the observed
values may be connected by a curve (dashed) approximately paralleling the Crance
curve. Figure 1 includes an earlier value for Fe xvlI derived by Garstang (1966) which
is seen to be quite accurate. The interval values obtained from the dashed curve of Figure 1 are listed in Table I and are used to predict the values of the 2pS3s(aP2)-
2p6(1So) transition wavelengths in the ions Si v to Cr xv, as given in the table.
Error values given are based on an estimated possible error of _ 10700 in the Fe xvII
interval. The table also includes the known allowed and intercombination lines for comparison.
A line corresponding to this transition in S vii is present in the solar wavelength
list of Behring et al. (1972), at 72.898 A, of weaker intensity than the allowed line at 72.030 A. Interestingly, the intercombination line is not observed, unlike the situation
TABLE I
2p~3s intervals (cm -1) and 2p~3s-2p ~ wavelengths a (/~)
Ion 2p~3s(ZPl-aP2) 2p53s -- 2p 6 cm-1
~. (:tpl-lS0) 2 (aPI-ISo) 2 (aP~-ISo)
Si v 2500 d: 25 (117.860) (118.968) 119.322 • 0.036 S vii 4000 5:40 (72.029) (72.663) 72.874 • 0.022 Ar Ix 6000 5:60 (48.73) (49.18) 49.33 • 0.02 Ca xI 8 500 t 90 (35.212) (35.576) 35.684 • 0.011 Ti xIII 11000 • 110 (26.641) (26.960) 27.040 5:0.008 Cr xv 13 500 • 140 (20.863) (21.153) 21.213 • 0.007 Fe xvIi 155005:160 (16.769) b (17.041) b (17.086) b
Wavelengths in parentheses are known (observed) values, taken from Kelly and Palumbo (1973). b Observed by Parkinson (1973).
Solar Physics 37 (1974) 179-181. All Rights Reserved Copyright �9 1974 by D. Reidel Publishing Company, Dordrecht-Holland
] 8 0 $. O . KASTNER
E
b
25,000
20,000
] 5,000
10,000
5,000
/ /
/ / /
/ /
/ /
/
x /
TO 12 14 16
/ /
/ /
/
/,- /
/ /
/ /
/ /
0 I I t I I 18 20 22 24 26
Z ~
Fig. 1. Observed and deduced values of the 2p53s(3Pt-zP2) interval (dashed line), compared with calculated values of Crance (1973) (solid line). Triangle - Parkinson 1973); dot - Garstang 1966);
crosses - Moore 1952).
for Fe xvII in which the intercombination line is actually stronger than the allowed line. This is in agreement with the theoretically expected behaviour o f the relative transition probabilities along the sequence, because the ratio of these probabilities is A (s pl_lSo)/ A('p~-1So)=O.082/O.070=l.17 for Fe xvli, but is only 0.036/0.17=0.21 for S vii (Kastner et al., 1967).
Garstang (1969) also found certain magnetic dipole transitions between levels within the 2pS3s configuration to have significant probabilities in Fe xvn. More accurate wavelengths can now be predicted for the 1P1-3p1 and aP1-3P 2 transitions in the solar-abundant elements, based on Table I. These wavelengths are given in Table II with estimates of possible error based on assumed errors of _0.001 A in the source

PREDICTION AND IDENTIFICATION OF SOME FORBIDDEN LINES IN THE Ne I SEQUENCE
TABLE II
Wavelengths of transitions within 2p53s configuration (/~)
Ion 2 (1Pl-~P1) 2 (1pI-ap~)
S vii 8258 :t- 30 6207 • 20 Ar IX 5328 :t- 150 4037 4-100 Ca xI 3448 -t- 25 2667 • 15 Fe x'ai 1051 • 8 904 • 6
181
wavelengths; this la t ter assumpt ion may of course be an opt imis t ic one. The Fe xwI
(1P l -3p2) l ine at 904 ~ may be present in the solar list of Bur ton and Ridgeley (1970),
who a t t r ibute this wavelength to a different t rans i t ion (in C I0. The 3 po_3 PI t rans i t ion
should be o f significant intensi ty also according to Ga r s t ang ' s values bu t present lack
of knowledge of the pos i t ion of the 3P o level prevents accurate wavelength est imates.
References
Behring, W. E., Cohen, L., and Feldman, U. : 1972, Astrophys. J. 175, 493. Burton, W. M. and Ridgeley, A.: 1970, Solar Phys. 14, 3. Crance, M.: 1973, Atomic Data 5, 185. Garstang, R. H. : 1966, Publ. Astron. Soc. Pacific 78, 399. Garstang, R. I-L : 1969, Publ. Astron. Soc. Pacific 81, 488. Kastner, S. O., Omidvar, K., and Underwood, J. H. : 1967, Astrophys. J. 148, 2,69. Kelly, R. L. and Palumbo, L. J. : 1973, N.R.L. Report 7599 (Naval Research Laboratory, Washington,
D.C.). Parkinson, J. H. : 1973, Astron. Astrophys. 24, 215.