prediction and analysis of edm performances considering
TRANSCRIPT

Prediction and analysis of EDM performancesconsidering random multiple-pulse dischargesbased on geometric optimization modelingQin Ni
Nanjing Tech UniversityYan Zhang ( [email protected] )
Nanjing Tech UniversityKebing Zhou
National Key Laboratory for Remanufacturing, BeijingGuoqian Wang
Nanjing Tech UniversityLei Ji
Nanjing Tech UniversityWentao Yang
Nanjing Tech University
Research Article
Keywords: Random multiple pulses, Electrical discharge machining, Machining mechanisms, Geometryoptimization theory, Multi-pulse numerical simulation, Prediction model
Posted Date: August 30th, 2021
DOI: https://doi.org/10.21203/rs.3.rs-849491/v1
License: This work is licensed under a Creative Commons Attribution 4.0 International License. Read Full License
Prediction and analysis of EDM performances considering random
multiple-pulse discharges based on geometric optimization modeling
Qin Ni1, Yan Zhang1*, Kebing Zhou2, Guoqian Wang1, Lei Ji1, Wentao Yang1
1. School of Mechanical and Power Engineering, Nanjing Tech University, Nanjing 211800, PR China
2. National Key Laboratory for Remanufacturing, Beijing, PR China
TEL: 86-25-58139346
Fax: 86-25-58139346
Email: [email protected] (*corresponding author)
ABSTRACT
Continuous electrical discharge machining (EDM) is characterized by random discharge positions, uncertain discharge energy, extremely short discharge time, extremely narrow tool-workpiece gaps, etc. Theoretical research into the mechanisms leading to thermal erosion of material and the associated surface morphology has become urgent to allow the continued development and application of EDM technology. Firstly, multi-pulse theory and geometric optimization are utilized to derive an expression for the material removal rate and surface roughness in multi-pulse EDM. Secondly, Based on the characteristics of multi-pulse discharge, a multi-pulse numerical simulation model was established to predict the material removal volume, surface roughness and thickness of recast layer. Finally, the results predicted by the geometric and numerical models are compared with the experimental results. Experimentally, 0.176 mg of material is removed in the multi-pulse EDM; the theoretical calculation and numerical simulation of the same produce errors of 5.11% and 11.36%, respectively. The analogous results for the surface roughness are 1.623 μm, 8.93%, and 1.23%. The experimentally determined thickness of the recast layer was 5.31 μm, which corresponds to an error in the simulation error of 7.53%.
Keywords: Random multiple pulses; Electrical discharge machining; Machining mechanisms; Geometry optimization theory; Multi-pulse numerical simulation; Prediction model.
1. Introduction
The global manufacturing industry is evolving toward increasing precision, miniaturization, and complexity, thereby requiring ever more parts and components with complex, ultrasmall curvatures or cross-scale features made of difficult-to-machine materials (mostly titanium alloys, nickel-based alloys, cobalt-based alloys, etc.), which are difficult to manufacture with traditional processing technology [1]. Electrical discharge machining (EDM) uses low macroscopic force, can process all conductive materials, and offers facile control of the discharge energy [2]. It is thus one

of the most widely used nontraditional processing technologies and is used, for example, in the fields of aerospace, medical equipment, and instrumentation [3].
EDM uses high-energy, high-density sparks between electrodes to remove material. Material removal [4] results from the combined effects of thermal energy, electromagnetic force, and fluid power. At present, research into EDM technology focuses mostly on material-removal rate, electrode loss, micro-hole tapering, surface quality [5], tool electrode structure [6], working fluid [7], flushing pressure, and electrical parameters [8]. Given the random discharge positioning, discharge-state instability, extremely high discharge frequency, and narrow discharge gap in the EDM discharge process [9], a good understanding of these issues is urgently needed to support the development and application of EDM technology.
The continuous-pulse EDM process is characterized by random discharge positions, uncertain discharge energy, short discharge duration, and narrow discharge gap. The surface topography of the workpiece can be regarded as the result of the random stacking of countless single-spark craters [10]. To investigate the material-removal mechanism of the workpiece and the mechanism that forms the surface topography, some groups have studied material removal by single-pulse discharge. For example, Kuriachen et al. [11] developed a transient three-dimensional thermodynamical model by using the finite-volume method to estimate the crater geometry in single-pulse EDM. They predicted the temperature distribution along the X, Y, and Z directions of the workpiece under different voltages and capacitances by using the plasma radius and interpolar energy of the Gaussian constant-heat-flux distribution. Joshi et al. [12] used a finite-element method to develop a nonlinear, transient, thermal physics model of single-pulse EDM. To predict the shape of the etch crater and the material-removal rate, they assumed EDM characteristics; for example, they used a Gaussian heat-flux distribution and a discharge radius derived from the discharge current, discharge duration, and latent heat of melting. Tao et al. [13] proposed and experimentally verified a numerical model of anode-surface crater formation during discharge machining. The model considers that material removal in EDM consists of two continuous stages: (i) the local application of a high thermal-energy density to melt the working material and (ii) the fluid impact to discharge the molten material. The simulation gives the geometric shapes of the crater and debris and its verification experimentally under different discharge conditions shows that it accurately describes the formation mechanism of EDM craters. Shabgard et al. [14] used ABAQUS finite-element software to simulate the temperature distribution of workpiece surface and electrode surface during discharge in EDM. The results reveal that the energy distribution coefficient varies between electrodes and depends on the process settings. The distribution coefficient directly determines the efficiency with which plasma removes material. The results show that this efficiency decreases as the peak current and pulse width increase.
Another avenue of research has used single-pulse discharge to study the material-removal mechanism in the continuous discharge process. For example, based on the stochastic machining process and probability theory, Liu et al. [15] proposed an innovative modeling method to simulate numerous random-discharge processes in EDM. Other work has focused on simulating nickel-titanium alloy EDM to study thermal diffusion in a large number of random discharges. After a large number of high-frequency random discharges, the surface morphology of the workpiece reflects the

pulse characteristics. The temperature gradient below the surface is large, whereas the temperature gradient in the deep layer gradually decreases with layer depth. For continuous-pulse EDM, Jithin et al. [16] developed a theoretical model of the formation of surface texture and roughness of the workpiece. The model involves multiple-spark random generation with random space, time, and energy and assumes that every spark evenly heats the workpiece. Finite-element thermal simulations predict the three-dimensional texture and roughness parameter (i.e., average height). In continuous-pulse EDM, the thickness of the recast layer on the workpiece surface is an important metric of process performance and reflects the degree of crack propagation on the processed surface and the thickness of the alloy on the surface defect layer. But at present the widely accepted EDM heat source is Gaussian heat source. Tan et al. [17] proposed a numerical model to predict the thickness of the recast layer based on multi-pulse EDM. The multi-discharge method considers the overlapping of craters on the machined surface and regards the recast layer as a combination of single recast areas generated by a single crater. A finite-element model of the disc-shaped heat source and the pulse-width-dependent plasma discharge channel radius allows the contour of the hemispherical crater to be estimated. The simulation model is too simple to predict the hole morphology and surface quality of EDM. The dynamics of continuous multi-pulse discharge was studied by Tang et al. [18], who simulated the temperature field of continuous multi-pulse electric spark discharge based on the characteristics of SiC/Al functionally graded materials. Analyzed using the method of life and death Location of electric erosion crater Random distribution. Comparing the simulation results with experimental data revealed that the maximum (minimum) error of the predicted material removal rate is 9.84% (5.10%). But the removal quality of material in continuous EDM was only investigated.
The present study investigates the mechanism of continuous sparking with random discharge position, uncertain discharge energy, extremely short discharge duration, and an extremely narrow discharge gap. Firstly, multi-pulse theory and geometric optimization are utilized to derive an expression for the material removal rate and surface roughness in multi-pulse EDM. Secondly, Based on the characteristics of multi-pulse discharge, a multi-pulse numerical simulation model was established to predict the material removal volume, surface roughness and thickness of recast layer. Finally, the results predicted by the geometric and numerical models are compared with the experimental results.
2. Mathematical analysis and prediction of multi-pulse discharge
2.1 Establishment of geometric model of multi-pulse discharge
Continuous pulsed electrical spark discharge creates numerous craters superimposed upon each other on the workpiece surface. These craters are randomly distributed and overlap each other. In this section, the limit discharge times required for the complete removal of surface materials in a circular region with a diameter of 1mm in multi-pulse discharge are discussed, and the volume of material removal and surface roughness are further analyzed.
A1 represents the machining area of single pulse spark discharge, and A2 represents the total area to be machined. Through geometric modeling, the number of the single-pulse machining area A1 completely covering the total machining area A2 was calculated. The Times of continuous spark

discharge were deduced, and the material removal volume and surface roughness were further deduced.
The sufficient condition for a number of circular areas A1 to completely cover a specific area A2 is that internally connected regular polygons in A1 combine to completely cover the area A2, as shown in Fig. 8a. Therefore, the problem of full coverage of inscribed regular polygons is discussed. Suppose the polygons n are connected to each other, each with an inner angle of θ. Take the center of the regular polygon as the center of the circle, we assume that m such regular polygons can be interconnected without overlapping. Summing the n interior angles of the polygon leads to:
𝜃 = 180°×(𝑛−2)𝑛 = 360°𝑚 . (1)
Because 𝑛 ∈ 𝑁∗ and 𝑛 ≥ 3, only when 𝑚 = (3,4,6),n can meet the requirements,and 𝑛 =(6,4,3). Therefore, if the inscribed regular polygons are assembled and connected without overlap, the basic geometric element must be regular triangles, squares, or regular hexagons.
The overlapping area S1 accounts for a fraction k of the entire circular area S, which can be expressed as 𝑆1 = 2(𝑆𝐴0�̂�−𝑆𝐴𝑂𝐵) = 𝑟2𝛼 − 𝑟2sin(𝛼), (2)
𝑘 = 𝑆1𝑆 = 𝑟2𝛼−𝑟2sin(𝛼)𝜋𝑟2 = 𝛼−sin(𝛼)𝜋 , (3)
𝜕𝑘𝜕𝛼 = 𝜕(𝛼−sin(𝛼)𝜋 )𝜕𝛼 = 1𝜋 [1 − cos(𝛼)]. (4)
As seen from the equations, k is independent of the circular radius r, whereas k increases with the regular polygon angle 𝜃. When the internal angles of the triangles, squares and hexagons are 30°, 45°, 60°, k = 39.09%, 18.15%, 5.77%, respectively.
Fig. 1b–1d show the inscribed regular polygons. The overlap area of the inscribed triangles, squares, and hexagons occupy 39.09%, 18.15%, and 5.77% of the area of the circle, respectively. The larger the overlap area, the greater the number of galvanic craters required to cover the entire processing area. Therefore, by calculating the number of circles required to cover the entire processing area with a regular hexagonal grid, we obtain the minimum number of continuous pulses required to process the entire plane under ideal conditions. In addition, the minimum and maximum surface roughness can be calculated. By calculating the number of circles required to cover the entire processing area with a triangular grid, we obtain the maximum number of continuous pulses required to process the entire area, the maximum volume of material removed, and surface of the entire processing area the minimum residual height can be calculated.

Fig. 1. Three non-overlapping connection schemes using polygons inscribed in circles. (a) Geometric optimization. (b) Surface covered by equilateral triangles. (c) Surface covered by squares. (d) Surface covered by hexagons.
2.2 Predicting volume of material removed and surface roughness
Using the non-overlapping inscribed hexagons to cover the entire processing area produces the schematic diagram shown in Fig. 9. A minimum of 367 craters is required to completely cover the entire processing area. The equation Z(X, Y) describing the concave surface is derived from the crater diameter and depth. The double integral of the projection region of the surface equation Z(X, Y) on the XOY section is calculated to obtain the volume V1 of material removed from a single crater. The specific formula is
𝑉1 = ∬ 𝑍(𝑥, 𝑦)𝑑𝑥𝑑𝑦𝑠 , (5)
𝑍(𝑥, 𝑦) = 𝑅 − 𝐻 − √𝑅2 − 𝑥2 − 𝑦2, (6)
where R is the radius of the sphere formed by the crater, and H is the depth of the crater. The total volume V of material removed is
𝑉 = 𝑁 ∬ 𝑟2+𝐻22𝐻 − 𝐻 − √(𝑟2+𝐻22𝐻 )2 − 𝑥2 − 𝑦2𝑑𝑥𝑑𝑦𝑠 , (7)
O
A
Br
θα
n
S1
A2
A1
360m
Effective processing area
Center Circle-1
Connecting Circle-2
1 2 1 2
1 2
(a) (b)
(c) (d)
Area of overlapping craters

where N is the number of discharge craters, and r is the crater diameter. The residual height h of the workpiece surface is
ℎ = 𝑟2+𝐻22𝐻 − √(𝑟2+𝐻22𝐻 )2 − (𝑟cos 𝛼2)2. (8)
The tool electrode used in experiments was 1 mm in diameter. The experimental results with a voltage of 80 V, a peak current of 14 A, a pulse width of 6 µs, and a pulse gap of 12 µs, a cross-sectional diameter of a single-pulse crater of 60.7 μm can be obtained. Fig. 2 shows the morphology of a crater formed by single-pulse EDM. The profile of the concave crater is approximately circular with lips formed around the crater edge (see Fig. 2b), which is attributed to molten and vaporized metal sputtered from the crater and condensing around the edge. Fig. 2b is the cross-sectional profile of the crater's central location, which reveals a crater diameter of 60.69 µm and a depth of 6 µm.
(a) (b)
Fig. 2. Morphology of single-pulse spark discharge crater: (a) SEM image of single crater, (b) geometric profile of single crater.
Through a geometric calculation, the volume of material removed from a single crater is 8.48×10⁻⁶ mm3, and the total volume of material removal from the entire processing area is 0.0031 mm3. When covered in a hexagonal grid, the distance between the centers of two adjacent craters is 52.56 µm. The residual height of the junction between craters is 4.455 µm (see Fig. 3b).
workpiece surface
Processing area
Spark crater
Regular hexagon
x
z
r O O1
Contour of XOZ section in depth direction
H
R
h
(a) (b)

Fig. 3. (a) Schematic diagram showing hexagonal grid covering the entire processing area. (b) Schematic diagram showing residual height between craters.
Fig. 4 shows a schematic diagram of an equilateral-triangle grid covering the entire processing area. It can be found from the figure that 733 equilateral triangles are required, without overlap, to cover the entire processing area, which means that a minimum of 733 pulses is required to treat the entire area. The surface equation Z(X, Y) formed by a single concave crater is consistent with the Eqs. (5) and (6), and the area projected on the XOY plane is an equilateral triangle. Based on the double integral theory, 0.004 mm3of material are removed, and the distance between adjacent crater centers is 30.35 µm. The surface residual height of the workpiece is 1.457 µm based on the surface equation of a single EDM crater.
Fig. 4. (a) Schematic diagram showing connected equilateral triangles covering the entire processing area. (b) Schematic diagram of residual height in vertical direction.
To summarize, a minimum of 367 pulses are required to process a 1-mm-diameter circular processing area, and the maximum number of pulses is 733. The maximum (minimum) of 0.004 (0.003) mm3 of material is removed from this plane, and the maximum (minimum) surface residual height is 4.455 (1.457) µm.
3. Simulation analysis of random discharge in continuous-pulse EDM
The size and distribution of the craters formed by single-pulse spark discharge directly determine the surface morphology and material-removal efficiency. The continuous-pulse spark discharge process is repeated by each single-pulse spark discharge. However, in contrast with single-pulse discharge, the position of continuous pulse discharge is random, and the temperature field formed by the previous discharge can also affect the temperature distribution and material removal efficiency for the subsequent discharge. Therefore, investigating continuous-pulse EDM and analyzing how continuous-pulse discharge affects material erosion can lead the way to accurate predictions of the volume of material removed, the surface roughness, and thickness of the recast
x
z
r O O2
H
R
Equilateral
workpiece surface
Processing area
Spark crater
Contour of XOZ section in depth direction
h
(a) (b)

layer. In this chapter, the thermal removal process of continuous EDM is analyzed.
3.1 Mathematical model of discharge channel radius and heat transfer based on Gaussian heat source
EDM uses the large amount of thermal energy released by a spark discharge between electrodes to molten materials. When the interpolar electric field exceeds 105 V/mm, the inter-electrode dielectric breaks down and a discharge channel forms. The various forces between the electrodes result in an unevenly distributed high-temperature plasma in the discharge channel [3]. The electron density is greatest at the channel center and decreases to zero at infinite radial distance. Based on the distribution of charged particles between the electrodes, we use a Gaussian distribution of the heat flux density to describe the spatial distribution of charged particles between the electrodes [9]. The heat flux at a point a radial distance r from the center of the discharge channel can be expressed as
2P2 2
( ) exp ,
p p
UI mrq r
R R
(9)
where U is the open-circuit voltage, 𝐼𝑃 is the peak current, 𝜂 = 0.18 is the anode energy distribution coefficient [15], 𝑅𝑝 is the radius of the discharge channel, and m = 0.3 is the shape factor of the Gaussian heat source.
Lou [19] provides the following empirical formula for the discharge-channel radius:
0.35 0.38P on on b
0.35 0.38P b on b
2.85
2.85 ,P
I t t TR
I T t T
(10)
4 3 2b P P P P0.00002 0.0025 0.0122 2.7292 1.2881,T I I I I (11)
where 𝑡on is the pulse width and 𝑇b is the best pulse width. In EDM, heat is transferred in the discharge channel by radiation and between the workpiece
and environment by heat convection, which can be expressed as
𝐾 𝜕𝑇𝜕𝑧 = { 𝑞(𝑟) 𝑟 ≤ 𝑅𝑝ℎ𝑐(𝑇 − 𝑇𝑂) 𝑟 > 𝑅𝑝, (12)
where ℎ𝑐 is the convective heat transfer coefficient of the inter-electrode gap dielectric.
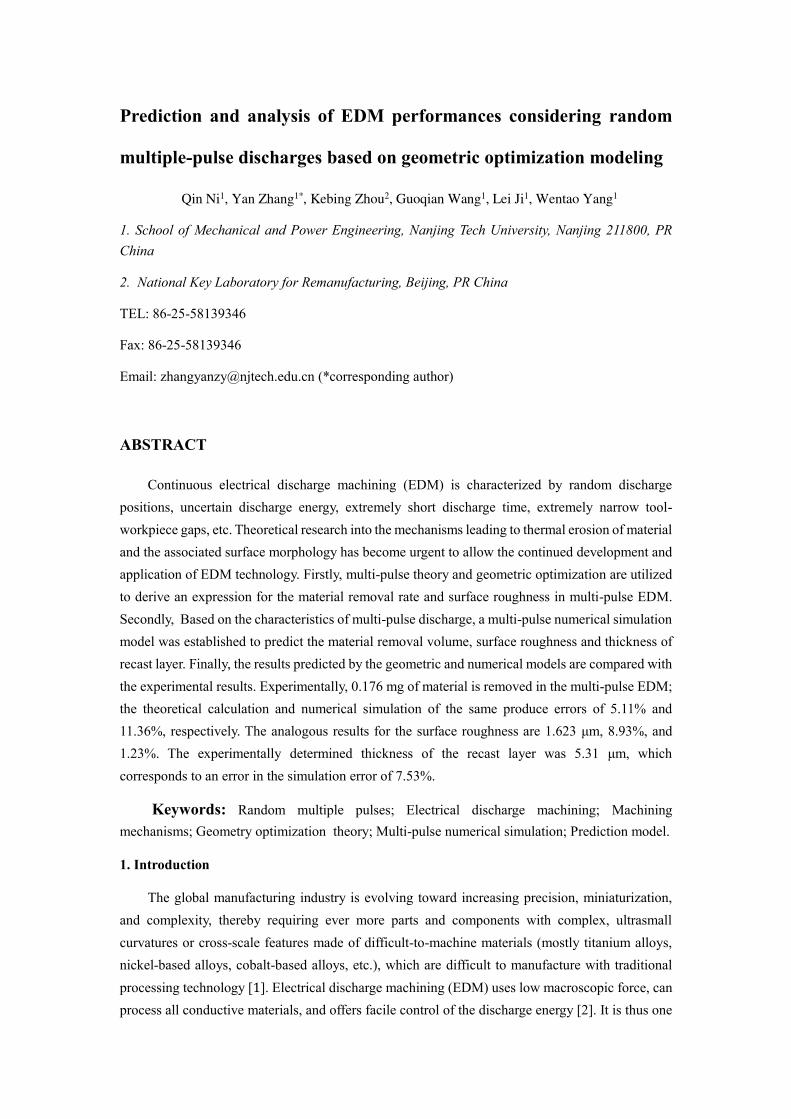
The workpiece is stainless steel and with a density of 7860 kg/m3, a melting point of 1360 °C, a boiling point of 2800 °C, and a thermal conductivity of 15 W m−1 K−1. In EDM, the workpiece is bombarded by a high density of charged particles and quickly changes phase from solid to liquid, so the latent heat of melting of the workpiece material must be considered in the thermodynamic analysis. This is dealt with by using the relationship between the enthalpy of the material and temperature. Fig. 5 shows the material thermophysical parameters of the material [20].
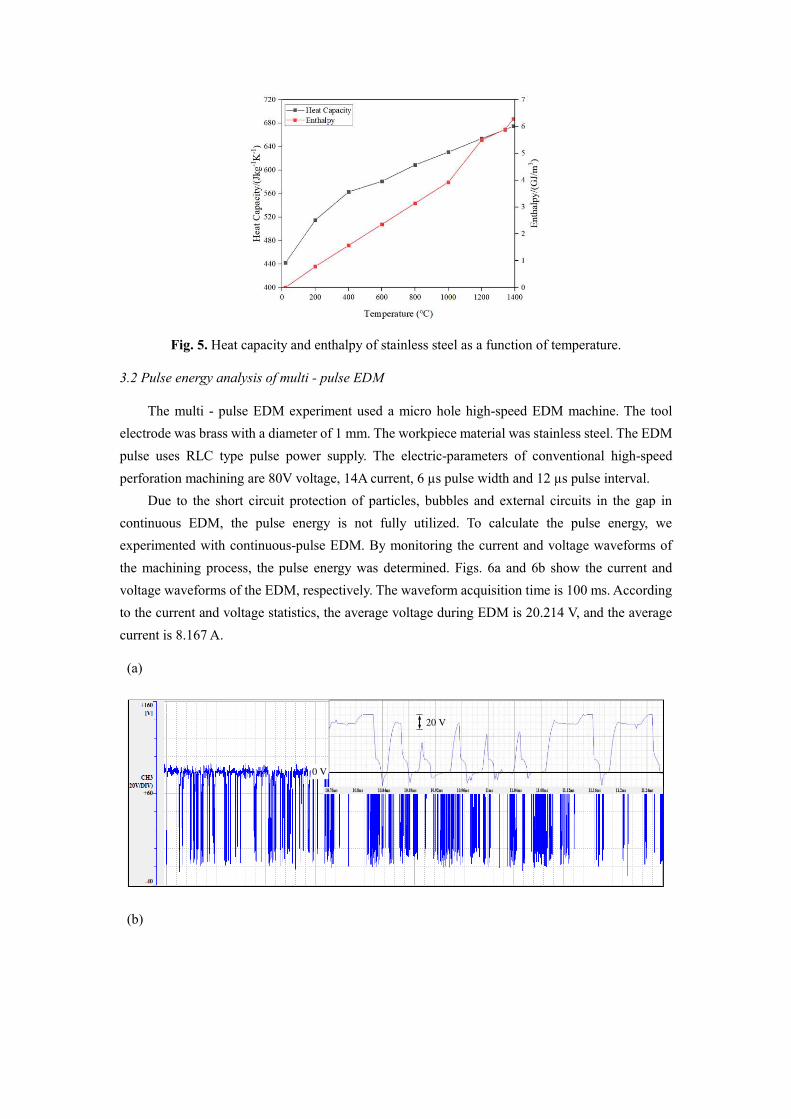
Fig. 5. Heat capacity and enthalpy of stainless steel as a function of temperature.
3.2 Pulse energy analysis of multi - pulse EDM
The multi - pulse EDM experiment used a micro hole high-speed EDM machine. The tool electrode was brass with a diameter of 1 mm. The workpiece material was stainless steel. The EDM pulse uses RLC type pulse power supply. The electric-parameters of conventional high-speed perforation machining are 80V voltage, 14A current, 6 µs pulse width and 12 µs pulse interval.
Due to the short circuit protection of particles, bubbles and external circuits in the gap in continuous EDM, the pulse energy is not fully utilized. To calculate the pulse energy, we experimented with continuous-pulse EDM. By monitoring the current and voltage waveforms of the machining process, the pulse energy was determined. Figs. 6a and 6b show the current and voltage waveforms of the EDM, respectively. The waveform acquisition time is 100 ms. According to the current and voltage statistics, the average voltage during EDM is 20.214 V, and the average current is 8.167 A.
(a)
0 V
20 V
(b)

0 A 0 A
2 A11A 8A
Fig. 6. Spark discharge status in machining gap: (a) voltage waveform detected during continuous-pulse EDM, (b) current waveform detected during continuous-pulse EDM.
3.3 How discharge position affects machining process
Due to the random position of the craters formed by the electric spark discharge, the craters can be related by intersection, tangency, or separation (see Fig. 7). The volume of material removed is 0.19816 × 10⁻⁴ , 0.24744 × 10⁻⁴ , and 0.2464 × 10⁻⁴ mm3, respectively. The most (least) material is removed for the tangent (intersection) craters. For the tangent case, the temperature of the spark discharge environment evolves according to the residual temperature of the previous discharge, although the effect decreases with increasing distance between crater centers. The area of effective loading by the Gaussian heat flux increases with increasing distance between crater centers. For the intersecting case, the two craters are closer together. The effective loading area of the second Gaussian heat flux determines the volume of material removed. For the tangent and separation cases, the effective loading area of the crater is the same, although the tangent case is more affected by residual temperature, so the volume of material removed is largest.
(a) (b) (c)

Fig. 7. Three types of discharge positions for two adjacent craters on EDM surface: (a) intersection, (b) tangent, (c) separation.
In summary, the material removal volumes under the cases of intersection, tangency, and separation are affected by the residual temperature and the effective area of heat flow loading. The residual temperature modifies the initial temperature of the heat source applied each time, and the effective loading area of the heat source changes the heated area of the workpiece. Therefore, the continuous spark discharge process is not a simple superposition of material from single craters. The simulation of continuous-pulse EDM must consider the randomness of the discharge position, the residual temperature, and the need to delete the heat flow and set the cooling time after the heat source is loaded.
3.4 Numerical analysis of how random discharge of mass affects machining performance
In continuous-pulse machining, the craters are randomly situated, which leads to the random overlap of removed material. To determine how crater position affects the volume of material removed and the surface topography of the workpiece, we analyze the mutual position of material between the craters, which shows how continuous-pulse machining affects the surface defects, surface roughness, and material removal rate of the workpiece. The random discharge coordinates (Xc, Yc) are controlled by the following instructions:
TH= Rand(0, PI*2) (13)
R=Rand(0, 0.5**2) (14)
XC=(R^0.5) *COS(TH) (15)
YC=(R^0.5) *SIN(TH) (16)
3.4.1 Analysis of volume of material removed
Fig. 8 shows the temperature distribution for continuous-pulse machining. The maximum temperature corresponding to different pulse cycles is not consistent. When the number of pulses reaches 800, the surface of the workpiece is basically covered by the heat source. When the pulse cycles 200 times, the total area of the electro-erosion craters is smaller than the area of the workpiece, and most craters are separated. With 800 cycles, almost all craters are intersecting, and the area of the loaded Gaussian heat source is reduced, thereby reducing the volume of material removed from a single crater and a decrease in the maximum temperature at the center of the crater.
Fig. 9 depicts surface material erosion due to continuous-pulse EDM, and the corrosion depth is 6μm. Each pulse cycle causes a life-and-death unit judgment and generates a crater on the workpiece surface. Upon reaching 800 cycles, the craters basically cover the entire processing area,

and the volume of material removed is 0.003729 mm3.
(a) (b)
(c) (d)
Fig. 8. Temperature distribution for continuous-pulse machining: (a) 200 cycles, (b) 400 cycles, (c) 600 cycles, (d) 800 cycles.
(a) (b)

(c) (d)
Fig.9. Erosion simulation of continuous-pulse EDM material removal from workpiece surface: (a) 200 cycles, (b) 400 cycles, (c) 600 cycles. (d) 800 cycles.
3.4.2 Analysis of surface roughness
Based on the results of the simulation of continuous-pulse EDM, we now analyze the surface roughness of the workpiece. Fig. 14 shows the surface morphology of the workpiece subjected to continuous-pulse EDM. Three different crater positions to analyze the surface roughness of the workpiece are considered. The craters are randomly distributed over the surface of the workpiece, the Gaussian heat flow is applied based on the result of the previous pulse cycle, and the initial temperature and area of the loaded heat flow differ for each pulse cycle, resulting in different volumes of material removed and the formation of cavities of differing size. The surface roughness finally forms the topography shown in Fig.10. Measuring the surface roughness at three positions and averaging gives an average surface roughness of the workpiece of 1.643 µm.

Fig. 10. Simulation of surface morphology for workpiece subjected to continuous-pulse EDM.
3.4.3 Analysis of thickness of recast layer
Fig. 11 shows the thickness of the recast layer due to continuous-pulse EDM. The vertical section of the machined workpiece shows that the crater size varies over the surface of the workpiece. Further examining the heat-affected area of the workpiece surface through a partially enlarged drawing shows that the average thickness of the heat-affected area is 4.91 μm. The surface temperature distribution of workpiece is determined by heat flux, loading area, and loading time. Different crater stackings affect the volume of material removed, which further affects the area of heat flow loading and the heat transfer inside the workpiece, thus lead to form the heat influence layer with different thickness.
Fig. 11. Thickness of recast layer due to continuous-pulse EDM.
To summarize, the spacing between craters in continuous-pulse EDM directly affects the surface morphology, material removal rate, and the thickness of the recast layer. The random position and uniform discharge position is fully considered in simulating the continuous-pulse EDM temperature distribution. The discharge process of continuous-pulse EDM does not result from simple stacking of numerous single-pulse EDM discharges. The surface loading heat flux area and initial temperature of the workpiece vary with cycle number. Based on these considerations, we develop a realistic simulation of the continuous-pulse EDM temperature distribution. The simulation results indicate that the volume of material removed is 0.003729 mm3, the average surface roughness of the workpiece is 1.643 µm, and the average thickness of the heat-affected area is 4.91 µm.

4. Experimental verification and analysis of how random discharge of mass affects machining
To further analyze how continuous sparks affect EDM performance and simultaneously verify the accuracy of the simulation and theory, we performed a continuous-pulse EDM experiment. The experiment was run at 80 V, a peak current of 14 A, a pulse width of 6 µs, and a pulse gap of 12 µs. The 1-mm-diameter tool electrode was made of brass, the workpiece was stainless steel, and the working fluid was deionized water.
4.1 Analysis of material removal rate due to random discharge of mass
The quantity of material removed from the workpiece in continuous-pulse EDM was weighed with a microelectronic analytical balance. Fig. 16 shows the surface morphology and contour of the blind hole with a diameter of 1mm. Weighing the workpiece gives the mass of material removed from the blind hole as 0.176 mg. The depth of the blind hole is 40 µm. Simulation and geometric calculation predict the surface material removal volume of the workpiece, with a depth of 6 µm. Simulation and geometric calculations predict the material removal volume multiplied by 6.67 (40/6).
(a) (b)
Fig. 12. Shallow hole formed by continuous-pulse EDM. (a) Workpiece morphology after continuous-pulse EDM, (b) profile along dotted line in panel (a).
Fig. 13 compares the mass of material removed by continuous-pulse EDM as per geometric calculation, numerical simulation, and experiment. The density of the workpiece material is 7860 kg/m3, and the average mass of material removed as per geometric calculation, numerical simulation, and experiment is 0.185, 0.196, and 0.176 mg, respectively. In the geometric analysis, the maximum mass of material removed when using a grid of equilateral triangles is 0.21 mg, and the minimum mass of material removed when using a grid of hexagons is 0.16 mg. The numerical simulation results and the mean of the measured results are included in this range, and the difference between the two is only 0.01 mg. Therefore, the geometric model and numerical simulation model accurately predict the mass of material removed by continuous-pulse EDM.

Geometric calculation Experimental value
Fig. 13. Comparison of mass of material removed by continuous-pulse EDM.
4.2 Analysis of surface roughness due to random discharge of mass
In continuous-pulse EDM, the surface morphology of the workpiece is composed of numerous randomly distributed and stacked electrical erosion craters. The surface roughness of the workpiece is determined by the depth of a single crater and the stacking of craters.
Fig. 14 shows the surface roughness of the workpiece after continuous-pulse EDM as measured by a 3D Measuring Laser Microscope OLS4000. In continuous-pulse EDM, a large number of erosion particles, bubbles, and other entities pervade the machining gap, creating an uncertainty in the energy of each discharge and producing a random distribution of size and overlap area for the discharge craters. To ensure the accuracy of surface roughness measurement, the surface roughness of three sampling lengths was selected at random and measured, producing an average surface roughness of 1.623 µm.
Fig. 14. Surface roughness of workpiece after continuous-pulse EDM.
Fig. 15 compares the surface roughness of the workpiece obtained from geometric calculation, numerical simulation, and experiments; the mean value of surface roughness is 1.478, 1.643, and 1.623 μm, respectively. A geometric analysis shows that the residual height of the workpiece surface is affected by crater overlap: the larger the overlap area, the smaller the residual height of the

workpiece surface. When the center of a second discharge is at the edge of the previous crater, the overlapping area between the circular section formed by the two sparks is maximal, and the residual height is minimal. When using a grid of hexagons to calculate overlap area, the overlap area is minimal and the residual height on the workpiece surface is maximal. Therefore, the surface roughness is in the range 1.457–4.455μm. The numerical simulation indicates that the average surface roughness of the workpiece is 1.643 μm, so the error between the numerical simulation and the measured value is 1.23%. Continuous-pulse EDM experiments thus produce a mean surface roughness that is close to that predicted by the numerical simulation. Therefore, the geometric model and the numerical simulation produce accurate predictions of the surface roughness of the workpiece after continuous-pulse EDM.
Fig. 15. Comparison of surface roughness of workpiece.
4.3 Analysis of thickness of recast layer by random discharge of mass
The surface obtained by continuous-pulse EDM was imaged by an ULTRA55 scanning electron microscope (SEM), and the morphology of the recast surface appears in Fig. 16. In the EDS spectrum (Fig. 16b), the mass fraction of O and Cu is 2.64% and 13.34%, respectively, at the position marked EDS spectrum 1 in Fig. 20a. At the position marked EDS spectrum 2, no O is detected, and the mass fractions of Cu and O is 5.89% and 1.78%, respectively. At the position of EDS spectrum 3, O and Cu are not detected. These results indicate that three layered zones exist in the workpiece after continuous-pulse EDM: a recasting layer, a thermal influence layer, and the base metal. The O content is high in the recast layer. With increasing depth, the material of the tool electrode in the thermal impact layer permeates into the base material, so that Cu is detected. Upon reaching a certain depth, the base material is far from the processed surface, and the original material is not affected by continuous-pulse EDM.

(a) (b)
EDS spectrum 2
EDS spectrum 1
EDS spectrum 3
Fe
O
Cr
Ni
Cu
Si
Cr
Mn
Fe
FeNi Cu
EDS spectrum 1
(c) (d)
Fe
Cr
Mn
Ni
CuSi
Cr
MnFe
Fe
NiCu Cu
EDS spectrum 2
Cr Mn
Fe
Ni
Si
Cr
MnFe
Fe
NiNi
EDS spectrum 3
Fig. 16. Morphology of recast layer at workpiece surface: (a) workpiece section, (b) EDS spectrum 1, (c) EDS spectrum 2, (d) EDS spectrum 3.
Fig. 17 shows the elemental distribution at the workpiece surface. The different colors represent the distribution of the given elements at the surface. The green area represents O, which is most concentrated in the recast layer. The purple and cyan areas represent Fe and Cu, respectively; Cu is most concentrated in the recast layer and heat-affected area, and Fe is evenly distributed in the base material. Red represents C, which is most concentrated at the interface between the matrix and the recast layer. The distribution of elements at the surface thus reveals three areas with different elemental composition after continuous-pulse EDM.

Fe
Cu O C
(a) (b) (c)
(d) (e) (f)
Fig. 17. Elemental distribution on workpiece surface.
Fig. 18 shows the profiles of elemental distributions on the workpiece surface. From the surface to a depth of 5.31 μm, Fe, Cu, Zn, and O all vary rapidly in concentration. The matrix material itself contains no O, but the molten metal reacts during continuous-pulse EDM with O in the air or in water and forms metal oxides that cohere to the surface of the workpiece. The elements in the metal oxides come from the workpiece and tool electrode, and the cross-sectional thickness is that of the recast layer. Oxygen is present to a depth of 5.31 μm, so the actual thickness of the recast layer is 5.31 μm.
Fig. 18. (b) Profiles of elemental content along line shown in panel (a) as a function of depth from workpiece surface.
Fig. 19 shows the thickness of the recast layer on the surface of the workpiece. The average thickness obtained by the numerical simulation is 4.91 μm, and the average thickness of the recast

layer obtained experimentally is 5.31 μm. The error between numerical simulation and the experimental value is 7.53%. The efficiency of the pulsed power supply, the heat transfer between workpiece and working liquid, and the phase transition of materials are all considered in the numerical simulation. However, in practice, numerous bubbles and electro-erosion particles pervade the machining gap, making it difficult to discharge the products in this narrow gap and resulting in abnormal discharge. This results in a thicker recast layer on the workpiece surface. Therefore, the effect of the working fluid on the heat distribution should be considered in future research.
Fig. 19. Comparison of thickness of recast layer on surface of workpiece.
Thus, the numerical model of continuous-pulse EDM accurately predicts the thickness of the recast layer.
5. Conclusion
The mechanisms leading to material removal, surface roughness, and recast layer thickness in continuous-pulse EDM are investigated herein and theoretical and numerical models that consider the overlap of multiple single-spark craters and the heat transfer of continuous-pulse EDM based on a Gaussian temperature distribution are developed.
A multi-pulse theory for continuous-pulse EDM are developed, which considers the relation between the number of craters and the overlap between craters. The entire processing area was simulated by using geometric graph-optimization theory. The calculated material-removal rate, surface quality, and recast-layer thickness are all obtained from the mathematical model. The calculation reveals that 733 craters are required when assuming that the processing region is covered by a grid of equilateral triangles defining the craters, the maximum volume of material removed is 0.004 mm3, and the minimum residual height is 1.457 μm. Three hundred and sixty-six craters are required when assuming a grid of hexagons defining the circular craters. The minimum volume of material removed is 0.0031 mm3, and the maximum residual height is 4.455 μm.
A multi-pulse numerical simulation are also implemented. By analyzing the relation between the relative position of two craters and the volume of material removed, it can be found that the volume of material removed is maximal because of the tangent position relation between craters. Further analysis based on simulations show how multiple pulses affect EDM and that the volume of material removed was 0.003729 mm3, the surface roughness was 1.643 μm, and the thickness of

the recast layer was 4.91 μm. A multi-pulse experimental verification shows that the mass of material removed was 0.176
mg, which reveals an error in the theory and simulation of 5.11% and 11.36%, respectively. The experimental surface roughness was 1.623 μm, which corresponds to an error in the theory and simulation of 8.93% and 1.23%, respectively. Finally, the experimentally determined thickness of the recast layer was 5.31 μm, which corresponds to an error in the simulation error of 7.53%.
Declarations:
Ethical Approval
Not applicable.
Consent to Participate
Not applicable.
Consent for publication
Not applicable.
Author Contributions
Investigation, Q.N.; Data curation, GQ.W.; Formal analysis, WT. Y.; Methodology, KB.Z.; Formal analysis, L.J.; Project administration, Y.Z.; Writing original draft, Q.N.; Writing review & editing, Y.Z.
Funding
This project is supported by the National Natural Science Foundation of China(Grant No. 51705239) and the Basic Research Programs of Jiangsu(Grant No. BK20190669)
Acknowledgement
This project is supported by the National Natural Science Foundation of China(Grant No. 51705239) and the Basic Research Programs of Jiangsu(Grant No. BK20190669). We are also grateful to the High Performance Computing Center of Nanjing Tech University for supporting the computational resources.
Conflicts of Interest
The authors declare no competing interests.
Code availability
Not applicable.
Availability of data and materials
Not applicable.

References
[1] D. Tijo, M. Masanta, Mechanical performance of in-situ TiC-TiB 2 composite coating deposited
on Ti-6Al-4V alloy by powder suspension electro-discharge coating process, Surf. Coat. Technol.,
328 (2017) 192-203. http://dx.doi.org/10.1016/j.surfcoat.2017.08.048
[2] E. Salvati, A.M. Korsunsky, Micro-scale measurement & FEM modelling of residual stresses in AA6082-T6 Al alloy generated by wire EDM cutting, J. Mater. Process. Technol. 275 (2020) 116373. https://doi.org/10.1016/j.jmatprotec.2019.116373.
[3] A. Mahajan, S. Devgan, S.S. Sidhu, Surface alteration of biomedical alloys by electrical discharge treatment for enhancing the electrochemical corrosion, tribological and biological performances, Surf. Coat. Technol., 405 (2021) 126583. https://doi.org/10.1016/j.surfcoat.2020.126583
[4] X. Yue, X. Yang, Molecular dynamics simulation of material removal process and mechanism of EDM using a two-temperature model, Appl. Surf. Sci. 528 (2020) 147009. https://doi.org/10.1016/j.apsusc.2020.147009.
[5] M.D. Nguyen, M. Rahman, Y.S. Wong, Simultaneous micro-EDM and micro-ECM in low-resistivity deionized water, Int. J. Mach. Tool Manuf. 54–55 (2012) 55–65. https://doi.org/10.1016/j.ijmachtools.2011.11.005.
[6] R. Nastasi, P. Koshy, Analysis and performance of slotted tools in electrical discharge drilling, CIRP Annals. 63 (2014) 205–208. https://doi.org/10.1016/j.cirp.2014.03.054.
[7] Y. Zhang, Z. Xu, D. Zhu, J. Xing, Tube electrode high-speed electrochemical discharge drilling using low-conductivity salt solution, Int. J. Mach. Tool Manuf. 92 (2015) 10–18. https://doi.org/10.1016/j.ijmachtools.2015.02.011.
[8] Z. Zhang, H. Peng, J. Yan, Micro-cutting characteristics of EDM fabricated high-precision polycrystalline diamond tools, Int. J. Mach. Tool Manuf. 65 (2013) 99–106. https://doi.org/10.1016/j.ijmachtools.2012.10.007.
[9] H.R. Fazli Shahri, R. Mahdavinejad, M. Ashjaee, A. Abdullah, A comparative investigation on temperature distribution in electric discharge machining process through analytical, numerical and experimental methods, Int. J. Mach. Tool Manuf. 114 (2017) 35–53. https://doi.org/10.1016/j.ijmachtools.2016.12.005.
[10] W. Kurnia, P.C. Tan, S.H. Yeo, Q.P. Tan, Surface roughness model for micro electrical discharge machining, Proceedings of the Institution of Mechanical Engineers, Part B: J. Eng. Manuf. 223 (2009) 279–287. https://doi.org/10.1243/09544054JEM1188.
[11] B. Kuriachen, A. Varghese, K.P. Somashekhar, S. Panda, J. Mathew, Three-dimensional numerical simulation of microelectric discharge machining of Ti-6Al-4V, Int. J. Adv Manuf. Technol. 79 (2015) 147–160. https://doi.org/10.1007/s00170-015-6794-y.

[12] S.N. Joshi, S.S. Pande, Thermo-physical modeling of die-sinking EDM process, J. Manuf. Process. 12 (2010) 45–56. https://doi.org/10.1016/j.jmapro.2010.02.001.
[13] J. Tao, J. Ni, A.J. Shih, Modeling of the Anode Crater Formation in Electrical Discharge Machining, J. Manuf. Sci. Eng. 134 (2012). https://doi.org/10.1115/1.4005303.
[14] M. Shabgard, R. Ahmadi, M. Seyedzavvar, S.N.B. Oliaei, Mathematical and numerical modeling of the effect of input-parameters on the flushing efficiency of plasma channel in EDM process, Int. J. Mach. Tool Manuf. 65 (2013) 79–87. https://doi.org/10.1016/j.ijmachtools.2012.10.004.
[15] J.F. Liu, Y.B. Guo, Thermal Modeling of EDM with Progression of Massive Random Electrical Discharges, Procedia Manuf. 5 (2016) 495–507. https://doi.org/10.1016/j.promfg.2016.08.041.
[16] S. Jithin, U.V. Bhandarkar, S.S. Joshi, Analytical Simulation of Random Textures Generated in Electrical Discharge Texturing, J. Manuf. Sci. Eng. 139 (2017). https://doi.org/10.1115/1.4037322.
[17] P.C. Tan, S.H. Yeo, Modeling of Recast Layer in Micro-Electrical Discharge Machining, J. Manuf. Sci. Eng. 139 (2017). https://doi.org/10.1115/1.4001480.
[18] L. Tang, L. Ren, Q.L. Zhu, EDM multi-pulse temperature field simulation of SiC/Al functionally graded materials, Int. J. Adv. Manuf. Technol. 97 (2018) 2501–2508. https://doi.org/10.1007/s00170-018-2136-1.
[19] Y.M. Lou, X.Y. Ruan, Research on computer simulation of EDM, Shanghai Jiao Tong University (2000).
[20] K.C. Mills, Recommended values of thermophysical properties for selected commercial alloys, Woodhead Publishing Limited, Abington Hall, Abington Cambridge CB16AH, England, 2002.