predicting typhoon-induced storm surge tide with a two ... · root-mean-square error compared ......
TRANSCRIPT

Nat. Hazards Earth Syst. Sci., 12, 3799–3809, 2012www.nat-hazards-earth-syst-sci.net/12/3799/2012/doi:10.5194/nhess-12-3799-2012© Author(s) 2012. CC Attribution 3.0 License.
Natural Hazardsand Earth
System Sciences
Predicting typhoon-induced storm surge tide with a two-dimensionalhydrodynamic model and artificial neural network model
W.-B. Chen1, W.-C. Liu 2, and M.-H. Hsu3
1Supercomputing Research Center, National Cheng Kung University, 70101 Tainan, Taiwan2Department of Civil and Disaster Prevention Engineering, National United University, 36003 Miaoli, Taiwan3Department of Bioenvironmental Systems Engineering, National Taiwan University, 10617 Taipei, Taiwan
Correspondence to:W.-C. Liu ([email protected])
Received: 3 June 2012 – Revised: 15 November 2012 – Accepted: 15 November 2012 – Published: 21 December 2012
Abstract. Precise predictions of storm surges during ty-phoon events have the necessity for disaster prevention incoastal seas. This paper explores an artificial neural network(ANN) model, including the back propagation neural net-work (BPNN) and adaptive neuro-fuzzy inference system(ANFIS) algorithms used to correct poor calculations witha two-dimensional hydrodynamic model in predicting stormsurge height during typhoon events. The two-dimensionalmodel has a fine horizontal resolution and considers the in-teraction between storm surges and astronomical tides, whichcan be applied for describing the complicated physical prop-erties of storm surges along the east coast of Taiwan. Themodel is driven by the tidal elevation at the open bound-aries using a global ocean tidal model and is forced by themeteorological conditions using a cyclone model. The sim-ulated results of the hydrodynamic model indicate that thismodel fails to predict storm surge height during the modelcalibration and verification phases as typhoons approachedthe east coast of Taiwan. The BPNN model can reproducethe astronomical tide level but fails to modify the predic-tion of the storm surge tide level. The ANFIS model sat-isfactorily predicts both the astronomical tide level and thestorm surge height during the training and verification phasesand exhibits the lowest values of mean absolute error androot-mean-square error compared to the simulated results atthe different stations using the hydrodynamic model and theBPNN model. Comparison results showed that the ANFIStechniques could be successfully applied in predicting wa-ter levels along the east coastal of Taiwan during typhoonevents.
1 Introduction
Storm surges are as a result of strong tropical storms calledtyphoons in the northwestern Pacific Ocean. Abnormal sealevel rise due to storm surge is caused by strong winds andatmospheric pressure disturbances (You and Seo, 2009). Tai-wan is located on the west side of the Pacific Ocean (Fig. 1a).The country is often subjected to severe sea states that are in-duced by typhoons and occur during the summer and winterseasons in either the South China Sea or the northwest Pa-cific Ocean near the Philippines, which result in the extensiveloss of life and property. On average, Taiwan suffers three tofour typhoons annually. Typhoons act more severely on theeast coast than on the west coast, because typhoons typicallyapproach Taiwan from the east. As a typhoon approachesTaiwan, its strong wind and low atmospheric pressure oftencause storm surges that can result in severe damage to coastalareas, especially on the low-lying lands near river mouthsbecause of the double effects of the river floods by typhoon-brought rains and backward uplifting seawater floods fromstorm surges. Therefore, it is necessary to develop a reliablemodel to predict the height of typhoon-induced storm surgefor coastal management and hazard mitigation.
Several researchers have applied different numerical mod-els to predict storm surges. For example, Shen et al. (2006)applied an unstructured grid numerical model (Unstructured,Tidal, Residual Intertidal, and Mudflat model – UnTRIM-3D) to simulate and predict the storm tide in the Chesa-peake Bay. The authors found that the use of an unstruc-tured grid provides the flexibility to represent the complexestuarine and coastal geometry for accurately simulatingstorm surges. Dietsche et al. (2007) adopted the ADvance
Published by Copernicus Publications on behalf of the European Geosciences Union.
3800 W.-B. Chen et al.: Predicting typhoon-induced storm surge tide
26
636 637 638 639
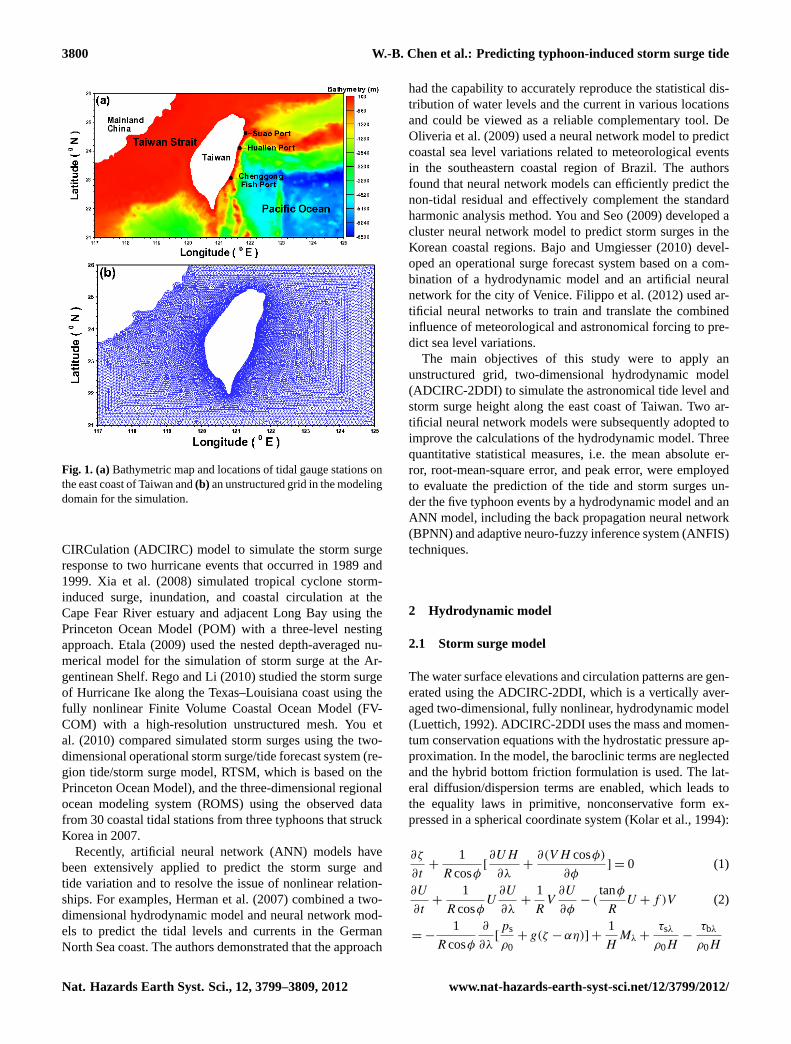
Fig. 1. (a) Bathymetric map and locations of tidal gauge stations on the east coast of 640 Taiwan and (b) an unstructured grid in the modeling domain for the simulation. 641 642 643 644 645
Fig. 1. (a)Bathymetric map and locations of tidal gauge stations onthe east coast of Taiwan and(b) an unstructured grid in the modelingdomain for the simulation.
CIRCulation (ADCIRC) model to simulate the storm surgeresponse to two hurricane events that occurred in 1989 and1999. Xia et al. (2008) simulated tropical cyclone storm-induced surge, inundation, and coastal circulation at theCape Fear River estuary and adjacent Long Bay using thePrinceton Ocean Model (POM) with a three-level nestingapproach. Etala (2009) used the nested depth-averaged nu-merical model for the simulation of storm surge at the Ar-gentinean Shelf. Rego and Li (2010) studied the storm surgeof Hurricane Ike along the Texas–Louisiana coast using thefully nonlinear Finite Volume Coastal Ocean Model (FV-COM) with a high-resolution unstructured mesh. You etal. (2010) compared simulated storm surges using the two-dimensional operational storm surge/tide forecast system (re-gion tide/storm surge model, RTSM, which is based on thePrinceton Ocean Model), and the three-dimensional regionalocean modeling system (ROMS) using the observed datafrom 30 coastal tidal stations from three typhoons that struckKorea in 2007.
Recently, artificial neural network (ANN) models havebeen extensively applied to predict the storm surge andtide variation and to resolve the issue of nonlinear relation-ships. For examples, Herman et al. (2007) combined a two-dimensional hydrodynamic model and neural network mod-els to predict the tidal levels and currents in the GermanNorth Sea coast. The authors demonstrated that the approach
had the capability to accurately reproduce the statistical dis-tribution of water levels and the current in various locationsand could be viewed as a reliable complementary tool. DeOliveria et al. (2009) used a neural network model to predictcoastal sea level variations related to meteorological eventsin the southeastern coastal region of Brazil. The authorsfound that neural network models can efficiently predict thenon-tidal residual and effectively complement the standardharmonic analysis method. You and Seo (2009) developed acluster neural network model to predict storm surges in theKorean coastal regions. Bajo and Umgiesser (2010) devel-oped an operational surge forecast system based on a com-bination of a hydrodynamic model and an artificial neuralnetwork for the city of Venice. Filippo et al. (2012) used ar-tificial neural networks to train and translate the combinedinfluence of meteorological and astronomical forcing to pre-dict sea level variations.
The main objectives of this study were to apply anunstructured grid, two-dimensional hydrodynamic model(ADCIRC-2DDI) to simulate the astronomical tide level andstorm surge height along the east coast of Taiwan. Two ar-tificial neural network models were subsequently adopted toimprove the calculations of the hydrodynamic model. Threequantitative statistical measures, i.e. the mean absolute er-ror, root-mean-square error, and peak error, were employedto evaluate the prediction of the tide and storm surges un-der the five typhoon events by a hydrodynamic model and anANN model, including the back propagation neural network(BPNN) and adaptive neuro-fuzzy inference system (ANFIS)techniques.
2 Hydrodynamic model
2.1 Storm surge model
The water surface elevations and circulation patterns are gen-erated using the ADCIRC-2DDI, which is a vertically aver-aged two-dimensional, fully nonlinear, hydrodynamic model(Luettich, 1992). ADCIRC-2DDI uses the mass and momen-tum conservation equations with the hydrostatic pressure ap-proximation. In the model, the baroclinic terms are neglectedand the hybrid bottom friction formulation is used. The lat-eral diffusion/dispersion terms are enabled, which leads tothe equality laws in primitive, nonconservative form ex-pressed in a spherical coordinate system (Kolar et al., 1994):
∂ζ
∂t+
1
R cosφ[∂UH
∂λ+
∂(V H cosφ)
∂φ] = 0 (1)
∂U
∂t+
1
R cosφU
∂U
∂λ+
1
RV
∂U
∂φ− (
tanφ
RU + f )V (2)
= −1
R cosφ
∂
∂λ[ps
ρ0+ g(ζ − αη)] +
1
HMλ +
τsλ
ρ0H−
τbλ
ρ0H
Nat. Hazards Earth Syst. Sci., 12, 3799–3809, 2012 www.nat-hazards-earth-syst-sci.net/12/3799/2012/
W.-B. Chen et al.: Predicting typhoon-induced storm surge tide 3801
∂V
∂t+
1
R cosφU
∂V
∂λ+
1
RV
∂V
∂φ+ (
tanφ
RU + f )U (3)
= −1
R
∂
∂φ[ps
ρ0+ g(ζ − αη)] +
1
HMφ +
τsφ
ρ0H−
τbφ
ρ0H
where the vertically averaged momentum dispersion in thelongitudinal and the latitudinal directions can be expressedas follows (Kolar and Gray, 1990):
Mλ,φ =Eh2
R2[
1
cos2φ
∂2(U,V )H
∂λ2+
∂2(U,V )H
∂φ2], (4)
andt = time;λ,φ = degrees longitude (east of Greenwich ispositive) and latitude (north of the Equator is positive), re-spectively;U,V = the depth-averaged velocity in the longi-tudinal and latitudinal directions, respectively;H = the to-tal height of the vertical water column (= h + ζ ); h = thebathymetric depth, relative to mean sea level (MSL);ζ = thefree surface elevation, relative to MSL;R = the radius of theEarth;f = 2�sinφ = the Coriolis parameter;� = the an-gular speed of the Earth;ps = the atmospheric pressure atthe free surface;ρ0 = the reference density of water;g = theacceleration due to gravity;α = the effective Earth elasticityfactor;Eh2 = the horizontal eddy viscosity;τsλ,τsφ = the ap-plied free surface stress in the longitudinal and the latitudinaldirections, respectively;τbλ,τbφ = the bottom shear stressesin the longitudinal and the latitudinal directions, respectively,andη = the Newtonian equilibrium tide potential.
In the ADCIRC-2DDI model, the hybrid bottom frictionformulation is used when the wetting and drying of elementsis executed, because this expression results in being highlydissipative as the water depth becomes small (Grenier et al.,1995).
The bottom friction in the model is expressed as
τbλ = Uτ∗ andτbφ = V τ∗. (5)
The hybrid bottom friction (τ∗) formulation, which pro-vided a depth-dependent bottom friction coefficient, can bedefined by the following formula:
τ∗ =Cf(U
2+ V 2)1/2
H, (6)
whereCf = Cfmin[1+ (Hbreak
H)θ ]γ /θ
= the bottom drag coef-ficient. The unit ofCf is kg m−2; Cfmin = the minimum bot-tom drag coefficient that is approached in deep water whenthe hybrid bottom friction formulation reverts to a standardquadratic bottom friction function;Hbreak= the break depthto determine if the hybrid bottom friction formulation willbehave as a standard bottom friction function or increase withdepth similar to a Manning’s type bottom friction function;andθ andγ = dimensionless parameters which are given inSect. 4.2.
ADCIRC-2DDI is Courant-limited algorithmically due toits explicit feature, and it is also limited by the propagation
speed of any wetting fronts. The Courant number is less than0.5 to maintain numerical stability. More details of ADCIRC-2DDI model can be found in Luettich et al. (1992), Kolar etal. (1994), and Westerink et al. (1994).
2.2 Global tidal model
A large fraction of the variance in many oceanographic vari-ables is due to tides. To simulate tidal propagation in thestorm surge model, the driving tidal forces at the open bound-aries are necessary. In the present study, a global ocean tidalmodel that was developed by Oregon State University, whichis the TOPEX/Poseidon Global Inverse Solution (TPXO), isused to specify the open boundaries of ADCIRC for simu-lating tidal propagation. TPXO is the current version of aglobal model of ocean tides, and it incorporates data from theTOPEX/Poseidon satellite. The tides are provided as com-plex amplitudes of the Earth-relative sea-surface elevationfor eight primary (M2, S2, N2, K2, K1, O1, P1, andQ1) andtwo long-period (Mf and Mm) harmonic constituents. Themethods used to compute the model are described in detailby Egbert et al. (1994) and Egbert and Erofeeva (2002).
2.3 Cyclone model
The meteorological driving forces underlying storm surgesconsist of wind stress and an atmospheric pressure gradient.Therefore, determining the wind field and the pressure fieldof a tropical cyclone is indispensable for conducting cyclonesurge calculations.
In the present study, the atmospheric pressure field derivedfrom cyclostrophic flow can be expressed as follows (Jeles-nianski, 1965):
Pr = Pc +1
4(Pn − Pc)
(r
Rmax
)3
, for0 ≤ r ≤ Rmax (7a)
Pr = Pn −3
4(Pn − Pc)
(r
Rmax
)−1
, forr > Rmax, (7b)
wherePc = the pressure at the typhoon center;Pn = the am-bient pressure and was assumed to be equal to 1013 hPa;r =
the radius which is the distance from the typhoon center; andRmax = the radius of the maximum wind. Following Grahamand Nunn (1959),Rmax is represented by the following equa-tion:
Rmax = 28.52tanh[0.0873(φ − 28)]
+ 12.22/exp[(1013− Pc)
/33.86
]+ 0.2Vf + 32.77,
whereφ is the latitude of the typhoon center andVf is theforward speed of the typhoon.
The wind field comprises a rotational and a translationalcomponent. At a distance,r, from the center of the typhoon,the rotational wind speed,Vr, is described by the followingequation (Young and Sobey, 1981):
www.nat-hazards-earth-syst-sci.net/12/3799/2012/ Nat. Hazards Earth Syst. Sci., 12, 3799–3809, 2012

3802 W.-B. Chen et al.: Predicting typhoon-induced storm surge tide
Vr=Vmax(r/Rmax
)7· exp[7(1−r
/Rmax)] for r < Rmax (8a)
Vr=Vmax · exp[(0.0025Rmax+0.05)(1−r/Rmax)]
for r ≥ Rmax, (8b)
whereVmax = 6.3(1013.0− P0)1/2.
The translational component of wind field,Vt, can be ex-pressed as
Vt = −0.5Vf · (−cosϕ), (9)
whereVf is the moving speed of typhoon andϕ is the anglebetween the radial arm and the line of maximum wind.
The resultant wind speed (Vw) inside the typhoon is givenas
Vw = Vr + Vt. (10)
2.4 Geological structure of the model
The computational domain in the Asian marginal seas andthe western Pacific Ocean includes the region within the lon-gitudes 117◦ E to 125◦ E and the latitudes 21◦ N to 28◦ N.The digital terrain model (DTM) bathymetric data were ob-tained from the Global Topography data bank of the Univer-sity of California, San Diego, and from the Ocean Data Bankof the National Science Council, Taiwan. Figure 1a shows thebathymetric map and the locations of the tidal gauge stationson the east coast of Taiwan. To save computational time andfit the coastline, coarse grids were generated in coastal seas,whereas fine grids were used in shallow areas close to thecoastline. The modeling domain consisted of 18 543 unstruc-tured triangular elements and 9560 nodes (Fig. 1b). To fitthe raw bathymetric data and simply define the open bound-ary conditions at corner points, rectangular area (see Fig. 1b)was adopted in the modeling domain. For this model grid, atime step of1t = 20 s was used in simulations, which wasintended to maintain the Courant number less than 0.5 andshowed no sign of instability.
3 Artificial neural network (ANN) models
In the present study, two ANN models, including BPNN andANFIS, were introduced. The algorithms of these two ANNmodels are described as follows.
3.1 Back propagation neural network (BPNN)
A back propagation neural network (BPNN) was used toamend the simulated water levels with the two-dimensionalhydrodynamic model for precise predictions. The BPNN,which was proposed by Rumelhart et al. (1986), is a multiple-layer network with nonlinear differentiable transfer functionsincluding input layer, hidden layer, and output layer.
27
646 647 648 649 650 651 652 653 654 655
Fig. 2. Architecture of the back propagation neural network (BPNN). 656 657 658 659
Fig. 2. Architecture of the back propagation neural network(BPNN).
Figure 2 shows the architecture of the BPNN. In this fig-ure, “Trans.” represents the transfer function. The connec-tions between input and hidden layer neurons and betweenhidden and output layer neurons can be illustrated by theEqs. (11) and (12), respectively.
a1 = f (IW × Pi+ b1) (11)
a2 = f (LW × a1+ b2) (12)
wherea1 anda2 are the values of the hidden layer and theoutput layer, respectively; Pi is the input vector; IW andb1are weights and biases, respectively, between the input layerand the hidden layer; and LW andb2 are weight and biases,respectively, between the hidden layer and the output layer.
A hyperbolic tangent sigmoid transfer function in Eq. (13)is used in the hidden layer.
f (x) =2(
1+ e−2x)− 1
(13)
And a linear transfer function in Eq. (14) is applied in theoutput layer.
f (x) = x (14)
To scale the inputs and targets, the normalized equation isoften used in Eq. (15) so that the data always fall within aspecified range.
YN = (ymax− ymin) ×
(xi − xmin
xmax− xmin
)+ ymin, (15)
whereYN is the value after normalization;xmin andxmax de-note the minimum and maximum of the data, respectively;andymin andymax are taken as−1 and 1. The performanceof the network can be evaluated according to the mean squareerror (MSE) in Eq. (16):
MSE=
N∑i=1
(a2 − yi)2
N, (16)
whereyi represents the observed value andN is the totalnumber of data. When the leaning performance (MSE) is lessthan a tolerance value, the iteration terminates. The tolerancevalue, 10−3, was adopted in this model.
Nat. Hazards Earth Syst. Sci., 12, 3799–3809, 2012 www.nat-hazards-earth-syst-sci.net/12/3799/2012/

W.-B. Chen et al.: Predicting typhoon-induced storm surge tide 3803
In the present study, BPNN updates weight and bias val-ues according to the Fletcher–Powell conjugate gradient(Fletcher and Powell, 1963). The BPNN model was per-formed in MATLAB where the Fletcher–Powell conjugategradient technique is applicable in the Neural Network Tool-box.
3.2 Adaptive neuro-fuzzy inference system (ANFIS)
ANFIS is a multilayer feed-forward neural network whereeach node executes a particular function based on the incom-ing signals. The symbols with square and circle nodes areapplied to stand for different properties of adaptive learning(see Fig. 3). In order to yield the desired input–output char-acteristics, the parameters of adaptive learning are updatedaccording to the gradient learning rules. ANFIS learns therules and membership functions from data sets (Jang, 1993).The primary weakness of the ANFIS model is consumingmuch time for the training and parameter determination. Inthis study, ANFIS takes about 20 min to complete the train-ing and verification, while the BPNN spends 10 s only.
Essentially, the fuzzy inference system has two input vari-ables,x1 andx2, and one output variable,y. The assumptionis that the rule base includes two fuzzy if-then rules with afirst-order Sugeno fuzzy model (Takagi and Sugeno, 1985):
Rule 1: Ifx1 is A1 andx2 is B1, theny1 = p1x1+q1x2+r1Rule 2: Ifx1 isA2 andx2 isB2, theny2 = p2x1+q2x2+r2,
whereAi andBi are the fuzzy sets andpi , qi andri are thedesign parameters that will be determined during the train-ing and verification processes. The architecture of ANFISis shown in Fig. 3, where circles represent fixed nodes andsquares indicate adaptive nodes. A brief introduction of theANFIS model follows.
Input nodes (Layer 1): Each nodei in this layer is a squarenode (see Fig. 3). The node function can be expressed as
O1,i = µAi (x1) , i = 1,2 (17)
O1,i = µBi−2 (x2) , i = 3,4 (18)
wherex1 andx2 are the inputs to nodei; Ai andBi are thelinguistic labels; andµAi
andµBi−2 indicate the membershipfunction for theAi andBi linguistic labels, respectively. Inthis study, the following bell-shaped membership function isapplied:
µAi=
1
1+
∣∣∣ x1−ci
ai
∣∣∣2biµBi−2=
1
1+
∣∣∣ x2−ci
ai
∣∣∣2bi, (19)
where ai,bi and ci are the parameter sets which are thepremise parameters in this layer.
Rule nodes (Layer 2): In this layer, every node indicatesa circle node labeledM (Fig. 3). The outputs of this layer,named firing strengths (O2,i), are the products of the cor-responding degrees which are obtained from input layer(Layer 1).
O2,i = wi = µAi (x1) × µBi (x1) , i=1,2 (20)
28
660 661 662 663 664 665
Fig. 3. Architecture of the adaptive network-based fuzzy interface system (ANFIS). 666 667 668 669 670 671 672 673 674 675 676 677 678 679 680 681 682 683
Fig. 3. Architecture of the adaptive network-based fuzzy interfacesystem (ANFIS).
Average nodes (Layer 3): in this layer, every node presentsa circle node labeledN (Fig. 3). This layer includes fixednodes which calculate the ratio of the firing strengths of therules:
O3,i = w̄i =wi
w1 + w2, i = 1,2. (21)
Consequent nodes (Layer 4): The nodes in this layer areadaptive. The output of each node, which is a first-order poly-nomial, is the product of the normalized firing strength. Theoutput can be illustrated as
O4,i = w̄iyi = w̄i(pix + qiy + ri), i=1,2. (22)
The parameters,pi,qi, and ri , in this layer indicate thecoefficients of linear combination.
Output nodes (Layer 5): The single node calculates theoverall output by integrating all of the input signals.
O5,1 =
2∑i=1
w̄iyi =
2∑i=1
wiy
w1 + w2(23)
The detailed algorithms of ANFIS technique can be found inJang et al. (1993) and Nayak et al. (2004).
3.3 Indices of simulation performance
To evaluate the performance of the two-dimensional hydro-dynamic model and the ANN model, three criteria wereadopted to compare the predicted results and the obser-vational data: the mean absolute error (MAE), root-mean-square error (RMSE), and peak error (PE). These criteria aredefined by the following equations:
www.nat-hazards-earth-syst-sci.net/12/3799/2012/ Nat. Hazards Earth Syst. Sci., 12, 3799–3809, 2012

3804 W.-B. Chen et al.: Predicting typhoon-induced storm surge tide
Table 1.The performance of the two-dimensional hydrodynamic model, BPNN model, and ANFIS model for predicting water level duringthe training (calibration) phase at different stations.
MethodSuao Port Hualien Port Chenggong Fish Port
PE MAE RMSE PE MAE RMSE PE MAE RMSE(%) (m) (m) (%) (m) (m) (%) (m) (m)
Calibration with two-dimensionalhydrodynamic model
23.52 0.17 0.23 21.57 0.20 0.25 23.28 0.24 0.29
Training with BPNN model −15.19 0.15 0.20 −17.04 0.21 0.26 −23.43 0.16 0.21Training with ANFIS model 1.91 0.11 0.16 1.24 0.16 0.21 −0.82 0.11 0.15
Note: PE represents peak error; MAE represents mean absolute error; and RMSE represents root-mean-square error.
29
684 685 686 687 688 689 690
Fig. 4. Tracks of Typhoon Mindulle (2004), Typhoon Sepat (2007), and Typhoon 691 Kalmaegi (2008) for hydrodynamic model calibration (ANN training). 692 693 694 695 696 697 698 699 700 701 702 703 704 705 706 707
Fig. 4.Tracks of Typhoon Mindulle (2004), Typhoon Sepat (2007),and Typhoon Kalmaegi (2008) for hydrodynamic model calibration(ANN training).
MAE =1
N
N∑i=1
|(Ym)i − (Yo)i | (24)
RMSE=
√√√√ 1
N
N∑i=1
[(Ym)i − (Yo)i]2, (25)
PE=Ym,peak− Yo,peak
Yo,peak× 100 % (26)
whereN is the total number of data;Ym is the predicted waterlevel; Yo is the observational water level;Ym,peak is the pre-dicted peak water level; andYo,peakis the observational peakwater level. The negative PE represents that the model under-predicts the peak observed water level, while the positive PEmeans that the model overpredicts the peak water level.
4 Model validity
Five data sets were used to determine the practical accu-racy of the model and to ascertain its predictive capabilities.Typhoon Mindulle (2004), Typhoon Sepat (2007), and Ty-phoon Kalmaegi (2008) (792 hourly water level data) were
30
708 709 710 711 712 713 714 715 716
717 Fig. 5. Tracks of Typhoon Fungwoug (2008) and Typhoon Fanapi (2010) for 718 hydrodynamic model verification (ANN verification). 719 720 721 722 723 724 725 726 727 728 729 730 731 732
Fig. 5. Tracks of Typhoon Fungwoug (2008) and TyphoonFanapi (2010) for hydrodynamic model verification (ANN verifi-cation).
employed for hydrodynamic model calibration (ANN modeltraining), while Typhoon Fungwoug (2008) and TyphoonFanapi (2010) (480 hourly water level data) were adopted forhydrodynamic model verification (ANN model verification).Figures 4 and 5 show the paths of these five typhoon eventsfor model calibration (ANN training) and model verification(ANN verification).
4.1 Hydrodynamic model calibration and ANN modeltraining
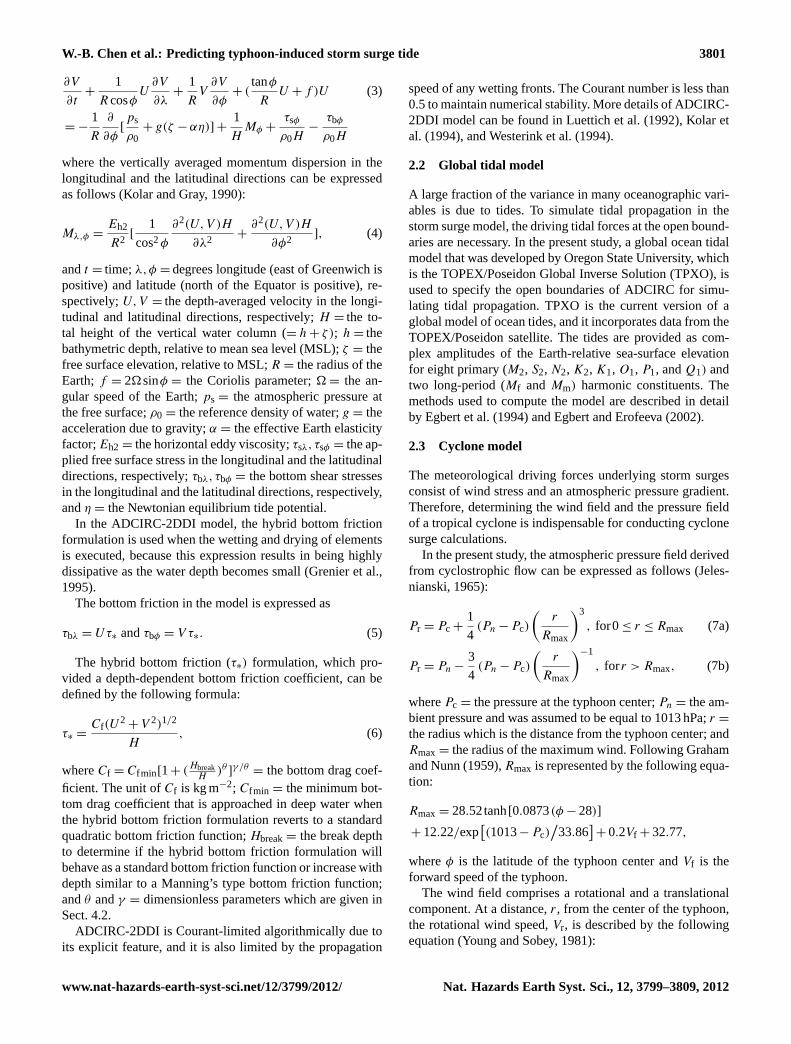
The terminologies for model comparisons, such as the train-ing and verification phases with the ANN model (BPNN andANFIS approaches), were used as analogs for the calibrationand validation with the two-dimensional hydrodynamic (AD-CIRC) model, respectively. The scatter plot of simulated andobserved water level using two-dimensional hydrodynamicmodel is shown in Fig. 6. The hydrodynamic model obvi-ously underpredicts storm surge height. Table 1 shows thePE, MAE, and RMSE for the model calibration. The maxi-mum PE, MAE, and RMSE values for Chenggong Fish Portare 23.28 %, 0.24 m and 0.29 m, respectively.
Due to the failure in simulating surge height of thetwo-dimensional hydrodynamic model as the typhoon
Nat. Hazards Earth Syst. Sci., 12, 3799–3809, 2012 www.nat-hazards-earth-syst-sci.net/12/3799/2012/
W.-B. Chen et al.: Predicting typhoon-induced storm surge tide 3805
31
Fig. 6. Scatter plot of simulated and observed water level using two-dimensional 733 hydrodynamic model for the model calibration at (a) Suao Port, (b) Hualien Port, and 734 (c) Chenggong Fish Port. 735
Fig. 6. Scatter plot of simulated and observed water level usingtwo-dimensional hydrodynamic model for the model calibration at(a) Suao Port,(b) Hualien Port, and(c) Chenggong Fish Port.
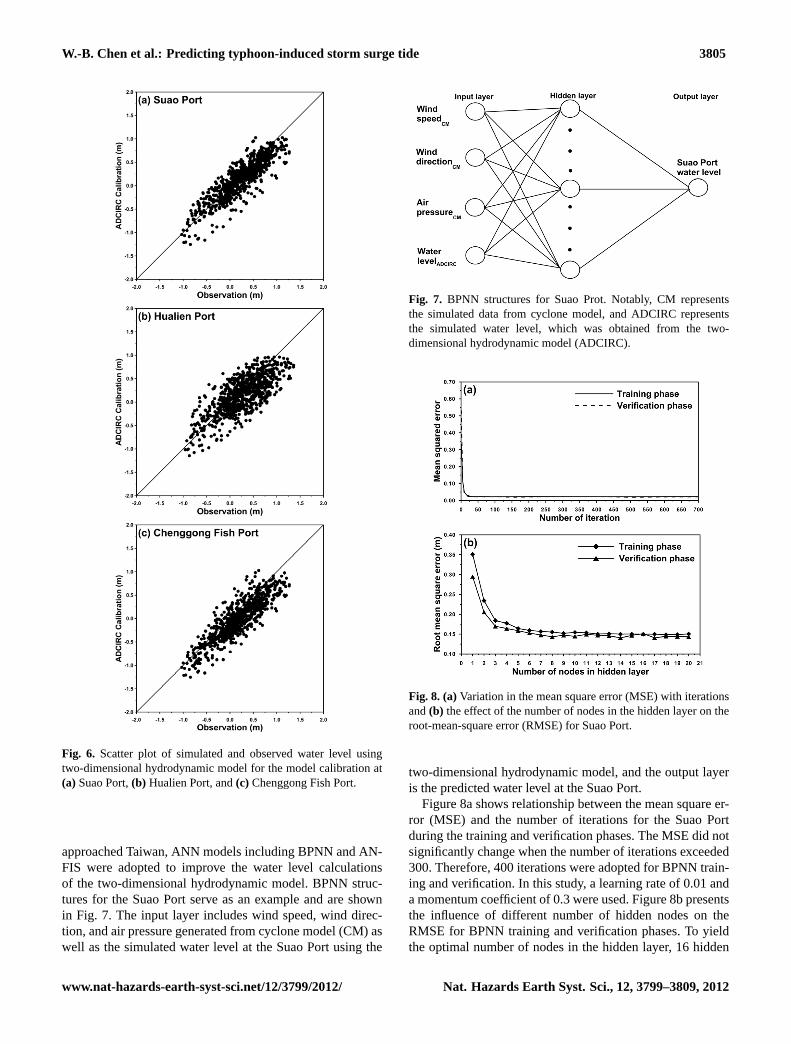
approached Taiwan, ANN models including BPNN and AN-FIS were adopted to improve the water level calculationsof the two-dimensional hydrodynamic model. BPNN struc-tures for the Suao Port serve as an example and are shownin Fig. 7. The input layer includes wind speed, wind direc-tion, and air pressure generated from cyclone model (CM) aswell as the simulated water level at the Suao Port using the
32
736 737 738 739 740 741 742 743
Fig. 7. BPNN structures for Suao Prot. Notably, CM represents the simulated data 744 from cyclone model, and ADCIRC represents the simulated water level, which was 745 obtained from the two-dimensional hydrodynamic model (ADCIRC). 746 747 748 749 750 751 752 753 754 755 756 757
Fig. 7. BPNN structures for Suao Prot. Notably, CM representsthe simulated data from cyclone model, and ADCIRC representsthe simulated water level, which was obtained from the two-dimensional hydrodynamic model (ADCIRC).
33
758 759 760 761 762 763 764
Fig. 8. (a) Variation in the mean square error (MSE) with iterations and (b) the effect 765 of the number of nodes in the hidden layer on the root mean square error (RMSE) for 766 Suao Port. 767 768 769 770
Fig. 8. (a)Variation in the mean square error (MSE) with iterationsand(b) the effect of the number of nodes in the hidden layer on theroot-mean-square error (RMSE) for Suao Port.
two-dimensional hydrodynamic model, and the output layeris the predicted water level at the Suao Port.
Figure 8a shows relationship between the mean square er-ror (MSE) and the number of iterations for the Suao Portduring the training and verification phases. The MSE did notsignificantly change when the number of iterations exceeded300. Therefore, 400 iterations were adopted for BPNN train-ing and verification. In this study, a learning rate of 0.01 anda momentum coefficient of 0.3 were used. Figure 8b presentsthe influence of different number of hidden nodes on theRMSE for BPNN training and verification phases. To yieldthe optimal number of nodes in the hidden layer, 16 hidden
www.nat-hazards-earth-syst-sci.net/12/3799/2012/ Nat. Hazards Earth Syst. Sci., 12, 3799–3809, 2012

3806 W.-B. Chen et al.: Predicting typhoon-induced storm surge tide
Table 2.The parameters used in the BPNN model.
Parameters Suao Hualien ChenggongPort Port Fish Port
Learning rate 0.01 0.01 0.01Momentum 0.3 0.3 0.3Iteration 400 400 400Input nodes 4 4 4Hidden nodes 16 16 17Output nodes 1 1 1
nodes in the BPNN model were chosen during the trainingand verification phases. Table 2 shows the parameters usedin the BPNN model.
The statistical errors of performance with the BPNNmodel for predicting water level during the training phase areshown in Table 1. Overall, the BPNN model does not sig-nificantly improve the prediction of water level. The MAEvalues at Suao Port and Hualien Port for the BPNN modelare greater than that for the two-dimensional hydrodynamicmodel. The maximum values of PE, MAE, and RMSE are−23.43 % at Chenggong Fish Port, 0.21 m, and 0.26 m atHualien Port, respectively.
Table 1 also shows the performance evaluations for pre-dicting the water levels at different stations using the ANFISmodel. The prediction of water level with the ANFIS modelis better than that with the two-dimensional hydrodynamicmodel and the BPNN model. This table indicates that thePE, MAE, and RMSE values at Suao Port, Hualien Port, andChenggong Fish Port of the ANFIS model are less than thoseof the two-dimensional hydrodynamic model and the BPNNmodel. The maximum PE, MAE, and RMSE values for AN-FIS training phase are 1.91 %, 0.16 m, and 0.21 m, respec-tively. A comparison of the results indicates that the ANFIStechnique is successfully used in predicting the astronomicaltide level and storm surge height.
4.2 Hydrodynamic model verification and ANN modelverification
The verification results with the two-dimensional hydrody-namic model for simulating the water levels at different lo-cations during the period of Typhoon Fanapi (2010) are il-lustrated in Fig. 9. Due to space limitations, we only showthe modeling results during Typhoon Fanapi (2010). The nu-merical model reproduces the astronomical tide level, but itfails to simulate water levels when the storm surge occurredon 19 September 2010. The hydrodynamic model underpre-dicts the storm surge height. Table 3 shows the PE, MAE,and RMSE for model verification. The results indicate thatthe PE, MAE, and RMSE values at Suao Port and HualienPort are less than those at Chenggong Fish Port.
Through the model calibration and verification proce-dures, the horizontal eddy viscosity parameter in Eq. (4) is
34
771 772 773 774 775
Fig. 9. Comparison of the observed (circle mark) and simulated (black line) water 776 levels for the two-dimensional hydrodynamic model verification at (a) Suao Port, (b) 777 Hualien Port, and (c) Chenggong Fish Port during Typhoon Fanapi (2010). 778 779 780 781 782 783 784 785
Fig. 9. Comparison of the observed (circle mark) and simulated(black line) water levels for the two-dimensional hydrodynamicmodel verification at(a) Suao Port,(b) Hualien Port, and(c) Cheng-gong Fish Port during Typhoon Fanapi (2010).
5.0 m2 s−1. A constant minimum bottom friction coefficientof Cfmin =0.003, break depth ofHbreak= 10 m, and two di-mensionless parameters ofθ = 10 andγ = 1/3 were used.
Figure 10 shows the prediction of water level at differentstations by the BPNN model during the verification phase.The BPNN model fails to modify the prediction of stormsurge height at Hualien Port and Chenggong Fish Port com-pared to the simulated results of the two-dimensional hydro-dynamic model (Fig. 9). Because BPNN model predicts tideand storm surge based upon the inputs, a large peak errorat the Chenggong Fish Port can be taken into account – abad prediction with BPNN model (Fig. 10c and Table 3).The PE, MAE, and RMSE values at Suao Port, Hualien Port,and Chenggong Fish Port with the BPNN model are higherthan with the two-dimensional hydrodynamic model (see Ta-ble 3). Table 3 also indicates that the maximum PE, MAE,and RMSE values are−43.89 %, 0.23 m, and 0.28 m, respec-tively, for the BPNN verification phase.
Figure 11 presents the prediction of water level at dif-ferent stations by the ANFIS model during the verificationphase. The simulated water level with the ANFIS model isbetter than with the two-dimensional hydrodynamic modeland the BPNN model. It indicates that the ANFIS model sat-isfactorily mimics the observed astronomical tide level andsurge height. Table 3 also indicates that the PE, MAE, andRMSE values at Suao Port, Hualien Port, and Chenggong
Nat. Hazards Earth Syst. Sci., 12, 3799–3809, 2012 www.nat-hazards-earth-syst-sci.net/12/3799/2012/

W.-B. Chen et al.: Predicting typhoon-induced storm surge tide 3807
Table 3.The performance of the two-dimensional hydrodynamic model, BPNN model, and ANFIS model for predicting water level duringthe verification phase at different stations.
MethodSuao Port Hualien Port Chenggong Fish Port
PE MAE RMSE PE MAE RMSE PE MAE RMSE(%) (m) (m) (%) (m) (m) (%) (m) (m)
Verification with two-dimensionalhydrodynamic model
−7.16 0.13 0.16 −1.49 0.17 0.20 −20.30 0.19 0.23
Verification with BPNN model −36.10 0.17 0.21 −32.94 0.21 0.25 −43.89 0.23 0.28Verification with ANFIS model −2.16 0.07 0.10 0.61 0.10 0.14 −13.77 0.11 0.16
Note: PE represents peak error; MAE represents mean absolute error; and RMSE represents root-mean-square error.
35
786 787 788 789 790
Fig. 10. Comparison of the observed (circle mark) and simulated (black line) water 791 levels for the BPNN model in the verification phase at (a) Suao Port, (b) Hualien Port, 792 and (c) Chenggong Fish Port during Typhoon Fanapi (2010). 793 794 795 796 797
Fig. 10. Comparison of the observed (circle mark) and simulated(black line) water levels for the BPNN model in the verificationphase at(a) Suao Port,(b) Hualien Port, and(c) Chenggong FishPort during Typhoon Fanapi (2010).
Fish Port with the ANFIS model are less than those with thetwo-dimensional hydrodynamic model and BPNN model.The maximum PE, MAE, and RMSE values are−13.77 %,0.11 m and 0.16 m, respectively, at Chenggong Fish Port forthe ANFIS verification phase. The ANFIS model is success-fully employed to improve the prediction of water level dur-ing typhoon events.
The degree to which uncertainty in the prediction of tidalelevations may influence the prediction of surge throughtide–surge interactions is of interest. Formal solutions forthe propagation of an externally forced tide and surgeinto an estuary of uniform section were developed by
36
798 799 800 801 802
Fig. 11. Comparison of the observed (circle mark) and simulated (black line) water 803 levels for the ANFIS model in the verification phase at (a) Suao Port, (b) Hualien Port, 804 and (c) Chenggong Fish Port during Typhoon Fanapi (2010). 805 806 807 808
Fig. 11. Comparison of the observed (circle mark) and simulated(black line) water levels for the ANFIS model in the verificationphase at(a) Suao Port,(b) Hualien Port, and(c) Chenggong FishPort during Typhoon Fanapi (2010).
Proudman (1955, 1957). He concluded that there are effectsof shallow water and bottom friction on the timing and mag-nitude of high water, both for standing wave and progres-sive wave. Rossiter (1961) assumed idealized surge with di-urnal periodicity and showed how a negative surge would re-tard tidal propagation, whereas a positive surge would ad-vance high water through a combination of depth affectingthe wave propagation speed and depth-dependent frictionalterms in the equation of motion. Prandle and Wolf (1978)reported tide–surge interactions resulting in a decrease ofthe peak surge elevation and that the effect can be local-ized, increasing in direct propagation to surge height andtidal range. Wolf (1981) used a one-dimensional analytical
www.nat-hazards-earth-syst-sci.net/12/3799/2012/ Nat. Hazards Earth Syst. Sci., 12, 3799–3809, 2012

3808 W.-B. Chen et al.: Predicting typhoon-induced storm surge tide
model to demonstrate that the shallow water effect becomesdominant over quadratic friction for tidal amplitudes in ex-cess of 3 m and in depth of 10 m or less.
Recently, Bernier and Thompson (2006) performed a two-dimensional barotropic ocean model in the northwest At-lantic and adjacent shelf seas and showed that the nonlin-ear parameterization of bottom stress is the principle con-tributor to their model tide–surge interaction off east coast ofCanada and northeastern United States. Horsburgh and Wil-son (2007) developed a simple mathematical explanation forsurge clustering on the rising tide and proved that becauseof the interaction of the two signals, the peak of large surgeevents would typically avoid the high tide period by 3–5 h,with a secondary clustering within 1–2 h. Phase shifts oc-cur in both the tide and the surge signals because of tide–surge interactions. This is because both signals are shallowwater waves whose phase speed is given as(gh)1/2 whereh
is the depth andg is the acceleration due to gravity. Zhanget al. (2010) studied the tide–surge interactions in the TaiwanStrait using the numerical model, NCTSM (two-way NestedCoupled Tide-Surge Model). They showed that the processesleading to the alteration of water elevations due to the tide–surge interactions can be classified into three nonlinear ef-fects: nonlinear advective effects, nonlinear bottom stress ef-fects, and nonlinear shallow water effects.
Ippen (1966) classified water waves according to the ra-tio of water depth (h) to the wavelength (L). The ratioh/L
is called the “relative depth”. For the small amplitude wavetheory, the equations expressing the various wave character-istics are greatly simplified; the ratioh/L lies within certainranges. If the relative depth is below 1/20, then the depthis small in comparison with the wavelength and the wavesare termed “shallow water” waves (the term “long wave”);if the ratio is greater than 1/2, the waves are called “deepwater” waves (also “short waves”). For 1/20< h/L < 1/2,the waves are called “intermediate depth” waves, and in thisrange the wave equations do not simplify. However, in a largenumber circumstances the waves are either in the “shallowwater” or “depth water” category. The propagation of tidesis attributed to long wave which has longer wavelength com-pared with the shorter (high-frequency) surge components.The wave propagation is quite different depending on thelocalized nature of tide–surge interaction in shallow waterzones.
Tide–surge interactions are one of the most importantproblems in the study and affect the prediction of stormsurges. However the study of tide–surge interactions is be-yond the scope of present research. In the future work, thecomplex characteristics of tide–surge interactions off eastcoast of Taiwan can be investigated with the numerical modeland dynamic analysis.
5 Conclusions
A high-resolution, two-dimensional, hydrodynamic model(ADCIRC), which uses an unstructured grid, was applied tosimulate the astronomical tide level and storm surge height.To save computational time and fit the coastline boundary,coarse grids were generated in coastal seas, whereas finegrids were used in shallow areas close to the coastline. Aglobal ocean tidal model developed by Oregon State Univer-sity, the TOPEX/Poseidon Global Inverse Solution (TPXO),is used to specify the open boundaries of ADCIRC for sim-ulating tidal propagation in the sea. A cyclone model is usedfor the meteorological conditions. Five typhoon events, Ty-phoon Mindulle (2004), Typhoon Sepat (2007), and TyphoonKalmaegi (2008), Typhoon Funfwoug (2008) and TyphoonFanapi (2010), were used for model calibration and verifi-cation. To determine the performance of the hydrodynamicmodel and the ANN model, three criteria (i.e. the peak error,PE; mean absolute error, MAE; and the root-mean-square er-ror, RMSE) were adopted to evaluate the model results andthe observational data.
We found that the hydrodynamic model can satisfactorilyreproduce the astronomical tide level but fails to mimic thestorm surge height for the model calibration and verifica-tion phase. Therefore, the ANN model including the BPNNmodel and the ANFIS model was applied to amend the poorpredictions in storm surge height during typhoon events withthe two-dimensional hydrodynamic model. The simulationresults reveal that the BPNN model can reproduce the as-tronomical tide but fails to improve the prediction of waterlevel during storm surge. Moreover, the ANFIS model pre-dicts both the astronomical tide level and the surge heightand shows the lowest PE, MAE, and RMSE values at SuaoPort, Hualien Port, and Chenggong Fish Port compared to thesimulated results with the two-dimensional hydrodynamicmodel and the BPNN model. This study asserts that the AN-FIS technique can be successfully employed in the predictionof water levels along the east coast of Taiwan during typhoonevents.
In complex near shore regions, a high degree of uncer-tainty in predicted tides may induce uncertainty in the surgeif tide–surge interactions are significant. The coasts in Tai-wan have complex topography and bathymetry. Therefore,the tide–surge interactions off east coast of Taiwan will bestudied with hydrodynamic modeling and dynamic analysisin the future.
Acknowledgements.The project was funded by the NationalScience Council, Taiwan, grant Nos. NSC 98-2625-M-239-001,99-2625-M-239-001, 100-2625-M-239-001 and InternationalResearch-Intensive Centers of Excellence (I-RICE) in Taiwan-Supercomputing Research Center, under grant No. NSC 103-2911-I-006-301. The authors would like to express their appreciation tothe Taiwan Center Weather Bureau for providing the observationaldata. Appreciation and thanks are also given to two reviewers fortheir constructive comments and suggestions to improve this paper.
Nat. Hazards Earth Syst. Sci., 12, 3799–3809, 2012 www.nat-hazards-earth-syst-sci.net/12/3799/2012/

W.-B. Chen et al.: Predicting typhoon-induced storm surge tide 3809
Edited by: S. TintiReviewed by: D. Prandle and one anonymous referee
References
Bajo, M. and Umgiesser, G.: Storm surge forecast through a com-bination of dynamic and neural network models, Ocean Model.,33, 1–9, 2010.
Bernier, N. B. and Thopmson, K. R.: Predicting the frequency ofstorm surges and extreme sea levels in the northwest Atlantic, J.Geophys. Res., 111, C10009,doi:10.1029/2005JC003168, 2006.
De Oliveira, M. M. F., Ebecken, N. F. F., De Oliveira, J. L. F., andDe Azevedo Santos, I.: Neural network model to predict a stormsurge, J. Appl. Meteorol. Climatol., 48, 143–155, 2009.
Dietsche, D., Hagen, S. C., and Bacopoulos, P.: Storm surge simula-tion for Hurricane Hugo (1989): on the significance of inundationareas, J. Waterw. Port Coast. Ocean Eng., 133, 183–191, 2007.
Egbert, G. D. and Erofeeva, S. Y.: Efficient inverse modeling ofbarotropic ocean tides, Journal of Atmos. Ocean. Technol., 19,183–204, 2002.
Egbert, G. D., Bennett, A. F., and Foreman, M. G.:TOPEX/POSEIDON tides estimated using a global inversemodel, J. Geophys. Res., 99, 24821–24852, 1994.
Etala, P.: Dynamic issues in the SE South America storm surgemodeling, Nat. Hazards, 51, 79–95, 2009.
Filippo, A., Torres Jr., A. R., Kjerfve, B., and Monat, A.: Applica-tion of artificial neural network (ANN) to improve forecasting ofsea level, Ocean Coast. Manage., 55, 101–110, 2012.
Fletcher, R. and Powell, M. J. D.: A rapid convergent descentmethod for minimization, Comput. J., 6, 163–168, 1963.
Graham, H. E. and Nunn, D. E.: Meteorological conditions perti-nent to standard project hurricane, Atlantic and Gulf Coasts ofUnited States, National Hurricane Research Project, Report No.3, US Weather Service, 1959.
Grenier, R. R., Luettich, R. A., and Westerink, J. J.: A comparisonof the nonlinear frictional characteristics of two-dimensional andthree-dimensional models of a shallow water tidal embayment, J.Geophys. Res., 100, 13719–13735, 1995.
Herman, A., Kaiser, R., and Niemeyer, H. D.: Modelling of amedium-term dynamics in a shallow tidal sea, based on com-bined physical neural network methods, Ocean Model., 17, 277–299, 2007.
Horsburgh, K. J. and Wilson, C.: Tide-surge interaction and its rolein the distribution of surge residuals in the North Sea, J. Geophys.Res., 112, C08003,doi:10.1029/2006JC004033, 2007.
Ippen, A. T.: Estuary and coastline hydrodynamics, McGraw-HillInc., 1–92, 1966.
Jang, J. S. R.: 1 ANFIS: adaptive-network-based fuzzy inferencesystem, IEEE Trans. Syst. Man Cybern., Part A-Syst. Hum., 23,665–685, 1993.
Jelesnianski, C. P.: A numerical calculation of storm tides inducedby a tropical storm impinging on a continental shelf, Mon.Weather Rev., 93, 343–358, 1965.
Kolar, R. L. and Gray, W. G.: Shallow water modeling in small wa-ter bodies, edited by Gambolati, G., Computational Methods inSurface Hydrology, WIT Press, Billerica, Massachusetts, 149–155, 1990.
Kolar, R. L., Gray, W. G., Westerink, J. J., and Luettich, R. A.:Shallow water modeling in spherical coordinates-equation for-mulation, numerical implementation and application, J. Hydraul.Res., 32, 3–24, 1994.
Luettich, R. A., Westerink, J. J., and Scheffner, N. W.: ADCIRC:An advanced three-dimensional circulation model for shelves,coasts, and estuaries, Report I: theory and methodology ofADCIRC-2DDI and ADCIRC-3DL, US Army Corps of Engi-neers, Technical Report DRP-92-6, 1992.
Nayak, P. C., Sudheer, K. P., Ragan, D. M., and Ramasastri, K. S.:A neuro fuzzy computing technique for modeling hydrologicaltime series, J. Hydrol., 291, 52–66, 2004.
Prandle, D. and Wolf, J.: The interaction of surge and tide in theNorth Sea and River Thames, Geophys. J. Astron. Soc., 55, 203–216, 1978.
Proudman, J.: The propagation of tide and surge in an estuary, Proc.R. Soc. Lond., A231, 8–24, 1955.
Proudman, J.: Oscillations of tide and surge in an estuary of finitelength, J. Fluid Mech., 2, 371–381, 1957.
Rego, J. L. and Li, C.: Storm surge propagation in Galveston Bayduring Hurricane Ike, J. Mar. Syst., 82, 265–279, 2010.
Rossiter, J. R.: Interaction between tide and surge in the Thames,Geophys. J. R. Astron. Soc., 6, 29–53, 1961.
Rumelhart, D. E., Hinton, G. E., and Williams, R. J.: Learning rep-resentations by back-propagating errors, Nature, 323, 533–536,1986.
Shen, J., Wang, H. V., Sisson, M., and Gong, W.: Storm tide simu-lation in the Chesapeake Bay using an unstructured grid model,Estuar. Coast. Shelf Sci., 68, 1–16, 2006.
Takagi, T. and Sugeno, M.: Fuzzy identification of systems and itsapplications to modeling and control, IEEE Trans. Syst. Man Cy-bern., 15, 116–132, 1985.
Westerink, J. J., Luettich, R. A., and Muccino, J. C.: Modeling tidesin the Western North Atlantic using unstructured graded grids,Tellus Ser. A-Dyn. Meteorol. Oceanol., 46, 178–199, 1994.
Wolf, J: Surge-tide interaction in the North Sea and River Thames,Floods die to High Winds and Tides, edited by: Peregrine, D. H.,Elsevier, New York, 75–94, 1981.
Xia, M., Xia, L., Pietrafesa, L. J., and Peng, M.: A numerical studyof storm surge in the Cape Fear River Estuary and adjacent coast,J. Coast. Res., 24, 159–167, 2008.
You, S. H. and Seo, J. W.: Storm surge prediction using an artificialneural network model and cluster analysis, Nat. Hazards, 51, 97–114, 2009.
You, S. H., Lee, W. J., and Moon, K. S.: Comparison of stormsurge/tide predictions between a 2-D operational forecast sys-tem, the regional tide/storm surge model (RTSM), and the 3-Dregional ocean modeling system (ROMS), Ocean Dyn., 60, 443–459, 2010.
Young, I. R. and Sobey, R. J.: The numerical prediction of tropi-cal cyclone wind-waves, Department of Civil and Systems Engi-neering, James Cook University of North Queensland, Townville,Research Bulletin No. CS20, 1981.
Zhang, W., Shi, F., Hong, H., Shang, S., and Kirby, J.: Tide-surgeintensified by the Taiwan Strait, J. Geophys. Res. 115, C06012,doi:10.1029/2009JC005762, 2010.
www.nat-hazards-earth-syst-sci.net/12/3799/2012/ Nat. Hazards Earth Syst. Sci., 12, 3799–3809, 2012