predicting tropical cyclone rapid intensification...
TRANSCRIPT
Predicting tropical cyclone rapid intensification using the 37 GHzring pattern identified from passive microwave measurements
Margaret E. Kieper1 and Haiyan Jiang1
Received 26 April 2012; revised 28 May 2012; accepted 29 May 2012; published 6 July 2012.
[1] A distinctive satellite-derived precipitative ring patternaround the tropical cyclone (TC) center is found to be relatedto rapid intensification (RI). The ring pattern appears on theNaval Research Laboratory (NRL) 37 GHz passive micro-wave composite color product as a cyan color ring. Theprobability of RI is evaluated for cases with this ring patternby reviewing images of the NRL product for 84 TCs during2003–2007 in the Atlantic basin using 6-hourly NationalHurricane Center (NHC) best track data. It is found that whencombining the ring criterion with the Statistical HurricanePrediction Scheme (SHIPS) RI Index (RII), the probability ofRI almost doubled, indicating that both the ring and SHIPSRII contain independent information for RI prediction. Asubjective technique for predicting RI is proposed using boththe 37 GHz ring and the SHIPS RII. Both the probability ofdetection (POD) and the false alarm ratio (FAR) for thecombined ring+SHIPS RII are lower than those for SHIPSRII alone (POD, 24% versus 77%, and FAR, 26% versus66%) when treating every 6-hr synoptic time as a separatecase. Since the method was initially developed for RI event-based forecasts, statistics based on 2003–2007 Atlantic RIevents, which consist of a contiguous period where any24-hour subset shows at least a 30 kt intensity increase, arealso generated. The method captures 21 out of these 28events and produces 2 false alarms, producing a POD of 75%and a FAR of 9%. Citation: Kieper, M. E., and H. Jiang (2012),Predicting tropical cyclone rapid intensification using the 37 GHzring pattern identified from passive microwave measurements,Geophys. Res. Lett., 39, L13804, doi:10.1029/2012GL052115.
1. Introduction
[2] Although tropical cyclone (TC) track forecasts havebeen improved substantially during the past 20 years, littlegain in accuracy of forecasting TC intensity, especially rapidintensification (RI), over the same period has been achieved[Rappaport et al., 2009]. The physical processes associatedwith RI, which is usually defined as 24-h intensity increase≥30 kt [Kaplan and DeMaria, 2003], remain unsolved.Favorable large-scale environmental conditions that are near-universally agreed to be necessary for TC intensificationinclude: warm sea surface temperature (SST), high low- tomid-level moisture, and low vertical wind shear [Merrill,1988]. Kaplan et al. [2010] showed that a RI predictionindex based on only environmental parameters is skillful
in the Atlantic and Northern East Pacific basins, whileHendricks et al. [2010] indicated that RI might be con-trolled by storm internal dynamics providing a favorablepre-existing environmental condition.[3] The hot tower hypothesis [Malkus et al., 1961;
Simpson et al., 1998] assumes that the latent heating releaseby those intense convective overshooting towers is crucialto TC intensification. Convective asymmetries [Braun et al.,2006] and vortical hot towers [Montgomery et al., 2006;Molinari and Vollaro, 2010] have also been indicated to berelated to TC RIs. However, it has been indicated that theincrease of the probability of RI for TCs with hot towers inthe inner core is not substantial relative to the climatologicalmean [Jiang, 2012]. On the other hand, an alternativehypothesis to the hot tower hypothesis was developed inthe early 1980s. It has been shown that symmetric heatingwas a major factor in most TC intensification through boththeoretical [Shapiro and Willoughby, 1982; Nolan andGrasso, 2003] and observational studies [Willoughby et al.,1982; Willoughby, 1990]. Recently, Nguyen et al. [2011]advance the idea that TC may vacillate between symmetricand asymmetric intensification through a modeling casestudy of Hurricane Katrina (2005). However, it is not clearwhether the symmetric or asymmetric process leads theintensification.[4] Satellite observations are often the only available
means for estimating TC intensity. Unlike infrared sensors,passive microwave channels allow penetration into precipi-tating clouds, therefore providing information about precip-itation and ice particles instead of just the cloud tops. Thisstudy uses the 37 GHz frequency measurements, whichdetect both emission from liquid hydrometeors and scatteringof upwelling radiation by cloud ice [Weng and Grody, 1994].The findings documented here represent the first time thatthe 37 GHz ring pattern in the inner core is identified as aspecific and unique feature that is associated with TC RI, andin such cases immediately precedes eyewall development.
2. Data and Methods
[5] To examine TC precipitation morphology during peri-ods of RI, a set of images is collected of all TC satelliteoverpasses during 2003–2007 in the North Atlantic basinfrom the 37 GHz color composite product provided by theNavy Research Laboratory (NRL) TC satellite web page(http://www.nrlmry.navy.mil/TC.html) [Hawkins et al., 2001;Hawkins and Velden, 2011]. The 37 GHz is used here for itscapacity of detecting low-level circulation centers, which aresometime unseen at 85 GHz [Lee et al., 2002; Turk et al.,2006]. In order to better display the 37 GHz observationsincluding its sensitivity for both low-level clouds and deepconvection, the 37 GHz color composite (hereafter 37color)product was developed at NRL for real-time TC image
1Department of Earth and Environment, Florida International University,Miami, Florida, USA.
Corresponding author: H. Jiang, Department of Earth and Environment,Florida International University, 11200 SW 8th St., PC-342B, Miami,FL 33199, USA. ([email protected])
©2012. American Geophysical Union. All Rights Reserved.
GEOPHYSICAL RESEARCH LETTERS, VOL. 39, L13804, doi:10.1029/2012GL052115, 2012
L13804 1 of 7
distribution [Lee et al., 2002]. It is constructed by using 37GHz vertically polarized (V37) and horizontally polarized(H37) brightness temperatures, and polarization correctiontemperature (PCT37 [Cecil et al., 2002]). The ocean surfaceappears cold in V37 and H37, similar to ice-scattering in deepconvection which also appears cold in both V37 and H37. Tocorrect this ambiguity, the PCT37 is defined by PCT37 =2.18 � 37V � 1.18 � H37. The resulting PCT37 is cold forice-scattering and warm for the ocean surface. The 37colorproduct implements a red/green/blue color composite fromPCT37, H37 and V37 so that qualitatively the ocean surfacein the color product appears dark green, deep convectionappears pink, and low-level water clouds and warm rainappear cyan. The quantitative information is sacrificed. The37color product is generated for all TC overpasses from theTropical Rainfall Measuring Mission (TRMM) MicrowaveImager (TMI), Advanced Microwave Scanning Radiometerfor EOS (AMSR-E), WindSat, Special Sensor MicrowaveImager (SSM/I), and Special Sensor Microwave Imager/Sounder (SSMIS) when these data are available.[6] After examining many 37color images of the entire life
cycle of TCs, we hypothesize that the first appearance of awell-defined cyan color ring pattern in the inner core imme-diately surrounding the warm center is associated with RI.The purpose of this study is to test this hypothesis. Using the37color images collected for 84 named TCs during 2003–2007 hurricane seasons in the North Atlantic basin, the ringpattern is searched for within each satellite overpass thatcaptures the TC inner core. The following criteria are used todefine a ring pattern: 1) It immediately surrounds the warmcenter of the developing TC; 2) It is symmetric (round) andshould be at least 90% closed (not a partial ring); 3) Theminimum thickness between the inner and outer edges of thering should be at least one-fourth of the diameter of the outeredges; 4) The ring should consist of mostly solid bright cyanand not a faded cyan; 5) Part of the ring could be pink(intense convection overlaying cyan ring).[7] The best track data from the National Hurricane Center
(NHC) are used to determine RI cases from the 84 TCs. RIcases are defined as those cases with 24-hour maximumwindspeed intensity increase equal to or greater than 30 kt[Kaplan and DeMaria, 2003]. From the best track data, a24-hour period beginning at each synoptic time (i.e., 0000,0600, 1200 and 1800 UTC) is considered the starting point ofone potential RI case. Therefore consecutive RI cases eachoverlap by 18 hours. To be included in the study, the innercore of the TC must be over water for the period of RI. Theinitial intensity must be less than or equal to 100 kt. The84 TCs contributed a total of 1735 cases (i.e., 24-h periods
with initial time at the 6 hourly synoptic times). When envi-ronmental conditions are favorable for RI, in many instancesthe favorable environment exists for a day or so, so that whena TC starts to rapidly intensify, the intensification continuesfor at least 24 hours and can last as long as 48–60 hours. Herewe define this period of RI as one RI event. Using the defi-nition of RI as an increase of 30 kt or higher in 24 hours, withbest track data for every 6-hour synoptic time, each RI eventcan be defined as a cluster of continuous and overlapping24-hr RI cases. RI events in the study contained up to 6overlapping RI cases, and each TC could have more than oneRI event. For example, as shown in Table 1, Hurricane Emily(2005) experienced three RI events. The first RI event has 6overlapping RI cases. The second and third events, both ofwhich consist of two overlapping RI cases, began after thestorm subsequently weakened. In this study, a ring pattern issearched from all the available 37color images with obser-vation times within t � 5 h and t + 1 h (t is the initial time ofeach 6-h case). According to discussions with NHC fore-casters, up to one hour delay of the microwave data isacceptable to be used in their forecasts. Since our hypothesisis that only the first ring occurrence during each RI event canbe use as a predictor, here only the first ring during each TCintensifying period is counted and recorded. The StatisticalHurricane Intensity Prediction Scheme (SHIPS) RI index(RII) [Kaplan et al., 2010] is used to evaluate the envi-ronmental factors for each best track case. The SHIPS RIIprobability values for a 30 kt intensity increase during 24 h(hereafter RII_30 kt) are obtained from the post-timedependent run of the most recent version of SHIPS RIIalgorithm for 1995–2010 storms. These values are matchedwith the 6-hourly best track data. One caveat is that there are762 out of 1735 total cases with no SHIPS RII available dueto either extra-tropical condition or low initial storm inten-sity. In the remaining 973 cases, there are 195 cases with no37 GHz satellite data available. Therefore, the final totalnumber of qualified cases used in this study is 778. There are71 actual RI cases out of these 778 cases and these 71 RIcases are from 28 RI events. The total number of RI casesduring 2003–2007 Atlantic hurricane seasons is 104 (includ-ing 7 overland RI cases) from 31 RI events.
3. Results and Discussion
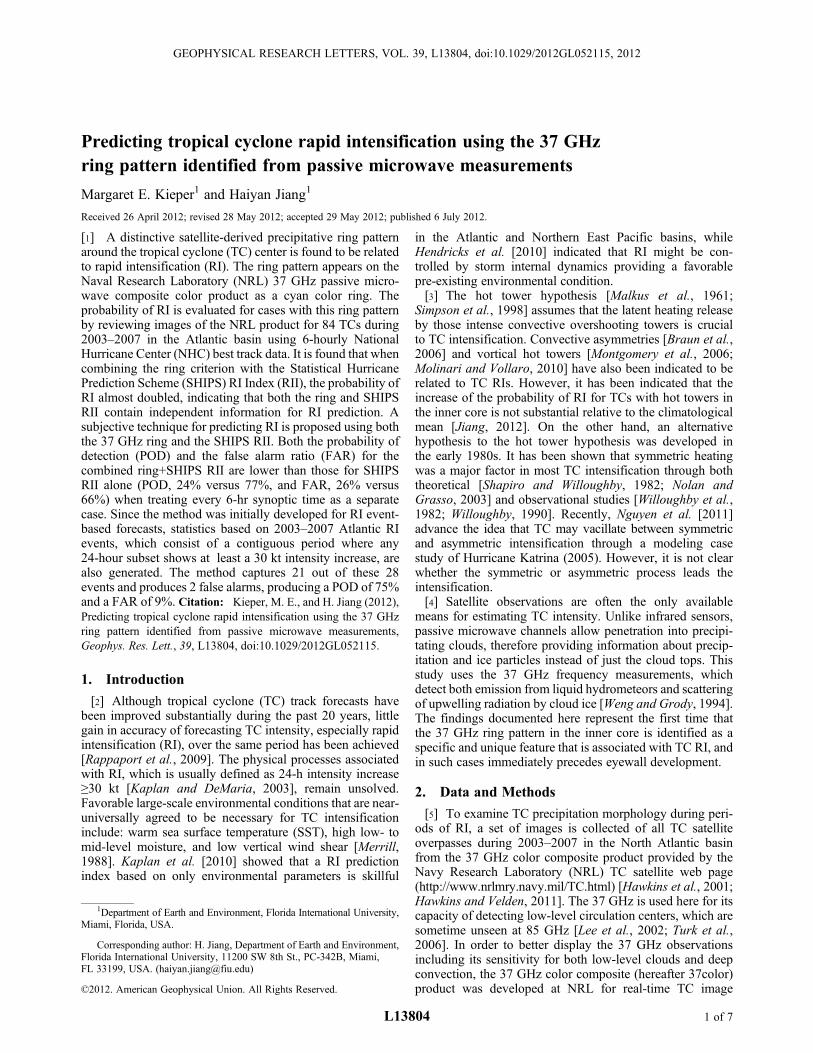
[8] Identifying ring patterns in the 37color images mainlyrelies on higher resolution sensors including TMI, AMSR-E,and WindSat, although lower resolution sensors includingSSM/I and SSMIS can be used for storms with very largeeyes. Figure 1 shows an example of the ring feature, an NRL37color image from a WindSat overpass at 11:05 UTCOctober 18, 2005 associated with a record-setting RI eventfor Hurricane Wilma (2005). The first ring pattern duringeach TC intensifying period occurred in 45 out of the778 cases (Table 2). In the 45 possible RI cases with a ring,there are 23 cases that actually went through RI. There are19 out of these 23 cases in which a ring pattern appearedduring t � 5 h and t + 1 h period, but four other cases had aring pattern more than one hour after the starting time of the24-h RI period. In real-time NHC forecasts, these 4 RI caseswill be missed if using the ring pattern as a predictor.[9] The ring pattern also appeared at the beginning of
22 intensifying cases that did not go through RI (Table 2).There were no differences in the appearance of the ring
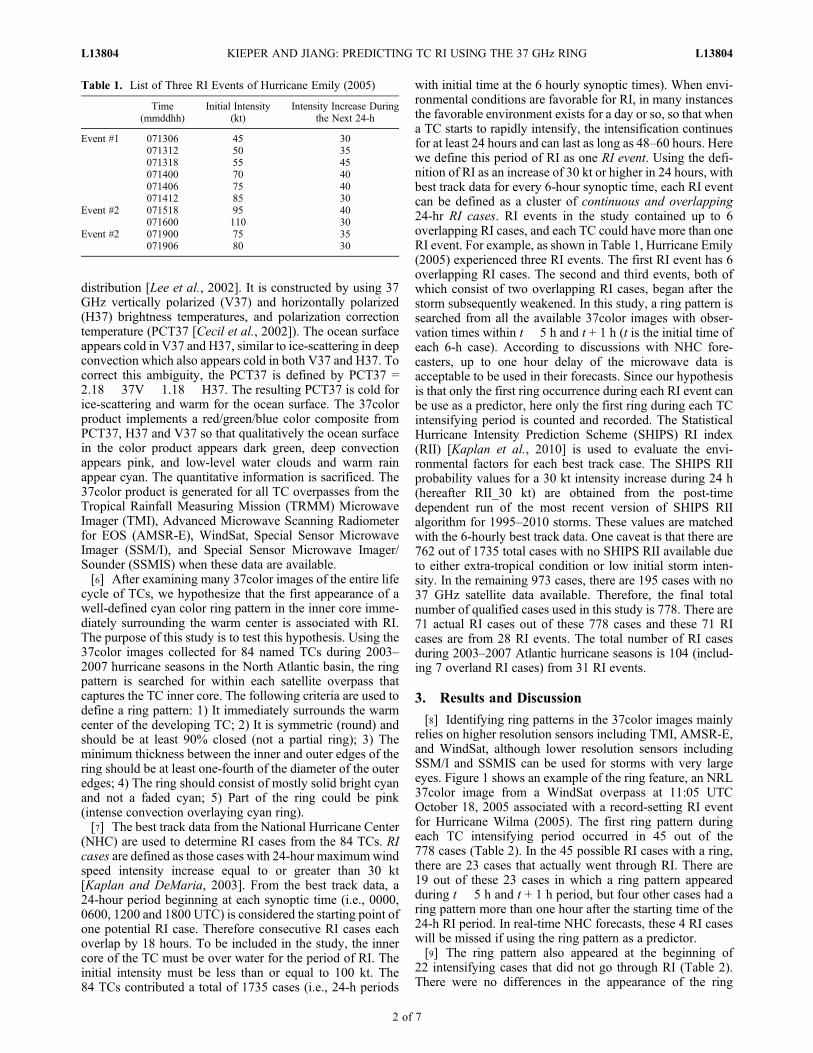
Table 1. List of Three RI Events of Hurricane Emily (2005)
Time(mmddhh)
Initial Intensity(kt)
Intensity Increase Duringthe Next 24-h
Event #1 071306 45 30071312 50 35071318 55 45071400 70 40071406 75 40071412 85 30
Event #2 071518 95 40071600 110 30
Event #2 071900 75 35071906 80 30
KIEPER AND JIANG: PREDICTING TC RI USING THE 37 GHz RING L13804L13804
2 of 7
pattern between cases that went through RI and those that didnot. It is likely that all TCs at this point had reached a similarstage in their core development, but the environmental fac-tors are different for these RI and non-RI cases. The SHIPSRII probability for a 30 kt increase in 24-h (RII_30 kt[Kaplan et al., 2010]) is examined. The RII-30 kt values areprobabilities scaled from 0 to 100%, with the higher valuesindicating higher probabilities of RI due to favorable envi-ronmental conditions. It is found that the average SHIPS RII-30 kt is much higher for RI cases (27.5%) than non-RI cases(4.5%). If an arbitrary threshold of RII-30 kt is selected to be≥5% for a favorable environment, 21 out of 23 RI casessatisfies this threshold and all but 2 non-RI cases do not meetthis threshold. The 20 non-RI cases with a ring and SHIPSRII-30 kt < 5% are correct rejections, but the 2 non-RI caseswith a ring and SHIPS RII-30 kt ≥ 5% are false alarms. In the23 RI cases, there are 17 correct forecast (hit) cases (with ringduring t � 5 h and t + 1 h and SHIPS_RII ≥ 5%), 4 micro-wave late cases (with ring during t + 1 h and t + 7 h andSHIPS_RII ≥ 5%), and 2 misses (with ring during t� 5 h andt + 1 h and SHIPS RII < 5%, see Table 2). Therefore theSHIPS RII can be used as a discriminator for RI and non RIcases, even though both cases have a ring feature.[10] Based on the result shown in Table 2, the probability
of RI if using the 37 GHz ring as the sole criterion (the ring RIindex) is 38% (17/45, Table 3). This represents a factor of5.4 increases from the climatological mean during the same5-yr period. Jiang [2012] indicated that the probability of RIfor TCs with hot towers in the inner-core is 9.6%, which isonly about a factor of 1.5 increases from the climatological
mean (6.3%) using TRMM precipitation radar observed TCsduring 1998–2008. Although Jiang’s [2012] results arefor global TCs, the substantial difference with this studydemonstrates that the ring pattern might be a better inner-coreprocess related indicator for the RI prediction.[11] The SHIPS RII probability threshold used to forecast
RI is about 20% for the Atlantic basin [Kaplan et al., 2010].Here we use this threshold to evaluate the probability ofRI for the SHIPS RII. There are 163 cases with RII_30 kt ≥20%, in which there are 55 actual RI cases. Therefore, theprobability of RI is 34% (55/163, Table 3), which is slightlylower than the probability of RI for the ring RI index (38%).This indicates that environmental conditions and inner-coreproperties might weight almost equally in terms of deter-mining RI, although other inner-core processes need to betaken into account as well besides the ring pattern.[12] Since a favorable environment condition is necessary
for RI, it is optimal to add the SHIPS RII criterion to the ringRI index (RII). Here it is decided to use RII_30 kt ≥ 5% as theadditional criterion besides the ring. We call this combinedRI index Ring+SHIPS RII. As shown in Table 3, there are 23(out of 778) cases that satisfy the ring and RII_30 kt ≥ 5%criteria, in which there are 17 actual RI cases. This produces aprobability of RI of 74% (17/23), which is about a factor 2higher than the probability of either the ring or SHIPS RIIalone. This indicates that the 37 GHz ring RII and SHIPS RIIare independent predictors. This indicates that RI is depen-dent on favorable conditions and a certain level of internalcore structure to a similar extent, and that symmetric warmrain (indicated by the cyan color ring on the 37 GHz product)is an important element in this core structure.[13] The probability of detection (POD) and false alarm
ratio (FAR) for 2003–2007 storms are also shown in Table 3.The POD is the percentage of RI cases that are correctlyidentified. The FAR is the number of times that RI is fore-casted but does not occur divided by the total number oftimes RI is forecast. The FAR is equal to one minus theprobability of RI. The PODs for the ring only, SHIPS RIIonly, and ring+SHIPS RII are 24% (17/71), 77% (55/71), and24% (17/71), respectively. The POD for the combined RII isa factor of 3 lower than that for the SHIPS RII. The FARs forthe ring only, SHIPS RII only, and ring+SHIPS RII are 62%,66%, and 26%. The FAR for the combined RII is a factorof 2.5 lower than that for the SHIPS RI. This shows thatthe ring+SHIPS RII has a great potential to reduce the falsealarm rate, but the detection rate is somewhat sacrificed whentreating every 6-h synoptic time as one case.[14] As mentioned above, RI usually happens as an event,
noted in the best track data as a cluster of continuous andoverlapping 24-h RI cases. Hurricane forecasters often preferto characterize RI as an event. The ring+SHIPS RI forecastscheme was initially designed as an event-based forecastmethod. From this point of view, a separate statistic is done toevaluate the method based on RI events using the 2003–2007Atlantic hurricane seasons. As listed in Table 4, there area total of 28 RI events associated with 24 TCs: 21 hits and7 misses. The ring+SHIPS RII forecast method captures21 out of these 28 events, producing a POD of 75% (21/28).Two events are missed due to a low SHIPS RII value, andfive events are missed due to a lack of a ring feature. Aftertaking the two false alarm cases in Table 2 into account, theFAR is 9% (2/23), which corresponds to a 91% probabilityof RI. This extremely high performance comes with three
Figure 1. An example of a precipitative ring in HurricaneWilma (2005)’s NRL 37color image from a WindSat over-pass at 11:05 UTC October 18, 2005. The ring patternoccurred about one hour before an RI case with a 24-h inten-sity increase of 95 kts. Courtesy of the Naval ResearchLaboratory (NRL) TC satellite web page (http://www.nrlmry.navy.mil/TC.html). (Note that if you are reading aprinted copy of the figure, the cyan color might not be as clearas in the electronic copy viewed from a computer screen).
KIEPER AND JIANG: PREDICTING TC RI USING THE 37 GHz RING L13804L13804
3 of 7
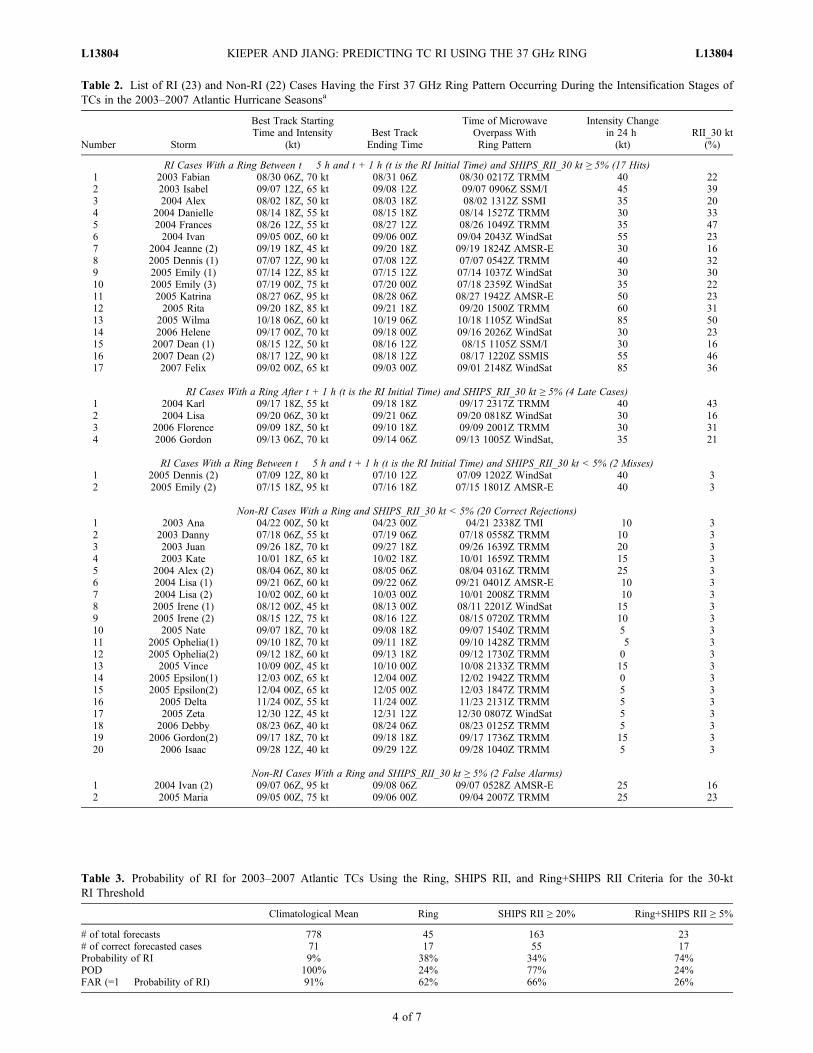
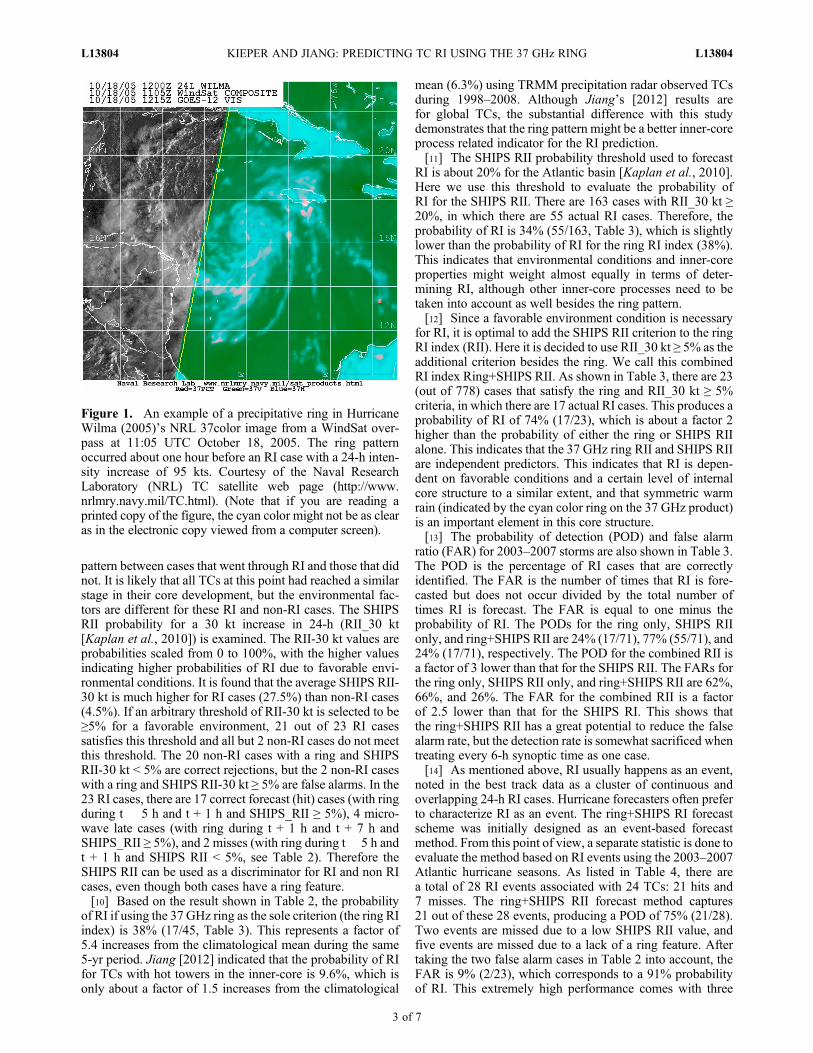
Table 2. List of RI (23) and Non-RI (22) Cases Having the First 37 GHz Ring Pattern Occurring During the Intensification Stages ofTCs in the 2003–2007 Atlantic Hurricane Seasonsa
Number Storm
Best Track StartingTime and Intensity
(kt)Best TrackEnding Time
Time of MicrowaveOverpass WithRing Pattern
Intensity Changein 24 h(kt)
RII_30 kt(%)
RI Cases With a Ring Between t � 5 h and t + 1 h (t is the RI Initial Time) and SHIPS_RII_30 kt ≥ 5% (17 Hits)1 2003 Fabian 08/30 06Z, 70 kt 08/31 06Z 08/30 0217Z TRMM 40 222 2003 Isabel 09/07 12Z, 65 kt 09/08 12Z 09/07 0906Z SSM/I 45 393 2004 Alex 08/02 18Z, 50 kt 08/03 18Z 08/02 1312Z SSMI 35 204 2004 Danielle 08/14 18Z, 55 kt 08/15 18Z 08/14 1527Z TRMM 30 335 2004 Frances 08/26 12Z, 55 kt 08/27 12Z 08/26 1049Z TRMM 35 476 2004 Ivan 09/05 00Z, 60 kt 09/06 00Z 09/04 2043Z WindSat 55 237 2004 Jeanne (2) 09/19 18Z, 45 kt 09/20 18Z 09/19 1824Z AMSR-E 30 168 2005 Dennis (1) 07/07 12Z, 90 kt 07/08 12Z 07/07 0542Z TRMM 40 329 2005 Emily (1) 07/14 12Z, 85 kt 07/15 12Z 07/14 1037Z WindSat 30 3010 2005 Emily (3) 07/19 00Z, 75 kt 07/20 00Z 07/18 2359Z WindSat 35 2211 2005 Katrina 08/27 06Z, 95 kt 08/28 06Z 08/27 1942Z AMSR-E 50 2312 2005 Rita 09/20 18Z, 85 kt 09/21 18Z 09/20 1500Z TRMM 60 3113 2005 Wilma 10/18 06Z, 60 kt 10/19 06Z 10/18 1105Z WindSat 85 5014 2006 Helene 09/17 00Z, 70 kt 09/18 00Z 09/16 2026Z WindSat 30 2315 2007 Dean (1) 08/15 12Z, 50 kt 08/16 12Z 08/15 1105Z SSM/I 30 1616 2007 Dean (2) 08/17 12Z, 90 kt 08/18 12Z 08/17 1220Z SSMIS 55 4617 2007 Felix 09/02 00Z, 65 kt 09/03 00Z 09/01 2148Z WindSat 85 36
RI Cases With a Ring After t + 1 h (t is the RI Initial Time) and SHIPS_RII_30 kt ≥ 5% (4 Late Cases)1 2004 Karl 09/17 18Z, 55 kt 09/18 18Z 09/17 2317Z TRMM 40 432 2004 Lisa 09/20 06Z, 30 kt 09/21 06Z 09/20 0818Z WindSat 30 163 2006 Florence 09/09 18Z, 50 kt 09/10 18Z 09/09 2001Z TRMM 30 314 2006 Gordon 09/13 06Z, 70 kt 09/14 06Z 09/13 1005Z WindSat, 35 21
RI Cases With a Ring Between t � 5 h and t + 1 h (t is the RI Initial Time) and SHIPS_RII_30 kt < 5% (2 Misses)1 2005 Dennis (2) 07/09 12Z, 80 kt 07/10 12Z 07/09 1202Z WindSat 40 32 2005 Emily (2) 07/15 18Z, 95 kt 07/16 18Z 07/15 1801Z AMSR-E 40 3
Non-RI Cases With a Ring and SHIPS_RII_30 kt < 5% (20 Correct Rejections)1 2003 Ana 04/22 00Z, 50 kt 04/23 00Z 04/21 2338Z TMI �10 32 2003 Danny 07/18 06Z, 55 kt 07/19 06Z 07/18 0558Z TRMM 10 33 2003 Juan 09/26 18Z, 70 kt 09/27 18Z 09/26 1639Z TRMM 20 34 2003 Kate 10/01 18Z, 65 kt 10/02 18Z 10/01 1659Z TRMM 15 35 2004 Alex (2) 08/04 06Z, 80 kt 08/05 06Z 08/04 0316Z TRMM 25 36 2004 Lisa (1) 09/21 06Z, 60 kt 09/22 06Z 09/21 0401Z AMSR-E �10 37 2004 Lisa (2) 10/02 00Z, 60 kt 10/03 00Z 10/01 2008Z TRMM �10 38 2005 Irene (1) 08/12 00Z, 45 kt 08/13 00Z 08/11 2201Z WindSat 15 39 2005 Irene (2) 08/15 12Z, 75 kt 08/16 12Z 08/15 0720Z TRMM 10 310 2005 Nate 09/07 18Z, 70 kt 09/08 18Z 09/07 1540Z TRMM 5 311 2005 Ophelia(1) 09/10 18Z, 70 kt 09/11 18Z 09/10 1428Z TRMM �5 312 2005 Ophelia(2) 09/12 18Z, 60 kt 09/13 18Z 09/12 1730Z TRMM 0 313 2005 Vince 10/09 00Z, 45 kt 10/10 00Z 10/08 2133Z TRMM 15 314 2005 Epsilon(1) 12/03 00Z, 65 kt 12/04 00Z 12/02 1942Z TRMM 0 315 2005 Epsilon(2) 12/04 00Z, 65 kt 12/05 00Z 12/03 1847Z TRMM 5 316 2005 Delta 11/24 00Z, 55 kt 11/24 00Z 11/23 2131Z TRMM 5 317 2005 Zeta 12/30 12Z, 45 kt 12/31 12Z 12/30 0807Z WindSat 5 318 2006 Debby 08/23 06Z, 40 kt 08/24 06Z 08/23 0125Z TRMM 5 319 2006 Gordon(2) 09/17 18Z, 70 kt 09/18 18Z 09/17 1736Z TRMM 15 320 2006 Isaac 09/28 12Z, 40 kt 09/29 12Z 09/28 1040Z TRMM 5 3
Non-RI Cases With a Ring and SHIPS_RII_30 kt ≥ 5% (2 False Alarms)1 2004 Ivan (2) 09/07 06Z, 95 kt 09/08 06Z 09/07 0528Z AMSR-E 25 162 2005 Maria 09/05 00Z, 75 kt 09/06 00Z 09/04 2007Z TRMM 25 23
Table 3. Probability of RI for 2003–2007 Atlantic TCs Using the Ring, SHIPS RII, and Ring+SHIPS RII Criteria for the 30-ktRI Threshold
Climatological Mean Ring SHIPS RII ≥ 20% Ring+SHIPS RII ≥ 5%
# of total forecasts 778 45 163 23# of correct forecasted cases 71 17 55 17Probability of RI 9% 38% 34% 74%POD 100% 24% 77% 24%FAR (=1 � Probability of RI) 91% 62% 66% 26%
KIEPER AND JIANG: PREDICTING TC RI USING THE 37 GHz RING L13804L13804
4 of 7
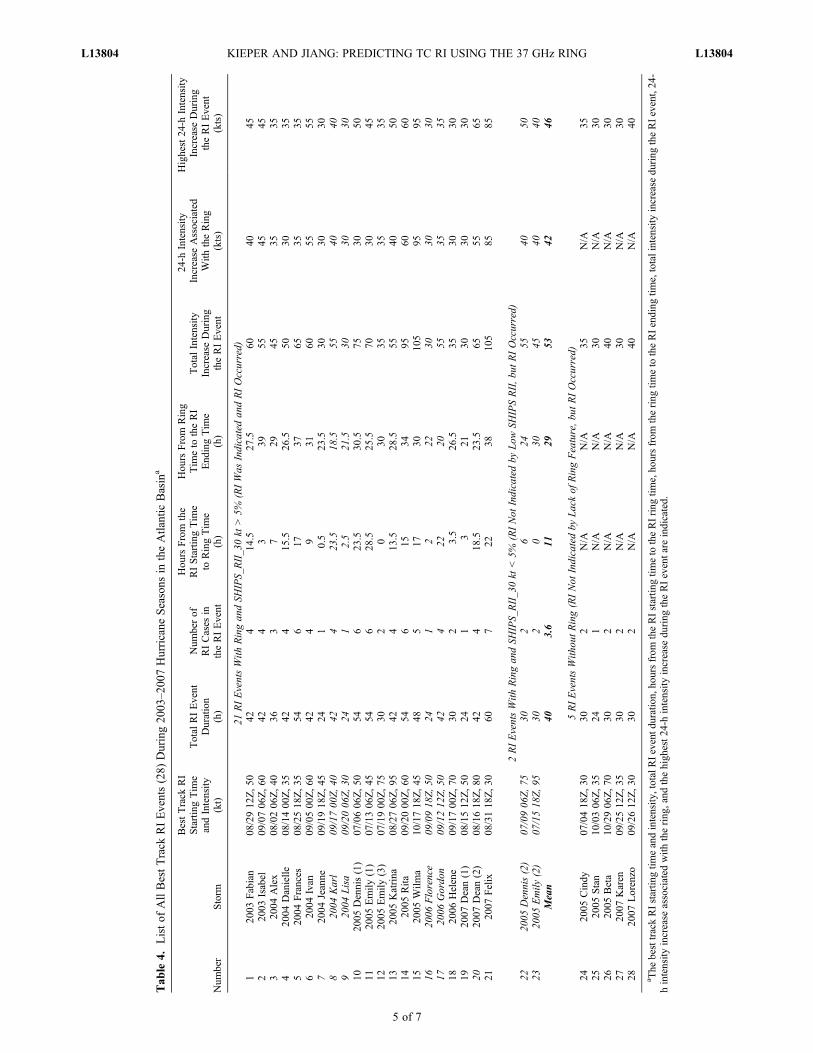
Tab
le4.
Listof
AllBestTrack
RIEvents(28)
During20
03–2
007Hurricane
Seasons
intheAtlantic
Basin
a
Num
ber
Storm
BestTrack
RI
StartingTim
eandIntensity
(kt)
Total
RIEvent
Duration
(h)
Num
berof
RICases
intheRIEvent
Hou
rsFrom
the
RIStartingTim
eto
RingTim
e(h)
Hou
rsFrom
Ring
Tim
eto
theRI
End
ingTim
e(h)
Total
Intensity
Increase
During
theRIEvent
24-h
Intensity
Increase
Associated
With
theRing
(kts)
Highest24
-hIntensity
Increase
During
theRIEvent
(kts)
21RIEventsWith
Ringan
dSH
IPS_
RII_3
0kt
>5%
(RIWas
Indicatedan
dRIOccurred)
120
03Fabian
08/2912
Z,50
424
14.5
27.5
6040
452
2003
Isabel
09/0706
Z,60
424
339
5545
453
2004
Alex
08/0206
Z,40
363
729
4535
354
2004
Danielle
08/1400
Z,35
424
15.5
26.5
5030
355
2004
Frances
08/2518
Z,35
546
1737
6535
356
2004
Ivan
09/0500
Z,60
424
931
6055
557
2004
Jeanne
09/1918
Z,45
241
0.5
23.5
3030
308
2004
Karl
09/1700
Z,40
424
23.5
18.5
5540
409
2004
Lisa
09/2006
Z,30
241
2.5
21.5
3030
3010
2005
Dennis(1)
07/0606
Z,50
546
23.5
30.5
7530
5011
2005
Emily
(1)
07/1306
Z,45
546
28.5
25.5
7030
4512
2005
Emily
(3)
07/1900
Z,75
302
030
3535
3513
2005
Katrina
08/2706
Z,95
424
13.5
28.5
5540
5014
2005
Rita
09/2000
Z,60
546
1534
9560
6015
2005
Wilm
a10
/1718
Z,45
485
1730
105
9595
1620
06Florence
09/0918
Z,50
241
222
3030
3017
2006
Gordo
n09
/1212
Z,50
424
2220
5535
3518
2006
Helene
09/1700
Z,70
302
�3.5
26.5
3530
3019
2007
Dean(1)
08/1512
Z,50
241
�321
3030
3020
2007
Dean(2)
08/1618
Z,80
424
18.5
23.5
6555
6521
2007
Felix
08/3118
Z,30
607
2238
105
8585
2RIEventsWith
Ringan
dSH
IPS_
RII_3
0kt
<5%
(RINot
Indicatedby
Low
SHIPSRII,bu
tRIOccurred)
2220
05Dennis(2)
07/0906
Z,75
302
624
5540
5023
2005
Emily
(2)
07/1518
Z,95
302
030
4540
40Mean
403.6
1129
5342
46
5RIEventsWith
outRing(RINot
Indicatedby
Lackof
RingFeature,bu
tRIOccurred)
2420
05Cindy
07/0418
Z,30
302
N/A
N/A
35N/A
3525
2005
Stan
10/0306
Z,35
241
N/A
N/A
30N/A
3026
2005
Beta
10/2906
Z,70
302
N/A
N/A
40N/A
3027
2007
Karen
09/2512
Z,35
302
N/A
N/A
30N/A
3028
2007
Lorenzo
09/2612
Z,30
302
N/A
N/A
40N/A
40
a The
besttrackRIstartin
gtim
eandintensity
,totalRIeventd
uration,
hoursfrom
theRIstartin
gtim
eto
theRIring
time,ho
ursfrom
thering
timeto
theRIending
time,totalintensity
increase
during
theRIevent,24
-hintensity
increase
associated
with
thering
,and
thehigh
est2
4-hintensity
increase
during
theRIeventare
indicated.
KIEPER AND JIANG: PREDICTING TC RI USING THE 37 GHz RING L13804L13804
5 of 7
compromises. First, the method usually does not detect theonset of the RI event, instead identifying one 24-hour periodin the middle of the RI event. As seen in the fourth column ofTable 4 (hours from the RI starting time to ring time), only3 of the 21 captured RI events show that the ring appeared onor before the RI starting time. On average, the total RI eventduration is 40 hours for the 23 RI events with rings. The ringappears 11 hours after the onset of RI on average. Second,due to microwave latency, lack of timely microwave passesover the center of the TC, lack of a higher-resolution passover a TC with a small center, or a delayed onset of the ringfeature associated with a moderately sheared environment,there are some late cases in which the period from the ringtime to the RI ending time is less than 24 hours. There are8 out of the 23 ring cases with hours from the ring time to theRI ending time less than 24 hours. Third, the method fore-casts once for each RI event. As seen in the third column ofTable 4, the number of overlapping RI cases (note that eachcase is one 24-h period of RI starting at 6 hourly synoptictimes) in each RI event is usually greater than one. Onaverage, the number is 3.6. Therefore, the method will missabout 72% of RI cases if evaluating it based on RI casesinstead of RI events. This is reflected in the POD of 24%in Table 3 based on RI cases.[15] Advantages that makes a strong argument for using
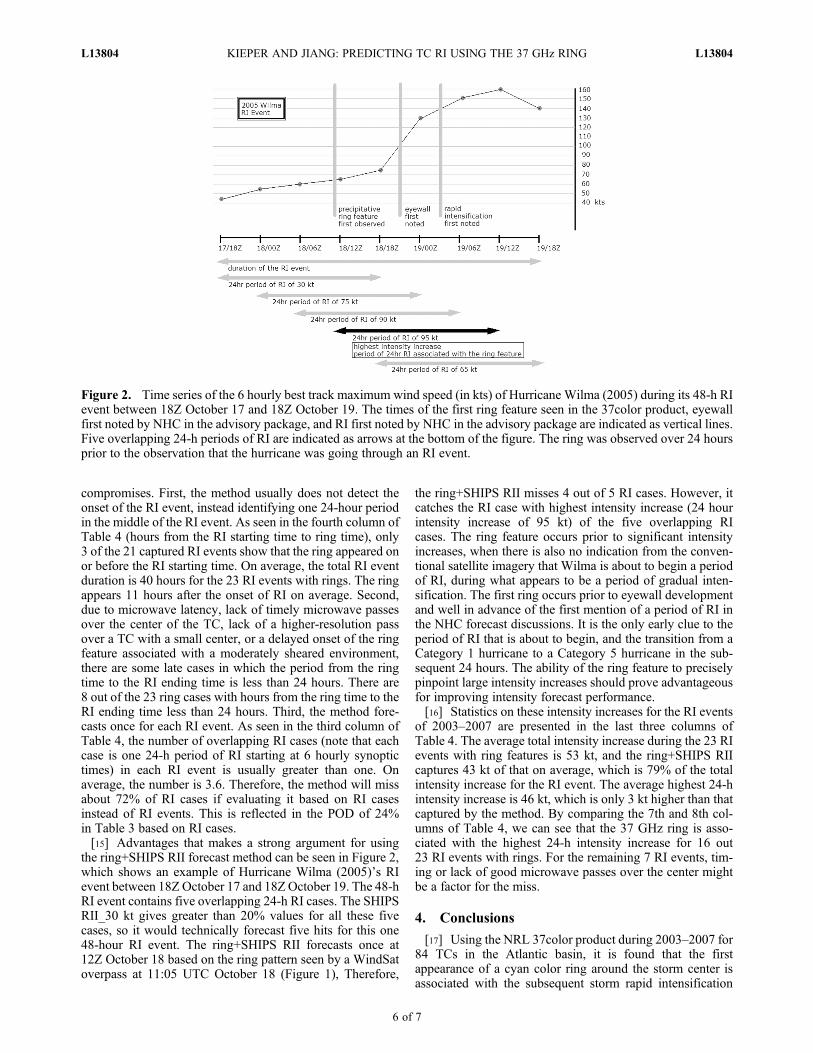
the ring+SHIPS RII forecast method can be seen in Figure 2,which shows an example of Hurricane Wilma (2005)’s RIevent between 18Z October 17 and 18ZOctober 19. The 48-hRI event contains five overlapping 24-h RI cases. The SHIPSRII_30 kt gives greater than 20% values for all these fivecases, so it would technically forecast five hits for this one48-hour RI event. The ring+SHIPS RII forecasts once at12Z October 18 based on the ring pattern seen by a WindSatoverpass at 11:05 UTC October 18 (Figure 1), Therefore,
the ring+SHIPS RII misses 4 out of 5 RI cases. However, itcatches the RI case with highest intensity increase (24 hourintensity increase of 95 kt) of the five overlapping RIcases. The ring feature occurs prior to significant intensityincreases, when there is also no indication from the conven-tional satellite imagery that Wilma is about to begin a periodof RI, during what appears to be a period of gradual inten-sification. The first ring occurs prior to eyewall developmentand well in advance of the first mention of a period of RI inthe NHC forecast discussions. It is the only early clue to theperiod of RI that is about to begin, and the transition from aCategory 1 hurricane to a Category 5 hurricane in the sub-sequent 24 hours. The ability of the ring feature to preciselypinpoint large intensity increases should prove advantageousfor improving intensity forecast performance.[16] Statistics on these intensity increases for the RI events
of 2003–2007 are presented in the last three columns ofTable 4. The average total intensity increase during the 23 RIevents with ring features is 53 kt, and the ring+SHIPS RIIcaptures 43 kt of that on average, which is 79% of the totalintensity increase for the RI event. The average highest 24-hintensity increase is 46 kt, which is only 3 kt higher than thatcaptured by the method. By comparing the 7th and 8th col-umns of Table 4, we can see that the 37 GHz ring is asso-ciated with the highest 24-h intensity increase for 16 out23 RI events with rings. For the remaining 7 RI events, tim-ing or lack of good microwave passes over the center mightbe a factor for the miss.
4. Conclusions
[17] Using the NRL 37color product during 2003–2007 for84 TCs in the Atlantic basin, it is found that the firstappearance of a cyan color ring around the storm center isassociated with the subsequent storm rapid intensification
Figure 2. Time series of the 6 hourly best track maximum wind speed (in kts) of Hurricane Wilma (2005) during its 48-h RIevent between 18Z October 17 and 18Z October 19. The times of the first ring feature seen in the 37color product, eyewallfirst noted by NHC in the advisory package, and RI first noted by NHC in the advisory package are indicated as vertical lines.Five overlapping 24-h periods of RI are indicated as arrows at the bottom of the figure. The ring was observed over 24 hoursprior to the observation that the hurricane was going through an RI event.
KIEPER AND JIANG: PREDICTING TC RI USING THE 37 GHz RING L13804L13804
6 of 7
when environmental conditions are favorable for develop-ment. A simple subjective technique for predicting RI in thenext 24 hours is proposed using both the 37 GHz ring patternand the SHIPS RII for TCs with intensity ≤100 kt that arecurrently over water and are anticipated to remain over waterfor the next 24 hours. For the 84 TCs used in this study, thisring+SHIPS RI forecast method produces a probability ofRI of 74%, which is about a factor of two higher than thatfor either of the ring or SHIPS RII. This indicates that the37 GHz ring RII and SHIPS RII are independent predictors.Both the POD and FAR for the combined ring+SHIPS RIIare lower than those for SHIPS RII alone (POD, 24% versus77%, and FAR, 26% versus 66%) when treating every 6-hrsynoptic time as a separate case.[18] Because the method was initially developed for RI
event-based forecasts, a verification based on 2003–2007Atlantic RI events is performed. The method captures 21 outof these 28 events, producing a POD of 75% and a FAR ofonly 9%. This extremely high performance comes with threecompromises: 1) the method usually does not detect the onsetof the RI event, instead identifying one 24-hour period in themiddle of the RI event; 2) due to microwave latency, lack oftimely microwave passes over the center of the TC, lack of ahigher-resolution pass over a TC with a small center, or adelayed onset of the ring feature associated with a moderatelysheared environment, there are some late cases in which theperiod from the ring time to the RI ending time is less than24 hours; 3) the method forecasts once for each RI event,which means that typically half to three quarters of over-lapping 24-h RI cases will be missed if evaluating RI basedon 24-hour RI cases instead of RI events. Major advantagesof using the 37 GHz ring pattern to forecast an RI event are:1) NHC forecasters usually couch rapid intensification interms of an RI event in the forecast discussion of the advisorypackage, even though quantitative intensity increases areforecast; 2) the ring precedes observations that an RI event isin progress by at least 24 hours, well before any significantintensity increases, and before the TC appears to be inten-sifying on conventional Infrared satellite imagery; 3) thisforecast method is often found to be associated with thehighest intensity increase of the overlapping RI cases asso-ciated with the RI event; 4) the ring feature is often a hallmarkof intensification to major hurricane; and 5) the ability ofthe forecast method to pinpoint large intensity increasesshould benefit the performance of intensity forecasting,which has consistently lagged behind track forecast perfor-mance improvements. Future study will focus on automatingthe ring identifying procedure in order to transfer the forecastmethod from subjective to objective. Study is also under-way to analyze what is in the cyan ring using the three-dimensional observations of the TRMM Precipitation Radar.
[19] Acknowledgments. The authors acknowledge the Naval ResearchLaboratory’s (NRL) Marine Meteorology Division for maintaining the NRLTC satellite webpage. Huge thanks go to John Kaplan for providing SHIPSRII data. Thanks to Jack Beven, John Knaff, James Franklin, Frank Marks,John Molinari, Mike Montgomery, Ed Zipser, Dave Roberts, Eric Blakeand Todd Kimberlain for suggestions, comments, support, and encourage-ment for this work. The authors also would like to give acknowledgmentsto John Kaplan and another anonymous reviewer, whose comments helpedimprove the manuscript substantially. Support for this study is provided bythe NOAA Joint Hurricane Testbed (JHT) grant (NA11OAR4310193) andNASAHurricane Science Research Program (HSRP) grant (NNX10AG34G).The first author received support from the Florida International UniversityPresidential Fellowship, and the second author received support from NASANew Investigator Program (NIP) award (NNX10AG55G).
[20] The Editor thanks the two anonymous reviewers for assisting in theevaluation of this paper.
ReferencesBraun, S. A., M. T. Montgomery, and Z. Pu (2006), High-resolution simu-
lation of Hurricane Bonnie (1998). Part I: The organization of eyewallvertical motion, J. Atmos. Sci., 63, 19–42, doi:10.1175/JAS3598.1.
Cecil, D., E. J. Zipser, and S. W. Nesbitt (2002), Reflectivity, ice scattering,and lightning characteristics of hurricane eyewalls and rainbands. Part I:Quantitative description,Mon. Weather Rev., 130, 769–784, doi:10.1175/1520-0493(2002)130<0769:RISALC>2.0.CO;2.
Hawkins, J. D., and C. Velden (2011), Supporting meteorological fieldexperiment missions and post-mission analysis with satellite digital dataand products, Bull. Am. Meteorol. Soc., 92, 1009–1022, doi:10.1175/2011BAMS3138.1.
Hawkins, J. D., T. F. Lee, F. J. Turk, C. Sampson, J. Kent, and K. Richardson(2001), Real-time Internet distribution of satellite products for tropicalcyclone reconnaissance, Bull. Am. Meteorol. Soc., 82, 567–578,doi:10.1175/1520-0477(2001)082<0567:RIDOSP>2.3.CO;2.
Hendricks, E. A., M. S. Peng, B. Fu, and T. Li (2010), Quantifying environ-mental control on tropical cyclone intensity change, Mon. Weather Rev.,138, 3243–3271, doi:10.1175/2010MWR3185.1.
Jiang, H. (2012), The relationship between tropical cyclone rapid inten-sification and the strength of its convective precipitation features, Mon.Weather Rev., 140, 1164–1176, doi:10.1175/MWR-D-11-00134.1.
Kaplan, J., and M. DeMaria (2003), Large-scale characteristics of rapidlyintensifying tropical cyclones in the North Atlantic basin, WeatherForecast., 18, 1093–1108, doi:10.1175/1520-0434(2003)018<1093:LCORIT>2.0.CO;2.
Kaplan, J., M. DeMaria, and J. A. Knaff (2010), A revised tropical cyclonerapid intensification index for the Atlantic and eastern North Pacific basins,Weather Forecast., 25, 220–241, doi:10.1175/2009WAF2222280.1.
Lee, T. F., F. J. Turk, J. Hawkins, and K. Richardson (2002), Interpretationof TRMM TMI images of tropical cyclones, Earth Interact., 6, 1–17,doi:10.1175/1087-3562(2002)006<0001:IOTTIO>2.0.CO;2.
Malkus, J. S., C. Ronne, and M. Chaffee (1961), Cloud patterns inHurricane Daisy, 1958, Tellus, Ser. A, 13, 8–30, doi:10.1111/j.2153-3490.1961.tb00062.x.
Merrill, R. T. (1988), Environmental influences on hurricane intensifica-tion, J. Atmos. Sci., 45, 1678–1687, doi:10.1175/1520-0469(1988)045<1678:EIOHI>2.0.CO;2.
Molinari, J., and D. Vollaro (2010), Rapid intensification of a shearedtropical storm, Mon. Weather Rev., 138, 3869–3885, doi:10.1175/2010MWR3378.1.
Montgomery, M. T., M. E. Nicholls, T. A. Cram, and A. B. Saunders(2006), A vortical hot tower route to tropical cyclogenesis, J. Atmos.Sci., 63, 355–386, doi:10.1175/JAS3604.1.
Nguyen, C. M., M. J. Reeder, N. E. Davidson, R. K. Smith, and M. T.Montgomery (2011), Inner-core vacillation cycles during the intensi-fication of Hurricane Katrina, Q. J. R. Meteorol. Soc., 137, 829–844,doi:10.1002/qj.823.
Nolan, D. S., and L. D. Grasso (2003), Nonhydrostatic, three-dimensionalperturbations to balanced, hurricane-like vorticies. Part II: Symmetricresponse and nonlinear simulations, J. Atmos. Sci., 60, 2717–2745,doi:10.1175/1520-0469(2003)060<2717:NTPTBH>2.0.CO;2.
Rappaport, E. N., et al. (2009), Advances and challenges at the NationalHurricane Center, Weather Forecast., 24, 395–419, doi:10.1175/2008WAF2222128.1.
Shapiro, L. J., and H. E. Willoughby (1982), The response of balancedhurricanes to local sources of heat and momentum, J. Atmos. Sci., 39,378–394, doi:10.1175/1520-0469(1982)039<0378:TROBHT>2.0.CO;2.
Simpson, J., J. B. Halverson, B. S. Ferrier, W. A. Peterson, R. H. Simpson,R. Blakeslee, and S. L. Durden (1998), On the role of “hot towers”in tropical cyclone formation, Meteorol. Atmos. Phys., 67, 15–35,doi:10.1007/BF01277500.
Turk, F. J., S. DiMichele, and J. D. Hawkins (2006), Observations of trop-ical cyclone structure from WindSat, IEEE Trans. Geosci. Remote Sens.,44(3), 645–655, doi:10.1109/TGRS.2006.869926.
Weng, F., and N. C. Grody (1994), Retrieval of cloud liquid waterusing the special sensor microwave imager (SSM/I), J. Geophys.Res., 99(D12), 25,535–25,551.
Willoughby, H. E. (1990), Temporal changes of the primary circulationin tropical cyclones, J. Atmos. Sci., 47, 242–264, doi:10.1175/1520-0469(1990)047<0242:TCOTPC>2.0.CO;2.
Willoughby, H. E., J. A. Clos, and M. B. Shoreibah (1982), Concentric eye-walls, secondary wind maxima, and the development of the hurricanevortex, J. Atmos. Sci., 39, 395–411, doi:10.1175/1520-0469(1982)039<0395:CEWSWM>2.0.CO;2.
KIEPER AND JIANG: PREDICTING TC RI USING THE 37 GHz RING L13804L13804
7 of 7