predicting the weather section 4 pages 99-105
TRANSCRIPT

Predicting the Weather
Section 4
Pages 99-105https://www.youtube.com/watch?v=ZvzLGlaCoRM

Who is the weather forecast important to?
• Farmers• Pilots• People with plans… headed to the park,
going to watch the Tigers, have a softball game
• People that work outside• It is also the topic of many conversations

Weather Forecasting
Based on observations, what predictions can you make about the weather?
• You could read a barometer. If the air pressure is falling, rain or snow could be on its way.
• Read the clouds. Cumulonimbus clouds may bring a thunderstorm. Cirrus clouds high in the sky mean low pressure area may be approaching.

Meteorologists
Meteorologists are scientists who study the causes of weather and try to predict it.
http://www.clickondetroit.com/news/Get-to-know-Ben-Bailey/24390088

Sources of information
Where do meteorologists get weather information?
• Local weather observers (like you!)
• Instruments carried by balloons
• Satellites
• Weather stations around the world
• Radar (tracks precipitation)

Weather TechnologyMeteorologists can make long-range
predictions because of changes in technology.
Changes have occurred in two areas:
1. Gathering weather data(weather balloons, satellites)
2. Using computers

Computer ForecastsHow are computers used to help
forecast weather? • Instruments gather thousands of bits of data • Computers process the information. • Computer makes calculations
for forecasts. • Each forecast builds on
previous forecasts.

El Nino• Some long-term weather patterns may be
caused by changes in ocean currents and global winds.
• El Nino, a warm-water event, occurs in the tropical Pacific Ocean once every 2-7 years.
• Warm water replaces cold water. • http://video.nationalgeographic.com/video/el-nino

Weather Service Maps
• Data from more than 300 local weather stations all over the country are assembled into weather maps at the National Weather Service.

Weather Service Maps
A typical reporting weather station provides you with the following data:
1. temperature
2. precipitation
3. wind speed and direction
4. atmospheric pressure
5. cloud cover
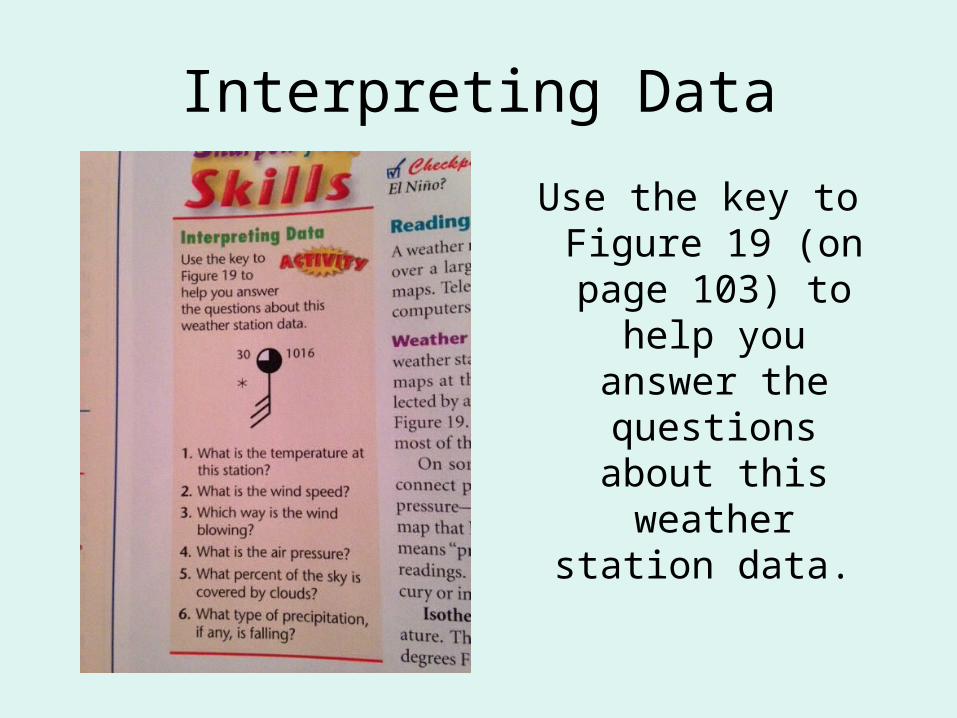
Interpreting Data
Use the key to Figure 19 (on page 103) to
help you answer the questions
about this weather station
data.

Isobars • Isobars are (curvy) lines joining places on
the map that have the same air pressure.
• Iso means “equal” and bar means “pressure”.
• Air pressure readings can be given in inches of mercury, in millibars, or both.

Isotherms
• Isotherms are (curvy) lines joining places that have the same temperature.
• The isotherm may be labeled with the temperature in degrees Fahrenheit, degrees Celsius, or both.

Newspaper Weather Maps• Maps in newspapers are simplified
versions of the maps produced by the National Weather Service.
• Standard symbols on weather maps show:– fronts– temperature– pressure– types of precipitation
The Butterfly Effect
• A forecast for the weather six days from now is based on forecasts for all the days between now and then.
• A small change in the weather today can mean a larger change in the weather a week later.
• Why would you call this the butterfly effect?
• http://www.cbsnews.com/videos/chris-rosati-proves-the-butterfly-effect/

Words Worth Knowing (ISN #29)
• Meteorologist• El Nino• Isobars• Isotherms