predicting the hydrological impacts of bushfire and
TRANSCRIPT

Water for a Healthy Country
Predicting the hydrological impacts of bushfire and
climate change in forested catchments of the River
Murray Uplands: A review
Marcar NE, Benyon RG, Polglase PJ, Paul KI,
Theiveyanathan S and Zhang L
September 2006

Predicting the hydrological impacts of bushfire and
climate change in forested catchments of the River
Murray Uplands: A review
Marcar NE, Benyon RG, Polglase PJ, Paul KI, Theiveyanathan S and Zhang L

iii
Water for a Healthy Country is one of six National Research Flagships established by CSIRO in 2003 as part of the National Research Flagship Initiative. Flagships are partnerships of leading Australian scientists, research institutions, commercial companies and selected international partners. Their scale, long time-frames and clear focus on delivery and adoption of research outputs are designed to maximise their impact in key areas of economic and community need. Flagships address six major national challenges; health, energy, light metals, oceans, food and water.
The Water for a Healthy Country Flagship is a research partnership between CSIRO, state and Australian governments, private and public industry and other research providers. The Flagship aims to achieve a tenfold increase in the economic, social and environmental benefits from water by 2025.
© CSIRO 2006 All rights reserved. This work is copyright. Apart from any use as permitted under the Copyright Act 1968, no part may be reproduced by any process without prior written permission from the Commonwealth.
Citation: Marcar NE, Benyon RG, Polglase PJ, Paul KI, Theiveyanathan S and Zhang L 2006. Predicting the hydrological impacts of bushfire and climate change in forested catchments of the River Murray Uplands: A review. CSIRO: Water for a Healthy Country National Research Flagship
DISCLAIMER You accept all risks and responsibility for losses, damages, costs and other consequences resulting directly or indirectly from using this publication and any information or material available from it.
To the maximum permitted by law, CSIRO excludes all liability to any person arising directly or indirectly from using this publication and any information or material available from it.
For more information about Water for a Healthy Country Flagship visit or the National Research Flagship Initiative at www.csiro.au.

iv
Table of Contents
Executive Summary ...................................................................................................v 1. Introduction ............................................................................................................1 2. The Hydrological Importance of Forested Catchments .....................................2 3. The Water Balance in Forested Catchments .......................................................4 4. Fire Impacts on Long-Term Stream Flow ............................................................6
4.1 Fire ecology of eucalypt-dominant forests....................................................................... 7 4.2 Hydrological responses to bushfire ............................................................................... 10 4.3 Effects of climate variability and change on bushfires and hydrological responses ..... 15
5. Effects of Climate Variability and Change on Stream Flow via Changes in Forest Functioning...................................................................................................19
5.1 Projected changes in climate for Murray-Darling Basin ................................................ 19 5.2 Influence of climate on stream flow within catchments ................................................. 22 5.3 Climate effects on catchment streamflow via its effect on vegetation........................... 23
5.3.1 Important processes in the water balance under forests ....................................... 23 5.3.2 Impacts of climate change and sensitivity analysis ................................................ 25 5.3.3 Current models ....................................................................................................... 29
6. Modeling Forest Processes and Hydrology ......................................................30 7. Acknowledgements .............................................................................................32 8. References............................................................................................................32

v
Executive Summary There are about 3.5 million ha of forests in the Murray Uplands catchments.
From these forests, an estimated 32,000 GL of water is evaporated and transpired each year and 8,000 GL is released as stream flow. Therefore, a long-term change of 5% in evapotranspiration (ET) would be manifested as a 20% change in mean annual stream flow.
Considerable knowledge is available on the impact of forest disturbance on water yield of several forested catchments in south-eastern Australia and on the impact of bushfire on ecological changes post-fire: e.g. is the forest type predominantly resistant (sprouters) or resilient (seeders) to fire? However, reports on the ecology in the drier, open forests of south-eastern Australia deal with empirical understanding of ecological processes rather than providing a quantitative, predictive framework for how the fire regime is likely to impact on leaf biomass recovery and therefore ET. Hydrology responses depend largely on these ecological responses of the vegetation to fire.
Under the current mix of age classes and fire regimes, impacts of fire on stream flow are likely to be relatively small for the Murray but may have important local impacts for any given catchment if it is extensively burnt1. The potential impacts of worst-case fire scenarios under current and future fire regimes need to be evaluated. Further work is required to improve our understanding of the ecological and physiological responses of forests to fire and climatic impacts in the Uplands regions and, as far as possible, map the forest cover and contribution to interception, transpiration and evaporation in order to better quantify potential impacts of water flows in the Murray system.
Predictions of the impact of disturbance on catchment water yield (and quality) have been made for several of the Uplands and other forests using different modeling approaches. There have also been a number of modeling studies in regions relevant to Uplands on likely climate responses to increased greenhouse gases. Quantifying the impact of fire intensity and frequency on vegetation is thus vital for understanding how climate change will impact on water yields from the Murray Uplands catchments. This will aid in determining the likely impact of fires of different intensities on stream flow.
The modeling approaches are available to develop likely scenarios for changes in climate extremes for the Murray Uplands areas, which would then impact on bushfire regime and frequency. However, we need a better mechanistic understanding of direct and indirect impacts of climate change on ET, and interactions with the biosphere (drought, fire, pests and diseases). This will require work on ecological and physiological responses, and incorporation into better validated models of forest ET.
1 SKM estimates of long term reduction in stream flow after the 2003 fires are equivalent to the effect of 50,000 to 100,000 ha of new plantations in 700 mm rainfall zone. If there is a repeat of the 2003 fires in the next 10 or 20 years and larger scale conversion to regrowth, it will be important to determine the impact on water yield.

1
1. Introduction This review examines our understanding of hydrological processes in forested catchments, with particular reference to the Murray Uplands2, and the potential impacts from risks such as climate change and bushfire on Murray stream water flow. We focus on vegetation types of the higher (>1000 mm) rainfall areas where forests are the dominant vegetation type and which contribute significantly more to catchment water yield, per unit of land area, than lower rainfall areas, where agricultural land use dominates (Austin et al. 2005). Stream flow from many of these high rainfall areas is also highly regulated (captured in storages), whereas in the lower rainfall areas, stream flow is mostly unregulated. Our ability to better predict long-term mean annual stream flow is of greatest importance in regulated catchments, while prediction of seasonal variation in stream flow is of higher priority in areas where stream flow is unregulated.
A recent review (Van Dijk et al. 2006) has indicated that the greatest risks to the shared water resources in the Murray-Darling Basin (MDB) come from climate change and farm dams, with afforestation and groundwater pumping predicted to have about half the impact. The impact of bushfires is expected to be relatively small but still significant, particularly in the Murray and Murrumbidgee catchments. The risk from bushfires is rated low because, although the cumulative areas affected by fires may be large over the years, it creates a mosaic of forest ages that vary in their impact on stream flow. However, it may well be that the threat of bushfires to long-term water security within any given catchment is largely dependent upon local conditions such as forest age and rainfall.
This review focuses mostly on the hydrology of native forests, particularly evapotranspiration (water lost as interception, soil evaporation and transpiration; refer to Section 4 below) because:
These occupy a far greater area of the Uplands than do plantations (17 times as much land area),
Native forests are the dominant vegetation in the high rainfall areas and therefore the highest water yielding parts of the region, and
There is greatest potential for long-term variation in evapotranspiration (and hence water yield) from forests in high rainfall areas resulting from climate change, bushfires and forest management activities.
Recent data on the rate of increase in plantation area in the region over the past decade (Parsons et al. 2006) indicate earlier predictions have greatly exaggerated the threat to water yields posed by plantations in the Uplands.
The review provides the background from which to develop a conceptual framework for the next generation of forest growth and evapotranspiration (ET) models for application to this and other regions. We envisage that model development will initially involve: (i) developing species (or forest type) -specific parameter sets to enable these models to be run for common high rainfall eucalypt species; (ii) using existing forest growth and water yield datasets from several experimental catchment studies to test current mechanistic plantation growth models (CABALA and 3PG) for their applicability to high rainfall natural eucalypt forest; (iii) incorporating under-storey into these models. The rationale behind this is that to increase the accuracy of predictions of the impacts of climate change on water yield from forested catchments, we require a better understanding of the net effect on ET of various plant physiological processes, influenced by climate, growth and bushfire
2 As defined geographically in the River Murray project documentation

2
regimes. To achieve this requires well-tested mechanistic models incorporating realistic representations of plant physiological responses to climate, elevated CO2 and ecological responses to fire.
The factors influencing ET are reviewed, especially for the eucalypt-dominated native forest communities and plantations found in the Murray Uplands catchments, and how these are likely to be altered by climate change, both directly and indirectly. The review discusses current understanding of the interactions between climate change, vegetation growth, and fire regime, and their impacts on hydrology. We evaluate our current ability to model changes in vegetation growth and structure resulting from climate change and bushfires and link these to hydrological responses. In addition, we deal with the likely impacts of climate change on suitability of growing areas for key plantation and farm forestry species.
The purpose of the review is to provide a greater understanding of the role of forests in catchment water balances and factors controlling ET and water yield, ultimately to enable:
Better prediction of plausible scenarios of future water security,
Identification of where further research is required, and
Development of adaptive strategies.
2. The Hydrological Importance of Forested Catchments
The catchments of the Murray Uplands contain a variety of natural forests (with overstorey mostly dominated by eucalypts) and plantations (the majority being P. radiata (radiata pine)). The natural eucalypt forests occur in the higher rainfall, more elevated eastern portion (Figure 1) and range from dry sclerophyll woodlands and open forest to tall, closed, wet sclerophyll eucalypt-dominant forest and sub-alpine snow gum forests and woodlands.
Figure 1. Land uses in the Murray Uplands catchments3
3 from Murray Uplands project proposal for Water for Healthy Country Flagship (produced by Trevor Dowling, CSIRO)

3
Keenan et al. (2004) summarised information on land cover by broad vegetation type and rainfall zone in various regions of Australia including the Murray Uplands catchments (Goulburn-Loddon, Mid-Murray, Upper Murray and Murrumbidgee). Forests occupy a substantial proportion of the highest rainfall areas in the Murray Uplands (Table 1). Of the 7 million ha of the Murray Uplands with >600 mm mean annual precipitation (MAP), natural forests occupy 3.3 million ha (about 47% of the area), and forestry plantations a further 0.2 million ha (3% of the area). Of the higher rainfall parts of the Murray Uplands (MAP>1000 mm), natural forests occupy 83% with plantations 5% and in the very high rainfall areas (MAP>1400 mm), natural forests account for 94%, with <0.2 % forestry plantations.
Table 1. Land cover by rainfall zone for the Murray Catchments as at the end of 2000. Information compiled from Appendix A.1.3 (Land use in Murray Valley) of Keenan et al. (2004).
Rainfall zone (mm year-1)
Total area
(‘000 ha)
% native forest % plantations % non-forest
600-800 2,970 20 <1 80
800-1000 1,665 45 4 51
1000-1200 1,012 76 7 17
1200-1400 749 88 6 6
>1400 567 94 0 6
This review focuses mostly on the hydrology of native forests because:
These occupy a far greater area of the Uplands than do plantations (17 times as much land area),
Native forests are the dominant vegetation in the high rainfall and therefore the highest water yielding parts of the region, and
There is greatest potential for long-term variation in ET (and hence water yield) from forests in high rainfall areas resulting from climate change, bushfires and forest management activities.
While there is also a need to consider the potential hydrological impacts of plantation expansion in the various rainfall zones of the region, we believe the risk to catchment yield posed by plantation expansion in the Murray Uplands region has in recent years been greatly exaggerated, due to adoption of unrealistic assumptions about the likely rate of expansion. Although the National plantation policy, the 2020 Vision, aims for an expansion in Australia’s total plantation area from about 1 million ha in 1994 to about 3 million ha in 2020, recent data on rates of plantation development since 1994 indicate that very little of this expansion is occurring in the Murray Uplands. Between 1994 and 2005, Australia’s total plantation area grew by about 70%, but in the Murray Uplands it has remained virtually unchanged (Parsons et al. 2006) indicating that even under government policies favourable for plantation development, other factors (probably economic ones) are limiting plantation development in the region. The recent data on plantation areas across Australia indicate that between 2000 and 2005, the plantation area in the Murray Uplands increased by only about 1% and that some of this apparent increase was due to accounting for small woodlots on farms which had not previously been included (Parsons et al. 2006). Unless economic conditions change in favour of plantations, or

4
plantation owners can begin to obtain substantial economic returns from environmental benefits provided by plantations (e.g. carbon or salinity credits), it seems unlikely there will be substantial plantation expansion in the Murray Uplands. If the 2020 Vision was going to result in a trebling in the plantation area in the region between 1994 and 2020, this expansion should already be occurring and there should have been 160,000 ha of new plantations established between 1994 and 2005 compared with the actual increase of only a few thousand ha.
3. The Water Balance in Forested Catchments
Stream flow from a catchment is largely a function of rainfall, ET and changes in soil water storage within the catchment. For some catchments, recharge to deep aquifers is also a significant factor. For the purpose of this review, ET is defined as the total of soil evaporation (water evaporating from surface soil, humus and leaf litter layers), transpiration (water taken up by plants from the root zone and evaporated through their leaves) and rainfall interception (evaporation losses during and after rain from the wet exterior of leaf surfaces that intercept rainfall). Water going into or out of an area of land or catchment can be accounted for by the water balance equation. For the soil under an area of land such as a field or a forest the water balance is described by Equation 1 (Silberstein et al. 2002):
RO + L = P- (I + E + T + ∆S) Equation (1)
Where RO = surface runoff, L = leakage below the root zone, P = rainfall, I = rainfall interception by plant canopies, E = evaporation from soil and surface water bodies, T = transpiration by plants, ∆S = change in soil moisture storage.
In the most simple, long-term catchment water balance, ∆S can be assumed equal to zero over the long-term and mean annual stream flow, which includes groundwater recharge, leaving a catchment is equal to the difference between long-term mean annual rainfall and long-term mean annual ET. In the shorter term, the quantity of water stored in the soil will change also, so that over periods of a few years to a year or less, water leaving the catchment does not necessarily equate to the difference between rainfall and ET.
Of these variables, rainfall and ET are the most important in determining variation in long-term stream flow, but land management practices only have the ability to modify ET (refer Figure 2). The relative importance of the different components of this water balance will be affected by forest type, rainfall amount and the type and amount of forest litter. This is discussed in more detail later in this review.
ET is by far the largest component of the total water balance (Figure 2). Based on data from more than 250 catchments globally, classified as either grassed (herbaceous plants), mixed (a mixture of herbaceous plants and trees) or forest (>70% canopy cover of trees), Zhang et al. (1999) developed a simple equation to relate ET to a range of factors (Equation 2):
P
E
P
P
Ew
P
Ew
ET
o
o
o
).1
1(
Equation (2)
Where ET = annual ET, w = a parameter that may, among other factors, be related to the amount of plant available water in soil, Eo = the potential or maximum amount of ET under non-water limited conditions and P = annual rainfall. If Eo is not known it

5
can be replaced by a constant Ez of 1410 for forest and 1100 for grass (Zhang et al. 1999).
For a catchment with partial forest cover, total ET can be calculated as:
ET f ET f ETf h 1 Equation (3)
Where f = the fractional forest cover, ETf = the annual ET from forests in mm; and ETh = the annual ET from herbaceous plants in mm.
Rainfall (+100)
•Interception (-15)•Transpiration (-50)
Evaporation (-20)
Run-off (-15)
ClimateFireDroughtPests, diseasesManagementForest type, age
Figure 2. Potential water balance of typical forested, higher-rainfall catchment. Run-off here includes deep drainage. Values are percentages of rainfall.
Based on analysis of evapotranspiration measurements from 16 plantation sites in south east South Australia and south west Victoria, Benyon et al. (2005) conclude that for locations which fit the assumptions of the Zhang curves (deep soils, gentle slopes, rainfall the only source of water, annual estimates), the curves also give reasonably accurate predictions of mean annual ET when point-scale estimates are averaged over a number of sites, though this was not the original purpose of the curves. The graphical representation of the resultant curves allow a simple means of estimating likely ET from P for different amounts of evaporative demand. For example, during an average year in a south-eastern Australian Uplands catchment, for mean annual rainfall of 1000 mm, ET from a mature (closed canopy) forest would be around 850 mm (Zhang et al. 1999). Therefore, relatively small changes in ET have a potentially large effect on catchment water yields.
Evapotranspiration is determined by many interacting variables including climate, available soil moisture, and characteristics of the vegetation such as age, density and structural complexity. A striking example of the way ET can vary with the age of a forest comes from forests dominated by Eucalyptus regnans (mountain ash) where mean annual stream flow is known to vary by 50% according to forest age. In this case very young (<5 years) or old (>150 years) forest yielded approximately 1200 mm year-1 mean annual stream flow compared with only 600 mm year-1 from 20-50 year old forest. This relationship between stream flow and forest age (Kuczera 1985, 1987), known as the ‘Kuczera curve’, is the result of variation in ET with forest age (see later section).
Rainfall that is not intercepted by the vegetation or litter, evaporated from the soil surface, or transpired by the vegetation (trees and understorey in the case of forests) becomes either overland flow, sub-surface lateral flow, or base flow via a groundwater flow system and, with the possible exception of water entering a deep

6
aquifer and discharging outside the catchment (Figure 2), eventually becomes stream flow. In drier periods stream flow is made up mostly of base flow or water passing beyond the root zone and entering the stream via a groundwater flow system. In the mountainous catchments of the Murray Uplands, base flow often travels no more than a few km through a ‘local’ groundwater flow system from its source to the stream (Coram et al. 2000). Any changes in rainfall and ET will therefore become evident as changes in stream flow nearby in a relatively short time.
Because natural forests dominate the high rainfall parts of the Uplands catchments, a high proportion of stream flow comes from these forested catchments. Applying the Zhang curves (Equation 2) to predict ET for forest and grassland in each of the rainfall zones in Table 1, total annual stream flow (estimated as rainfall minus ET) is about 16,000 GL, of which about half (8,000 GL) comes from the forested areas. Furthermore, about 32,000 GL of water is evaporated or transpired from these forests every year. Thus in this region a 5% change in ET will be manifested almost immediately as a 20% change in stream flow.
During high rainfall events, overland or near-surface lateral flow can occur and are denoted ‘storm flow’ or ‘quick flow’. The proportion of overland flow to base flow is highly variable and depends on catchment characteristics, soil type and depth, geology, climate, rainfall duration and intensity, and to a lesser degree, forest type and condition, particularly as this influences interception.
Duncan and Langford (1977) reported base flow averaging 74% of total stream flow in 14 small research catchments in high rainfall E. regnans forests in southern Victoria. Despite the similarity of forest type, soil, slope and aspect among catchments, percentage storm flow ranged from 11% to 49% and was largely a function of the proportion of the catchment occupied by relatively flat, wetter, riparian areas around each stream. Based on these observations, in small mountain catchments, storm flow appears to be mainly determined by the proportion of riparian areas close to the stream, whereas base flow is probably more a function of the aquifer characteristics, and net recharge (rainfall minus ET), modified by soil water holding capacity. A relatively more extensive riparian zone will thus lead to a higher proportion of storm flow compared to base flow (Duncan and Langford 1977).
4. Fire Impacts on Long-Term Stream Flow Forest fires can have a large influence on forest age, density, structure and growth rate, all of which can in turn affect ET. Effects on stream flow and ET of overstorey age, structure and density have been well-researched for several eucalypt forest types in high-rainfall catchments (>1200 mm annual), but there are few such studies in eucalypt forests in lower rainfall catchments (Brown et al. 2005). Several studies indicate ET is lower in old growth forest compared to regrowth of the same species (Vertessy et al. 2001, Cornish and Vertessy 2001, Roberts et al. 2001). In the Uplands catchments, fires and timber harvesting over the past two centuries have created a mosaic of forest of different ages. The net effect is that mean annual water yield is probably lower than if all the forests in the Uplands were in an ‘old-growth’ state. The current and future state of the forest (e.g. age, proportion of full canopy cover, leaf area index) needs to be considered in assessing the potential impacts of bushfires on stream flow in forested catchments.
From various studies on factors influencing long-term changes in stream flow and ET from eucalypt forests (Kuczera 1985 and 1987, Haydon et al. 1996, Vertessy et al. 2001, Cornish and Vertessy 2001, Roberts et al. 2001), we can conclude that the effect of fire on ET and stream flow from eucalypt forests is largely a function of the:
Degree of disturbance (proportion of catchment disturbed, intensity of fire),

7
Ecological response to disturbance (whether the overstorey regenerates predominantly by seed or by re-sprouting),
Time since disturbance (years to decades) as it affects density and vigour of forest regrowth, and
Rate of natural thinning and senescing of trees as the forest matures.
Fire is often a vital component in maintaining the long-term health of many native forest types, including those in the Murray Uplands. Climate change is likely to affect fire frequencies and intensities in south eastern Australia by changing weather patterns and the incidence of extreme fire weather days, and by changing vegetation growth rates (and hence ET), fuel loads and fuel moisture content.
4.1 Fire ecology of eucalypt-dominant forests
The impacts of fire on catchment hydrology may be largely determined by the vegetative response of the forest ecosystem to fire disturbance. Quantifying the impact of fire intensity and frequency on vegetation is thus vital for understanding how climate change will impact on water yields from the Uplands catchments. This will aid in determining the likely impact of fires of different intensities on stream flow.
Although the eucalypts (which for the purposes of this discussion include the genus Corymbia) are a diverse group, there have been detailed studies of the fire response and ecology of many species. As a first step in understanding fire impacts on hydrology it is important to differentiate between eucalypts in their strategies to cope with bushfire.
The eucalypts can be broadly separated into two groups according to their response to fire (Gill and Catling 2002):
‘Seeders’ whose species are usually thin-barked, easily killed by fire and which regenerate by seed (Figures 3 and 4), resulting in even-aged stands. These eucalypts might be categorized as being ‘resilient’ to fire (Polglase and Attiwill 1992), and examples of species include E. regnans, E. grandis, E. delegatensis and E. pilularis.
‘Sprouters’ whose species are usually thick-barked (Polglase and Attiwill 1992) and re-sprout by epicormic buds buried in the bark (Figure 5) or from underground lignotubers. These eucalypts might be categorized as being ‘resistant’ to fire. Trees of these species are also killed by fire but usually only of the most extreme intensity, and after which regeneration will also be by seed. They include E. dives, E. radiata, E. cypellocarpa and many others. E. pauciflora (snow gum), which occurs extensively in some of the Murray Uplands catchments between 1400 and 1800 m elevation, is both a sprouter and a seeder. It has thin bark and is killed by fire of moderate intensity, but it re-sprouts from an underground lignotuber and can also produce dense seedling regeneration.

8
Figure 3. Mostly dead mature E. delegatensis trees in north-east Victoria killed by fire in February 2003, with 3 year old regeneration underneath.
Figure 4. Dense, vigorous re-growth among dead E. delegatensis overstorey trees 3 years after wildfire.

9
Figure 5. Eucalypt ‘sprouters’ recovering by epicormic growth 3 years after wildfire in north-east Victoria. Some seedling regeneration is also evident. Eucalypts in the high rainfall (and therefore high water yielding) areas of south-eastern Australia are often ‘seeders’ and as a consequence it is for these ecosystems that we have the most complete information on the effects of fire on forest dynamics and catchment hydrology. Pine plantations also occur in water catchments and sometimes burn, as in the 2003 Canberra fires. We note that, despite some popular perceptions, there is no inherent difference between the adaptive strategies to fire of radiata pine and eucalypts. Radiata pine has evolved on the Californian island of Monterey under fire regimes, is easily killed by fire but re-establishes and so falls under the ’seeder’ (or ‘resilient’ category). However, this species is only grown as a plantation species in Australia and after a fire will usually be replanted at typical plantation densities.
The initial response to fire in eucalypt forests include::
Immediate damage and/or death of large trees. Both the ‘seeders’ and ‘sprouters’ may lose their foliage after fire.
Immediate reduction or elimination of understorey.
Temporary loss of litter cover from the forest floor.
Altered soil properties near the surface.
Permanent loss of some or all of the mature trees.
Germination of new seedlings within 1-2 years, including species of grasses, understorey shrubs and of the dominant eucalypts.
Re-growth of the new forest, either through sprouting from epicormic buds and lignotubers or vigorous new growth from seed (‘wheat field’ regeneration).
10
In the medium to long term, major consequences include:
In seeders, natural thinning of the overstorey as the new stands develop resulting in a progressive reduction in the number of overstorey trees over decades.
A progressive increase in the cover of understorey (often acacias) shortly (2-3 years) after the fire, followed by over-topping and shading out of understorey by the rapidly growing eucalypts.
Variation in fire intensity will affect the extent of damage to the crown, ranging from minimal damage, through scorched leaves to a combusted crown. Gill and Catling (2002) estimate that historically, about 50% of unplanned forest fires were of a low intensity. However average fire intensity is predicted to increase in response to climate change. In south-eastern mainland forests where eucalypts dominate, it is important to estimate damage to trees and woody understorey canopies to gauge the impact on ET. Carey et al. (2003) use the term ‘fire severity’ to measure the impact of fire on vegetation: classifications are based on 4 levels from no damage to complete incineration of leaves. This allows areas burnt to be classified according to the damage sustained and may allow prediction of the rate of biomass recovery over time and hence impact on ET. Quayle et al. (2004) define six fire severity classes for Victoria including four relevant to trees: forest-crown burn (most severe), forest – severe crown burn; forest – moderate crown scorch and forest – light crown scorch. These are then related to forest type and likelihood of occurrence.
We have a good understanding of the fire ecology of the ‘fire resilient’ forest communities (‘seeders’) that inhabit high rainfall areas in water catchments. Our understanding of the impacts of regeneration on catchment hydrology in the ‘fire resistant’ drier forests (‘sprouters’) is less complete.
4.2 Hydrological responses to bushfire
It follows from the above discussion that the impact of bushfires on stream flow depends upon the forest ecosystem response to fire. Most of the information available on this is for the ‘seeder’ ecosystems such as for E. regnans (Kuczera 1987, Watson et al. 2001), E. saligna and E. laevopinea (Cornish and Vertessy 2001). Patterns of stream flow following bushfires of sufficient intensity to kill trees and stimulate regeneration by seed typically follow the sequence:
1. An immediate and short-term increase in stream flow. Death of the overstorey results in a reduction in ET for 2 to 5 years, due to reduced interception and transpiration (Vertessy et al. 1998, Cornish and Vertessy 2001, Lane and Mackay 2001, Vertessy et al. 2001, Watson et al. 2001). Loss of vegetation and litter, exposure of soil, deposition of ash and alteration of soil properties and processes may all result in increased surface runoff, soil erosion, sediment and nutrient transport through runoff with adverse effects on stream water quality. These effects are highly variable and difficult to predict, but typically persist for only a few years at most when cover re-establishes.
2. A gradual decrease in stream flow, to a minimum occurring 20-40 years after the fire. Once new seedlings germinate and begin a phase of vigorous regeneration of the forest overstorey (Figure 4), interception and transpiration increase rapidly for several years or more. During this phase forest water use reaches a peak which can be sustained for many decades. Research by the Melbourne Water Corporation and the CRC for Catchment Hydrology over several decades has shown that following the extensive 1939 bushfires,

11
annual stream flow declined gradually to as low as 50% of pre-fire stream flow levels (equating to as much as 600 mm year-1) in southern Victoria’s E. regnans forests, in the 20–30 years following disturbance by wildfire (Kuczera 1985, 1987). The subsequent recovery is expected to take as long as 150 years.
3. A slow recovery in stream flow over many decades. As the overstorey matures, the tree crowns begin to senesce and thin out and gaps begin to appear in the overstorey. This process is associated with a decline in mean annual ET, particularly if no younger trees emerge to fill the gaps (Vertessy et al. 2001, Roberts et al. 2001).
These patterns are expanded upon below. They are exemplified by the case studies of Kuczera (1985, 1987) who developed an idealized empirical curve (Figure 6) describing the relationship between mean annual stream flow and forest age for forests dominated by E. regnans in Melbourne’s water supply catchments. This curve does not show the increase in stream flow (because of very low ET) that occurs in the first few years after major fire where most trees are killed. A more accurate representation of this effect is incorporated into an empirically-derived curve of Watson et al. (1999). The shape of the ‘Kuczera’ curve is approximately the inverse of the more generalised ET curve shown in Figure 7. Kuczera’s curve is based on observed hydrological responses of eight large water supply catchments (50-500 km2) to extensive wildfires in January 1939 in which known proportions of each catchment were converted from old growth to re-growth. The eight catchments also included some drier eucalypt forest types, however Kuczera’s analysis indicated long-term stream flow responses were determined entirely by the proportion converted from old growth to regrowth ash-eucalypt (mostly E. regnans forest). Key features of this curve are:
As the eucalypt stands regenerate following fire, water yield gradually declines to a minimum occurring about 27 years after the fire.
After this minimum is reached, water yield slowly rises again to pre-disturbance levels as the stands age (predicted to take as long as 150 years for E. regnans forest).
This curve has two major limitations:
The errors are large, particularly for the stream flow recovery phase, because when Kuczera (1985) derived stream flow versus forest age curves for Melbourne’s catchments there were no data on stream flow from catchments with forests predominantly in the 50 to 150 years age range.
Since the curve was empirically derived from observations of stream flows in catchments dominated by a single forest type in a given climate regime, it is difficult to accurately predict impacts in other forest types, locations and climates.

12
-800
-600
-400
-200
0
200
400
0 50 100 150 200 250 300
Forest age (years)
Cha
nge
in m
ean
annu
al s
trea
mflo
w c
ompa
red
with
old
grow
th (
mm
)
Figure 6. Predicted change in stream flow with increasing forest age following a bushfire, relative to that from old growth mountain ash forest (based on Kuczera 1985)
Figure 7 illustrates, in a generalised form, the shape of the relationship between overstorey age and ET for even-aged natural eucalypt forests which regenerate by seedling regrowth. This generalised relationship is based on our interpretation of stream flow and ET data from catchments forested with wet sclerophyll eucalypts (Kuczera 1985, 1987, Vertessy et al. 1998, Cornish and Vertessy 2001, Lane and Mackay 2001, Roberts et al. 2001, Watson et al. 2001). The precise form of this curve is not important in this discussion as it will vary substantially with circumstances. The duration of the initial period of low ET, and the subsequent period of rapidly increasing ET probably varies markedly as will the period of relatively stable ET at close to the peak (Cornish and Vertessy 2001, Watson et al. 2001). From the limited evidence available, the shape of this relationship appears typical for natural, even-aged, wet sclerophyll eucalypt forest stands in zones where mean annual precipitation is >1200 mm (Vertessy et al. 1998, 2001, Watson et al. 2001, Cornish and Vertessy 2001, Roberts et al. 2001). Disturbance in such forests occurs as infrequently as only once in every few centuries. The dominant tree species are shade intolerant and therefore only regenerate after major disturbances. The shape of the curve is probably similar for plantations, except these are usually harvested and replanted before the decline in ET illustrated in Figure 6 so that for a greater proportion of time, ET is in the rapidly increasing and peak phases. This analysis is similar to and agrees with the interpretation of the relationship between water yield and forest age by Kuczera (1985, 1987).

13
Overstorey age
An
nu
al E
T
young old
Figure 7. Generalised relationship between overstorey age and ET for even-aged, natural eucalypt forests, which regenerate by seedling re-growth Uneven-aged forests would be like this but should be more dampened. For E. regnans forest, maximum ET is thought to occur at around 25 – 30 years of age. The difference between maximum and minimum ET averages about 600 mm year-1 but this varies substantially between locations, depending on variables such as annual rainfall and soil depth. The rate of decline in ET from the peak is still uncertain but may take 50 to 150 years. For other eucalypt forest types variables such as age of peak ET, rate of decline in ET after the peak, maximum and minimum ET are still largely unknown.
Some of the causes of decline in ET with forest age have been better elucidated the past 15 years due to more accurate direct measurement techniques, particularly at the plot scale (Dunn and Connor 1993, Vertessy et al. 2001, Roberts et al. 2001). These studies indicate that for wet sclerophyll eucalypt (E. regnans, E. sieberi) forests:
Leaf Area Index (LAI) reaches a peak in young, regenerating forest and is lower in older, senescing forest. However, the changes in LAI observed in these two forest types with age were not large enough to account for all the variation in ET, because as overstorey LAI decreases, the LAI of the understorey increases. It was hypothesised that the conductance of leaves to water vapour decreased with age and that conductance of understorey foliage was lower than in overstorey foliage (Vertessy et al. 2001, Roberts et al. 2001). Indirect evidence of this is provided by England and Attiwill (2006) who found an increase in xeromorphy of E. regnans leaves with tree age (6 to 240 years). Leaf conductance is probably lower in older trees because the greater tree height and longer branches increase the resistance to water movement from the roots to the leaves (Whitehead 1998).
Sap flux density near the base of the stems of the overstorey trees does not change much with individual tree size and age in these forests, but because average tree size and the number of trees per ha differs with stand age, resulting in large changes in sapwood area per ha with age, total transpiration per ha also varies with age. Typically in E. regnans forests, stand sapwood area declines from about 11 m2 ha-1 at about15 years to about 3 m2 ha-1 at about 200 years (Haydon et al. 1996); because sap flux density is similar,

14
transpiration of the eucalypt component is about 3 times lower in 200 year old stands compared to 15 year old stands (Dunn and Connor 1993, Vertessy et al. 1998, Vertessy et al. 2001).
Similarly, sapwood area and transpiration were found to decrease with age In E. sieberi forests in southeast NSW Roberts et al. (2001), which would be expected to result in changes in stream flow. Stand transpiration progressively declined from 2.2 mm day-1 (14 yr old) to 1.4 mm day-1 (45 yrs) to 0.8 mm day-1 (160 yr old). This decline was strongly related to decreases in sapwood area even though LAI was similar. The differently aged stands regenerated after wildfires in 1983, 1952 and about 1839. As noted previously, reduced transpiration rate per unit of leaf area with greater age is probably related to increasing hydraulic resistance in the root-leaf pathway with age (Whitehead 1998).
Vertessy et al. (2001) attributed about 48% of the change in runoff with forest age in E. regnans to differences in transpiration, 45% to differences in rainfall interception, and 7% to differences in soil/litter interception.
E. sieberi and E. regnans are both fire sensitive eucalypts. Fires of moderate to high intensity kill these overstorey trees and stimulate dense regeneration of young seedlings. Less is known about how ET from forest understorey varies with age, and how such variation influences stream flow. Vertessy et al. (2001) observed that transpiration per unit of leaf area in some understorey species of a 240-year-old mountain ash forest (however the understorey may have been only about 60 years old) was substantially lower than for the overstorey. Changes in leaf area of the understorey would thus have less effect on ET than changes in the overstorey. The understorey may not necessarily be the same age as the overstorey. Low intensity fire or other disturbance such as selective tree harvesting or drought can result in understorey regeneration. The effects of disturbing the understorey without changing the overstorey are not well understood. In some eucalypt forest types, if protected from disturbance for centuries, the overstorey eucalypts die due to old age and are replaced by longer-lived rain forest species (Smith and Guyer 1983). The effect of this on ET and stream flow is not known.
For the fire-sensitive eucalypt forests we need to better understand the relationship between fire intensity and forest regeneration. In particular, more information is needed on the threshold intensity that produces the conditions necessary for conversion from mature forest to regrowth and how much regrowth is stimulated at different fire intensities. More frequent burning of fire sensitive eucalypt forests is likely to increase the mean ET in the long term by inducing more frequent forest regeneration. However, if fires become so frequent that the overstorey is killed before the trees can produce enough seed for regeneration, a permanent change in vegetation type might occur (e.g. replacement of fire-sensitive with fire-resistant vegetation types) with less-predictable hydrological consequences.
Quayle et al. (2004) use the empirical relationship developed by Watson et al. (1999) to develop curves (using their Broadscale Impact of Stream flow Yield – BISY- model) relating change in stream flow to forest age for mountain ash, mixed species and snow gum forest types that undergo a mortality response to fire. They also develop curves for situations where trees may be partially damaged (scorched) by fire and so recovery of LAI and therefore water use is quicker. Most of their curves are hypothetical, due to a lack of supporting data.
The effects of bushfire on stream flow are variable. Mackay and Cornish (1982) reported rapid increases in peak flow and storm flow volume following intensive wildfire in a small catchment near Eden NSW and attributed the response to decreased transpiration and infiltration. In contrast, a recent study by Lane et al.

15
(2006) showed that, following the 2003 wildfires in north east Victoria, although the burnt catchments experienced annual stream flow increases of around 65-75%. analysis of flow duration curves did not indicate changes in surface-runoff generating processes at daily timescale.
The effects of bushfire on water yields of the ‘sprouters’ are less well understood (e.g. Quayle et al. 2004). In the Murray Uplands, these, usually mixed-species forests, are generally found in the exposed lower elevation areas, and on northern and western slopes at higher elevations, where fire generally occurs more frequently, and at less intensity than in ash-type forests. Consequently, mixed species forests tend to be dominated by fire-resistant eucalypts, such as the stringybarks and peppermints. Unlike ash forest, mature trees in mixed species forests are capable of recovering from low and medium intensity fire disturbance. Accordingly, fire may not have as significant an effect on the water yield. However, Lane and Mackay (2001) observed that logging and regenerating patches of mixed species eucalypt forest (mainly E. fatitgata, E. cypellocarpa and E. obliqua) in a catchment with mean annual precipitation of about 1100 mm resulted in an initial water yield increase lasting for 3 years but a subsequent reduction in stream flow of 20% below the pre-treatment mean.
In eucalypt forests dominated by species which tend to regenerate by resprouting rather than by seedlings, the initial reduction in ET and increase in stream flow also occurs. It can be argued that the subsequent decline in stream flow, although not well researched, probably does not occur unless there is substantial regeneration by seedlings, which probably only occurs after logging or very intense wildfire.
Better understanding of post-fire recovery strategies for different forest types incorporated into a modeling approach like Quayle et al. (2004) should allow us to develop more realistic curves for likely forest ET and catchment stream flow following major disturbance
Table 2 summarises our understanding of how fire might impact on water yields and highlights where we need greater understanding to better predict impacts. The table is incomplete, for example we have so far not collated available data on the areas of the Murray Uplands occupied by the main eucalypt forests types and age classes. This will be an essential step in assessing the potential impacts of future wildfires on water yields from the Uplands catchments.
4.3 Effects of climate variability and change on bushfires and hydrological responses
A fire regime is defined by its intensity, frequency and the season of burn. The pattern of fire in a landscape is determined by its behaviour (risk, danger), levels of fuel accumulation and ignition probability, topographic probability, topographic characteristics such as elevation, slope and aspect, and the arrangement of these in the landscape relative to areas with high ignition probability (Cary 2002).
Fire intensity is the product of heat yield of the fuel, the amount of fuel per unit area (fuel loading) and the rate of spread of the fire (Gill and Catling 2002). Intensities may be categorized as low (less than 350 kW m-1), high (350-3500 kW m-1), very high (3500-35,000 kW m-1) and extreme (greater than 35,000 kW m-1). The rate of spread of fires is significantly affected by fuel dryness as well as wind speed and direction, slope and topography.
The most often used measure of fire risk in Australia is the McArthur Forest Fire Danger Index (FFDI) which represents fire danger (McArthur 1967). The FFDI incorporates a quantitative relationship between air temperature, wind speed,

16
humidity, drought and precipitation but it does not incorporate information on fuels or vegetation structure, because these are often secondary to weather and topographical features. An increase in FFDI means that there is a greater chance of fires starting, and once ignited, fires will have higher rates of spread, be more intense and more difficult to suppress. FFDI is very sensitive to changes in daily relative humidity. The FFDI does not take into account important factors such as wind direction, the succession of particular types of weather days and occurrence of lightning strikes (Cary 2002). The FFDI (and the Grasslands Fire Danger Index –GFDI) are used operationally to monitor fire risk, schedule prescribed burns and declare Total Fire Ban Days (Hennessy et al. 2005).
Scenarios developed from CSIRO and other climate models suggest that there is the potential for climate in all areas of Australia to change sufficiently to modify average fire behaviour. However, there are aspects of weather (such as relative humidity and wind speed and direction) that are frequently not accounted for in climate change scenarios and that impact significantly on fire. In addition, it is difficult enough to assess fire regimes under the current climate let alone predict how they might be altered under changed climate.
Williams et al. (2001) have used the FFDI and the general circulation model (GCM, CSIRO 9-level) to predict the effects of climate change on fire regime throughout Australia. The general impact of increased CO2 (greenhouse impact) is to increase fire danger at all sites by increasing the number of days of very high and extreme fire danger (based on estimates of maximum daily temperature), but the extent of impact is geographically explicit. Presumably, the use of improved GCMs (e.g. as used by Whetton et al. (2002) will improve accuracy of fire risk predictions, and could be applied to areas of interest to the Uplands project. If information on forest fuel loads are available as well as FFDI, fire intensity, rate of spread and impact on vegetation structure can be estimated (Williams et al. 2001).

17
Table 2. Summary table, hypothesized impacts of wildfire on annual stream flows in Murray Uplands natural eucalypt forests. MAP mm
Forest types
Area in MU Km2
Fire intensity
Vegetation recovery/regeneration response
Approximate annual stream flow change compared to mature/old-
growth
Quantitative evidence for hydrological
response low-mod part or entire understorey, some
epicormic overstorey, a few seedlings
max 100 mm increase <3 years, then no decrease
little euc sprouters
high entire understorey, extensive epicormic overstorey, a few to patchy seedling or even widespread seedling
max 200 mm increase <5 years, then no decrease
little
low-mod part or entire understorey, patchy seedling overstorey
max 100 mm increase <3 years, then max 50 mm decrease
little
<1000
euc seeders
57518
high entire understorey, extensive seedling overstorey
max 200 mm increase <5 years then max 100 mm decrease
little
low-mod part or entire understorey, some epicormic overstorey, a few seedlings
max 200 mm increase <3 years, then no decrease
little euc sprouters
high entire understorey, extensive epicormic overstorey, a few to patchy or even widespread seedling
max 500 mm increase <5 years, then <100 mm decrease
little
low-mod part or entire understorey, patchy seedling overstorey
max 200 mm increase <3 years then max 100 mm decrease at ~25 years
Watson et al. (1999),
1000-1500
euc seeders
23355
high entire understorey, extensive to mass seedling overstorey
max 500 mm increase <5 years then max 250 mm decrease at 25 years
Watson et al. (2001), Lane & Mackay (2001)
low-mod part or entire understorey, some epicormic overstorey, a few seedlings
max 300 mm increase <3 years, then no decrease
little euc sprouters?
high entire understorey, extensive epicormic, patchy to extensive seedling overstorey
max 600 mm increase <5 years, then <200 mm decrease
little
low-mod part or entire understorey, patchy to extensive seedling overstorey
max 300 mm increase <3 years then max 200 mm decrease
O’Shaughnessy & Jayasuriya (1994), Cornish & Vertessy
(2001)
>1500
euc seeders
5620
high entire understorey, mass seedling overstorey
max 600 mm increase <5 years then max 600 mm decrease at ~25 years
Kuczera (1985, 1987), Watson et al. (2001), Cornish & Vertessy
(2001)
18
Cary (2002) used output from the CSIRO regional (Reg) CM (Division of Atmospheric Research Limited Area Model (DARLAM) nested in CSIRO-9 GCM) to examine four scenarios of potential changes in fire regimes in the ACT, using the FIRESCAPE fire regime model (McCarthy and Cary 2002). One of the four scenarios was for the present climate, and three spanned the range of temperature change in the 1996 CSIRO scenarios, with other factors scaled accordingly: low (0.6 C increase in average annual temperature), moderate (2 C increase) and high (3.4 C increase) change. Small to moderate increases in the FFDI were found, but more significant increases in fire frequency (as measured by the inter-fire interval - IFI) for the moderate and high change scenarios. IFI varied from an average of about 43 years (present conditions) to 20 years (moderate change scenario) and 12 years (high change). Moderate increases in average fire line intensity were also found with warmer climate, a decrease in fire extinguishments (fire going out in a particular grid-cell), and an average increase in fire spread, which varied strongly with season according to the projected changes in seasonal rainfall. Fire extinguishment is a key factor to estimate. Projected changes in fire behaviour would doubtless alter with further updated climate change scenarios, but the overall picture is not expected to change significantly. This is because extreme fire danger is well correlated with periodic drought conditions, leading to drying of fuel, and extremely hot summer and autumn days conducive to fire spread. Both these conditions are expected to increase with global warming under all plausible scenarios, at least in southern Australia. However, it is very hard to predict extreme conditions using a climate model that has enough difficulty in producing ‘realistic’ average conditions.
Hennessy et al. (2004) provide an analysis of the range of seasonal and annual changes in temperature and rainfall likely to be experienced across NSW around 2030 and 2070 based on a variety of models and including options if the CO2 levels were to be lower than predicted; interrogation of this information would be possible for the Uplands. In addition, they provide projected changes in extreme climate conditions, focusing on number of days above 35 and 40 C, drought incidence, rainfall and wind speed. All of these changes are relevant to bushfire frequency and intensity.
Hennessy et al. (2005) report on the use of two CSIRO RegCMs (CCMA Mark 2 and 3) for generating climate change scenarios for 2020 and 2050 (using low and high rates of global warming) at 17 locations in south-eastern Australia and applying these to determine changes in FFDI and GFDI on annual, monthly and daily bases. Two locations (Canberra and Wagga Wagga) are of particular interest to Uplands. Projections using Mark 2 for both locations are similar with 4-8% increases in annualized FFDI in 2020 and 10-26% (Canberra) and 9-23% (Wagga Wagga) for 2050. Large increases in the number of days when FFDI is very high or extreme are also projected: for example, by 2050 from 23 days to 28-36 days (using Mark 2). The authors indicate that a number of uncertainties remain, including potential impacts on water yield and quality from fire affected catchments. Amongst the recommended priorities for further research made by the authors, those relevant to this review are:
Hydrological and ecological modeling to assess impacts on water and biodiversity, and
Using satellite remote sensing to monitor the extent and nature of fire, recovery of vegetation after fire, and carbon emissions from fire.
Suitable models are available to predict fire regime responses to climate change scenarios, however, there is a significant gap in the ability of modeling to predict impacts of fire on vegetation composition, feedback of fire incidence on fire proneness, age-distribution and biomass of forests, which is crucial for predicting impacts on ET and hence water yields. For such predictions it is important to be able to predict fire intensity and spread when fire breaks out. In addition, prevention and suppression management of fire may become more sophisticated in the future thus affecting fire risk and prevalence.
19
5. Effects of Climate Variability and Change on Stream Flow via Changes in Forest Functioning Estimates of the impact of climate change on stream flow are required to prepare future scenarios of water security and to identify possible management intervention and other adaptive strategies. However, any estimates of the impact of climate change on stream flow have a large degree of uncertainty because of the limitations of both hydrological models and the climate change scenarios. The purpose of this section is to provide a brief overview of climatic and site controls on stream flow and develop a preliminary conceptual framework as a starting point for more in-depth analyses.
5.1 Projected changes in climate for Murray-Darling Basin
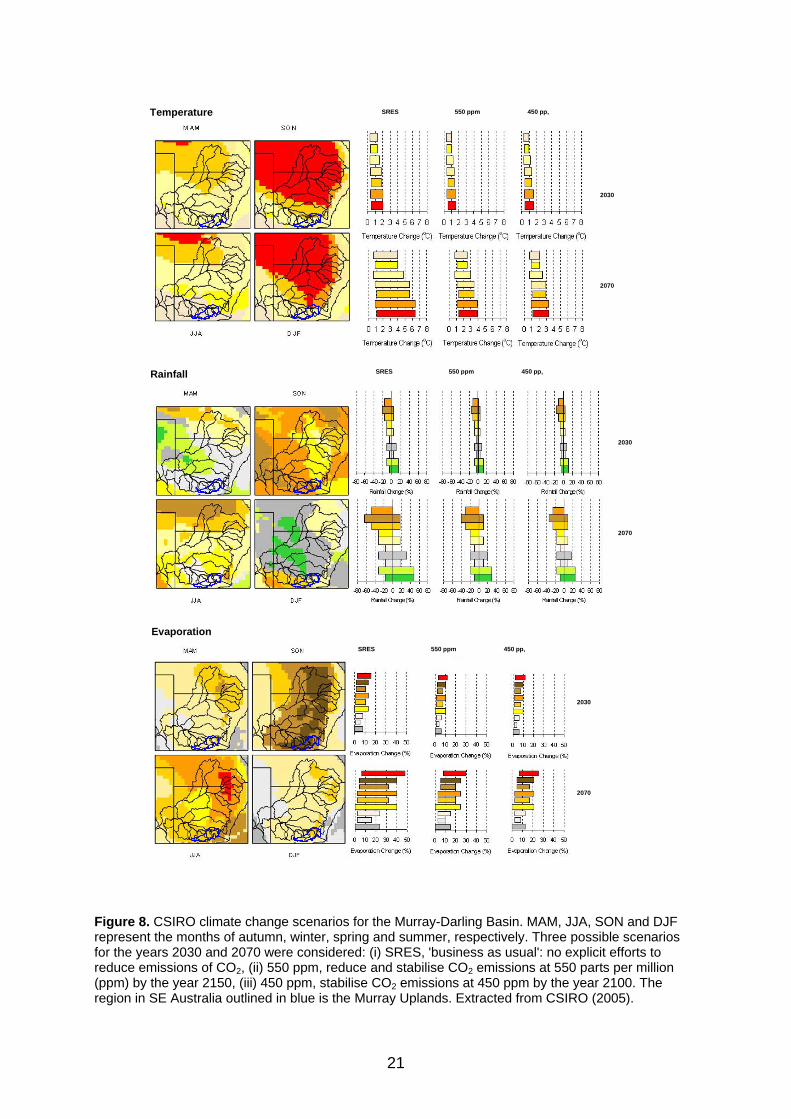
Nine global and regional climate models have recently been used to estimate temperature and rainfall changes for the MDB (Jones et al. 2002; Suppiah and Durack, pers. comm. 2006) for three of the emissions scenarios published in a Special Report on Emissions Scenarios by the Inter-governmental Panel for Climate Change (IPCC) for the years 2030 and 2070: (i) 'business as usual': no explicit efforts to reduce emissions of CO2, (ii) reduce and stabilise emissions at 550 parts per million (ppm) by the year 2150, and (iii) stabilise CO2 emissions at 450 ppm by the year 2100. The results (Figure 8 and summarised in Table 3) indicate that for this region, temperature increases will be in the order of 0.2 to 0.9oC by 2030 and 0.5 to 6.5oC by 2070. Likewise, potential evapotranspiration is likely to increase by 2 to 13% by 2030 and by 5 to 40% by 2070. In contrast, there is much more uncertainty about the direction of change in precipitation in this region. Changes in precipitation from summer through to winter were projected to either decrease by up to 15% (or 45%) by 2030 (or 2070) or increase by up to 10% (or 30%) by 2030 (or 2070). However, projections do indicate a decrease in precipitation during spring of up to 18% by 2030 and 45% by 2070.
Compared to the northern parts of the Basin, the Murray Uplands show less warming and a decreased shift in rainfall. However, it should be noted that these scenarios may also be affected by other factors not yet explicitly considered in these models, such as local changes in ocean circulation, increasing sulphate aerosols in Asia, and change in El-Nino-Southern Oscillation behavior (Chiew and McMahan 2002). Moreover, historically (last decade and last 5 years) the apparent rainfall changes have been greatest in the SE of the MDB.
Globally, projected changes in stream flow largely follow regional precipitation changes, but this may be less applicable in Australia where runoff is a smaller fraction of rainfall than in most other places (Australian Greenhouse Office 2003). In Australia, pre-existing soil moisture, vegetation and rainfall intensity may play important roles. These effects are discussed below. As discussed in Section 4, the higher rainfall areas of the Murray Uplands catchments are extensively forested. In these high rainfall areas, annual ET is probably limited by potential ET. The somewhat simplistic analysis in Section 4 suggested a 5% increase in actual ET of the Uplands forests would result in a 20% decrease in stream flow. From the data shown in Table 3, a 5% increase in potential ET by 2030 appears quite likely. It also appears likely precipitation will either change little or reduce slightly (although it might increase slightly). Given that actual ET in the higher rainfall Uplands forests is probably largely limited by potential ET, and given the climate projections presented in Table 3, a >5% increase in actual ET by 2030, resulting in a likely >20% reduction in stream flow from forested areas, is plausible and in fact would appear to be likely. A more thorough analysis to explore the potential impacts of the magnitude of climate change on forest ET from the Uplands catchments is essential.

20
Table 3. Projected changes in temperature, evaporation and precipitation in the Upper Murray by 2030 and 2070 using the SRES scenario. Data summarised from Figure 8.
Change in temperature
(oC)
Change in ET (%)
Change in precipitation
(%) By 2030 Autumn 0.2-1.8 2-8 -5 - +5 Winter 0.2-1.2 2-11 -5 - +5 Spring 0.3-1.9 2-13 -18 - 0
Summer 0.2-1.8 2-11 -15 - +10 By 2070 Autumn 0.5-4.9 2-23 -18 - +18 Winter 0.6-4.0 2-32 -18 - +18 Spring 0.5-6.2 5-40 -45 - 0
Summer 0.9-5.5 3-40 -45 - +30
There are currently contradictory conclusions as to predicted changes in evaporation following climate change. In climate change modeling studies it is generally assumed that an increase in temperature would result in an increase in potential evaporation. However, recent studies using observed pan evaporation data have found that, in some cases, increases in temperature have been accompanied by decreases in pan evaporation (Roderick and Farquahar 2002). Further work is required to clarify how these findings relate to potential evaporation and ultimately catchment yield.
21
SRES 550 ppm 450 pp,
SRES 550 ppm 450 pp,
SRES 550 ppm 450 pp,
2030
2070
2030
2070
2030
2070
Temperature
Rainfall
Evaporation
Figure 8. CSIRO climate change scenarios for the Murray-Darling Basin. MAM, JJA, SON and DJF represent the months of autumn, winter, spring and summer, respectively. Three possible scenarios for the years 2030 and 2070 were considered: (i) SRES, 'business as usual': no explicit efforts to reduce emissions of CO2, (ii) 550 ppm, reduce and stabilise CO2 emissions at 550 parts per million (ppm) by the year 2150, (iii) 450 ppm, stabilise CO2 emissions at 450 ppm by the year 2100. The region in SE Australia outlined in blue is the Murray Uplands. Extracted from CSIRO (2005).

22
5.2 Influence of climate on stream flow within catchments
Some studies have assessed the potential impact of climate change on stream flow in the MDB. Many of these have focused largely on changes in stream flow resulting from changes in precipitation (Close 1988; Chiew et al. 1995; Chiew and McMahan 2002; Jones et al. 2002; Kirby et al. (2003). This is understandable given the strong link between rainfall and stream flow and the El Nino-Southern Oscillation in this part of eastern Australia (Australian Greenhouse Office, 2003). However, other changes in climate which influence the incoming energy available to drive evapotranspiration might also be important.
Changes in precipitation are always amplified in runoff, but with amplification being lower in wetter catchments where a change in precipitation has less impact on soil moisture availability (Close 1988; Chiew et al. 1995). For example, it has been shown (Chiew et al. 1995) that the percentage change in runoff in high rainfall (MAP 1200-2000 mm) catchments under forests in the Upper Murray was up to 43% less than that expected for drier (MAP 450-1100 mm) catchments under grass and sparse trees in the north of the MDB. More recently, Chiew and McMahan (2002) showed that for a catchment in the Upper Murray, runoff was expected to change by about twice the percentage change in rainfall, yet in the drier catchments in the northern parts of the MDB, the percentage of change in runoff is predicted to be more than four times the percentage change in rainfall. Similarly, when assessing the likely impact of climate change on water yield in the Australian Capital Territory, Kirby et al. (2003) found that percentage changes to runoff were lower in the wetter catchments.
For similar climate scenarios, the decline in stream flow in the Upper Murray varies between studies due to different representations of the effect of temperature and potential evaporation on runoff. Most workers have projected decreases in runoff in the MDB in the order of 7-35% by 2030 or 2050 (Arnell 1999; Beare and Heaney 2002; Maheepala and Perera 2003; Chiew et al. 2003; Howe et al. 2005). However, Schreider et al. (1996, 1997) predicted even greater declines in runoff in the Upper Murray, with decreases in stream flow being up to 30 to 36% by 2030 under the ‘most dry’ scenario.
Because rainfall-runoff is a threshold process, where most of the runoff is generated as a result of high rainfall events, using rainfall scenarios generated using a constant scaling method will overestimate (or underestimate) decreases in runoff where there is a decrease (or increase) in mean annual precipitation (Chiew et al. 2003; Harrold et al. 2005). The scaling method is necessary to assess the potential impact of climate change on the frequency of flood events. Further work is also required to assess the impact of climate change on floods in the MDB. Although drought frequency (as defined by a soil wetness index) is expected to increase by up to 35% at 2030 and by 80% by 2070, depending on the climate scenario used, flood frequency was expected to either increase or decrease between 2030 and 2070 (Schreider et al. 1996).
In most parts of Australia, temperature increases alone have negligible impacts on the runoff when compared to precipitation. However, in the relatively cool and snow-affected Upper Murray, increases in temperature do lead to an increase in winter ET, leading to only small projected reductions in runoff (Chiew et al. 1995). Indeed, in snow-affected catchments in the Upper Murray, Schreider et al. (1996, 1997) projected slightly positive to negative changes in stream flow, whereas in snow-free catchments of this region, projected changes were neutral to negative. Indeed there may be many snow-affected catchments in the Upper Murray where climate change is expected to result in increase stream flows during the winter months as what snow does fall in winter is quick to melt (Australian Greenhouse Office 2003). However, these studies did not consider the possibility that warmer winter temperatures at high elevations may result in an increase in ET due to encroachment of forests into alpine grasslands.

23
5.3 Climate effects on catchment streamflow via its effect on vegetation
5.3.1 Important processes in the water balance under forests
In addition to climate change directly impacting streamflow via changes in precipitation and temperature, in a vegetated catchment there will also be impacts on other pathways of water loss, including interception, evaporation and transpiration (Figure 9). These processes are all driven by factors such as solar radiation and resistance to evaporation as described in the Penman-Monteith equation (Monteith, 1965).
Interception. This varies with forest age, species, and management impacts such as spacing and thinning, and climatic factors such as intensity and duration of rainfall (Crockford and Richardson 2000). It is primarily a function of the leaf area of the forest and of the capacity of foliage to hold water that may be subsequently evaporated, but is also strongly influenced by the number, size and intensity of rainfall events. Interception is a significant contributor to stand water balance, for example, productive conifer forests with closed canopies intercept 20-45% of annual rainfall on average compared to about 10-25% for eucalypts that generally have more open canopies and foliage which retain less water. In E. regnans, Haydon et al. (1996) observed a rapid increase in interception to a peak of about 25% of rainfall between age 20 and 60 years, before a slow decline to about 17% by age 240 years.
Evaporation from soil and litter. This can be a major contributor to ET, varying from 100% in recently disturbed forest (immediately after an intense wildfire for example), then decreasing rapidly to about 5-25% of total ET as forest cover increases, after which it usually varies little. For example, Vertessy et al. (2001) estimated soil evaporation contributed 9-11% of total ET in E. regnans forests aged between 15 and 230 years. In nine closed canopy eucalypt and conifer plantations in the Green Triangle, Benyon and Doody (2004) observed annual soil evaporation ranging from 12 to 22% of annual ET. Evaporation is controlled by a combination of meteorological and soil factors and LAI. Low LAI and high levels of radiation, temperature and wind promote soil evaporation, as do coarse textured soils. Evaporation can be high immediately after rainfall but decreases rapidly after a few days as resistance to evaporation increases in the drier soil.
Transpiration. The flux of transpiration (for example, for an individual tree) is driven by a gradient of water potential from soil to atmosphere and moderated by resistances to flow along this pathway. It thus depends upon a range of factors that determine the magnitude of that gradient, such as the water potential (i.e. moisture content) of the soil and the humidity of the atmosphere, and the resistances to sap flow and evaporation, notably those imposed by leaf stomata which open and close in response to meteorological conditions. The amount of transpiration at stand level (for example, per hectare) is generally determined by the available soil water, the canopy leaf area, the resistances to water movement through the soil to atmosphere pathway and the energy available at the leaf surface for evaporating water. Transpiration can be estimated by a number of ways, one of the most commonly being the Penman-Monteith equation (Monteith 1965).
Type and density of vegetation and litter will determine the relative importance of water loss from evaporation of water stored in the canopy or litter (interception), water stored in the surface soil, and transpiration by vegetation. This is particularly so in higher rainfall regions such as the Upper Murray as the influence of vegetation cover on interception, transpiration and evaporation increases with higher precipitation (Zhang et al. 1999). For

24
example in higher rainfall areas, deep-rooted trees transpire an increasingly large volume of water when compared with shallow rooted grasses species (Zhang et al. 1999; Beare and Heaney 2002; Williams and Albertson 2005). In lower rainfall regions, low soil moisture content may limit transpiration of all vegetation types.
Using the Soil Water Under Forests (SWUF) model, calibrated in a native forest at Bago State Forest near Tumbarumba (NSW), Paul et al. (2004) predicted that the major pathway of water loss was through interception and transpiration, with relatively little loss from evaporation from the canopy- and litter-covered soil (Figure 9). Over a 20-year simulation period, average annual interception was 328 mm (247+81), slightly less than average annual transpiration (T) (331 mm). On average the model predicted annual ET of 796 mm. Leuning et al. (2005) showed that annual ET at Tumbarumba was 724 mm for the period of 2002-03. The reported rainfall was 1364 mm for 2002 and 981 for 2003. Their results showed that annual ET was about 62% of annual rainfall, which is comparable with Paul et al. (2004) who reported a ratio of 72%.
Canopy
Litter
Soil
I
T
E
L
RO
P
1097
93
206
81
247
331
137
Figure 9. Factors involved in climate change impacts on forest water balance at plot scale and thereby likely to influence stream flow. Numbers indicate SWUF predicted average annual loss/gain of water from precipitation (P), interception (I) due to evaporation from the surface of the canopy or litter, soil evaporation (E), surface runoff (RO), transpiration (T), and leakage (L) from a 20-year simulation of mature native forest growing at Bago State Forest near Tumbarumba (NSW).

25
However, tree cover can affect stream flow not just by the amount of water lost through interception, transpiration and evaporation, but also by its effect on the partitioning between runoff and deep drainage (or recharge). This is because the fraction of excess water that enters the ground water system depends on the rate of infiltration, the rate at which water can penetrate the soil surface, and percolation through the soil profile (Beare and Heaney 2002). These factors depend not only on slope and soil texture, but on soil factors influenced by tree cover, such as the depth of the litter layer, the water holding capacity of litter and soil (Paul et al. 2004) and the presence of preferred flow paths for water movement associated with tree roots. The depth of the litter layer and the water holding capacity of litter and soil will be influenced by the indirect effects of climate change (e.g. drought, fire, disease etc.) on factors such as species composition, rates of growth, mortality and decomposition of litter and soil organic matter.
5.3.2 Impacts of climate change and sensitivity analysis
Climate change directly (via changes in temperature and precipitation) and in-directly (via changes in the frequency and severity of pests and diseases, droughts, fires and floods) may alter species composition, rates of growth and mortality, decomposition of litter, and soil organic matter at plot and mini-catchment scales (Figure 10). For example, if available root-zone soil moisture becomes significantly more depleted with climate change, plants may respond by limiting water use through their leaves. This may occur in summer-autumn for drier parts of mixed eucalypt forests. Depending on the severity of the soil moisture deficit, gross reductions in leaf area or tree death may occur. These processes will differ between tree species (White et al. 2000, Benyon et al. 2001). Factors affecting a site’s capacity to store water in the canopy (via changes in canopy cover and LAI), litter layer (via changes in litter cover) and soil (via changes in soil water holding capacity) will in turn affect water loss from interception, evaporation, transpiration and runoff.
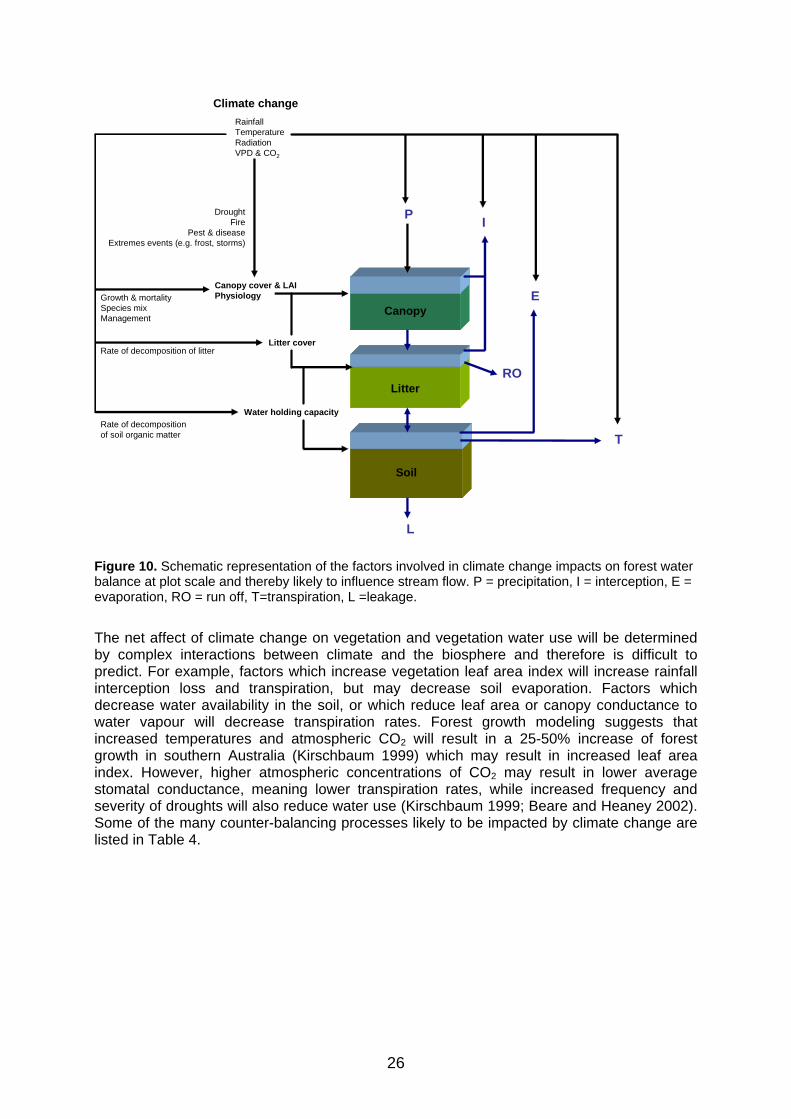
26
Canopy
Litter
Soil
I
T
E
L
RO
P
Growth & mortalitySpecies mixManagement
Litter cover
Water holding capacity
Climate change
DroughtFire
Pest & diseaseExtremes events (e.g. frost, storms)
Rate of decomposition of litter
Rate of decompositionof soil organic matter
Canopy cover & LAIPhysiology
RainfallTemperatureRadiationVPD & CO2
Figure 10. Schematic representation of the factors involved in climate change impacts on forest water balance at plot scale and thereby likely to influence stream flow. P = precipitation, I = interception, E = evaporation, RO = run off, T=transpiration, L =leakage.
The net affect of climate change on vegetation and vegetation water use will be determined by complex interactions between climate and the biosphere and therefore is difficult to predict. For example, factors which increase vegetation leaf area index will increase rainfall interception loss and transpiration, but may decrease soil evaporation. Factors which decrease water availability in the soil, or which reduce leaf area or canopy conductance to water vapour will decrease transpiration rates. Forest growth modeling suggests that increased temperatures and atmospheric CO2 will result in a 25-50% increase of forest growth in southern Australia (Kirschbaum 1999) which may result in increased leaf area index. However, higher atmospheric concentrations of CO2 may result in lower average stomatal conductance, meaning lower transpiration rates, while increased frequency and severity of droughts will also reduce water use (Kirschbaum 1999; Beare and Heaney 2002). Some of the many counter-balancing processes likely to be impacted by climate change are listed in Table 4.

27
Table 4. Expected magnitude and direction of change in rainfall, temperature and radiation and atmospheric CO2, and their potential impact on the water balance under trees, and thus stream flow for the Murray Uplands region (based on the blue outlined region in Figure 8). Parameter Change or possible
change by 2070 Possible responses
Rainfall Decrease by up to 45%, at least in Spring.
Less water available for evapotranspiration
Droughts Increased frequency Increased tree death, incursion of pests and diseases, temporarily reducing leaf area and potential for evapotranspiration. More frequent and more intense fires. Change in forest type.
Temperature Increase by 0.5-6.2 oC Increased growth and evaporative demand, leading to increased water loss from interception and transpiration, but perhaps offset in winter by increased stream flow due to less snow cover.
Radiation Possible increase or decrease resulting from changed cloud cover
Increased radiation will lead to increased growth and evaporative demand, leading to increased water loss from interception, transpiration and evaporation.
Atmospheric CO2 CO2 concentrations in the atmosphere will increase by 20-50%
Increased growth and canopy expansion due to CO2-fertilisation effect, leading to increased losses from interception and transpiration. This will be offset by reduced stomatal conductance, leading to less transpiration.
Understanding the net effects on evapotranspiration of the complex interactions between climate change and the various processes driving evapotranspiration will best be achieved through use of process-based models which simulate the various processes involved and their interactions. To illustrate the sensitivity of various components of the water balance to changes in rainfall, solar radiation, temperature and humidity, a calibrated, plot-scale, daily soil water model (SWUF) was used to simulate components of the water balance in a native forest in Bago State Forest, New South Wales (Paul et al. 2004). A large number of simulations was undertaken, varying one climate variable at a time by ±10%. For a 20-year simulation period it was assumed that the mature native forest was in a state of equilibrium, with LAI of 1.50 and 80% of the ground area covered by the overstorey and 20% by the understorey. The litter layer was also significant, covering 80% of the ground, with a height of 5 cm and mass of 20 Mg ha-1. As this forest was on sloping terrain (7 degrees), we assumed that the soils were relatively shallow and the rooting depth of only 1 m. The upper and lower limit of water content in this clay-loam soil was assumed to be 15% and 28% by weight.
The program @Risk (Palisade Corporation) was used to assign triangular probability distribution functions for each SWUF parameter and input values between their default value, and the default value ±10%. Parameters and inputs altered in the sensitivity analysis included: (1) precipitation, solar radiation, maximum and minimum temperature, vapour pressure deficit (VPD), saturation vapor pressure, (ii) canopy characteristics including the percentage of area of ground that the canopy and understorey trees cover, leaf area index (LAI) and minimum canopy resistance, (iii) litter characteristics including the percentage of area of ground that the litter covers, thickness and mass of the litter layer, and (iv) depth of roots.
For each case study, Monte Carlo simulations were used to re-calculate amounts of average annual water loss (mm per year) from: (i) runoff, (ii) drainage, (iii) interception from the canopy, (iv) interception from the litter layer, and (v) soil evaporation, and transpiration (Figure 11). This was done for 10,000 iterations, using random values sampled from the assumed triangular probability distribution functions. Each climatic variable had a different

28
value for each day of simulation. For each of these temporal inputs, daily values were altered by the same amount during iterations. Rank-order correlations between each parameter or input and the predicted water loss were then calculated. Using this information, a Tornado graph was constructed to rank the relative sensitivity of evapotranspiration to the various parameters and inputs.
The results indicate that at the plot level, characteristics of the tree canopy and litter layer can have just as much influence on key components of the water balance as climate (Figure 11). For example, the amount of water lost from transpiration, interception and evaporation from the leaf litter and soil is influenced largely by the fraction of ground over which the tree canopy and litter covers and the leaf area index (LAI), with precipitation and solar radiation having less impact. Similarly, although rainfall is the most important factor influencing runoff, litter layer thickness is also important.
Although these results are derived from a plot-level analysis, they assist in improving our understanding of catchment-scale hydrology. If a catchment is under a mature native forest like that simulated here, water yield from runoff, and particularly drainage, will clearly be influenced by both direct effects of climate change on rainfall, solar radiation and air humidity, and by indirect effects of climate change on forest growth and functioning, which in turn impact characteristics of the canopy and litter layer.
While this analysis provides some understanding of the impacts of climate change on individual water balance components, it is limited by the absence from the model of feedback effects of climate change on growth and decomposition of litter and because the impact of elevated atmospheric CO2 concentrations on growth and water use efficiency were not simulated. However, if climate change results in a decrease in growth (due to increased drought frequency offsetting the impacts of increased temperature and atmospheric CO2 concentrations) and increased frequency of fire, we would expect that canopy and litter layer cover may decrease. This would lead to an increase in stream flow per unit of rainfall as drainage and runoff would increase following rainfall events, and losses from canopy and litter interception would also decrease.

29
0.0 0.1 0.2 0.3 0.4 0.5 0.6 0.7 0.8 0.9 1.0
Rain
Litter cover
Solar radiation
LAI
Canopy cover
Saturation vapour pressure
Litter mass
Litter height
Root depth
Weed cover
Min. canopy resistance
Maximum temperature
VPD
Minimum temperature
Runoff
Drainage
Canopy interception
Litter interception
Soil evaporation
Transpiration
Sensitivity correlation coefficient
Figure 11. Tornado graph of the correlation between parameters and inputs (varied between ±10% of their default values) and average annual water loss from runoff, drainage, interception, transpiration and evaporation under a mature native forests in Bago State Forest.
5.3.3 Current models
Despite the importance of canopy and litter cover on loss of water from interception, transpiration and evaporation, and the amount and rate of water that is lost as runoff or drainage, land use has rarely been accounted for in many rainfall-runoff models (e.g. IHACRES used by Schreider et al. (1996); MODHYDROLOG used by Chiew et al. (1993) and its offshoot, SIMHYD used by Chiew et al. (2003); AWBM used by Howe et al. (2005)). Such models have been used to predict streamflow in the MDB after being calibrated only to rainfall and potential evaporation data (which in turn is calculated from temperature and sunshine hours), without any consideration of canopy or litter cover on the water balance. Bari et al. (2005) noted that confidence in the predictions of runoff from the Jarrah forest in the Perth hills catchments could be significantly improved by using better estimates of the LAI and potential ET.
Some rainfall-runoff models use simple evaporation coefficients to mimic the effects of different vegetation cover (e.g. Beare and Heaney 2002; Herron et al. 2002). Using the Zhang curves (Equation 2) to relate ET to precipitation for a given vegetation type, these workers assumed potential ET was greater, while runoff was smaller, under forested than non-forested areas in the MDB, as parameters for both plant available water and potential evaporation were set higher. Austin et al. (2005) used nationwide climate change scenario predictions from the DAR 125 and CC50 models with the BC2C model (which incorporates an annual water balance model based on Zhang et al. 2001) operating at 250 m2 pixels to

30
assess the impacts of climate change on stream salinity and water yield in the MDB. They showed that climate change had greatest effect in reducing annual stream flow in high rainfall areas, as did simulated re-vegetation of non-forested areas (less than 20% tree cover). However, such catchment-scale hydrology models treat forests (or any vegetation) as something of a ‘black-box’. Given the dominance of the ET term in catchment water balances, we believe further investigation of the influences of climate change on forest functioning as it affects ET and stream flow is warranted. Rainfall-runoff models need to account for not only the direct effects of climate change on water yield, but also the indirect effects on water yield resulting from changes in canopy and litter cover.
6. Modeling Forest Processes and Hydrology Research in the past decade has improved our understanding of forest processes influencing stream flow to enable development and use of process-based hydrological models to better predict the consequences of climate variability and change on water yield. Some models focus primarily on water movement through soil and catchments in two or three dimensions, while others deal more specifically with the processes involved in vegetation growth and ET. The Topog model (Vertessy et al. 1994) was initially designed for simulating processes generating stream flow in small catchments in three dimensions, based on detailed topography and soil physical properties. It also simulates ET based on known energy inputs and vegetation characteristics such as overstorey and understorey LAI. However, it does not represent the physical processes involved in plant growth as well as some other models, is complex to apply due to the large amount of input data required, uses previous generation software language and architecture and as a result is rather unwieldy. Topog does not simulate natural thinning behaviour of forests and is suited to catchments of <10 km2.
The Macaque model (Watson et al. 1997, 2001) was designed specifically to be used for simulating the effect of forest age on stream flows in medium sized catchments (10 – 1000 km2) forested with ash-type eucalypts. It was first used to simulate the effects of the 1939 fires on stream flows from Melbourne’s water supply catchments over an 80 year period. The model predicted declines in water yield for different parts of the catchments after 20 years of regrowth, with most of the decline occurring from the pure mountain ash areas. This model is currently being recoded into the new millennium and is used to predict water yield in response to disturbance for several small catchments near Melbourne (P. Feikema, University of Melbourne, pers. comm.).
Forest growth models such as 3-PG (Landsberg and Waring 1997) and CABALA (Battaglia et al. 2004) on the other hand, while being specifically designed for simulating forest growth and maintaining an approximate water balance to account for moisture limitation to growth, have very simplified descriptions of soil physical properties and only operate in one dimension, so cannot simulate water movement through soils and catchments unless linked to some other model. Recent examples of such linking are with 3PG being linked to the FLUSH/2CSALT framework (Gallant et al. 2005) and to the CAT model (Beverley et al. 2004); these have the capacity to deal best with sub-catchment scales. In addition, 3PG has been coded to run in spatial mode and accept soil depth and available water data, amongst other spatial inputs (J. Morris, University of Melbourne, pers. comm.).
Feikema et al. (2005) report on the use of the E2 catchment modeling framework to model the impacts of the 2003 bushfires on water quality (and yield) in four forested catchments in south-eastern Australia. They had some reasonably good success at predicting impacts compared to gauging station data. However, the model has several assumptions and limitations including: it did not allow for recovery or management since the fires, no allowance was made for changes to runoff in response to the fires and run off generation from different land uses could not be well represented. Quayle et al. (2004) describe a range of scenarios of stream flow impacts from the 2003 fires in eastern Australia

31
using a new model (the Broadscale Impact of Streamflow Yield - BISY model) which is based on the key principles of the ForestImpact model, which was developed to estimate catchment average impacts of forest management (Munday et al. 2001). The 2003 fires burnt 1.39 million ha of native forest, much of it in the south-east uplands that are important for water supply. There is considerably more uncertainty around predictions for scorched than killed vegetation. Modelling results suggest an overall increase in stream flow from 14-106% that may persist until 2010, and the maximum reduction in stream flow compared with a no-fire scenario might be between -129 to +4 GL. This range reflects the uncertainty in the relationship between fire severity and tree death.
To correctly predict the influence on stream flow of various climate change scenarios (such as drought, high temperature etc) and disturbance such as bushfire, a model is required which accounts for the effect of changing climate on forest growth rates and how this will affect ET. The model therefore needs the capacity to explicitly model species and forest type-specific growth responses to changes in atmospheric CO2 concentration, rainfall, temperature and humidity regimes. CO2 concentration influences stomatal conductance, which in turn influences transpiration rates (which can be modeled using CABALA). Rainfall influences variables such as the degree and duration of water stress and the impact of this on water use, carbon assimilation and partitioning (effects can be modeled using CABALA), and surface soil moisture which influences rates of litter decay and cycling of nutrients (e.g. the SWUF model (Paul et al. 2004). Temperature influences variables such as photosynthetic efficiency, the frequency of frost days (effects can be modeled using 3PG or CABALA). Humidity and temperature together determine atmospheric vapour pressure deficits which influence stomatal conductance and water use efficiency. Because many species-specific responses to climate variables such as water stress, temperature and atmospheric CO2 levels are explicitly modeled in CABALA and 3PG, these models would appear to be the most suited to simulating impacts of climate change on forest growth and ET.
The 3PG and CABALA models can also predict how forest density varies through time, particularly for single-species, even-aged forests. CABALA was also designed to simulate the effect of various forest management options on growth and water use, including arrangement of the trees in various block designs and thinning.
We believe these models have potential to be used for assessing the direct net effects of climate change on forest ET in the Uplands, and for simulating the indirect effects on ET resulting from changed fire regimes and increased incidence of pests, diseases, and drought death in response to climate change. There is also potential for simulating effects of new plantation forestry on ET, at least at the point scale, accounting for effects of site factors such as soil type and depth, for species differences and for effects of management.
We propose that model development for application to high rainfall natural eucalypt forests initially involve: (i) developing species (forest type)-specific parameter sets to enable these models to be run for common high rainfall eucalypt species (ii) using existing forest growth and water yield datasets from several experimental catchment studies to test model predictions of growth and ET in high rainfall natural eucalypt forest; (iii) incorporating under storey effects into these models. Various scenarios could then be run to explore the effects of climate change and forest management on ET.
Parameter sets for common plantation species have already been developed for CABALA and 3PG. Model testing using growth and water use data from research plots in the Green Triangle will demonstrate the accuracy of the models for simulating plantation ET, accounting for effects of species, soil and climate. Once tested, the models can be used more confidently to simulate point-scale effects of various plantation scenarios on ET, accounting for climate, site, species and management.

32
7. Acknowledgements We thank Ensis colleagues for their constructive comments on earlier versions of this manuscript. We thank Albert van Dijk (CSIRO L&W) and Don White (Ensis) for manuscript reviews, and Debbie Crawford (Ensis) for final manuscript edit.
8. References Arnell, N.W. (1999) Climate change and global water resources. Global Environmental Change 9, S31-S46.
Austin, J., Zhang, L., Jones, R., Durack, P., Dawes, W., and Hairsine, P. (2005) Implications of climate change for natural resource management: An assessment of the impact of climate change on catchment salt and water balances in the Murray Darling Basin. Report to the AGO (draft)
Australian Greenhouse Office (2003) Potential impacts of climate change: Australia. In: Climate Change: An Australian Guide to the Science and Potential Impacts. (Ed. B. Pittock) Australian Greenhouse Office. Canberra ACT. pp.83-94.
Bari, M.A., Berti, M.L., Charles, S.P., Hauck, E.J. and Pearcey, M. (2005) Modelling of streamflow reduction due to climate change in Western Australia- A case study. In MODSIM 2005 International Congress on Modelling and Simulation. (Eds. A. Zerger and R.M. Argent). Modelling and Simulation Society of Australia and New Zealand, December 2005, pp. 170-176.
Battaglia, M., Sands, P. J., White, D., and Mummery, D. (2004) CABALA: a linked carbon, water and nitrogen model of forest growth for silvicultural decision support. Forest Ecology and Mangement 193, 251-282.
Beare, S., and Heaney, A. (2002). Climate change and water resources in the Murray Darling Basin, Australia: Impacts and adaptation. ABARE Conference Paper 02.11, 33pp. Available from www.abareconomics.com
Benyon, R.G., Marcar, N.E., Theiveyanathan, S. Tunningley, W.M. and Nicholson, A.T. (2001) Species differences in transpiration on a saline discharge site. Agricultural Water Management 50, 65-81.
Benyon, R.G. and Doody, T.M. (2004) Water use by tree plantations in South East South Australia. CSIRO Forestry and Forest Products, Mount Gambier 26p.
Benyon, R., England, J., Eastham, J., Polglase, P. and White D. (2005) Tree water use in forestry compared to other dryland agricultural crops. Ensis Client Report 1608.
Beverly C., Bari M., Christy B., Hocking M. and Smettem K. (2004) Understanding catchment dynamics from land use change; comparison between a rapid assessment approach and a

33
detailed modelling framework. In:‘Salinity Solutions’ Proceedings of the Salinity Solutions Conference ‘Working with Science and Society’ 2-5 August 2004, Bendigo, Victoria. 4 p.
Brown A.E., Zhang L., McMahon T.A., Western A.W. and Vertessy R,A, (2005) A review of paired catchment studies for determining changes in water yield resulting from alterations in vegetation. Journal of Hydrology 310, 28-61.
Carey, A., Evans, M., Hann, P., Lintermans, M., MacDonald, T., Ormay, P., Sharp, S., Shorthouse, D, and Webb, N., 2003 Wildfires in the ACT (2003) Report on initial impacts on natural ecosystems, Technical Report 17, Wildlife Research and Monitoring, Environment ACT, Canberra.
Cary, G.J. (2002) Importance of changing climate for fire regimes in Australia. In: Flammable Australia: the Fire Regimes and Biodiversity of a Continent. (Eds. R. Bradstock, J. Williams and M. Gill). Cambridge University Press, Cambridge, UK. pp. 26-46.
Chiew F.H.S., Stewardson M.J. and McMahon T.A. (1993) Comparison of six rainfall-runoff modelling approaches. Journal of Hydrology 147, 1-36.
Chiew, F.H.S., Whetton, P.H., McMahan, T.A. and Pittock, A.B. (1995). Simulation of the impacts of climate change on runoff and soil moisture in Australian catchments. Journal of Hydrology 167, 121-147.
Chiew, F.H.S., and McMahan, T.A. (2002). Modelling the impacts of climate change on Australian streamflow. Hydrological Processes 16, 1235-1245.
Chiew, F.H.S., Harrold, T.I., Siriwardena, L., Jones, R.N. and Srikanthan, R. (2003). Simualtion of climate change impact on runoff using rainfall scenarios that consider daily patterns of change from GCMs. Proceeding of Modsim 2003. International Congress on Modelling and Simulation. 14-17 July 2003 in Townsville, Queensland, Australia. pp 154-159.
Close, A.F. (1988). ‘Potential impact of greenhouse effect on the water resources of the River Murray’. In: Greenhouse: Planning for Climate Change. (Ed. G.I. Pearman). E. J. Brill. New York, pp 312-323.
Coram, J., Dyson, P. and Evans, R. (2000) An evaluation framework for dryland salinity. Bureau of Rural Sciences, Canberra.
Cornish, P.M. and Vertessy, R.A. (2001) Forest age-induced changes in ET and water yield in a eucalypt forest. Journal of Hydrology 242, 43-63.
Crockford, R.H. and Richardson, D.P. (2000) Partitioning of rainfall into throughfall, stemflow and interception: effects of forest type, ground cover and climate. Hydrological Processes 14, 2903-2920.

34
CSIRO (2005) Planning for climate change in the Murray Darling Basin. http://www.cmis.csiro.au/healthycountry/updates/apr05/story7.htm
Duncan, H.P. and Langford, K.J. (1977) Chapter 9. Streamflow Characteristics. In: Water Supply Catchment Hydrology Research, First Progress Report North Maroondah. (Eds. K.J. Langford and P.J. O’Shaughnessy). Melbourne and Metropolitan Board of Works Report No. MMBW-W-0005.
Dunn, G.M. and Connor, D. J. (1993) An analysis of sap flow in mountain ash (Eucalyptus regnans) forests of different age. Tree Physiology 13, 321-336.
England, J.R. and Attiwill, P.M. (2006) Changes in leaf morphology and anatomy with tree age and height in the broadleaved evergreen species, Eucalyptus regnans F. Muell. Trees 20, 79-90.
Feikema, P.M., Sheridan, G.J., Argent, R.M., Lane, P.N.J. and Grayson, R.B. (2005) Using E2 to model the impacts of bushfires on water quality in south-eastern Australia. Proceedings MODSIM 2005. Melbourne. pp. 1126-1132.
Gallant, J. van Dijk, A. I. J. M. and Leighton, B. (2005) FLUSH/3PG+/2C A farm-scale model of water yield and salinity changes after afforestation. Draft report to DAFF for the CEF Project.
Gill, M.A. and Catling, P.C. (2002) Fire regimes and biodiversity of forested landscapes of southern Australia. In: Flammable Australia: the Fire Regimes and Biodiversity of a Continent. (Eds. R. Bradstock, J. Williams and M. Gill). Cambridge University Press, Cambridge, UK. pp 351-369.
Harrold, T.J., Chiew, F.H.S. and Siriwardena, L. (2005). A method for estimating climate change impacts on mean and extreme rainfall and runoff. In: MODSIM 2005 International Congress on Modelling and Simulation. (Eds A. Zerger and R.M. Argent). Modelling and Simulation Society of Australia and New Zealand, December 2005, pp. 497-504.
Haydon, S.R., Benyon, R.G. and Lewis, R. (1996) Variation in sapwood area and throughfall with forest age in mountain ash (Eucalyptus regnans F. Muell.). Journal of Hydrology 187, 351-366.
Hennessy, K., Page, C., McInnes, K., Jones, R., Bathols, J., Collins, D. and Jones, D. (2004) Climate change in New South Wales. Part 1: past climate variability and projected changes in average climate.
Hennessy, K., Lucas, C., Nicholls, N., Bathols, J., Suppiah, R. and Rickets, J. (2005) Climate impacts on fire-weather in south-east Australia. CSIRO Report…..[penultimate draft version].

35
Herron, N., Davis, R. and Jones, R. (2002). The effects of large-scale afforestation and climate change on water allocation in the Macquarie River catchment, NSW, Australia. Journal of Environmental Management 65, 369-381.
Howe, C., Jones, R.N., Maheepala, S. and Rhodes, B. (2005). Melbourne Water Climate Change Study. Implications of potential climate change for Melbourne’s water resources. Melbourne Water.
Jones, R.M., Whetton, P.H., Walsh, K.J.E., and Page, C.M. (2002). Future Impacts of Climate Variability, Climate Change and Landuse Change on Water Resources in the Murray-Darling Basin: Overview and Draft Program of Rsearch, Canberra, ACT: Murray-Darling Basin Commission. CSIRO Division of Atmospheric Research, Apendale, Victoria.
Keenan, R.J., Parsons, M., O’Loughlin E., Gerrand, A., Beavis, S., Gunawardana D., Garvan, M. and Bigg, A. (2004) Water use by Australian Forest Plantations. Bureau of Rural Sciences.
Kirby, M., Chiew, F., Harle, K., Howden, M., Peel, M., Siriwardena, L. and Viney, N.P. (2003). Catchment water yield and water demand projections under climate change scenarios for the Australian Capital Territory. Consultancy Report for the ACT Electricity and Water. CSIIRO Division of Land and Water.
http://www.thinkwater.act.gov.au/documents/5Part2Summary.doc
Kirschbaum, M.U.F. (1999) Forest growth and species distributions in a changing climate. Tree Physiology 20, 309-322.
Kuczera, G.A. (1985) Prediction of water yield reductions following a bushfire in ash-mixed species eucalypt forest. Melbourne and Metropolitan Board of Works, Catchment Hydrology Research report, MMBW-W-0014.
Kuczera, G.A. (1987) Prediction of water yield reductions following a bushfire in ash-mixed species eucalypt forest. Journal of Hydrology 94, 215-236.
Landsberg, J.J., and Waring, R.H. (1997) A generalised model of forest productivity using simplified concepts of radiation-use efficiency, carbon balance and partitioning. Forest Ecology and Management 95, 209-228.
Lane, P.N.J and Mackay, S.M. (2001) Streamflow response of mixed-species eucalypt forests to patch cutting and thinning treatments. Forest Ecology and Management 143, 131-142.

36
Lane, P.N.J., Sheridan, G.J. and Noske, P.J. (2006) Changes in sediment loads and discharge from small mountain catchments following wildfire in south eastern Australia. Journal of Hydrology (in press).
Leuning, R., Cleugh, H.A., Zegelin, S.J. and Hughes, D. (2005) Carbon and water fluxes over a temperate Eucalyptus forest and a tropical wet/dry savanna in Australia: measurements and comparison with MODIS remote sensing estimates. Agricultural Forest Meteorology 129, 151-173.
Mackay, S.M. and Cornish, P.M. (1982). Effects of wildfire and logging on the hydrology of small catchments near Eden, NSW. The First Symposium on Forest Hydrology, The Institute of Engineers, Australia, National Conference Publication No. 82.
Maheepala, S., Perera, C. (2003) Climate change and reliability of urban water supply. Water Science and Technology 47, 101-108.
McArthur, A.G. (1967) Fire behaviour in eucalypt forests. Forest Research Institute Leaflet No. 107. Forestry and Timber Bureau, Canberra.
McCarthy, M.A. and Cary, G.J. (2002) Fire regimes in landscapes: models and realities. In: Flammable Australia: the Fire Regimes and Biodiversity of a Continent. (Eds. R. Bradstock, J. Williams and M. Gill). Cambridge University Press, Cambridge, UK. pp. 77–94.
Monteith J. L. (1965) Evaporation and environment. In: Proceedings of the 19th Symposium of the Society for Experimental Biology. Cambridge University Press, New York, NY, USA. pp. 205–233.
Munday, S., Nathan R., Daamen, C. and Cornish, P. (2001) Development and application of an Operations Model to Assess the Impact of Plantation Forestry on Water Yields. ModSIM 2001, International Congress on Modelling and Simulation. ANU. Australia.
O’Shaughnessy, P.J. and Jayasuriya, M.D.A. (1994) Third Progress Report - North Maroondah. Report No. MMBW-W-0017, Melbourne Water Corporation.159 pp.
Parsons, M., Gavran, M., Davidson, J. (2006) Australia’s Plantations 2006. Department of Agriculture, Fisheries and Forestry, Canberra. 60 pp.
Paul, K.I, Polglase, P.J., O'Connell, A.M., Carlyle, J.C., Smethurst, P.J., Khanna, P.K., Worledge, D. (2004) Soil water under forests (SWUF): a model of water flow and soil water content under a range of forest types. Forest Ecology and Management 182, 195-211
Polglase, P. and Attiwill, P. (1992) Nitrogen and phosphorus cycling in relation to stand age of Eucalyptus regnans F. Muell. I. Return from plant to soil in litterfall. Plant and Soil 142, 157-166.

37
Quayle, A., Hill, P., Daamen, C., Race, G. and Ryan, H. (2004) Bushfire Recovery Program. Impact of the 2003 alpine bushfires on streamflow. Task 1 – Broadscale Assessment. Report by SKM to Vic Department of Sustainability and Environment. SKM, Melbourne.
Roberts, S., Vertessy, R. and Grayson, R. (2001) Transpiration from Eucalyptus sieberi (L. Johnson) forests of different age. Forest Ecology and Management 143, 153-161.
Roderick, M.L. and Farquahar, G.D. (2002) The cause of decreased pan evaporation over the past 50 years. Science 298, 1410-1411.
Schreider, S. Yu., Jakeman, A.J., Pittock, A.B., and Whetton, P.H. (1996) Estimation of possible climate change impacts on water availability, extreme flow events and soil moisture in the Coulburn and Ovens Basins, Victoria. Climate Change 24, 513-546.
Schreider, S. Yu., Jakeman, A.J., Whetton, P.H., and Pittock, A.B. (1997) Estimation of climate impacts on water availability and extrme flow events for snow-free and snow-affects catchments of the Murray-Darling Basin, Australian Journal of Water Research 2, 35-46.
Silberstein, R., Vertessy, R. and Stirzaker, R. (2002) The basics of catchment hydrology. Chapter 2 in Stirzaker, R., Vertessy, R. and Sarre, A. (Editors) Trees, water and salt. An Australian guide to using trees for healthy catchments and productive farms. Publication number 01/086, Rural Industries Research and Development Corporation, Canberra, 159 pp.
Smith, J.M.B. and Guyer, I.J. (1983) Rainforest – eucalypt forest interactions and the relevance of the biological nomad concept. Australian Journal of Ecology 8, 55-60.
Van Dijk, A., Evans, R., Hairsine, P., Khan, S., Nathan, R., Paydar, Z., Viney, N. and Zhang, L. (2006) A systems view of water in the Murray Darling Basin. 2. Risks to our shared water resources. MDBC, Canberra.
Vertessy, R., O'loughlin, E., Beverly, E. and Butt, T. (1994) Australian experiences with the CSIRO Topog model in land and water resources management. In: Proceedings of UNESCO International Symposium on Water Resources Planning in a Changing World, Karlsruhe, Germany, June 28-30, 1994, pp. III-135-144.
Vertessy, R, Watson, F., O’Sillivan, S., Davis, S., Campbell, R., Benyon, R. and Haydon, S. (1998) Predicting water yield from mountain ash forest catchments. CRC Catchment Hydrology Report 98/4.
Vertessy, R.A., Watson, F.G.R. and O’Sillivan, S.K. (2001) Factors determining relations between stand age and catchment water balance in mountain ash forests. Forest Ecology and Management 143, 13-26.

38
Watson F.G.R., Vertessy R.A., Grayson R.B. (1999) Large-scale modelling of forest hydrological processes and their long-term effect on water yield. Hydrological Processes13, 689-700.
Watson F.G.R., Vertessy R.A., Grayson R.B., Band L.E. and McMahon T.A. (1997) Macaque:regional scale modelling of water yield from forested basins. Water 24, 10.
Watson F, Vertessy R., McMahon T., Rhodes B. and Watson I. (1999) The hydrologic impacts of forestry on the Maroondah catchments. Cooperative Research Centre for Catchment Hydrology. Report 99/1.
Watson, F.G.R., Vertessy, R.A., McMahon, T.A., Rhodes, B. and Watson, I. (2001) Improved methods to assess water yield changes from paired catchment studies: Application to the Maroondah catchments. Forest Ecology and Management 143, 189-204.
Whetton, P.H., Suppiah, R., McInnes, K.L., Hennesy, K.J. and Jones, R.N. (2002) Climate change in Victoria: high resolution regional assessment of climate change impacts. Victorian Department of Natural Resources and Environment.
White, D.A., Turner, N.C. and Galbraith, J.H. (2000) Leaf water relations and stomatal behaviour of four allopatric Eucalyptus species in Mediterranean south-western Australia. Tree Physiology 20, 1157-1165.
Whitehead, D. (1998) Regulation of stomatal conductance and transpiration in forest canopies. Tree Physiology 18, 633-644.
Williams, C.A., Albertson, J.D. (2005) Contrasting short- and long-timescale effects of vegetation dynamics on water and carbon fluxes in water-limited ecosystems. Water Resources Research 41(6), 13. p.
Williams, A.A.J, Karoly, D.J. and Tapper, N. (2001) The sensitivity of Australian fire danger to climate change. Climate Change 49, 171-191.
Zhang, L., Dawes, W.R. and Walker, G.R. (1999) Predicting the effect of vegetation changes on catchment average water balance. CRC for Catchment Hydrology Technical Report, 99/12.
Zhang, L., Dawes, W.R. and Walker, G.R., (2001) The response of mean annual ET to vegetation changes at catchment scale. Water Resources Research 37, 701-708.

39