predicting the crushing behaviour of composite material ... element modelling ... composite...
TRANSCRIPT

Predicting the crushing behaviour of composite material using high-fidelity finite element modelling
Tan, W., Falzon, B. G., & Price, M. (2015). Predicting the crushing behaviour of composite material using high-fidelity finite element modelling. International Journal of Crashworthiness, 20(1), 60-77. DOI:10.1080/13588265.2014.972122
Published in:International Journal of Crashworthiness
Document Version:Peer reviewed version
Queen's University Belfast - Research Portal:Link to publication record in Queen's University Belfast Research Portal
Publisher rightsCopyright 2014 Taylor & Francis.This is an Accepted Manuscript of an article published by Taylor & Francis in the International Journal of Crashworthiness on 07/11/2014,available online: http://wwww.tandfonline.com/10.1080/13588265.2014.972122.
General rightsCopyright for the publications made accessible via the Queen's University Belfast Research Portal is retained by the author(s) and / or othercopyright owners and it is a condition of accessing these publications that users recognise and abide by the legal requirements associatedwith these rights.
Take down policyThe Research Portal is Queen's institutional repository that provides access to Queen's research output. Every effort has been made toensure that content in the Research Portal does not infringe any person's rights, or applicable UK laws. If you discover content in theResearch Portal that you believe breaches copyright or violates any law, please contact [email protected].
Download date:24. May. 2018

1
Predicting the crushing behaviour of composite material using high-fidelity
finite element modelling
Wei Tan, Brian G. Falzon*, Mark Price
School of Mechanical and Aerospace Engineering, Queen’s University Belfast, Ashby
Building, Belfast, BT9 5AH, UK
* Corresponding author: [email protected] (B.G. Falzon)
Tel: +44 (0)28 9097 5640

2
Predicting the crushing behaviour of composite material using high-fidelity
finite element modelling
The capability to numerically model the crushing behaviour of composite structures
will enable the efficient design of structures with high specific energy absorption
capacity. This is particularly relevant to the aerospace and automotive industries where
cabin structures need to be shown to be crashworthy. In this paper, a three-dimensional
damage model is presented, which accurately represents the behaviour of composite
laminates under crush loading. Both intralaminar and interlaminar failure mechanisms
are taken into account. The crush damage model was implemented in
ABAQUS/Explicit as a VUMAT subroutine. Numerical predictions are shown to agree
well with experimental results, accurately capturing the intralaminar and interlaminar
damage for a range of stacking sequences, triggers and composite materials. The use of
measured material parameters required by the numerical models, without the need to
‘calibrate’ this input data, demonstrates this computational tool’s predictive
capabilities.
Keywords: damage mechanics; finite element analysis; crushing response; composite
damage model
1. Introduction
Composite materials are finding increasing utilisation in a number of transportation industries
concerned with making structures lighter to reduce environmental impact and improve
efficiency. The aerospace industry [38] has been at the forefront of this endeavour with the
automotive [24] and railway industries [7] embarking on similar strategies. A major
challenge in the development of land-based mass-transportation fibre-reinforced polymer
composite vehicles is ensuring a prescribed level of crashworthiness [27]. Crashworthiness is
the ability of a structure to protect its occupants during a crash event. While the potential
superior energy absorbing capacity of carbon-fibre composite structures is repeatedly
demonstrated in Formula One racing [9], the design of a cost-effective crashworthy carbon-
fibre reinforced polymer (CFRP) automotive passenger cabin has yet to be realised.

3
Composite structures typically fail through a complex sequence of interacting fracture
mechanisms involving fibre pullout/fracture, matrix cracking and delamination. The actual
mechanism and sequence of damage are highly dependent on the mechanical properties [33],
geometry [42], lamina orientation [40, 53], trigger mechanisms [23, 44, 57] and, depending
on the constituent materials, strain rate; e.g., while strain rate effects are not significant in
carbon-fibre thermoset composites, they are in glass-fibre composites [5]. A number of these
properties can be tailored to develop high energy absorbing crashworthy components.
However, current assessment of composite structures, under crush loading, relies on
extensive, costly and time-consuming experimental testing [20, 25, 29, 35, 42, 44-46, 58, 59].
It is therefore desirable to develop a cost-effective computational approach to predict the
response of composite structures during crushing. Many researchers have made efforts to
improve the accuracy of numerical models for simulating composite crushing, using finite
element analysis [31, 41, 60]. Kiani et al. [32] employed shell elements to study the
crashworthiness of pultruded glass-polyester tubes under axial impact loading, in LS-DYNA,
and investigated the sensitivity of the major modelling parameters. A continuum damage
mechanics based model, also implemented in LS-DYNA, was used by McGregor et al. [39]
to simulate the damage propagation and energy absorption in the dynamic crushing of
braided composite tubes. A similar model, presented by Sokolinsky et al. [56], investigated a
corrugated carbon-epoxy fabric composite plate subjected to quasi-static crushing, where the
intralaminar failure and the delamination response were simulated using in-built damage and
cohesive surface laws in ABAQUS/Explicit. A steeple-type triggering mechanism, which
ensures a continuous stable crushing mode of failure, was used to simulate the response of
self-supporting carbon-epoxy hat-shaped crush elements with the software package PAM-
CRASH [28, 29]. A plug-in tool for ABAQUS/Explicit, CZone, which is dependent on
empirical coupon and component data to generate input parameters for the computational

4
model, was employed to simulate the crushing of large scale structures [55]. CZone handles
the material behaviour at the crush front, while the in-built failure model in ABAQUS deals
with the integrity of the surrounding structure.
Other investigators have developed more accurate approaches on the basis of
improved interlaminar and intralaminar damage models. Pinho et al. [47] proposed a
numerical model for the crushing simulation of fibre-reinforced composite materials. The
propagation was modelled using cohesive elements to account for the energy involved in the
crushing process. Palanivelu et al. [43] used cohesive elements in an axial impact loading on
circular and square cross sectional pultruded composite tubes, focusing on the numerical
modelling of triggering. A cohesive element formulation was also employed by Fleming [18]
to model composite crush initiation. An energy-based constitutive model was employed by
Chiu et al. [11] to model the behaviour of carbon fibre reinforced epoxy resin composite
material under crush loading. New contributions were made to this model [15] to enhance its
performance under complex loading and damage interaction. Israr et al. [26] presented a
pseudo-2D finite element model for mixed-mode crushing in laminated plates by introducing
a free-face-crushing concept to represent localized crushing, similar to a strain-based element
deletion criterion.
To validate these composite damage models, many self-supporting specimens such as
tubes [39], tube segment [28], corrugated [20, 56] and hat-shaped specimens [29] were
typically utilized. Nonetheless, circular or corrugated shapes are comparatively difficult to
manufacture and to deduce the material failure features. Alternatively, a simple wedge
specimen was designed [21, 25, 26], which is adequate for understanding the failure
behaviour, under crushing, by investigating the crushing morphology, specific energy
absorption (SEA) and force-displacement curve. This paper will further show the
appropriateness of these test specimens for model validation.

5
In this context, improvements have been made to the composite damage model by
Falzon et al. [11, 14-16], which include a unified matrix damage initiation criterion, mixed-
mode intralaminar damage progression and a robust element deletion strategy, to simulate the
crushing process on wedge specimens of different composite material, lay-up and trigger
chamfer angle. The predictive capabilities of the model are confirmed by validating with
experimental results obtained from the literature [21, 25, 26].
2. Composite damage model
2.1 Constitutive law
Various intralaminar composite damage models have been presented in the literature in recent
years, focusing on the application of continuum damage mechanics (CDM) as proposed by
Kachanov [30] and further developed by Lemaitre and Chaboche [36]. A number of the
computational damage models reported, have also adopted Puck and Shurmann’s [51]
phenomenological methodology for determining the initiation of matrix fracture.
Contributions to the characterisation of longitudinal (fibre-dominated) compressive failure
were reported by Pinho et al. [48]. Donadon et al. [13] and Falzon et al. [14-16] presented a
three dimensional (3D) CDM-based material model to investigate the progressive
intralaminar degradation of composite laminates.
This approach makes use of an effective stress tensor, �̃�, which represents the stresses
transmitted across the intact part of the cross-section in a Representative Volume Element
(RVE) and is related to the true stress tensor, 𝜎, by a damage tensor, D,
𝜎 = 𝑫�̃� (1)
The damage tensor is a function of three monotonically increasing damage variables, bound
by 0 (no damage) and 1 (complete failure) , each one relating to a form of damage mode
under a different loading state. 𝑑11𝑇 refers to tensile damage in the fibre direction, 𝑑11
𝐶 refers to

6
compressive damage in the fibre direction and 𝑑𝑚𝑎𝑡 refers to matrix cracking due to a
combination of transverse tension/compression and shear loading.
Assuming strain equivalence, the undamaged material elasticity matrix, 𝐂, relates the
strain tensor to the effective stress tensor,
�̃� = 𝐂ε, (2)
where
𝐂 =
[ 1 − 𝜈23𝜈32𝐸22𝐸33Ψ
𝜈21 + 𝜈31𝜈23𝐸22𝐸33Ψ
𝜈31 + 𝜈21𝜈32𝐸22𝐸33Ψ
𝜈12 + 𝜈13𝜈32𝐸11𝐸33Ψ
1 − 𝜈31𝜈13𝐸11𝐸33Ψ
𝜈32 + 𝜈31𝜈12𝐸11𝐸33Ψ
𝜈13 + 𝜈12𝜈23𝐸22𝐸11Ψ
𝜈23 + 𝜈13𝜈21𝐸22𝐸11Ψ
1 − 𝜈12𝜈21𝐸22𝐸11Ψ
𝐺12𝐺23
𝐺13]
(3)
and Ψ =1−𝜈12𝜈21−𝜈23𝜈32−𝜈31𝜈13−2𝜈12𝜈23𝜈31
𝐸11𝐸22𝐸33.
Combining Eq. 1 and 2 leads to:
𝜎 = 𝑫𝑪𝜀 (4)
In order to maintain a positive definite elasticity matrix, 𝑪, the Poisson’s ratios must also be
degraded when damage has initiated,
𝜈𝑖𝑗,𝑑
𝐸𝑖𝑖,𝑑=𝜈𝑖𝑗(1 − 𝑑)
𝐸𝑖𝑖(1 − 𝑑)=𝜈𝑗𝑖(1 − 𝑑)
𝐸𝑗𝑗(1 − 𝑑)=𝜈𝑗𝑖,𝑑
𝐸𝑗𝑗,𝑑, 𝑖, 𝑗 = 1,2,3 (5)
where 𝑑 is either 𝑑11𝑇 , 𝑑11
𝐶 or 𝑑𝑚𝑎𝑡.
2.2 Intralaminar damage model
2.2.1 Longitudinal (fibre-dominated) failure modes
The material response in the longitudinal direction is assumed to be bilinear for both tensile

7
and compressive loading with corresponding damage initiation stresses and fracture
toughness [14]. A bilinear law (Fig. 1) is suitable for the modelling of failure in that it yields
a rise in the damage parameter which resembles the exponential increase in the damage
function derived from the cumulative distribution of a Weibull probability density function of
fibre strength [4]. A strain-based failure initiation criterion is used where an initiation
function (𝐹11𝑇 and 𝐹11
𝐶 for tension and compression, respectively) is defined,
𝐹11𝐶 (𝜀11) = (
𝜀11
𝜀11𝑂𝐶)
2
≥ 1 (6)
𝐹11𝑇 (𝜀11) = (
𝜀11
𝜀11𝑂𝑇)
2
≥ 1 (7)
The initiation strains (𝜀11𝑂𝑇 and 𝜀11
𝑂𝐶 for tension and compression, respectively) are determined
by the measured strengths in the respective directions. When the initiation function reaches
unity, damage begins to grow and the transmitted stress is gradually reduced to zero,
𝜎11𝑇(𝐶)
= (1 − 𝑑11𝑇(𝐶))�̃�11
𝑇(𝐶). (8)
Fig. 1. Bilinear law for tension and compression (shaded area is volumetric strain energy
density, 𝑔11𝑇(𝐶)
)
The area under the traction-separation curve is the volumetric energy density and the damage
parameter associated with loading in the fibre direction is given by
𝑑11𝑇(𝐶)(𝜀11) =
𝜀11𝐹𝑇(𝐶)
𝜀11𝐹𝑇(𝐶)
−𝜀11𝑂𝑇(𝐶) (1 −
𝜀11𝑂𝑇(𝐶)
𝜀11), 𝜀11 > 𝜀11
𝑂𝑇(𝐶) (9)

8
where the failure strain, 𝜀11𝐹𝑇(𝐶)
, at which net-section fracture across the element occurs, is
determined by the critical energy release rate Γ11𝑇(𝐶)
, longitudinal strength 𝑋𝑇(𝐶) and
characteristic length 𝑙𝑐,
𝜀11𝐹𝑇(𝐶)
=2𝑔11
𝑇(𝐶)
𝑋𝑇(𝐶) =2Γ11
𝑇(𝐶)
𝑋𝑇(𝐶) 𝑙𝑐 → 𝑙𝑐 ≤
2Γ11𝑇(𝐶)
𝑋𝑇(𝐶) 𝜀11𝑂𝑇(𝐶)
(10)
An accurate measure of the characteristic length is the ratio of the elemental volume 𝑉 and
fracture plane 𝐴, 𝑙𝑐 =𝑉
𝐴, where A is calculated using an approach proposed in [11]. This
ensures the overall energy dissipation is consistent between different mesh configurations,
yielding a degree of mesh independence.
2.2.2 Matrix failure modes
Matrix failure is characterised by matrix cracking either longitudinally or transversely with
respect to the fibre direction. Transverse (22), through-thickness (33) normal stresses, as well
as shear stresses (12, 13 and 23 directions) lead to matrix-dominated failure modes. The non-
linear constitutive response of the matrix is accounted for in the present model. Following the
approach presented by Puck and Schürmann [51], the orientation of the intralaminar matrix
fracture plane, within an RVE, will be a function of the 3D stress state acting on that element.
The orientation is determined at the onset of damage initiation and maintained in the
subsequent progression of this damage mode within the RVE, as shown in Fig. 2.
Fig. 2. Coordinate system (123) rotated to the fracture plane (LNT)
The stress tensor acting on the fracture plane, 𝜎𝐿𝑁𝑇 = {𝜎𝐿𝑁, 𝜎𝑁𝑇, 𝜎𝑁𝑁}𝑇 , is rotated using the
standard transformation matrix 𝑇(θ),

9
𝜎𝐿𝑁𝑇 = [𝑇(θ)]𝜎123[𝑇(θ)]𝑇 (11)
𝜀𝐿𝑁𝑇 = [𝑇(θ)]𝜀123[𝑇(θ)]𝑇 (12)
𝑇(θ) = [1 0 00 cos 𝜃 sin 𝜃0 −sin 𝜃 cos 𝜃
] (13)
Non-linear shear response of the matrix
The matrix failure initiation criterion is based on the stress state acting on the fracture plane,
assuming a pre-damage linear normal stress 𝜎𝑁𝑁 and non-linear shear stresses 𝜏𝐿𝑁(𝑁𝑇). In this
context, the non-linear shear stress profiles were defined by a cubic law, obtained using a
least square fit of experimental data,
𝜏(𝛾𝑖𝑗) = 𝑐1𝛾𝑖𝑗3 − 𝑠𝑔𝑛(𝛾𝑖𝑗)𝑐2𝛾𝑖𝑗
2 + 𝑐3𝛾𝑖𝑗, (14)
where ci are the corresponding coefficients. The non-linear shear is expressed as the sum of
an elastic and inelastic component,
𝛾𝑖𝑗 = 𝛾𝑖𝑗,𝑒𝑙 + 𝛾𝑖𝑗,𝑖𝑛 𝑖 ≠ 𝑗. (15)
Prior to damage initiation, shear loading and unloading occurs along gradients defined by the
initial shear modulus, 𝐺𝑖𝑗, shown by paths 1 and 2 in Fig. 3. When damage is triggered, at 𝜏0,
the response follows a negative tangent stiffness resulting in the softening of the secant shear
modulus, with increasing applied strain, to (1 − 𝑑𝑚𝑎𝑡)𝐺𝑖𝑗, e.g. path 3. Isotropic hardening
was adopted to deal with load reversal.
Fig. 3. Non-linear shear curve with kinematic hardening
Matrix damage initiation
Puck and Schürmann’s [51] criterion is widely used for predicting matrix damage behaviour.

10
However, for matrix tensile failure, this criterion provides reasonable predictions only if
certain relations between material strengths are satisfied. For instance, under pure transverse
tension, the criterion provides correct predictions only if 𝑌𝑇 ≤ √2𝑆23, where 𝑌𝑇 is the
transverse tensile strength. The failure initiation criterion based on Catalanotti et al. [10]
overcomes this limitation and was adopted in the damage model.
If the normal stress in the fracture plane is compressive, 𝜎𝑁𝑁 ≤ 0, then
𝐹(𝜃) = (𝜏𝐿𝑁
𝑆12 − 𝜇𝐿𝑁 𝜎𝑁𝑁)2
+ (𝜏𝑁𝑇
𝑆23 − 𝜇𝑁𝑇 𝜎𝑁𝑁)2
(16)
and if the normal stress in the fracture plane, is tensile, 𝜎𝑁𝑁 > 0
𝐹(𝜃) = (𝜎𝑁𝑁𝑆23
)2
+ (𝜏𝐿𝑁𝑆12
)2
+ (𝜏𝑁𝑇𝑆23
)2
+ 𝜆 (𝜎𝑁𝑁𝑆23
) (𝜏𝐿𝑁𝑆12
)2
+ 𝜅 (𝜎𝑁𝑁𝑆23
) (17)
Where parameters 𝜅 and 𝜆 are given by 𝜅 =𝑆232 −(𝑌𝑇)
2
𝑆23𝑌𝑇, 𝜆 =
2𝜇𝐿𝑁𝑆23
𝑆12− 𝜅, 𝑆12 and 𝑆23 are the
shear strengths.The transverse friction coefficients, defined in [13], are based on Mohr-
Coulomb theory where 𝜇𝑁𝑇 = −1
tan(2𝜃𝑓), 𝑆23 =
𝑌𝐶
2 tan(𝜃𝑓) and 𝜇𝐿𝑁 =
𝑆12
𝑆23𝜇𝑁𝑇, 𝑌𝐶 is the
transverse compressive strength. The fracture plane orientation, 𝜃𝑓, is typically found to be
approximately 53° for unidirectional composites [13] under uniaxial transverse compressive
loading. For a general 3D load state, the orientation is not known a priori and is determined
by the angle which maximizes the failure criteria functions of Eq. (16) or Eq. (17). Brent’s
algorithm [50] was used for this purpose which combines a golden section search with
parabolic interpolation.
Matrix damage propagation
Matrix-dominated failure is attributed to loading in transverse compression and shear and a
single damage parameter, 𝑑𝑚𝑎𝑡 , was used to define the degradation of the combined stress

11
state, 𝜎𝑟,
𝜎𝑟 = √⟨𝜎𝑁𝑁⟩2 + (𝜏𝑁𝑇)2 + (𝜏𝑁𝐿)2 (18)
with corresponding strain, 𝜀𝑟, acting on the fracture plane [14, 52], defined as the vector sum
of the elastic and inelastic components, 𝜀𝑟 = 𝜀𝑟,𝑒𝑙 + 𝜀𝑟,𝑖𝑛, where
𝜀𝑟,𝑒𝑙 = √⟨𝜀𝑁𝑁⟩2 + (𝛾𝑁𝑇𝑒𝑙 )
2+ (𝛾𝑁𝐿
𝑒𝑙 )2 (19)
𝜀𝑟,𝑖𝑛 = √(𝛾𝑁𝑇𝑖𝑛 )
2+ (𝛾𝑁𝐿
𝑖𝑛 )2 (20)
and ⟨𝑥⟩ is the McCauley operator, where ⟨𝑥⟩ = max (0, 𝑥). Fig. 4 shows the overall damage
propagation for mixed-mode matrix damage where
𝑑𝑚𝑎𝑡 =𝜀𝑟𝑓− 𝜀𝑟,𝑖𝑛
0
𝜀𝑟𝑓− 𝜀𝑟
0(𝜀𝑟0 − 𝜀𝑟
𝜀𝑟 − 𝜀𝑟,𝑖𝑛0 ) (21)
The shear stresses on the fracture plane are degraded by the matrix-dominated damage
parameter 𝑑𝑚𝑎𝑡,
𝜎𝐿𝑁 = (1 − 𝑑𝑚𝑎𝑡)�̃�𝐿𝑁,
𝜎𝑁𝑇 = (1 − 𝑑𝑚𝑎𝑡)�̃�𝑁𝑇 ,
𝜎𝑁𝑁 = �̃�𝑁𝑁 − 𝑑𝑚𝑎𝑡⟨�̃�𝑁𝑁⟩.
(22)
These stresses are then transformed back to the material coordinate system to form the
complete stress tensor of the damaged element.
The overall shear loading and unloading (Fig. 4) occurs along gradients defined by the
initial shear modulus 𝐺𝑟̅̅ ̅, given as,
𝐺𝑟̅̅ ̅ =𝜎𝑟0
𝜀𝑟,𝑒𝑙0 (23)

12
Fig. 4. Mixed-mode matrix damage evolution
The corresponding damage parameter, 𝑑𝑚𝑎𝑡, is assumed to be a function of the resultant strain, 𝜀𝑟0, at
damage initiation and the failure resultant strain, 𝜀𝑟𝑓, which is governed by the mixed-mode critical
strain energy release rate, Γ𝑟 and characteristic length, 𝑙𝑚𝑎𝑡 , given in the next section, where
𝜀𝑟𝑓=
2
𝜎𝑟0 (
𝛤rC
𝑙𝑚𝑎𝑡− 𝑔0) + 𝜀𝑟
0 . (24)
The volumetric strain energies, at damage initiation, associated with each stress component on the
fracture plane, are combined using a quadratic relationship, which can be represented by the dashed
region in Fig.5,
𝑔0 = 𝑔𝑁𝑁0 (
⟨𝜎𝑁𝑁0 ⟩
𝜎𝑟0 )
2
+ 𝑔𝐿𝑁0 (
𝜏𝐿𝑁0
𝜎𝑟0 )
2
+ 𝑔𝑁𝑇0 (
𝜏𝑁𝑇0
𝜎𝑟0 )
2
(25)
The volumetric strain energy associated with each stress component, 𝑔𝑖0, where i denotes 𝑁𝑁, 𝐿𝑁
and 𝑁𝑇, is given by
𝑔𝑖0 = ∫ 𝜎𝑖𝑑𝜀𝑖
𝜀𝑖0
0. (26)
The critical mixed-mode strain energy release rate, 𝜞𝒓𝑪, is then given by
𝛤rC = Γ22
𝐶 (𝜎𝑁𝑁0
𝜎𝑟0 )
2
+ Γ12𝐶 (
𝜏𝐿𝑁0
𝜎𝑟0 )
2
+ Γ23𝐶 (
𝜏𝑁𝑇0
𝜎𝑟0 )
2
(27)
where Γ𝑖𝑗𝐶(𝑖𝑗 = 22,12,23) , are the corresponding critical strain energy release rates for each
stress component.
2.3 Interlaminar damage model
The in-built surface-based cohesive behaviour in ABAQUS/Explicit [12] was used to capture
delamination using a bilinear traction-separation relationship. Failure initiation was governed
by a quadratic stress criterion and delamination was propagated using a mixed-mode

13
relationship proposed by Benzeggagh and Kenane [8], where the associated curve-fitting
parameter, 𝜂, for the two materials used in this study, is given in Tables 2 and 3.
2.4 Crush mechanisms
The crushing morphology can be generally categorised by two primary failure modes, as
shown in Fig. 5: (i) fragmentation mode – sequential damage of material at the micro-
structural level, involving interlaminar crack growth and the fracturing of laminar bundles,
and (ii) splaying mode – formation of continuous fronds in combination with transverse
tearing, interlaminar and longitudinal crack growth. Note too, the creation of considerable
debris during the crushing process.
Fig. 5. Failure modes associated with crushing
The crashworthiness capacity can be evaluated from the specific energy absorption (SEA),
𝐸𝑠, defined as the energy absorbed per unit mass of material. With reference to Fig. 6, the
area under the load (𝐹)- displacement (𝑆) curve is the total energy absorbed, 𝑊, in the
crushing process and
𝐸𝑠 =𝑊
𝑚=∫𝐹𝑑𝑆
𝜌𝑉 , (28)
where 𝜌 is the material density, and V is the volume of crushed material.
Fig. 6. Idealised load versus displacement curve during crushing

14
For the particular wedge-shaped specimen used in this study (Fig. 7) the crushed volume is
given by the product of planar area, 𝐴, and the width of the specimen, L
Fig. 7. Wedge-shaped specimen
𝐴 =
{
0.5𝑆2
tan 𝜃, 𝑆 ≤ 𝑆𝑢
0.5𝑆𝑢2
tan 𝜃+ (𝑆 − 𝑆𝑢)𝑇, 𝑆𝑢 < 𝑆 ≤ 𝑆𝑡
(29)
Where 𝑆𝑢 and 𝑆𝑡 are the lengths of the upper part and the total wedge respectively, and 𝑇 is
the thickness of the specimen. In addition, the peak load ,𝑃, is considered one of the critical
design parameters which should be minimised to prevent severe injury to passengers [27].
Consequently, an ideal crashworthy component achieves the maximum SEA with minimum
peak load. To compare specimens with different geometries (width and thickness), the peak
stress 𝑆 is used,
𝑆= 𝑃/𝐴𝑐𝑟𝑜𝑠𝑠 (30)
Where 𝐴𝑐𝑟𝑜𝑠𝑠 is the full cross sectional area of the specimen.
3. Model validation
3.1 Experimental set-up
3.1.1 Test set-up and specimens
A series of experimental results taken from [21, 25, 26] were used to validate the damage
model and assess the model’s capacity to predict the crushing process. The finite element
model of the experimental set-up is shown in Fig. 8, where quasi-static crushing tests were
performed using a hydraulic testing machine at a constant crosshead displacement rate of

15
6mm/min. The non-clamped length was set to 30mm for the crossply laminate specimens and
10mm for the thinner unidirectional (UD) laminate specimens.
Fig. 8. Finite element model of test set-up
A summary of specimen geometries and materials is given in Table 1. Specimens A to D
were made from T700/M21 UD plies, with different lay-ups and triggers (chamfer-angles 20˚
and 45˚). Specimen E was made from T700/MTM57 UD plies, with a stacking sequence of
[(90˚)8].
Table 1. Specimen configurations
3.1.2 Material Properties
Material properties for T700/M21 were obtained from [26] and those for T700/MTM57 from
a related reference [21]. These are given in Table 2 and Table 3 where it is noted that the
coefficients, c𝑖(𝑖 = 1,2,3), for the non-linear shear response were obtained using a least
square fit of experimental data presented in [49] and [21] respectively. Γ𝑗𝑗𝑑𝑖𝑟 denotes the
longitudinal (𝑗𝑗 = 11) and transverse ( 𝑗𝑗 = 22) intralaminar fracture toughness in tension
(𝑑𝑖𝑟 = 𝑇) and compression (𝑑𝑖𝑟 = 𝐶) These properties were obtained using compact tension
and compact compression specimens as described in [34] and based on ASTM standard tests
[2]. 𝐺𝐼 and 𝐺𝐼𝐼 are the interlaminar fracture toughness for mode I, obtained from ASTM test
method D5528-01 [1], and mode II, obtained from a 4-point bend end notch flexure test[54].
A three-point bend, end notch flexure test method is also currently under development by
ASTM [3]. The density of T700/M21 and T700/MTM57 is 1.5 g/cm3 and 1.52 g/cm3
respectively.

16
Table 2. Material properties of T700/M21 for numerical simulation [26]
Table 3. Material properties of T700/MTM57 for numerical simulation [21]
3.2 Finite element modelling
3.2.1 Model definition
Virtual wedge specimens were created in ABAQUS/Explicit 6.11. The non-clamped part was
meshed using an approximate element size of 0.25mm in the longitudinal and transverse
directions as shown in Fig. 9, while for the clamped part the mesh size was approximately
2mm. In order for C3D8R elements to capture the bending behaviour, three elements through
the thickness of each ply were used. To suppress spurious energy modes, an enhanced
stiffness-based hourglass and distortion control were employed [12].
The surface based cohesive behaviour was employed to capture delamination between
adjacent plies. A general contact algorithm was utilised to generate a contact force between
contact surfaces. ‘Hard’ contact conditions were defined between the platen and the plies as
well as adjacent plies. The platen was modelled as an analytical rigid surface. The friction
coefficients were set to 0.2 for T700/M21 and 0.3 for T700/MTM57 [21]. The computational
loading speed was fixed at 1m/s to reduce the CPU time whilst ensuring that the quality of
the results was not affected by inertial effects. Selective mass scaling, which only scaled
elements whose stable time increment was below 1e-07 s, was also employed during the
crushing process to achieve a reasonable run time. Models were run on a Windows Cluster
with 16 CPUs with a run time of between 6 and 8 hours, depending on the specimen type.

17
3.2.2 Element deletion strategy
A challenge which is faced in the modelling of composite crushing concerns the handling of
highly distorted elements. The current damage model accounts for different damage modes
and there are often instances when considerable matrix damage has been accumulated but
fibre-dominated damage has yet to be activated. This would imply that an element may still
be able to support subsequent loading and deleting an element on the basis of accumulated
damage in one mode may be premature, reducing the accuracy of the simulation. On the other
hand, the failure in one mode may result in a high level of element distortion which may lead
to the solution aborting. Increasing the robustness of the solution process involves balancing
these two considerations.
An efficient strategy for determining when element deletion is likely to have to be
invoked, due to element distortion, is to track the value of the determinant of the Jacobian
operator (det 𝐉) [6] and delete the element if this value approaches zero. As 𝐉 is not available
directly from ABAQUS/VUMAT, and adding this calculation to the subroutine would incur
an additional computational cost, the strategy adopted was to interrogate the determinant of
the deformation gradient (det 𝐅) which is available directly from ABAQUS. Det 𝐅 yields the
ratio of the deformed, V, and undeformed, V0, volume of an element,
det 𝐅 =𝑉
𝑉0 , (31)
and provides a reasonable indication of element distortion. The overall element distortion
criterion was subsequently based on both the fibre-dominated longitudinal damage parameter,
𝑑11𝑇(𝐶)
, and limits on det F for tracking large changes in element volume,
Delete element if { 𝑑11𝑇(𝐶) > 0.99
det 𝐅 < 0.8 𝑜𝑟 det 𝐅 > 1.6 (32)
The limits on det 𝐅 are user defined and the quoted values were found to yield good results.

18
4. Results and discussion
Specimens with different stacking sequences (A-C in Table 1) but with the same chamfer
angle of 20˚ were modelled to determine the predictive capability of the damage model in
capturing the experimentally-observed variations in their crush behaviour, reported in [25,
26]. Specimen D, with a larger chamfer angle of 45˚, was included to compare the trigger
effect. In addition, specimen E was manufactured with a different resin.
4.1 Lay-up
4.1.1 [(0˚/90˚)4]s with a 20˚ chamfer angle
The numerical results in Fig. 9a achieved excellent qualitative correlation with the
experimental crushing morphologies. The global force-displacement response (Fig. 9b)
further confirms the quantitative accuracy of the present damage model. The numerical
oscillations are the result of element deletion laws invoked as part of the solution. At the
beginning of the crushing process (stage 1), damage was primarily in the form of local
fragmentation due to intralaminar damage. From stage 1 to stage 2, the reaction force
increased gradually to the peak load at which point the entire uniform cross-section of the
crush element came in contact with the platen (displacement, 𝑆 = 1.5𝑚𝑚). Afterwards,
extensive delamination initiated with a splaying mode (stage 3), leading to a sudden drop in
the reaction force. The specimen underwent some bending as the chamfer was being
consumed. From stage 4 to 6, mixed-mode damage with fragmentation in the middle plies
and splaying in the outer plies was observed. Internal debris was created and acted like a
‘wedge’ in driving delamination.

19
Fig. 9. (a) Experimental morphologies [25] and numerical matrix damage contour; (b) force-
displacement curve of crushing test on [(0˚/90˚)4]s specimen; (c) energy dissipation-
displacement curves
The evolution of energy dissipated through various mechanisms during crushing is illustrated
in Fig. 9c, Fig. 10d, Fig. 11c, Fig. 12c and Fig. 14c for all specimens tested, verifying the
energy balance relationship between external work done and energy absorbed. In all of these
cases, the majority of energy was dissipated through intralaminar damage, followed by
friction between the crushing platen and specimen, and delamination. The small amount of
viscous energy dissipated is due to the use of the Bulk Viscosity Method [37] to damp out
spurious oscillations in explicit dynamic simulations. Most of the energy in this crushing
event was dissipated at the initial stage (i.e. displacement from 0mm to 2mm in Fig. 9c) of
the crushing process, when the reaction force increased dramatically as the chamfer was
gradually consumed. Hence the energy dissipated was primarily due to fragmentation rather
than splaying.
4.1.2 [0˚]8 with a 20˚ chamfer angle
Fig. 10a shows good agreement between the morphology observed from experimental and
numerical results. The predicted matrix-dominated damage contours indicate extensive
fragmentation at the initial loading stages. The longitudinal compressive damage and
delamination can be observed in Fig. 10b. The global crush response correlates well with the
experimental results where the initial contact response and maximum force were all predicted
with good accuracy (Fig. 10c).
20
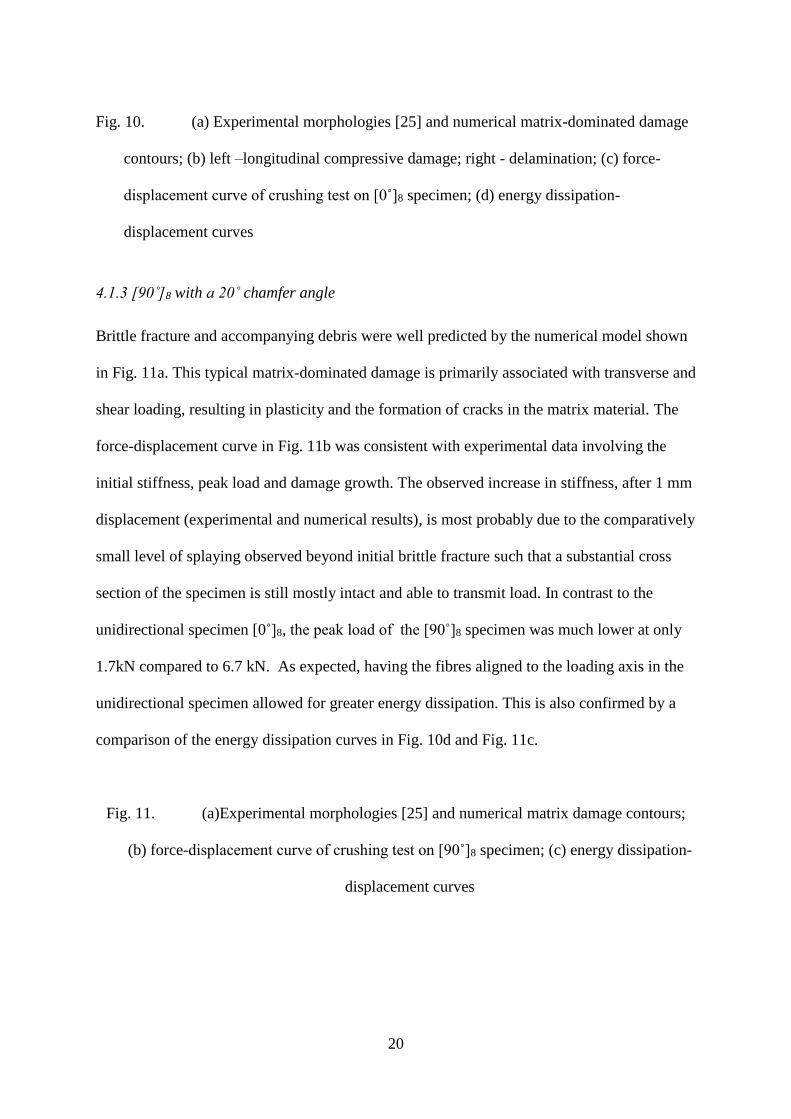
Fig. 10. (a) Experimental morphologies [25] and numerical matrix-dominated damage
contours; (b) left –longitudinal compressive damage; right - delamination; (c) force-
displacement curve of crushing test on [0˚]8 specimen; (d) energy dissipation-
displacement curves
4.1.3 [90˚]8 with a 20˚ chamfer angle
Brittle fracture and accompanying debris were well predicted by the numerical model shown
in Fig. 11a. This typical matrix-dominated damage is primarily associated with transverse and
shear loading, resulting in plasticity and the formation of cracks in the matrix material. The
force-displacement curve in Fig. 11b was consistent with experimental data involving the
initial stiffness, peak load and damage growth. The observed increase in stiffness, after 1 mm
displacement (experimental and numerical results), is most probably due to the comparatively
small level of splaying observed beyond initial brittle fracture such that a substantial cross
section of the specimen is still mostly intact and able to transmit load. In contrast to the
unidirectional specimen [0˚]8, the peak load of the [90˚]8 specimen was much lower at only
1.7kN compared to 6.7 kN. As expected, having the fibres aligned to the loading axis in the
unidirectional specimen allowed for greater energy dissipation. This is also confirmed by a
comparison of the energy dissipation curves in Fig. 10d and Fig. 11c.
Fig. 11. (a)Experimental morphologies [25] and numerical matrix damage contours;
(b) force-displacement curve of crushing test on [90˚]8 specimen; (c) energy dissipation-
displacement curves

21
4.2 Trigger
4.2.1 [(0˚/90˚)4]s with a 45˚ chamfer angle
A 45˚ chamfer angle was employed to investigate the trigger effect. In terms of
morphologies, all major damage forms were well captured by the model, Fig. 12a, and the
force-displacement curve demonstrates excellent correlation, particularly in capturing the
initial stiffness and peak load. Static I and II curves denote two identical experimental tests
under quasi-static loading. With a larger chamfer angle, more material is consumed before
the platen reaches the entire cross-section, which can be deduced from a comparison of
displacements at peak load in Fig. 9b (1.5mm) and Fig. 12b (3.2mm).
Fig. 12. (a) Experimental morphologies [26] and numerical matrix damage contours;
(b) force-displacement curve of crushing test on [(0˚/90˚)4]s specimen with 45˚ chamfer;
(c) energy dissipation- displacement curves
4.2.2 [(0˚/90˚)4]s without trigger
With reference to the [(0˚/90˚)4]s specimen with a 20˚ chamfer angle (specimen A), a similar
specimen without a trigger was modelled. Fig. 13a shows the sequence of failure in the
specimen, in which extensive intralaminar damage occurred suddenly. This catastrophic
failure is also reflected in the high value of peak loading, Fig. 13b, compared to Specimen A.
Fig. 13. (a) Numerical matrix damage contours; (b) force-displacement curve of
crushing test on [(0˚/90˚)4]s specimen without trigger

22
4.3 Material
4.3.1 [90˚]8 with a 10˚ chamfer angle
This test was performed on a [90˚]8 specimen made of T700/MTM57. In Fig. 14a, both the
experimental result and the numerical model displayed brittle fracture. The constitutive
response obtained from the numerical simulation shows excellent agreement with
experimental results (Fig. 14b).
Fig. 14. (a) Experimental morphologies [21] and numerical matrix damage contours;
(b) force-displacement curve of crushing test on [90˚]8 specimen with 10˚ chamfer; (c)
energy dissipation- displacement curves
4.4 Discussion
4.3.1 Energy absorption predictions
Fig. 15a illustrates the SEA results from experimental and numerical tests. For case D, with
two specimen results reported, an average value was used. Numerical data matched the
experimental values well, which demonstrates the predictive capability of the damage model
in capturing the SEA during crushing. These SEA values, for thermoset composites, are
comparable with results found in literature (ranging from 20 J/g to 100J/g) dealing with other
specimen geometries [17]. The peak stress was found to have a similar high level of
correlation as shown in Fig. 15b. The effect of particular parameters on the energy absorption
and peak stress of composite material, under crushing load, is summarized below.

23
Fig. 15. (a) Comparison of SEA; (b) Comparison of peak stress
Lay-up
With the same chamfer angle, the unidirectional specimen [0˚]8 shows the highest
experimentally determined SEA of 127J/g, followed by the crossply specimen [(0˚/90˚)4]s at
105.5 J/g and [90˚]8 at 45.7J/g. In addition, the [0˚]8 lay-up exhibited the highest peak stress,
while layup [90˚]8 lead to the lowest peak stress. From these simple test specimens, a
crossply laminate is shown to offer a good compromise between a low and high SEA
associated with the [90˚]8 and [0˚]8 respectively, and a high [0˚]8 and low [90˚]8 peak stress.
This indicates that an energy absorption profile can be partially tailored through stacking
sequence design in addition to the design of energy-absorbing structural configurations.
Fig. 16 shows the results of a crush simulation of a [(45˚/-45˚)4]s with a 20˚ trigger
chamfer. The peak load and energy dissipation history is shown to vary from the other lay-
ups investigated. The SEA for this specimen was 58.4J/g and achieved a peak stress of
73.3MPa.These results are consistent with those obtained for the unidirectional, transverse
and cross-ply lay-ups presented in this paper and confirm the damage model’s ability to
capture variations in the crushing response resulting from changes to the lay-up of a
laminated structure.
Fig. 16. (a) Numerical matrix damage contour; (b) force-displacement curve of
crushing test on [(45˚/-45˚)4]s specimen
Trigger Type
The comparison between specimens A and D shows that the chamfer angle variation
investigated (20˚ and 45˚) did not result in a large variation in the magnitude of SEA. The

24
SEA value for a chamfer angle of 45˚ was slightly less than that of the 20˚specimen. From
the morphologies in Fig. 9a and Fig. 12a, it can be seen that the failure mechanisms of A and
D are quite similar with fragmentation in the middle and splaying of the outer plies. With
reference to Fig. 15b, it would seem that a larger chamfer angle decreases the observed and
predicted peak stress.
4.3.2 Friction
The role of friction between the crushing surface and the metallic base, which influences the
accumulation of debris and wedge formation, plays an important role in the crush response,
as does friction between composite surfaces. A study was conducted to investigate the
influence of friction between the loading platen and the crushing surface. With reference to
Fig. 17, a range of friction coefficients were used to simulate the crushing response of
Specimen A. As expected, with increasing friction, there is more resistance to the crushed
surface sliding across the platen leading to an increase in apparent stiffness, peak load and
energy dissipated. A friction coefficient of 0.2 yielded excellent correlation with
experimental results.
Fig. 17. (a) Experimental morphologies and numerical matrix damage contour; (b)
force-displacement curve of crushing test on [(0˚/90˚)4]s-20˚ specimen with different
friction coefficients
4.3.3 In-built Hashin model
ABAQUS has a built-in progressive damage model based on Hashin’s criteria [22] which can
only be used with continuum shell elements (SC8R). Simulation of the [(0˚/90˚)4]s specimen,
with a 20˚ chamfer angle, was performed using these criteria, for comparison with the

25
proposed damage model. Three elements through the thickness of each ply were also used.
To suppress spurious energy modes, an enhanced stiffness-based hourglass control was
employed. Fig. 18a shows a poor correlation between the experimental morphologies and
numerical results obtained from the ABAQUS built-in model. It is noted that numerical
results show extensive splaying with some ply buckling, associated with the degradation in
material stiffness. The results in Fig. 18b reveal a lower initial stiffness and peak load.
Energy curves in Fig. 18c indicate that the total energy absorbed by the specimen was
approximately 4J lower than that predicted by the proposed model (c.f. 7J at a displacement
of 4mm). The SEA for this specimen was 83.1J/g (20% lower than that predicted by the
proposed model, 105.5J/g). The simulation terminated prematurely due to excessive element
distortion. The default element deletion strategy in ABAQUS is based on the value of the
damage parameters only and does not consider element distortion.
There are several fundamental differences between the Hashin damage model provided
by ABAQUS and the proposed progressive damage model. These differences are summarised
below:
a) The implemented Hashin’s criteria assume that the behaviour of the undamaged
material is linearly elastic, while the proposed model takes into account the non-linear
shear behaviour of the matrix.
b) The ABAQUS composites damage model predicts damage initiation and damage
evolution solely on plane stress components, ignoring the contribution of transverse
stress components. In contrast, the proposed model predicts constituent failure using
the full 3D stress state.
c) The characteristic length given by ABAQUS is the cubic root of the volume of the
element, which is only accurate when elements have aspect ratios close to unity and
crack planes are assumed to evolve perpendicular to the mid-plane of the element.

26
The proposed model provides an accurate estimate of the fracture plane area, which
can assume any orientation within an element. The characteristic length is calculated
by dividing the volume of the finite element by this area.
Overall, the proposed damage model presented in this paper achieved significant
improvements in terms of morphologies, load response and energy absorption predictions
compared to the ABAQUS built-in model.
Fig. 18. (a) Delamination damage contour and Hashin’s compressive matrix damage
contour; (b) force-displacement curve of crushing test on [(0˚/90˚)4]s-20˚specimen
Conclusions
A composite damage model that accounts for both intralaminar (matrix and fibre damage)
and interlaminar (delamination) damage was presented which has shown a high degree of
capability in predicting crushing behaviour of composite laminates. This 3D model included
an updated damage initiation criterion, robust unloading/reloading mechanism, a unified
matrix damage law and a sound element deletion strategy. Through published experimental
data, the crushing tests successfully demonstrated that the model can capture:
Both the qualitative and quantitative aspects of the intralaminar and interlaminar
crushing damage for a range of stacking sequences, triggers and materials.
Crashworthiness features (specific energy absorption and peak stress) with a high
degree of accuracy.
The contribution of each damage mechanism to the overall energy absorption during
crushing.

27
This was achieved without the need to calibrate the material parameters, required as input
parameters for the damage model, which were obtained from reliable literature sources.
Acknowledgement
The corresponding author would like to acknowledge the financial support of Bombardier
and the Royal Academy of Engineering. The authors would also like to gratefully
acknowledge the funding from the Queen’s University Belfast/China Scholarship Council
(QUB/CSC) PhD Scholarship and the support from the Research Computing Team at QUB in
accessing the HPC facilities.

28
References
[1] ASTM, Standard Test Method for Mode I Interlaminar Fracture Toughness of
Unidirectional Fiber-Reinforced Polymer Matrix Composites, American Society for
Testing and Materials, D5528-01, West Conshohocken, PA, 2001.
[2] ASTM, Standard Test Method for Translaminar Fracture Toughness of Laminated
Polymer Matrix Composite Materials, E1922-04, ASTM International,
Conshohocken, PA, 2004.
[3] ASTM, New Test Method for Determination of the Mode II Interlaminar Fracture
Toughness of Unidirectional Fiber Reinforced Polymer Matrix Composites Using the
End-Notched Flexure (ENF) Test, WK22949, ASTM International, Conshohocken,
PA, 2010.
[4] E.J. Barbero, Introduction to Composite Materials Design, 2nd edition ed, CRC Press,
Boca Raton FL, USA, 2011.
[5] S. Barre, T. Chotard, and M. Benzeggagh, Comparative study of strain rate effects on
mechanical properties of glass fibre-reinforced thermoset matrix composite, Compos.
Part. A-appl. S 27 (1996), pp. 1169-1181.
[6] K.-J. Bathe, Finite element procedures, ed, Klaus-Jurgen Bathe, 2006.
[7] G. Belingardi, M. Cavatorta, and R. Duella, Material characterization of a composite–
foam sandwich for the front structure of a high speed train, Compos. Struct. 61
(2003), pp. 13-25.
[8] M.L. Benzeggagh, and M. Kenane, Measurement of mixed-mode delamination
fracture toughness of unidirectional glass/epoxy composites with mixed-mode
bending apparatus, Composites science and technology 56 (1996), pp. 439-449.
[9] C. Bisagni, G. Di Pietro, L. Fraschini, and D. Terletti, Progressive crushing of fiber-
reinforced composite structural components of a Formula One racing car, Compos.
Struct. 68 (2005), pp. 491-503.
[10] G. Catalanotti, P. Camanho, and A. Marques, Three-dimensional failure criteria for
fiber-reinforced laminates, Compos. Struct. (2012)
[11] L.N. Chiu, B.G. Falzon, and R. Boman, A Continuum Damage Mechanics Model for
the Analysis of the Crashworthiness of Composite Structures: A work in progress, in
Proceedings of the 15th Australian Aeronautical Conference, Melbourne, 2013.

29
[12] Dassault-Systems, ABAQUS Documentation 6.11, SIMULIA, 2011.
[13] M.V. Donadon, L. Iannucci, B.G. Falzon, J.M. Hodgkinson, and S.F.M. de Almeida,
A progressive failure model for composite laminates subjected to low velocity impact
damage, Comput. Struct. 86 (2008), pp. 1232-1252.
[14] A. Faggiani, and B.G. Falzon, Predicting low-velocity impact damage on a stiffened
composite panel, Composites Part A: Applied Science and Manufacturing 41 (2010),
pp. 737-749.
[15] B.G. Falzon, and P. Apruzzese, Numerical analysis of intralaminar failure
mechanisms in composite structures. Part I: FE implementation, Compos. Struct. 93
(2011), pp. 1039-1046.
[16] B.G. Falzon, and P. Apruzzese, Numerical analysis of intralaminar failure
mechanisms in composite structures. Part II: Applications, Compos. Struct. 93 (2011),
pp. 1047-1053.
[17] P. Feraboli, Development of a corrugated test specimen for composite materials
energy absorption, J. Compos. Mater. 42 (2008), pp. 229-256.
[18] D. Fleming, Modelling composite crushing initiation using a cohesive element
formulation, INT. J. CRASHWORTHINES 16 (2011), pp. 475-485.
[19] F. Garattoni, Crashworthiness and composite materials: development of an
experimental test method for the energy absorption determination and implementation
of the relative numerical model, PhD Thesis, University of Bologna (2011)
[20] L. Grauers, R. Olsson, and R. Gutkin, Energy absorption and damage mechanisms in
progressive crushing of corrugated NCF laminates: Fractographic analysis, Compos.
Struct. 110 (2014), pp. 110-117.
[21] R. Gutkin, Modelling Compressive Damage in CFRP: Combining Friction with
Damage, in the 19th International Conference on Composite Materials, Montreal,
Canada, 2013.
[22] Z. Hashin, Failure criteria for unidirectional fiber composites, Journal of applied
mechanics 47 (1980), pp. 329-334.
[23] J. Huang, and X. Wang, On a new crush trigger for energy absorption of composite
tubes, INT. J. CRASHWORTHINES 15 (2010), pp. 625-634.
[24] W. Hufenbach, R. Bohm, M. Thieme, A. Winkler, E. Mader, J. Rausch, and M.
Schade, Polypropylene/glass fibre 3D-textile reinforced composites for automotive
applications, Materials & Design 32 (2011), pp. 1468-1476.

30
[25] H.A. Israr, S. Rivallant, and J.J. Barrau, Experimental investigation on mean crushing
stress characterization of carbon–epoxy plies under compressive crushing mode,
Compos. Struct. 96 (2013), pp. 357-364.
[26] H.A. Israr, S. Rivallant, C. Bouvet, and J.J. Barrau, Finite element simulation of
0°/90° CFRP laminated plates subjected to crushing using a free-face-crushing
concept, Compos. Part. A-appl. S 62 (2014), pp. 16-25.
[27] G.C. Jacob, J.F. Fellers, S. Simunovic, and J.M. Starbuck, Energy absorption in
polymer composites for automotive crashworthiness, J. Compos. Mater. 36 (2002),
pp. 813-850.
[28] A.F. Johnson, and M. David, Failure mechanisms in energy-absorbing composite
structures, Philosophical Magazine 90 (2010), pp. 4245-4261.
[29] M. Joosten, S. Dutton, D. Kelly, and R. Thomson, Experimental and numerical
investigation of the crushing response of an open section composite energy absorbing
element, Compos. Struct. 93 (2011), pp. 682-689.
[30] L.M. Kachanov, Introduction to Continuum Damage Mechanics, Boston: Martinus
Nijhoff Publishers (1986)
[31] Z. Kazancı, and K.-J. Bathe, Crushing and crashing of tubes with implicit time
integration, Int. J. Impact. Eng. 42 (2012), pp. 80-88.
[32] M. Kiani, H. Shiozaki, and K. Motoyama, Using Experimental Data to Improve Crash
Modeling for Composite Materials, in Composite Materials and Joining Technologies
for Composites, Volume 7, E. Patterson, D. Backman and G. Cloud eds., Springer
New York, 2013, pp. 215-226.
[33] J.-S. Kim, H.-J. Yoon, and K.-B. Shin, A study on crushing behaviors of composite
circular tubes with different reinforcing fibers, Int J Impact Eng 38 (2011), pp. 198-
207.
[34] M.J. Laffan, S.T. Pinho, P. Robinson, L. Iannucci, and A.J. McMillan, Measurement
of the fracture toughness associated with the longitudinal fibre compressive failure
mode of laminated composites, Compos. Part. A-appl. S 43 (2012), pp. 1930-1938.
[35] S.T. Lau, M. Said, and M.Y. Yaakob, On the effect of geometrical designs and failure
modes in composite axial crushing: A literature review, Compos. Struct. 94 (2012),
pp. 803-812.
[36] J. Lemaitre, and J.L. Chaboche, Mechanics of solid materials, ed, Cambridge
University Press, Cambridge, UK, 1990.

31
[37] L. Maheo, V. Grolleau, and G. Rio, Numerical damping of spurious oscillations: a
comparison between the bulk viscosity method and the explicit dissipative Tchamwa-
Wielgosz scheme, Computational Mechanics 51 (2013), pp. 109-128.
[38] P. Mangalgiri, Composite materials for aerospace applications, B. Mater. Sci. 22
(1999), pp. 657-664.
[39] C. McGregor, R. Vaziri, and X. Xiao, Finite element modelling of the progressive
crushing of braided composite tubes under axial impact, Int. J. Impact. Eng. 37
(2010), pp. 662-672.
[40] A. Najafi, D. Huang, F. Abdi, and M. Rais-Rohani, Test Validation on the Energy
Absorption Behavior of Composite Tubes with Different Ply Architectures, in
SAMPE 2012 Conference, Baltimore, MD, 2012.
[41] A. Najafi, D. Huang, M. Rais-Rohani, F. Abdi, and C. Heydari, Simulation of
Crushing Process in Composite Tubes, in 51st AIAA/ASME/ASCE/AHS/ASC
Structures, Structural Dynamics, and Materials Conference, Orlando,FL, 2010.
[42] S. Palanivelu, W.V. Paepegem, J. Degrieck, J. Vantomme, D. Kakogiannis, J.V.
Ackeren, D.V. Hemelrijck, and J. Wastiels, Crushing and energy absorption
performance of different geometrical shapes of small-scale glass/polyester composite
tubes under quasi-static loading conditions, Compos. Struct. 93 (2011), pp. 992-1007.
[43] S. Palanivelu, W. Van Paepegem, J. Degrieck, D. Kakogiannis, J. Van Ackeren, D.
Van Hemelrijck, J. Wastiels, and J. Vantomme, Parametric study of crushing
parameters and failure patterns of pultruded composite tubes using cohesive elements
and seam, Part I: Central delamination and triggering modelling, Polym. Test. 29
(2010), pp. 729-741.
[44] S. Palanivelu, W. Van Paepegem, J. Degrieck, J. Van Ackeren, D. Kakogiannis, D.
Van Hemelrijck, J. Wastiels, and J. Vantomme, Experimental study on the axial
crushing behaviour of pultruded composite tubes, Polym. Test. 29 (2010), pp. 224-
234.
[45] S. Palanivelu, W. Van Paepegem, J. Degrieck, J. Van Ackeren, D. Kakogiannis, J.
Wastiels, D. Van Hemelrijck, and J. Vantomme, Parametric study of crushing
parameters and failure patterns of pultruded composite tubes using cohesive elements
and seam: Part II – Multiple delaminations and initial geometric imperfections,
Polym. Test. 29 (2010), pp. 803-814.

32
[46] L. Pickett, and V. Dayal, Effect of tube geometry and ply-angle on energy absorption
of a circular glass/epoxy crush tube – A numerical study, Compos. Part. B-eng. 43
(2012), pp. 2960-2967.
[47] S. Pinho, P. Camanho, and M. De Moura, Numerical simulation of the crushing
process of composite materials, INT. J. CRASHWORTHINES 9 (2004), pp. 263-276.
[48] S. Pinho, L. Iannucci, and P. Robinson, Physically based failure models and criteria
for laminated fibre-reinforced composites with emphasis on fibre kinking. Part II: FE
implementation, Compos. Part. A-appl. S 37 (2006), pp. 766-777.
[49] M. Preetamkumar, L. Gilles, L. Pierre, and G. Ana-cristina, Validation of Intralaminar
Behaviour of the Laminated Composites by Damage Mesomodel, in 50th
AIAA/ASME/ASCE/AHS/ASC Structures, Structural Dynamics, and Materials
Conference, American Institute of Aeronautics and Astronautics, 2009.
[50] W.H. Press, Numerical recipes in Fortran 77: the art of scientific computing, ed, Vol.
1, Cambridge university press, 1992.
[51] A. Puck, and H. Schürmann, Failure analysis of FRP laminates by means of
physically based phenomenological models, Compos. Sci. Technol. 58 (1998), pp.
1045-1067.
[52] L. Raimondo, L. Iannucci, P. Robinson, and P. Curtis, A progressive failure model for
mesh-size-independent FE analysis of composite laminates subject to low-velocity
impact damage, Compos. Sci. Technol. 72 (2012), pp. 624-632.
[53] S. Ramakrishna, H. Hamada, Z. Maekawa, and H. Sato, Energy absorption behavior
of carbon-fiber-reinforced thermoplastic composite tubes, J. Thermoplast. Compos 8
(1995), pp. 323-344.
[54] C. Schuecker, and B.D. Davidson, Evaluation of the accuracy of the four-point bend
end-notched flexure test for mode II delamination toughness determination, Compos.
Sci. Technol. 60 (2000), pp. 2137-2146.
[55] SIMULIA, Simulating composites crush and crash events using ABAQUS, 50th
AIAA/ASME/ASCE/AHS/ASC Structures, Structural Dynamics, and Materials
Conference (2009)
[56] V.S. Sokolinsky, K.C. Indermuehle, and J.A. Hurtado, Numerical simulation of the
crushing process of a corrugated composite plate, Compos. Part. A-appl. S 42 (2011),
pp. 1119-1126.

33
[57] A. Turon, P.P. Camanho, J. Costa, and J. Renart, Accurate simulation of delamination
growth under mixed-mode loading using cohesive elements: Definition of
interlaminar strengths and elastic stiffness, Compos. Struct. 92 (2010), pp. 1857-1864.
[58] W. Van Paepegem, I. De Baere, E. Lamkanfi, and J. Degrieck, Monitoring quasi-
static and cyclic fatigue damage in fibre-reinforced plastics by Poisson’s ratio
evolution, Int. J. Fatigue. 32 (2010), pp. 184-196.
[59] B. Vieille, V.M. Casado, and C. Bouvet, Influence of matrix toughness and ductility
on the compression-after-impact behavior of woven-ply thermoplastic- and
thermosetting-composites: A comparative study, Compos. Struct. 110 (2014), pp.
207-218.
[60] X. Xiao, C. McGregor, R. Vaziri, and A. Poursartip, Progress in braided composite
tube crush simulation, Int. J. Impact. Eng. 36 (2009), pp. 711-719.

34
Figures
Fig. 1. Bilinear law for tension and compression (shaded area is volumetric strain energy
density 𝑔11𝑇(𝐶)
)

35
Fig. 2. Coordinate system (123) rotated to the fracture plane system (LNT)

36
Fig. 3. Non-linear shear curve with kinematic hardening

37
Fig. 4. Mixed-mode matrix damage evolution

38
Fig. 5. Failure modes associated with crushing

39
Fig. 6. Idealised load versus displacement curve during crushing

40
Fig. 7. Wedge shape specimen

41
Fig. 8. Finite element model of test set-up
0˚

42
(a)
(b) (c)
Fig. 9. (a) Experimental morphologies [25] and numerical matrix damage contour; (b) force-
displacement curve of crushing test on [(0˚/90˚)4]s specimen ; (c) energy dissipation-
displacement curves
0
2
4
6
8
10
12
0 2 4 6 8 10
En
erg
y D
issi
pa
tio
n (
J)
Displacement (mm)
External Work IntralaminarFriction DelaminationViscous
0
1
2
3
4
5
6
0 5 10
Fo
rce
(kN
)
Displacment (mm)
Exp
Num1
2
3
4
5 6
Debris
Matrix Damage

43
(a)
(b)
(c) (d)
Fig. 10. (a) Experimental morphologies [25] and numerical matrix-dominated damage
contours; (b) left –longitudinal compressive damage; right - delamination; (c) force-
displacement curve of crushing Test on [0˚]8 spceimen; (d) energy dissipation-
displacement curves
0
2
4
6
8
0 0.5 1 1.5 2
Fo
rce
(kN
)
Displacment (mm)
Exp
Num
0
5
10
15
0 2 4 6En
erg
y D
issi
pa
tio
n (
J)
Displacement (mm)
External Work IntralaminarFriction DelaminationViscous

44
(a)
(b) (c)
Fig. 11. (a)Experimental morphologies [25] and numerical matrix damage contours;
(b) force-displacement curve of crushing test on [90˚]8 specimen; (c) energy dissipation-
displacement curves
0
0.5
1
1.5
2
0 0.5 1 1.5 2
Fo
rce
(kN
)
Displacment (mm)
Exp
Num
0
1
2
3
4
0 1 2 3 4E
ner
gy
Dis
sip
ati
on
(J
)
Displacement (mm)
External Work Intralaminar
Friction Delamination
Viscous

45
(a)
(b) (c)
Fig. 12. (a) Experimental morphologies [26] and numerical matrix damage contours;
(b) force-displacement curve of crushing test on [(0˚/90˚)4]s specimen with 45˚ chamfer;
(c) energy dissipation- displacement curves
0
1
2
3
4
5
6
0 2 4 6 8 10
Fo
rce
(kN
)
Displacment (mm)
Static I Static IINum
0
5
10
15
20
0 2 4 6 8 10
En
erg
y D
issi
pa
tio
n (
J)
Displacement (mm)
External Work IntralaminarFriction DelaminationViscous

46
Fig. 13. (a) Numerical matrix damage contours; (b) force-displacement curve of
crushing test on [(0˚/90˚)4]s specimen without trigger compared with trigger 20˚
0
5
10
15
20
25
0 2 4 6 8 10
Fo
rce
(kN
)
Displacment (mm)
Non-Trigger
Trigger

47
(a)
(b) (c)
Fig. 14. (a) Experimental morphologies [21] and numerical matrix damage contours;
(b) force-displacement curve of crushing test on [90˚]8 specimen with 10˚ chamfer; (c)
energy dissipation- displacement curves
0
20
40
60
80
100
0 0.1 0.2 0.3
Str
ess
(M
Pa
)
Strain (-)
Exp
Num
0
0.5
1
1.5
2
2.5
3
0 0.5 1 1.5 2
En
erg
y D
issi
pa
tio
n (
J)
Displacement (mm)
External Work Intralaminar
Friction Delamination
Viscous

48
(a)
(b)
Fig. 15. (a) Comparison of SEA; (b) Comparison of peak stress
0
40
80
120
160
A B C D E
SE
A (
J/g
)
Specimens
SEA (Exp) SEA (Num)
0
100
200
300
400
A B C D E
Pea
k S
tres
s (M
Pa
)
Specimens
Peak_Stress (Exp) Peak_Stress (Num)
[(0˚/90˚)4]s-20˚
[0˚] 8-20˚
[90˚] 8-20˚ [90˚] 8-10˚
[(0˚/90˚)4]s-45˚
[(0˚/90˚)4]s-20˚
[0˚] 8-20˚
[(90˚)8]-20˚ [(90˚)8]-10˚ [(0˚/90˚)4]s-45˚

49
(a)
(b) (c)
Fig. 16. (a) Numerical matrix damage contour; (b) force-displacement curve of
crushing test on [(45˚/-45˚)4]s specimen; (c) energy dissipation- displacement curves
0
0.5
1
1.5
2
2.5
3
0 2 4 6 8 10
Fo
rce
(kN
)
Displacment (mm)
Num
0
2
4
6
8
0 2 4 6 8 10En
erg
y D
issi
pa
tio
n (
J)
Displacement (mm)
External Work Intralaminar
Friction Delamination
Viscous
45˚
-45˚
1
1

50
(a)
(b)
Fig. 17. (a) Experimental morphologies and numerical matrix damage contour; (b)
force-displacement curve of crushing test on [(0˚/90˚)4]s-20˚ specimen with different
friction coefficients
0
1
2
3
4
5
6
7
0 1 2 3 4 5 6 7 8 9 10
Forc
e (
kN)
Displacement (mm)
ExpNum_f=0.05Num_f=0.15Num_f=0.20Num_f=0.30
Exp f=0.05 f=0.15 f=0.20 f=0.30

51
(a)
(b) (c)
Fig. 18. (a) Experimental morphologies and Hashin’s compressive matrix damage
contour; (b) force-displacement curve of crushing test on [(0˚/90˚)4]s-20˚specimen; (c)
energy dissipation- displacement curves
0
1
2
3
4
5
6
0 2 4 6 8 10
Fo
rce
(kN
)
Displacment (mm)
Exp
ABAQUS
0
1
2
3
4
5
0 1 2 3 4
En
erg
y D
issi
pa
tio
n (
J)
Displacement (mm)
External Work Intralaminar
Friction Delamination
Viscous
1
4

52
Tables
Table 1. Specimen configurations
ID Specimens Material Thickness(mm) Width(mm) Height(mm) Trigger(˚)
A [(0˚/90˚)4]s T700/M21 4.16 8.32 60 20
B [0˚]8 T700/M21 2.13 10.23 60 20
C [90˚]8 T700/M21 2.13 10.23 60 20
D [(0˚/90˚)4]s T700/M21 4.16 10 60 45
E [90˚]8 T700/MTM57 2.50 13 20 10

53
Table 2. Material Properties of T700/M21 for numerical simulation [26]
Property Values
Elastic Properties E1 = 130𝐺𝑃𝑎; E2 = E3 = 9.0𝐺𝑃𝑎; G23 = 5.0𝐺𝑃𝑎; G12 = G13 = 5.0𝐺𝑃𝑎; ν12 = ν13 = 0.33; ν23 = 0.35
Strength XT = 2080𝑀𝑃𝑎; XC = 1250𝑀𝑃𝑎; YT = 75𝑀𝑃𝑎; YC = 120𝑀𝑃𝑎; S12 = 110𝑀𝑃𝑎
Intralaminar Fracture Toughness Γ11T = 133𝑁/𝑚𝑚; Γ11
C = 40𝑁/𝑚𝑚;Γ22T = 0.6𝑁/
𝑚𝑚;Γ22C = 2.1𝑁/𝑚𝑚;Γ12,C = Γ23,C = 2.1𝑁/𝑚𝑚;
Non-linear Shear Properties [49] c1 = 37833𝑀𝑃𝑎; c2 = 16512𝑀𝑃𝑎; c3 = 2334.3𝑀𝑃𝑎 Interface Properties 𝐺𝐼 = 0.6𝑁/𝑚𝑚; 𝐺𝐼𝐼 = 2.1𝑁/𝑚𝑚; 𝜂 = 1.45

54
Table 3. Material Properties of T700/MTM57 for numerical simulation [21]
Property Values
Elastic Properties E1 = 128𝐺𝑃𝑎; E2 = E3 = 7.9𝐺𝑃𝑎; G23 = 2.5𝐺𝑃𝑎; G12 = G13 = 3.0𝐺𝑃𝑎; ν12 = ν13 = 0.3; ν23 = 0.4
Strength [19] XT = 2481𝑀𝑃𝑎; XC = 1296 𝑀𝑃𝑎; YT = 52.9𝑀𝑃𝑎; YC = 242𝑀𝑃𝑎𝑎; S12 = 91.3𝑀𝑃𝑎
Intralaminar Fracture Toughness Γ11T = 92𝑁/𝑚𝑚𝑏; Γ11
C = 35𝑁/𝑚𝑚𝑏;Γ22T = 0.26𝑁/
𝑚𝑚𝑏;Γ22C = 1.2𝑁/𝑚𝑚;Γ12,C = Γ23,C = 1.2𝑁/𝑚𝑚;
Non-linear Shear Properties c1 = 55932𝑀𝑃𝑎; c2 = 19148𝑀𝑃𝑎; c3 = 2046𝑀𝑃𝑎
Interface Properties 𝐺𝐼 = 0.26𝑁/𝑚𝑚𝑏; 𝐺𝐼𝐼 = 1.2𝑁/𝑚𝑚; 𝜂 = 2.04
a Estimated value from 𝑆23 =𝑌𝐶
2 tan(𝜃𝑓) b Estimated value from T700/M21