predicting success in a gateway mathematics course - eric - u.s
TRANSCRIPT

1
Predicting Success in a Gateway Mathematics Course
Michael C. Morrison President Emeritus, North Iowa Area Community College
6059 N. Elsie Road Stone Lake, WI 54876
715-865-9717 [email protected]
Shelly Schmit Vice President
Institutional Effectiveness & Organizational Development North Iowa Area Community College
500 College Drive Mason City, IA 50401
641-422-4211 [email protected]
July 26, 2010

2
Abstract A logit model predicting student outcomes for a gateway course, Math for Liberal Arts, was successfully developed which fits the data well. Two variables, ACT math score and high school GPA, were found to be significant predictors of achieving a C or better in Math for Liberal Arts. A practical implication of the study suggests that with just two pieces of information, a student’s high school GPA and his/her ACT math score, a counselor could input these two values into a spreadsheet and obtain the student’s predicted probability of success in Math for Liberal Arts.

3
Introduction
Gateway courses are extremely important for students to make adequate
progress toward successful graduation. In order to meet higher
expectations to compete in a global economy it is important for community
colleges to develop strategies for improving the rate at which academically
underprepared students take and pass initial college-level (or “gatekeeper”)
courses. As the great majority of institutions of higher education require
successful completion of general education courses it is vital for colleges to
assess factors that may predict student success and use that information for
counseling and placement in appropriate courses that maximize student
potential for success.
This study examines the impact of important predictors of success in a
gateway course in mathematics at North Iowa Area Community College. The
odds and probabilities associated with the predictors of success in the
gateway mathematics course are measured through a logistic regression
analysis. While this is an institutional study the factors predicting student
success in the identified mathematics gatekeeper course may well be
common to many community colleges. Implications for appropriate
placement based on success probabilities and odds are also examined.
Literature Review
It is a common practice for colleges and universities to identify students
as under-prepared for a college-level course based on standardized

4
placement scores (Kozeracki, 2002). A single measure alone has often been
used to determine course level placement. A large body of research has
focused on the analysis of ACT (American College Testing) scores. The
cognitive factors that have been most widely considered as potential
predictors of college mathematics achievement are the SAT (Standard
Achievement Testing) and ACT scores (Benford & Gess-Newsome, 2006).
According to Golfin, Jordan, Hull, and Ruffin (2005), colleges generally
require a score of at least 23 on the mathematical component of the ACT to
be allowed to enroll in a college algebra class. Duranczyk and Higbee
(2006) revealed that only 41% of students graduating from high school in
2005 scored a 22 or higher on the ACT math test, indicating they had a high
probability of succeeding in college algebra. That leaves a potential of 59%
majority pool of incoming high school graduates whose low ACT math scores
predict a less than favorable outcome in succeeding in mathematics gateway
courses. Kozeracki (2002) revealed that 55% of community colleges
reported that the number of students in developmental studies has
increased over the previous 5 years. Several states; Arizona, Colorado,
Florida, Oklahoma, South Dakota, Tennessee, and West Virginia, have
established an ACT math score of 19 or 20 as the minimum score necessary
for students to enroll in college-level mathematics courses.
Kohler (1973) determined that ACT math and composite score are
significant predictors of grades in college algebra. Twenty years later, House

5
(1995) revealed that the ACT composite score is a significant predictor of
grades in a variety of introductory college mathematics courses. Gussett
(1974) determined there is a strong correlation between SAT total (math
and verbal combined) score and the grades in freshman-level mathematics
courses. Bridgeman (1982) revealed significant relationships between SAT
math score and student achievement in college algebra and finite
mathematics. Jenkins, Jaggars and Roska (2009) found a substantial
proportion of students with high placement test scores did not take
gatekeeper courses.
Findings from other studies have revealed that combining admissions
test scores with high school performance data can be used to successfully
predict grades in a variety of college math courses. Richards et al. (1966)
posited that high school grades are good predictors of college math grades,
especially when combined with ACT scores. Noble and Sawyer (1989)
revealed similar results in six college math courses using a combination of
ACT composite scores and high school GPAs (Grade Point Average). Benford
and Gess-Newsome (2006) posited that students’ high school GPA and ACT
scores are good predictors of grades in gateway courses.
While several researchers have revealed that standardized test scores
and high school grades are effective predictors of success in college
mathematics, some researchers have revealed contrary findings. Haase and
Caffrey (1983a, b) posited that high school grades were generally useless as

6
predictors of grades in introductory mathematics courses, and that SAT and
ACT score did not predict overall scholastic achievement in community
college. Yellott (1981) conducted a study that revealed neither the ACT or
results from the Mathematic Association of America’s Placement Program
predicted success in university level developmental mathematics courses.
The Mathematic Association of America’s Placement Program offers a
collection of standardized tests which aid in the recommendation of course
placement. Despite these contrary findings, the majority of researchers
tended to agree that standardized test scores and high school grades are
effective predictors of success in mathematics courses.
Some research studies investigated more comprehensive approaches to
devising placement standards. Lewallen (1994) used multiple measures to
determine placement of students in courses. Variables examined to
determine a relationship with course success were: age, high school grade
point average, high school completion status, recency of formal schooling,
years of high school math and grade in last math course, highest level of
math class completed, recency of last math class, and units planned and
work hours planned. Leweallen concluded that course success was strongly
associated with high school grade point average, highest math class
completed, grade in last math class, units planned, and recency of school.
Illich, Hagan, and McCallister (2004) conducted a study of students enrolled
in remedial courses along with regular college courses and concluded there

7
are potential problems in predicting success when one relies on only one
measure (e.g., standardized placement tests) to assess the preparatory
needs of students. Their results were consistent with other findings
indicating that student dispositional data better predict academic
performance than standardized placement tests. Using standardized tests
does not take into consideration a student’s motivation to learn.
Felder, Finney, and Kirst (2007) conducted a study at American River
College in California where the majority (90%) of students who began with a
developmental [i.e., mathematics] course did not pass a transfer-level
course. In 2004, American River College replaced traditional placement with
an “informed self-placement” model for mathematics courses. Instead of
placing students into courses based on test scores, self-placement is
designed to match American River College math course content. Students
take the level of math test they perceive best matches their skill level, and
receive computer results immediately following the test. Counselors use the
self-placement test results to advise students for appropriate course
selection. Prior to the self-placement process, American River College relied
on COMPASS test scores to determine math course placement. While the
results from COMPASS and the self-placement assessment are similar,
faculty and administration favor the self-placement assessment tool
primarily due to the flexibility of the instrument and its cost. Whereas
COMPASS is a fixed exam that must be purchased from ACT, faculty and

8
counselors are able to customize the self-placement instrument (e.g., make
updates and additions) to best fit each student’s needs.
Several researchers have revealed that subject-specific placement exams
written and administered by the same institutions that taught the math
courses are the best predictors of student performance (Bone, 1981; Crooks,
1980; Helmick, 1983; Schultz & Austin, 1987).
In a study of 73 underprepared mathematics students Rochester
Community College, Mercer (1995) revealed that students who followed the
counselor’s advice and were placed in a developmental mathematics course
based on skill assessment scores were more likely to pass the entry college
level mathematics course. This finding indicates that a developmental
course can successfully prepare the student for a college level mathematics
course.
A study was conducted at Cottey College, Missouri, to determine why a
large number of students were dropping basic algebra and calculus classes
(Callahan, 1993). The study focused on predictive variables, specifically
standardized test scores, for success in basic algebra. Recommendations
were made based on the finding of this study. For students with four years
of high school math, the ACT score was considered for appropriate course
placement. Students with only one year of high school math, and many with
two or three years but test scores below 18 ACT and 400 SAT, would benefit
from Intermediate Algebra. Within two years of establishing the program

9
based on the study recommendations, the college saw improvements in
mathematics course pass rates (Callahan, 1993).
The complexity of the published work supports the necessity to conduct
site specific research with frequent reevaluations (Mercer, 1995).
Purpose The purpose of this study is to conduct site specific research to predict
success in a gateway mathematics course at North Iowa Area Community
College. Based on the literature review and availability of data we posit
three variables impact the odds of success in the gateway course. These
three variables are ACT math score, high school GPA and number of high
school math courses taken.
Data
The data for this study was obtained from an analysis of students
enrolled in a gateway course, Math for Liberal Arts, during the 2006-07
college year at North Iowa Area Community College. Complete information
on high school GPA, ACT math scores, number of high school math courses
taken and success in Math for Liberal Arts was obtained for 275 students.
The variables in this analysis are summarized in Table 1:

10
Table 1 Variable Names, Description and Coding_____________________________ Variable Names Description Coding __________ Math_Success A ‘C’ or better as a final Dummy coded: student grade in Math for 1 = Success Liberal Arts 0 = Not successful ACTM Student ACT math score Reported by ACT HSGPA Student high school Reported from high grade point average school NUMB Number of high school Reported from high
math courses taken by school student
______________________________________________________
Research Hypotheses The following null and research hypotheses were tested:
H0 - Math_Success is jointly independent of the predictors, ACTM,
HSGPA and NUMB, simultaneously; Ho: β1 = β2 = β3= 0.
H1 - ACTM, HSGPA and NUMB independently and simultaneously effect
Math_Success.
Research Methods
Logistic Regression. As the dependent variable, Math_Success, is a
binary categorical variable and because we are interested in controlling for
important variables that impact the odds of math success the analytical tool
of choice is logistic regression. Logistic regression is “the most important
model for categorical response data” (Agresti, 2002, p.165).

11
Logistic regression applies maximum likelihood estimation after
transforming the dependent into a logit variable (the natural log of the odds
of the dependent variable, Math_Success, occurring or not). In this way,
logistic regression estimates the probability of success in Math for Liberal
Arts, controlling for important predictor variables.
Findings Characteristics of the Sample. The sample split for students who succeed
versus those who did not succeed in Math for Liberal Arts is identified in
Table 2.
Table 2
Sample Split Accelerated and Non-Accelerated Students________________
Group__________________N________________ Percent____________
Succeeded 137 49.82
Did Not Succeed 138 50.18
Total 275 100.00 ______________________________________________________________________________ Table 2 indicates that the sample is evenly distributed for those that
succeeded versus those who did not succeed in Math for Liberal Arts. Table
3 depicts descriptive statistics for the variables of this study.
12
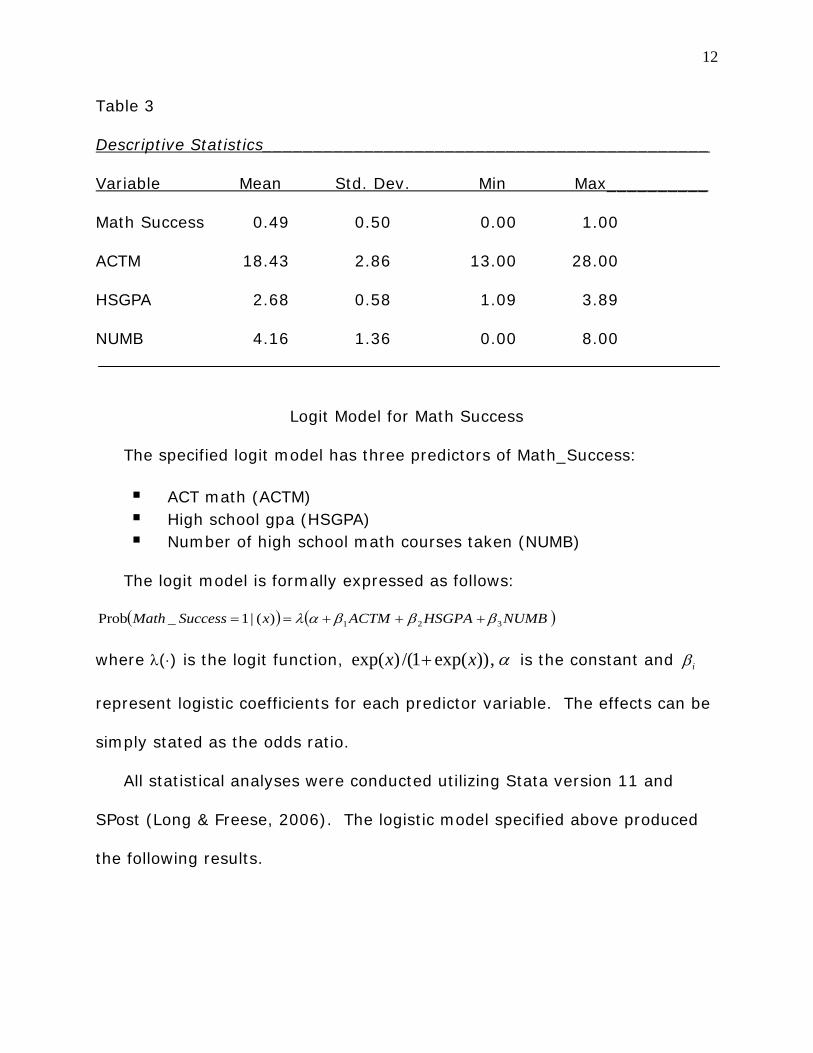
Table 3
Descriptive Statistics____________________________________________
Variable Mean Std. Dev. Min Max__________
Math Success 0.49 0.50 0.00 1.00
ACTM 18.43 2.86 13.00 28.00
HSGPA 2.68 0.58 1.09 3.89
NUMB 4.16 1.36 0.00 8.00
Logit Model for Math Success
The specified logit model has three predictors of Math_Success:
ACT math (ACTM) High school gpa (HSGPA) Number of high school math courses taken (NUMB)
The logit model is formally expressed as follows:
( ) ( )NUMBHSGPAACTMxSuccessMath 321)(|1_Prob βββαλ +++== where λ(⋅) is the logit function, ,))exp(1/()exp( xx + α is the constant and iβ
represent logistic coefficients for each predictor variable. The effects can be
simply stated as the odds ratio.
All statistical analyses were conducted utilizing Stata version 11 and
SPost (Long & Freese, 2006). The logistic model specified above produced
the following results.

13
Table 4
Logistic Regression Parameter Estimates_____________________________
Coef. Std. Err. Z P>z [95% Conf Interval]
ACTM 0.13 0.057 2.32 0.021 0.020 0.244
HSGPA 1.87 0.299 6.23 0.000 1.280 2.456
NUMB -0.09 0.107 -0.89 0.376 -0.304 0.115
_cons -7.04 1.205 -5.84 0.000 -9.406 -4.682 Note. Likelihood-ratio (LR) = 71.84 with 3 df; p=0.000 Naglekerke's R-square = 0.308 The model appears to be significant but it is observed that NUMB, the
number of high school math courses taken, is not significantly different from
zero, p=.376. As such, we drop this variable from the analysis and recast
the model as follows:
( ) ( )HSGPAACTMxSuccessMath 21)(|1_Prob ββαλ ++==
The revised logistic regression produced the following parameter
estimates (Table 5) and odds ratio estimates (Table 6).

14
Table 5
Logistic Regression Parameter Estimates_____________________________
Coef. Std. Err. Z P>z [95% Conf. Interval]
ACTM 0.12 0.057 2.25 0.024 0.0167 0.239
HSGPA 1.83 0.294 6.23 0.000 1.253 2.404
_cons -7.26 1.20 -6.07 0.000 -9.604 -4.914 Note. Likelihood-ratio (LR) = 71.84 with 2 df; p=0.000 Naglekerke's R-square = 0.307 Hosmer-Lemeshow Statistic = 8.41 with 8 df; p= 0.395
Table 6
Odds Ratio and Estimates________________________________________
Odds Ratio Std. Err. Z P>z [95% Conf.__Interval]
ACTM 1.137 .065 2.25 0.024 1.017 1.270
HSGPA 6.228 1.828 6.23 0.000 3.503 11.0707 ______________________________________________________
Interpretation
Model Interpretation. Table 5 reveals the revised logit model is
statistically significant. The reported likelihood-ratio (LR) tests that
Math_Success is jointly independent of the predictors simultaneously; Ho: β1
= β2 = 0. The LR test statistic of 71.84 is chi-squared )( 2χ with 2 degrees of
freedom and a p-value of 0.000. This demonstrates strong evidence that at
least one predictor has an effect on Math_Success. For a further test of the

15
model’s fit the Hosmer-Lemeshow statistic was estimated at 8.41 with 8 df;
p= 0.395. This probability value indicates the model fits well.
Nagelkerke's R-square (0.31) is an attempt to imitate the interpretation
of multiple OLS R-square based on the likelihood. Nagelkerke's R-square can
vary from 0 to 1.
Interpretation of Coefficients. Table 5 also reveals that each predictor
passes the Wald test indicating both predictors are significant. Nevertheless,
it is known that logistic coefficients may be found to be significant when the
corresponding correlation is found to be not significant, and vice versa. To
make certain statements about the significance of an independent variable,
both the correlation and the logit should be significant. This additional test
was completed, confirming the statistical significance of the predictors.
All coefficients are large relative to their standard errors and therefore
appear to be important predictors of Math_Success. However, the
interpretation of logit coefficients is quite different from ordinary least
squares. The logit coefficient indicates how much the logit increases for a
unit of change in the independent variable, but the probability of a 0 or 1
outcome is a nonlinear function of the logit. It is, therefore, more useful to
turn to an evaluation of “odds ratios”.
Odds Ratio Interpretation. The odds ratio table provides a more intuitive
and meaningful understanding for the impact of each predictor on

16
Math_Success. Table 6 reports odds ratio estimates for predictor variables
as well as their standard errors and confidence intervals.
High School GPA. Given a logit coefficient, iβ , the odds ratio can be
calculated exp ).( iβ For example, the logit coefficient for HSGPA equals
1.83. The odds ratio equals exp(1.83) = 6.23. Holding ACT math scores
constant, a one unit increase in high school GPA improves the expected odds
for success in Math for Liberal Arts by a factor of 6.23.
Statistical significance of HSGPA has already been established but
“confidence intervals are more informative than tests” (Agresti, 2002:172).
Table 6 provides confidence intervals for each predictor variable. The
confidence interval around the estimated HSGPA odds coefficient would
capture the true value 95% of the time if repeated samples were drawn.
It is also useful to calculate the effect of changing a predictor by one
standard unit and observe its impact on the dependent variable. If HSGPA
increases by one standard deviation (0.58) we estimate the expected odds
of success in Math for Liberal Arts improve by a factor of
2.89, 2.89.e 0.58)]*[(1.83) =
ACT Math. The odds ratio for ACTM is 1.14, signifying that each unit
increase in ACTM produces a multiplicative 14% increase in the expected
odds for math success, holding constant HSGPA.

17
We may say that when ACT Math increases one unit, the odds that math
success = 1 increases by a factor of 14%, when HSGPA is held constant at
its mean.
Holding HSGPA constant, an ACTM increase of one standard deviation
unit (2.83) the odds of math success increases by a factor of 40%,
1.40.e 2.83)]*[(.12) =
Clearly, in terms of impact HSGPA has a much greater effect on
Math_Success than ACTM. We confirm this conclusion as we interpret the
effect of both predictors on the probability of Math_Success in the next
section.
Interpretation of Probabilities
Odds and probabilities are not equivalent. As such this section will
identify the effect of the predictors on the probability of Math_Success.
We begin by graphically depicting in Figure 1 the association of probability
for Math_Success for fixed and varying levels of HSGPA and ACTM.
18
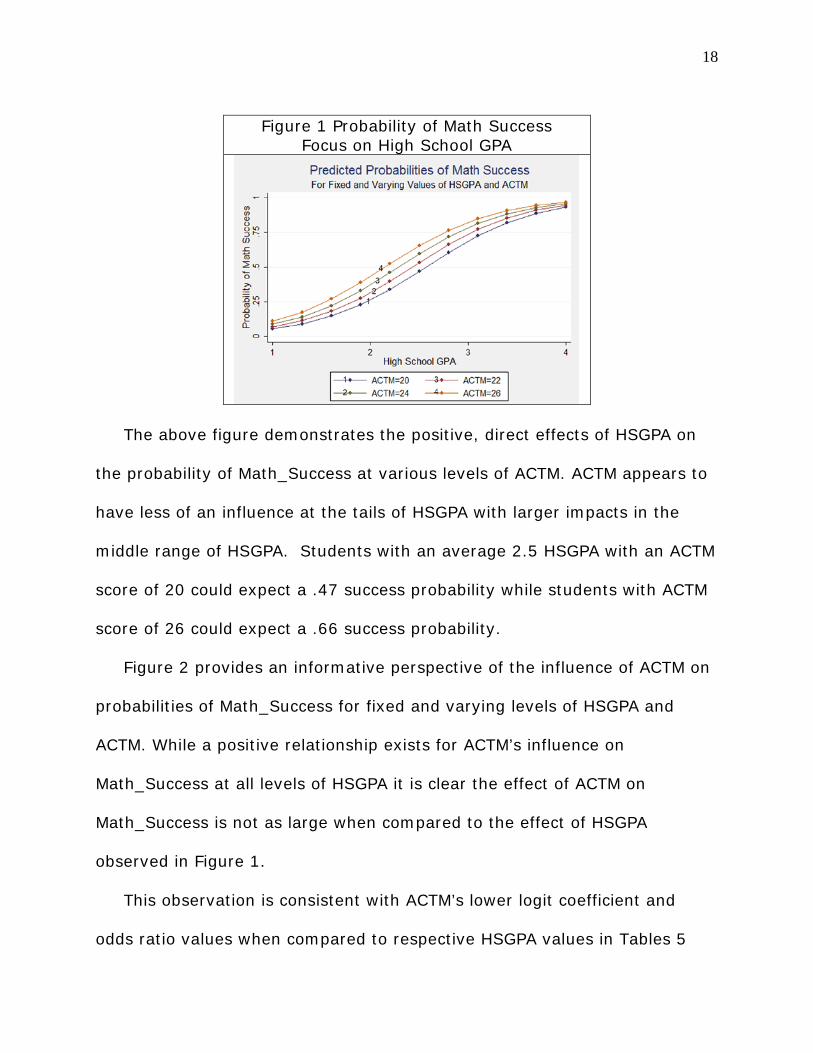
Figure 1 Probability of Math Success
Focus on High School GPA
The above figure demonstrates the positive, direct effects of HSGPA on
the probability of Math_Success at various levels of ACTM. ACTM appears to
have less of an influence at the tails of HSGPA with larger impacts in the
middle range of HSGPA. Students with an average 2.5 HSGPA with an ACTM
score of 20 could expect a .47 success probability while students with ACTM
score of 26 could expect a .66 success probability.
Figure 2 provides an informative perspective of the influence of ACTM on
probabilities of Math_Success for fixed and varying levels of HSGPA and
ACTM. While a positive relationship exists for ACTM’s influence on
Math_Success at all levels of HSGPA it is clear the effect of ACTM on
Math_Success is not as large when compared to the effect of HSGPA
observed in Figure 1.
This observation is consistent with ACTM’s lower logit coefficient and
odds ratio values when compared to respective HSGPA values in Tables 5

19
and 6. The slopes of the lines for GPA=1.0 and GPA= 4.0 in Figure 2 are
much flatter than corresponding slopes associated with GPA=2.0 and
GPA=3.0. HSGPA appears to overcome poor ACTM scores, witness the
probabilities for Math_Success for students with low ACTM scores but high
HSGPA scores.
Figure 2 Probability of Math Success
Focus on ACT Math
An informative method of demonstrating probability effects is to identify
‘different types’ of students and measure through probabilities the effect of
their characteristics on Math_Success. We identify three types of students
using ACTM and HSGPA scores: 1) those that have high favorable inputs 2)
those that posses low inputs, and 3) average students.
Students with high favorable inputs are identified as those with an ACTM
score of 24 and a HSGPA equal to 3.5. Students with low unfavorable inputs
have corresponding values of 16 (ACTM) and 1.8 (HSGPA). We also include a
category for students who have sample mean inputs (average students). The

20
associated probabilities for success in Math for Liberal Arts for these three
categories of students are provided in the following table:
Table 8 Probability of Math Success for Students with Varying ‘Inputs____________ Probability of Math_Success [95% Conf.__Interval]___ High Input Students 0.902 0.833 0.970 (ACTM=24 & HSGPA = 3.5) Students with Average Inputs 0.503 0.429 0.565 (ACTM=18.48 & HSGPA=2.68) Low Input Students 0.128 0.615 0.194 (ACTM=16 & HSGPA = 1.8) ______________________________________________________ The above table demonstrates that “inputs count”. Students with high
inputs have a .90 probability of math success. On the other hand, students
with low inputs have only a .13 probability of math success. The absolute
difference in math success probability for students with high versus low
favorable inputs is an astounding .77. Table 8 also reveals average students
have approximately a 50-50 chance for success in Math for Liberal Arts.
Conclusions
A logit model predicting student outcomes for a gateway course, Math for
Liberal Arts, was successfully developed which fits the data well. Two
variables, ACT math score and high school GPA, were found to be significant
predictors of achieving a C or better in Math for Liberal Arts.

21
Holding ACT math scores constant, a one unit increase in high school
GPA improves the expected odds for success in Math for Liberal Arts by a
factor of 6.23. Students with high inputs (those with an ACTM score of 24
and a HSGPA equal to 3.5) have a .90 probability of math success. On the
other hand, students with low inputs (ACT math score of 16 and 1.8 high
school GPA) have only a .13 probability of math success. Average students
(ACT math score of 18.48 and high school GPA of 2.68) have a 50-50 chance
of getting a C or better in Math for Liberal Arts.
An increase in ACT Math score by one unit increases the odds for math
success by a factor of 14%, when HSGPA is held constant at its mean. An
examination of logit coefficients, odds and probabilities indicates that high
school GPA has a stronger effect on success in Math for liberal Arts than ACT
scores.
Practical Implications
With two pieces of information, a student’s high school GPA and his/her
ACT math score, a counselor could input these two values into a spreadsheet
and obtain the student’s predicted probability of success in Math for Liberal
Arts. For example, assume a counselor is meeting with a student and has
the student’s HSGPA and ACTM scores, 2.01 and 16, respectively. Entering
these two values into a spreadsheet produces an expected probability of
success of .18.
Table 9

22
Counseling Students for Math for Liberal Arts_________________________
Description Measure
Enter Student High School GPA 2.01 Enter Student ACT Math Score 16.00 Probability of Earning a C or Better 0.18 ______________________________________________________ As depicted in Table 9 we have produced such a tool. Given the
relatively low probability of success in the given example the counselor could
provide advice for the student to enroll in a preparatory course or
supplementary instruction. This tool may be downloaded at
http://www.niacc.edu/admin/pres/Presentations/Statistics/Counseling for
Math for Liberal Arts.xls. The Excel spreadsheet is easily customized to
another college providing the college has completed a logistic regression
with the requisite coefficients.
In addition to the above counseling tool we believe another practical
application of the analysis suggests that the college should continue to work
with its regional middle and high schools seeking to improve degree
completion rates for all students. Sharing the analysis with key stakeholders
(faculty, students and parents) may provide the incentive for implementing
policies and practices leading to continuous quality improvement.
Recommendations
It is impossible to predict with exact preciseness success of a student in
any academic pursuit. We can use data to make strong predictions of

23
success. As with anything, there will be students who defy predictions.
Using predictive data will help to place a student in the class appropriate for
their level of academic preparedness. The desired outcome of appropriate
course placement will reduce student frustrations and improve persistence to
graduation rates.
The current practice at NIACC of using the ACT math score for placement
has been studied and proved to be a reliable predictor of success. Valid
predictions for success would improve if the College also began to use high
school GPA in concurrence with ACT math scores. The results of this study
show a stronger correlation to success in the course Math for Liberal Arts
with the high school GPA. Use of the ACT math and high school GPA to
compute probabilities of success would provide an increased prediction of
success.
It is recommended that NIACC continue the practice by student services
personnel of relying on the ACT math score for placement in the course Math
for Liberal Arts. It is further recommended student services personnel
incorporate the use of high school GPA in course placement criteria.

24
References
Agresti, A. (2002) Categorical data analysis (2nd ed.). New York: John Wiley
& Sons, Inc, p. 165.
Benford, R., & Gess-Newsome, J. (2006). Factors affecting student academic
success in gateway courses at Northern Arizona University. Flagstaff:
Northern Arizona University, Center for Science teaching and Learning.
Bone, M. A. (1981). A comparison of three methods of mathematics
placement for college freshmen. Doctoral dissertation, Michigan State
University, East Lansing. Dissertation Abstracts International, 42/02A,
AAD81-17212.
Bridgeman, B. (1982). Comparative validity of the college board scholastic
aptitude test: Mathematics and the descriptive tests of mathematical
skills for predicting performance in college mathematical courses.
Educational and Psychological Measurement, 42, 361-366.
Callahan, S. (1993). Mathematics placement at Cotty College. Paper
presented at the 19th annual conference of the American Mathematical
Association of Two-year Colleges. November 18-21, Boston, MA.
Crooks, T. J. (1980). Grade prediction: The usefulness of contest-specific
predictors. Dunedin, New Zealand: University of Otago.
Duranczyk, M., & Higbee, J. (2006). Developmental mathematics in 4-year
institutions: Denying access. Journal of Developmental Education,
30(1), 22-31.

25
Felder, J. E., Finney, J. E., & Kirst, M. W. (2007). Informed self-placement at
American River College: A case study. San Jose, CA: The National
Center for Public Policy and Higher Education.
Golfin, P., Jordon, W., Hull, D., & Ruffin, M. (2005). Strengthening
mathematics skills at the postsecondary level: literature review and
analysis. Washington, DC: The CAN Corporation for U.S. Department
of Education, Office of Vocational and Adult Education, Division of
Adult Education and Literacy.
Gussett, J. (1974). College entrance examination board scholastic aptitude
test scores as a predictor of college freshman mathematics grades.
Educational and Psychological Measurement, 34, 953-955.
Haase, M., & Caffrey, P. (1983a). Assessment procedures, fall 1982 and
spring 1983 semi-annual research report, part 1. Sacramento, CA:
Sacramento City College.
Haase, M., & Caffrey, P. (1983b). Assessment and placement at Sacramento
City College. Sacramento, CA. Sacramento City College.
Helmick, F. L. (1983). Evaluation of the placement test for first-year
mathematics at the University of Akron. Doctoral dissertation,
Michigan State University, East Lansing. Dissertation Abstracts
International 44/02A, AAD83-14828
26
House, J. D. (1995). Noncognitive predictors of achievement in introductory
college mathematics. Journal of College Student Development, 36(2),
171-181.
Illich, P. A., Hagan, C., & McCallister, L. (2004). Performance in college-level
courses among students concurrently enrolled in remedial courses:
Policy implications. Community College Journal of Research and
Practice, 28, 435-453.
Jenkins, D., Jaggars, S., & Roksa, J. (2009). Promoting gatekeeper course
success among community college students needing remediation:
Findings and recommendations from a Virginia study (Summary
report). New York, NY: Community College Research Center, Teachers
College, Columbia University.
Kohler, E. T. (1973). The relationship between cooperative mathematics
tests, algebra III, ACT mathematics usage test, ACT composite and
grade point average in college algebra. Education and Psychological
Measurement, 33, 929-931.
Kozeracki, C. A. (2002). ERIC review: Issues in developmental education.
Community College Review, 29(4), 83-100.
Lewallen, W. C. (1994, September 29). Multiple measures in placement
recommendations: An examination of variables related to course
success. Lancaster, CA: Antelope Valley College.

27
Long, J. S. & Freese J. (2006). Regression models for categorical dependent
variables using Stata. (2nd ed.). College Station, TX: Stata Press.
Mercer, B. (1995). A comparison of students who followed mathematics
advisement recommendation and students who did not at Rochester
community college. Doctoral dissertation, Nova Southeastern
University, Ft. Lauderdale, FL.
Noble, J. P., & Sawyer, R. L. (1989). Predicting grades in college freshman
English and mathematics courses. Journal of College Student
Development, 30, 345-353.
Richards, J. M., Holland, J. L., & Lutz, S. W. (1966). The prediction of
student accomplishment in college. Iowa City, IA: American College
Testing Program.
Schultz, S. J., & Austin, H. W. (1987). An evaluation of a self-assessment
test used to predict success in introductory college mathematics
courses. International Journal of Mathematics Education in Science and
Technology, 18, 507-518.
Yellott, R.T. (1981). An evaluation of the developmental mathematics
program at McNesse State University. Doctoral dissertation, McNesse
State University, Lake Charles, LA. Dissertation Abstracts
International, 42/06A, AAD81-26987.