predicting student flight performance with multimodal features
TRANSCRIPT

Predicting Student Flight Performancewith Multimodal Features?
Zerong Xi1[0000−0002−6905−7860], Olivia Newton1[0000−0001−9508−8946],Greg McGowin1[0000−0003−0858−1404], Gita Sukthankar1[0000−0002−6863−6609],
Steve Fiore1[0000−0003−3529−1322], and Kevin Oden2[0000−0002−6365−5456]
1 University of Central Florida, Orlando, FL US2 Lockheed Martin, Orlando, FL US
Abstract. This paper investigates the problem of predicting studentflight performance in a training simulation from multimodal features, in-cluding flight controls, visual attention, and knowledge acquisition tests.This is a key component of developing next generation training simula-tions that can optimize the usage of student training time. Two types ofsupervised machine learning classifiers (random forest and support vec-tor machines) were trained to predict the performance of twenty-threestudents performing simple flight tasks in virtual reality. Our experi-ments reveal the following: 1) features derived from gaze tracking andknowledge acquisition tests can serve as an adequate substitute for flightcontrol features; 2) data from the initial portion of the flight task is suf-ficient to predict the final outcome; 3) our classifiers perform slightlybetter at predicting student failure than success. These results indicatethe feasibility of using machine learning for early prediction of studentfailures during flight training.
Keywords: intelligent training simulations · supervised learning · gazetracking · multimodal features · pilot training
1 Introduction
The aim of our research is to monitor and track complex knowledge and skillacquisition by applying machine learning algorithms to a mixture of physiologi-cal and performance-based indicators extracted from pilot training sessions. Asthe complexity of aircraft cockpit operations increases, so does the risk of hu-man error. With training this risk can be reduced immensely. Automating thedelivery of instruction through the use of intelligent training simulations andcommercially available virtual reality headsets may offer a scalable and cost ef-fective solution for increasing the amount of training pilots receive. If the datacollected during training can be leveraged to predict task performance usingmachine learning, both student and instructor training time can be allocatedwisely.
? Research supported by Lockheed Martin Co.
2 Xi et al.
This paper describes a set of experiments conducted to evaluate the suitabil-ity of different machine learning paradigms for predicting student performanceon simple flight tasks executed in virtual reality. Supervised machine learning hasachieved notable successes across multiple domains including image and speechrecognition. However these successes were achieved through the use of complexdeep learning models which can only be effectively trained with huge trainingsets, due to the large number of parameters. For instance, one of most popularcomputer vision systems, ResNet-50 has over 23 million parameters that needto be fit from training data. Hence our study only considers machine learningmodels that can be trained on data from a relatively small number of students.To compensate for the limited number of training examples, we assume that itis possible to capture data from multiple modalities, including knowledge tests,user interface controls, and visual attention, to create a small but rich datasetof student interactions.
Experiments were conducted in the Prepar3D flight simulator, which wasdesigned to deliver immersive, experiential learning for both professional andacademic pilot skills training. Subjects wore an HTC Vive Pro VR headset, andvisual attention data was collected from a built-in Tobii eye tracker. Duringa two hour period, novice subjects were trained to perform simple flight tasksin Prepar3D. Each flight task tested their ability to achieve a target direction,airspeed, and altitude while monitoring the correct instruments. Students weregraded as successful if they were able to achieve and maintain the target direc-tion, airspeed, and/or altitude.
We evaluated the accuracy and F1 score of two supervised learning classi-fiers, random forest (RFC) and support vector machines (SVM), at predictingstudent success using different multimodal feature sets. This paper examines thefollowing research questions:– RQ1: are features derived from gaze tracking and knowledge tests an ac-
ceptable substitute for flight control features?– RQ2: can data from the initial portion of the task be used to predict the
final outcome?– RQ3: is it possible to accurately predict student failure?
2 Related Work
There is a rich body of related work on predicting student performance [8, 2],pilot monitoring [3, 6], and leveraging visual attention features [5, 4]. Much of theresearch on predicting student performance has been conducted over the timehorizon of a semester long course, using assignment grades as features [8]. Thesestudent coursework features can be supplemented with Learning ManagementSystem (LMS) data collected from platforms such as Moodle. An LMS systemcan collect detailed data about student engagement, including clicks, edits, pageviews, and total time spent online. Disappointingly, a sizable study conductedby Conijn et al. [2] revealed little benefit was gained by adding LMS features toin-between knowledge assessment tests for creating early intervention systems
Predicting Student Flight Performance with Multimodal Features 3
to detect students at risk for course failure. Our research aims to predict perfor-mance over a significantly shorter time horizon (minutes rather than months).Rather than using click data, student attention is measured using a gaze trackingsystem.
Visual attention features have been employed to track many aspects of stu-dent cognition, including workload, mind wandering [5], and problem solvingprogress [7]. Peysakhovich et al. [6] endorsed eye tracking integration as a gen-eral tool for enhancing cockpit safety and highlighted both pilot training andperformance analysis as fruitful application areas. Here we include features torepresent both the visual attention distribution and gaze entropy [4] across cock-pit instruments.
Within the machine learning community, there has been previous work ontraining classifiers on small datasets. Commonly used strategies include transferlearning and supplementing the dataset with synthetic training examples. Ourclassifiers were trained using the SMOTE [1] technique to create synthetic mi-nority class examples to supplement our small, unbalanced dataset. The nextsection describes our data collection procedure.
3 Experiments
Experiments were conducted on 23 subjects recruited from the University ofCentral Florida. The participant pool consisted of 15 male (64%) and 8 femaleaged 18-29 (M = 19.5, SD = 2.4). The subjects are considered novice pilots asnone of them has received any prior flight training. Most (87%) of the subjectsreport little or no familiarity with flight simulators, and most (78%) of them ratefair or less on their video expertise and report an average weekly video gameplaying of 7.5 hours (SD = 8.4).
3.1 Procedure
The full timeline of the study is as follows:– Informed consent process (5 minutes)– Video game experience survey (5 minutes)– Cognitive tasks (10 minutes)– Training (15-20 minutes)– Card sort I (5-10 minutes)– Knowledge acquisition assessment (10-15 minutes)– Flight simulator practice tasks (15 minutes)– Card sort II (15-20 minutes)– Flight simulator experimental tasks (15 minutes)– Demographics survey (5 minutes)– Study wrapup (5 minutes)
The training consisted of both text and images, and is organized into fivesections: aircraft model; aircraft controls; flight maneuvers; flight instruments;simulator tasks. Participants are able to review the training materials at their
4 Xi et al.
own pace, and are free to move forward and backward through the materials butare instructed that they would not be able to return to any portion of the trainingonce they began the testing session. Within the training, they receive conceptualinformation about the physics of flight, practical information for successful flightmaneuver execution in the VR environment, and specific information about theflight simulator tasks used in the experiment.
During the testing session, subjects are tested on the concepts they learntusing a questionnaire consisting of 10 recall questions, 10 descriptive questionsand 10 conceptual questions. An example question is “Attempting to ascend tooquickly can result in the aircraft ”. Data from the subject responses is encodedinto knowledge mastery features to be used by the machine learning classifiers.Vectors Qi ∈ {correct, incorrect}M , i = 1, 2, 3, ... are reported where i is thesubject’s ID and M is the number of questions. The time the subjects spend oneach question and their confidence are reported as well.
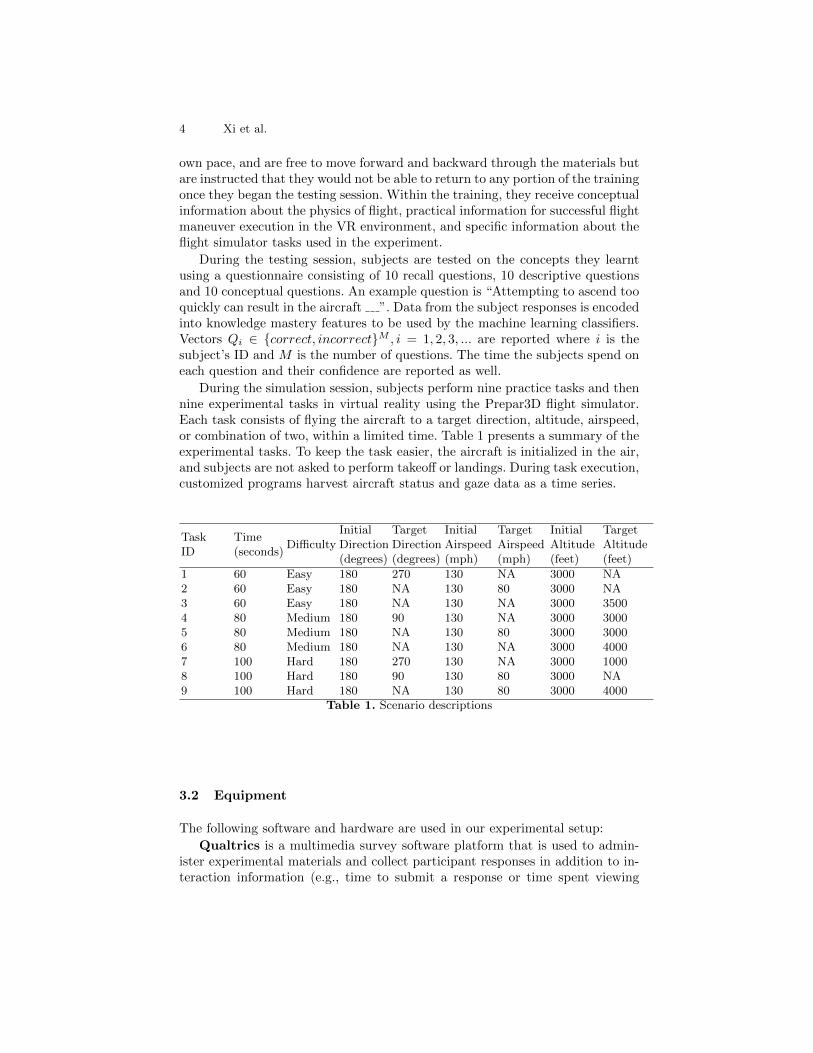
During the simulation session, subjects perform nine practice tasks and thennine experimental tasks in virtual reality using the Prepar3D flight simulator.Each task consists of flying the aircraft to a target direction, altitude, airspeed,or combination of two, within a limited time. Table 1 presents a summary of theexperimental tasks. To keep the task easier, the aircraft is initialized in the air,and subjects are not asked to perform takeoff or landings. During task execution,customized programs harvest aircraft status and gaze data as a time series.
TaskID
Time(seconds)
DifficultyInitialDirection(degrees)
TargetDirection(degrees)
InitialAirspeed(mph)
TargetAirspeed(mph)
InitialAltitude(feet)
TargetAltitude(feet)
1 60 Easy 180 270 130 NA 3000 NA2 60 Easy 180 NA 130 80 3000 NA3 60 Easy 180 NA 130 NA 3000 35004 80 Medium 180 90 130 NA 3000 30005 80 Medium 180 NA 130 80 3000 30006 80 Medium 180 NA 130 NA 3000 40007 100 Hard 180 270 130 NA 3000 10008 100 Hard 180 90 130 80 3000 NA9 100 Hard 180 NA 130 80 3000 4000
Table 1. Scenario descriptions
3.2 Equipment
The following software and hardware are used in our experimental setup:
Qualtrics is a multimedia survey software platform that is used to admin-ister experimental materials and collect participant responses in addition to in-teraction information (e.g., time to submit a response or time spent viewing

Predicting Student Flight Performance with Multimodal Features 5
materials). We use the platform to administer training, our experimental mea-sures of knowledge acquisition and mental models, and demographics and videogame experience surveys.
Prepar3D is a 3-D flight simulator developed by Lockheed Martin Co. to de-liver immersive, experiential learning for professional and academic pilot trainingprograms. Subjects interact with Prepar3D using a Logitech G X56 H.O.T.A.S.RGB Throttle and Stick Simulation Controller. Using the customized tools de-veloped with the SDK, we are able to extract both the aircraft status data andcontroller data directly from Prepar3D.
HTC Vive Pro is a virtual reality headset with a built-in Tobii eye tracker.It has a resolution of 1440×1600 per eye, a refresh rate of 90Hz, and a fieldof view of 110 degrees. The built-in Tobii eye tracker has a gaze data outputfrequency of 120Hz, an accuracy of 0.5-1.1 degree, and a trackable field of viewof 110 degrees.Qualtrics is used during the training and testing sessions, while the other toolsare used during the flight simulation sessions.
3.3 Data Collection
While the subjects perform the flight simulator experimental tasks, time seriesdata is collected from three sources:
1. aircraft status data including the aircraft’s geodesic coordinates (degree),altitude (feet), 3-D orientation (degrees) and 3-D velocity (feet per second);
2. flight control data including the aileron (percentage), elevator (percentage)and throttle (percentage);
3. subject gaze data (Figure 1), including 3-D gaze direction, pupil diameters(mm), eye openness (percentage) and area of interest.
Additionally, we infer outcome ∈ {success, fail} for each subject and task fromaircraft status data by determining if the aircraft achieves the target status(within predefined error bounds) for a continuous period of greater than fiveseconds.
Data for training the machine learning classifiers is created by synchronizingthe three sources and then only retaining the data from the time periods duringwhich the subject is attempting to complete the task. The initial instructionphase during which the subject is still receiving verbal directions from the ex-perimenter and the final success period (if any) are both removed from the timeseries. Obviously the aircraft status and flight control data captured during tasksuccess would be highly informative; however, our aim is to determine whether itis possible to predict task success before it occurs. All subsequent data processingand feature extraction procedures are performed on the truncated data.
Then we create a subset of the data from the first half of the time series totrain the machine learning classifiers. Classifiers are either trained with data fromthe first half (half ) or the entire time series minus the success period (full). Bycomparing the performance of these classifiers, we can explore the role of early
6 Xi et al.
student behaviors on overall flight performance. This is a key element of beingable to create an early intervention system for preemptively detecting studentfailures.
Airspeed AltitudeAltimeter
Turn CoordinatorHeading
Vertical Speed0
20
40
60
80
100
Perc
enta
ge
task 1
Airspeed AltitudeAltimeter
Turn CoordinatorHeading
Vertical Speed0
20
40
60
80
100
Perc
enta
ge
task 2
Airspeed AltitudeAltimeter
Turn CoordinatorHeading
Vertical Speed0
20
40
60
80
100
Perc
enta
ge
task 3
Airspeed AltitudeAltimeter
Turn CoordinatorHeading
Vertical Speed0
20
40
60
80
100
Perc
enta
ge
task 4
Airspeed AltitudeAltimeter
Turn CoordinatorHeading
Vertical Speed0
20
40
60
80
100
Perc
enta
ge
task 5
Airspeed AltitudeAltimeter
Turn CoordinatorHeading
Vertical Speed0
20
40
60
80
100
Perc
enta
ge
task 6
Airspeed AltitudeAltimeter
Turn CoordinatorHeading
Vertical Speed0
20
40
60
80
100
Perc
enta
ge
task 7
Airspeed AltitudeAltimeter
Turn CoordinatorHeading
Vertical Speed0
20
40
60
80
100
Perc
enta
ge
task 8
Airspeed AltitudeAltimeter
Turn CoordinatorHeading
Vertical Speed0
20
40
60
80
100
Perc
enta
ge
task 9
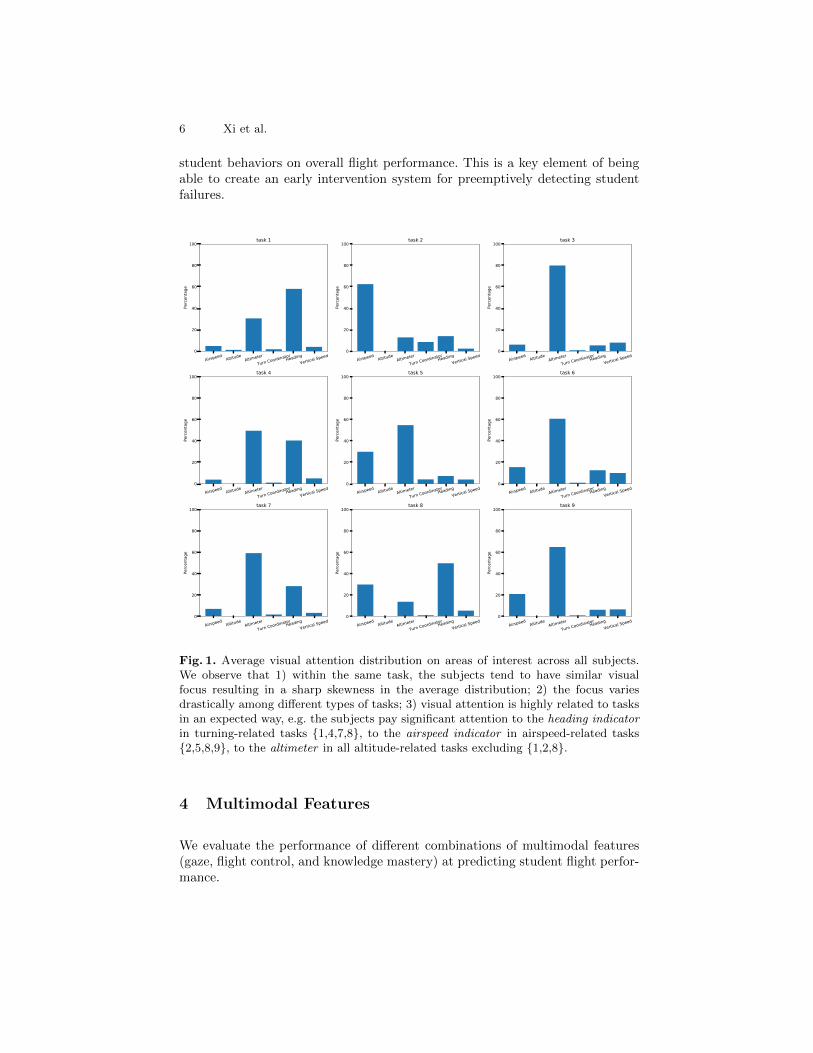
Fig. 1. Average visual attention distribution on areas of interest across all subjects.We observe that 1) within the same task, the subjects tend to have similar visualfocus resulting in a sharp skewness in the average distribution; 2) the focus variesdrastically among different types of tasks; 3) visual attention is highly related to tasksin an expected way, e.g. the subjects pay significant attention to the heading indicatorin turning-related tasks {1,4,7,8}, to the airspeed indicator in airspeed-related tasks{2,5,8,9}, to the altimeter in all altitude-related tasks excluding {1,2,8}.
4 Multimodal Features
We evaluate the performance of different combinations of multimodal features(gaze, flight control, and knowledge mastery) at predicting student flight perfor-mance.

Predicting Student Flight Performance with Multimodal Features 7
4.1 Gaze Data
Since the tasks require the subjects to use the instrument panel to verify thatthe aircraft has achieved target status, the distribution of visual attention acrossthe instruments is likely to be an informative feature. Six areas of interest (AOI)are designated as follows: airspeed indicator, altitude indicator, altimeter, turncoordinator, heading indicator and vertical speed indicator. Figure 2 shows theinstrument panel marked with the AOIs. The gaze feature vector includes theproportional time distribution and stationary/transition entropy for the AOIs,both of which are explained below. How the subjects allocate their attention
Fig. 2. The instrument panel of the aircraft (Maule Orion) marked with our six AOIs.
between the indicators reveals what information they consider most relevantto the ongoing task. Since our flight tasks require combinations of climbing,descending, slowing down and turning, each task is likely to be associated with asubset of the indicators. Therefore, we expect that a reasonable visual attentiondistribution is crucial to success. Hence the proportional time distribution ofvisual attention over the AOIs is used as a feature vector. The averages of thesedistributions across all the subjects are shown in Figure 1.
According to [6], there exists an optimal visual scan path for a given visualproblem. We propose that the theory is true for a given operational problem aswell, since attention and operation are generally consistent. Instead of searchingthe visual scan path, we apply gaze transition entropy [4] here, which reflectsthe degree of the path’s randomness.
Given a set S of AOIs and a gaze switching sequence across S, the procedureof computing gaze transition entropy is as follows: firstly, a gaze transition matrixC ∈ N‖S‖×‖S‖ is obtained by counting gaze transition from i ∈ S to j ∈ S as en-try Cij ; secondly, stationary probabilities πi =
∑k∈S Cik/
∑l,m∈S Clm and tran-
sition probabilities pij = Cij/∑
k∈S Cik, where i, j ∈ S, are calculated; finally,we obtain the entropy of transition distributionHt = −
∑i∈S πi
∑j∈S pij log2 pij
and the entropy of stationary distribution Hs = −∑
i∈S πi log2 πi.
8 Xi et al.
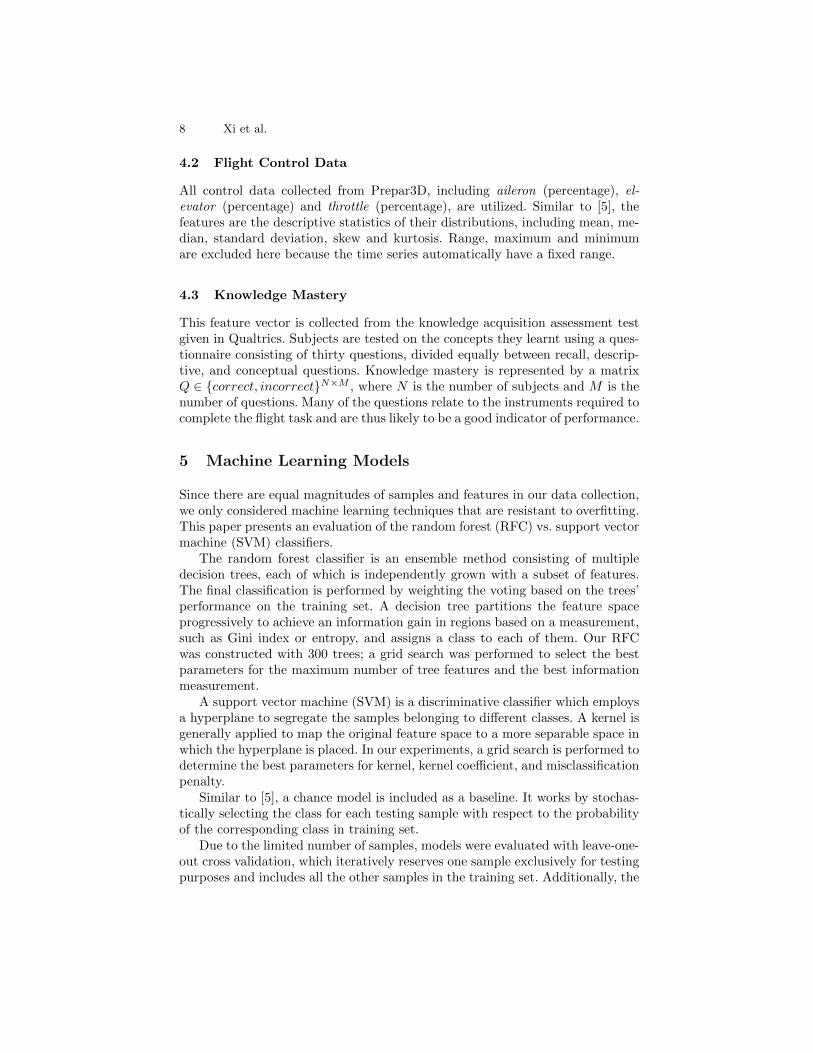
4.2 Flight Control Data
All control data collected from Prepar3D, including aileron (percentage), el-evator (percentage) and throttle (percentage), are utilized. Similar to [5], thefeatures are the descriptive statistics of their distributions, including mean, me-dian, standard deviation, skew and kurtosis. Range, maximum and minimumare excluded here because the time series automatically have a fixed range.
4.3 Knowledge Mastery
This feature vector is collected from the knowledge acquisition assessment testgiven in Qualtrics. Subjects are tested on the concepts they learnt using a ques-tionnaire consisting of thirty questions, divided equally between recall, descrip-tive, and conceptual questions. Knowledge mastery is represented by a matrixQ ∈ {correct, incorrect}N×M , where N is the number of subjects and M is thenumber of questions. Many of the questions relate to the instruments required tocomplete the flight task and are thus likely to be a good indicator of performance.
5 Machine Learning Models
Since there are equal magnitudes of samples and features in our data collection,we only considered machine learning techniques that are resistant to overfitting.This paper presents an evaluation of the random forest (RFC) vs. support vectormachine (SVM) classifiers.
The random forest classifier is an ensemble method consisting of multipledecision trees, each of which is independently grown with a subset of features.The final classification is performed by weighting the voting based on the trees’performance on the training set. A decision tree partitions the feature spaceprogressively to achieve an information gain in regions based on a measurement,such as Gini index or entropy, and assigns a class to each of them. Our RFCwas constructed with 300 trees; a grid search was performed to select the bestparameters for the maximum number of tree features and the best informationmeasurement.
A support vector machine (SVM) is a discriminative classifier which employsa hyperplane to segregate the samples belonging to different classes. A kernel isgenerally applied to map the original feature space to a more separable space inwhich the hyperplane is placed. In our experiments, a grid search is performed todetermine the best parameters for kernel, kernel coefficient, and misclassificationpenalty.
Similar to [5], a chance model is included as a baseline. It works by stochas-tically selecting the class for each testing sample with respect to the probabilityof the corresponding class in training set.
Due to the limited number of samples, models were evaluated with leave-one-out cross validation, which iteratively reserves one sample exclusively for testingpurposes and includes all the other samples in the training set. Additionally, the
Predicting Student Flight Performance with Multimodal Features 9
high variance on the task success rate unbalances the dataset. Thus, for eachindividual experiment in cross validation, the training set is resampled with theoversampling method SMOTE [1] while leaving the testing sample unchanged.
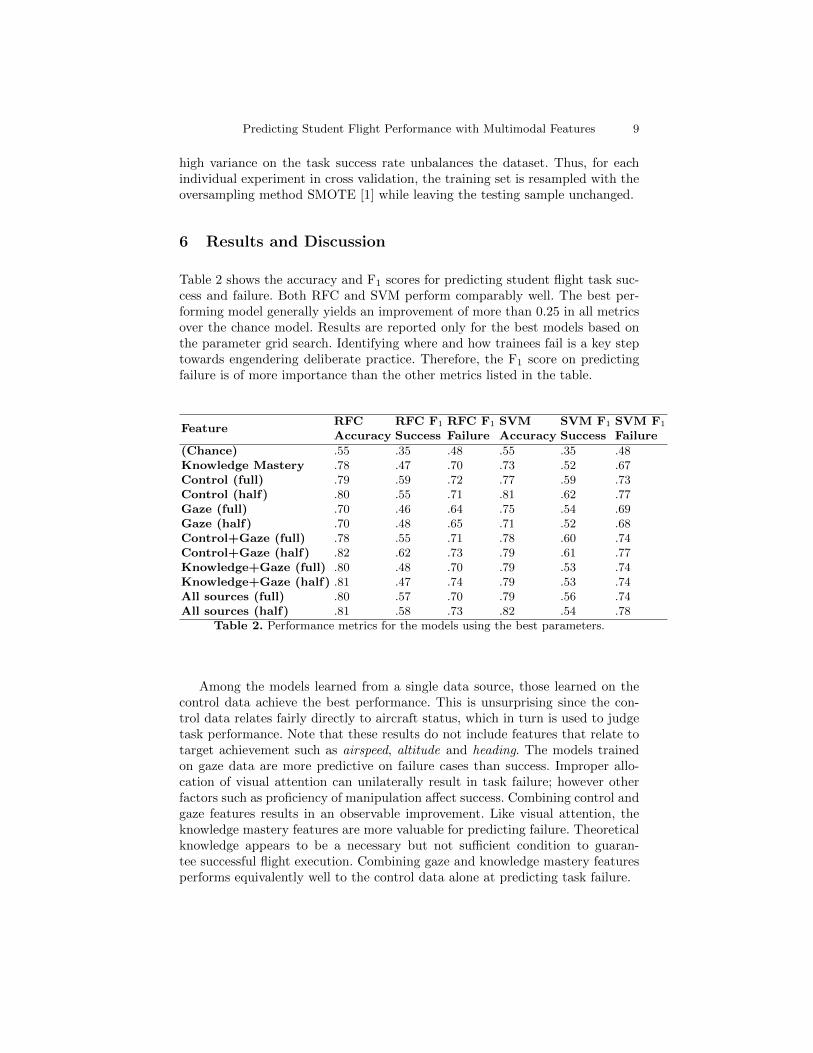
6 Results and Discussion
Table 2 shows the accuracy and F1 scores for predicting student flight task suc-cess and failure. Both RFC and SVM perform comparably well. The best per-forming model generally yields an improvement of more than 0.25 in all metricsover the chance model. Results are reported only for the best models based onthe parameter grid search. Identifying where and how trainees fail is a key steptowards engendering deliberate practice. Therefore, the F1 score on predictingfailure is of more importance than the other metrics listed in the table.
FeatureRFCAccuracy
RFC F1
SuccessRFC F1
FailureSVMAccuracy
SVM F1
SuccessSVM F1
Failure
(Chance) .55 .35 .48 .55 .35 .48Knowledge Mastery .78 .47 .70 .73 .52 .67Control (full) .79 .59 .72 .77 .59 .73Control (half) .80 .55 .71 .81 .62 .77Gaze (full) .70 .46 .64 .75 .54 .69Gaze (half) .70 .48 .65 .71 .52 .68Control+Gaze (full) .78 .55 .71 .78 .60 .74Control+Gaze (half) .82 .62 .73 .79 .61 .77Knowledge+Gaze (full) .80 .48 .70 .79 .53 .74Knowledge+Gaze (half) .81 .47 .74 .79 .53 .74All sources (full) .80 .57 .70 .79 .56 .74All sources (half) .81 .58 .73 .82 .54 .78
Table 2. Performance metrics for the models using the best parameters.
Among the models learned from a single data source, those learned on thecontrol data achieve the best performance. This is unsurprising since the con-trol data relates fairly directly to aircraft status, which in turn is used to judgetask performance. Note that these results do not include features that relate totarget achievement such as airspeed, altitude and heading. The models trainedon gaze data are more predictive on failure cases than success. Improper allo-cation of visual attention can unilaterally result in task failure; however otherfactors such as proficiency of manipulation affect success. Combining control andgaze features results in an observable improvement. Like visual attention, theknowledge mastery features are more valuable for predicting failure. Theoreticalknowledge appears to be a necessary but not sufficient condition to guaran-tee successful flight execution. Combining gaze and knowledge mastery featuresperforms equivalently well to the control data alone at predicting task failure.
10 Xi et al.
Finally, classifiers trained on the first half of the data yield similar perfor-mance to classifiers trained on the full dataset. It is possible that 1) behavioralobservation over a short time window is sufficient to determine student per-formance or 2) manipulations during early flight stages are crucial to the finaloutcome.
7 Conclusion and Future Work
Our experiments show that it is feasible to accurately predict student failure onsimple flight tasks from visual attention features gathered from the initial flightphase, combined with knowledge mastery features; these results affirmativelyanswer all our research questions. We also demonstrate that it is possible to trainthe machine learning classifiers on a very small dataset using a combination oftechniques. These are important stepping stones towards the long-term vision ofscalable, automated delivery of flight instruction using off the shelf virtual realityheadsets. In future work, we will investigate the usage of failure predictions tomodify the order of practice tasks as well as conducting a deeper exploration ofthe data collected outside the flight tests.
References
1. Chawla, N.V., Bowyer, K.W., Hall, L.O., Kegelmeyer, W.P.: SMOTE: Syntheticminority over-sampling technique. Journal of Artificial Intelligence Research 16(1),321–357 (Jun 2002)
2. Conijn, R., Snijders, C., Kleingeld, A., Matzat, U.: Predicting student performancefrom LMS data: A comparison of 17 blended courses using Moodle LMS. IEEETransactions on Learning Technologies 10(1), 17–29 (2017)
3. Dehais, F., Behrend, J., Peysakhovich, V., Causse, M., Wickens, C.D.: Pilot flyingand pilot monitoring’s aircraft state awareness during go-around execution in avia-tion: A behavioral and eye tracking study. The International Journal of AerospacePsychology 27(1-2), 15–28 (2017)
4. Krejtz, K., Duchowski, A., Szmidt, T., Krejtz, I., Gonzalez Perilli, F., Pires, A.,Vilaro, A., Villalobos, N.: Gaze Transition Entropy. ACM Transactions on AppliedPerception 13(1), 1–20 (Dec 2015)
5. Millsa, C., Bixlera, R., Wang, X., D’Mello, S.K.: Automatic Gaze-Based Detectionof Mind Wandering during Narrative Film Comprehension. International Conferenceon Multimodal Interaction (2015)
6. Peysakhovich, V., Lefrancois, O., Dehais, F., Causse, M.: The Neuroergonomics ofAircraft Cockpits: The Four Stages of Eye-Tracking Integration to Enhance FlightSafety. Safety 4 (2018)
7. Susac, A., Bubic, A., Kaponja, J., Planinic, M., Palmovic, M.: Eye MovementsReveal Students’ Strategies in Simple Equation Solving. International Journal ofScience and Mathematics Education 12(3), 555–577 (2014)
8. Thai-Nghe, N., Drumond, L., Krohn-Grimberghe, A., Schmidt-Thieme, L.: Rec-ommender system for predicting student performance. Procedia Computer Science1(2), 2811 – 2819 (2010), proceedings of the Workshop on Recommender Systemsfor Technology Enhanced Learning (RecSysTEL 2010)