predicting software assurance using quality and … software assurance using quality and reliability...
TRANSCRIPT

Predicting Software Assurance Using Quality and Reliability Measures
Carol Woody, Ph.D. Robert Ellison, Ph.D. William Nichols, Ph.D.
December 2014
TECHNICAL NOTE CMU/SEI-2014-TN-026
CERT Division/SSD
http://www.sei.cmu.edu
Copyright 2014 Carnegie Mellon University This material is based upon work funded and supported by the Department of Defense under Contract No. FA8721-05-C-0003 with Carnegie Mellon University for the operation of the Software Engineer-ing Institute, a federally funded research and development center. Any opinions, findings and conclusions or recommendations expressed in this material are those of the author(s) and do not necessarily reflect the views of the United States Department of Defense. This report was prepared for the SEI Administrative Agent AFLCMC/PZM 20 Schilling Circle, Bldg 1305, 3rd floor Hanscom AFB, MA 01731-2125 NO WARRANTY. THIS CARNEGIE MELLON UNIVERSITY AND SOFTWARE ENGINEERING INSTITUTE MATERIAL IS FURNISHED ON AN “AS-IS” BASIS. CARNEGIE MELLON UNIVERSITY MAKES NO WARRANTIES OF ANY KIND, EITHER EXPRESSED OR IMPLIED, AS TO ANY MATTER INCLUDING, BUT NOT LIMITED TO, WARRANTY OF FITNESS FOR PURPOSE OR MERCHANTABILITY, EXCLUSIVITY, OR RESULTS OBTAINED FROM USE OF THE MATERIAL. CARNEGIE MELLON UNIVERSITY DOES NOT MAKE ANY WARRANTY OF ANY KIND WITH RESPECT TO FREEDOM FROM PATENT, TRADEMARK, OR COPYRIGHT INFRINGEMENT. This material has been approved for public release and unlimited distribution except as restricted be-low. Internal use:* Permission to reproduce this material and to prepare derivative works from this material for internal use is granted, provided the copyright and “No Warranty” statements are included with all reproductions and derivative works. External use:* This material may be reproduced in its entirety, without modification, and freely distrib-uted in written or electronic form without requesting formal permission. Permission is required for any other external and/or commercial use. Requests for permission should be directed to the Software En-gineering Institute at [email protected]. * These restrictions do not apply to U.S. government entities. Team Software ProcessSM and TSPSM are service marks of Carnegie Mellon University. DM-0002014 .
CMU/SEI-2014-TN-026 | i
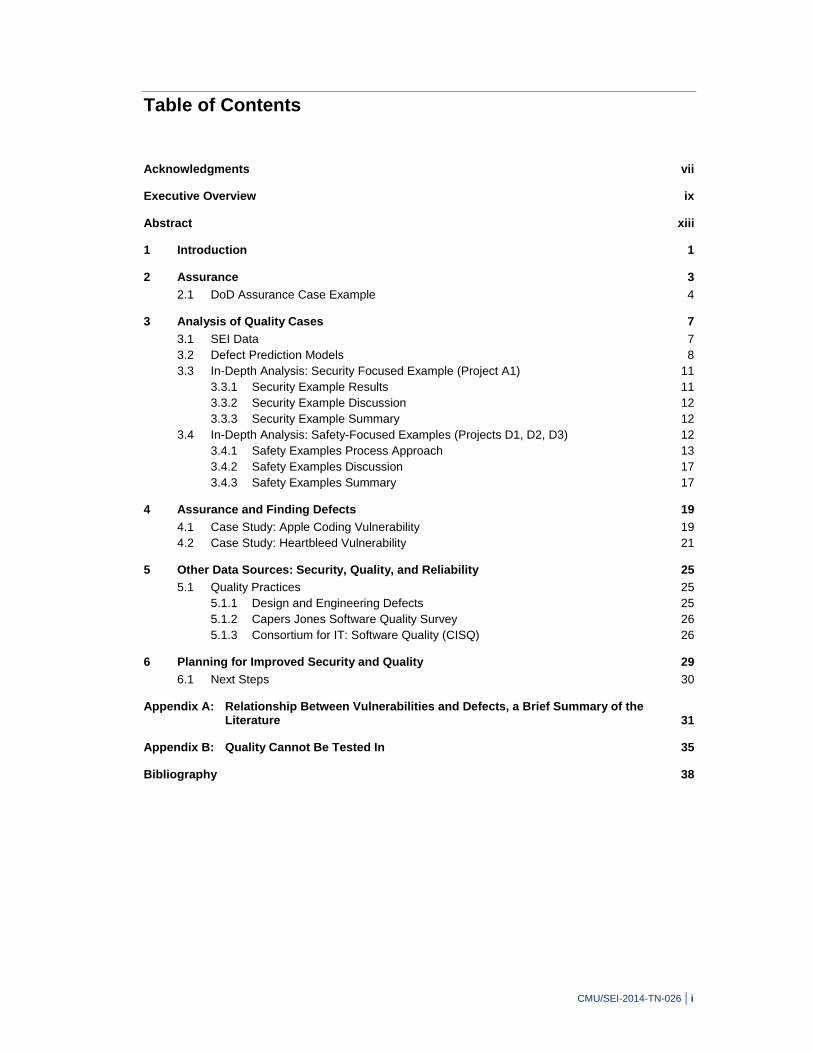
Table of Contents
Acknowledgments vii
Executive Overview ix
Abstract xiii
1 Introduction 1
2 Assurance 3 2.1 DoD Assurance Case Example 4
3 Analysis of Quality Cases 7 3.1 SEI Data 7 3.2 Defect Prediction Models 8 3.3 In-Depth Analysis: Security Focused Example (Project A1) 11
3.3.1 Security Example Results 11 3.3.2 Security Example Discussion 12 3.3.3 Security Example Summary 12
3.4 In-Depth Analysis: Safety-Focused Examples (Projects D1, D2, D3) 12 3.4.1 Safety Examples Process Approach 13 3.4.2 Safety Examples Discussion 17 3.4.3 Safety Examples Summary 17
4 Assurance and Finding Defects 19 4.1 Case Study: Apple Coding Vulnerability 19 4.2 Case Study: Heartbleed Vulnerability 21
5 Other Data Sources: Security, Quality, and Reliability 25 5.1 Quality Practices 25
5.1.1 Design and Engineering Defects 25 5.1.2 Capers Jones Software Quality Survey 26 5.1.3 Consortium for IT: Software Quality (CISQ) 26
6 Planning for Improved Security and Quality 29 6.1 Next Steps 30
Appendix A: Relationship Between Vulnerabilities and Defects, a Brief Summary of the Literature 31
Appendix B: Quality Cannot Be Tested In 35
Bibliography 38

CMU/SEI-2014-TN-026 | ii
CMU/SEI-2014-TN-026 | iii
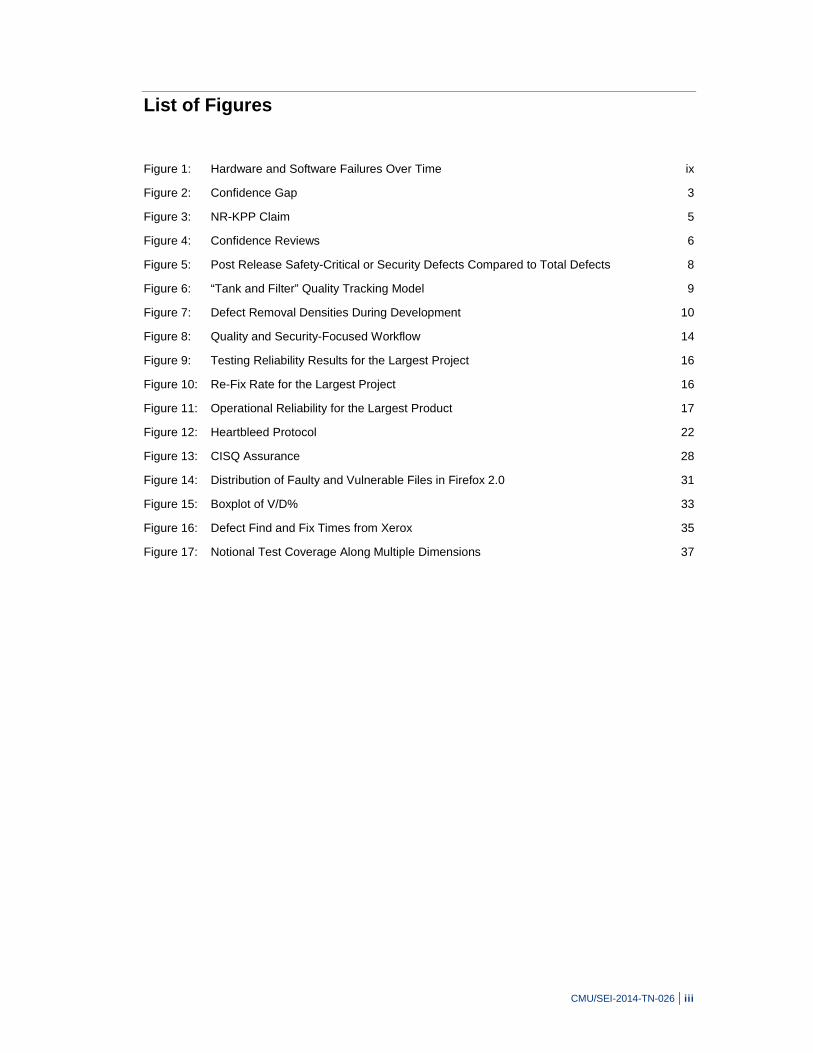
List of Figures
Figure 1: Hardware and Software Failures Over Time ix
Figure 2: Confidence Gap 3
Figure 3: NR-KPP Claim 5
Figure 4: Confidence Reviews 6
Figure 5: Post Release Safety-Critical or Security Defects Compared to Total Defects 8
Figure 6: “Tank and Filter” Quality Tracking Model 9
Figure 7: Defect Removal Densities During Development 10
Figure 8: Quality and Security-Focused Workflow 14
Figure 9: Testing Reliability Results for the Largest Project 16
Figure 10: Re-Fix Rate for the Largest Project 16
Figure 11: Operational Reliability for the Largest Product 17
Figure 12: Heartbleed Protocol 22
Figure 13: CISQ Assurance 28
Figure 14: Distribution of Faulty and Vulnerable Files in Firefox 2.0 31
Figure 15: Boxplot of V/D% 33
Figure 16: Defect Find and Fix Times from Xerox 35
Figure 17: Notional Test Coverage Along Multiple Dimensions 37

CMU/SEI-2014-TN-026 | iv
CMU/SEI-2014-TN-026 | v
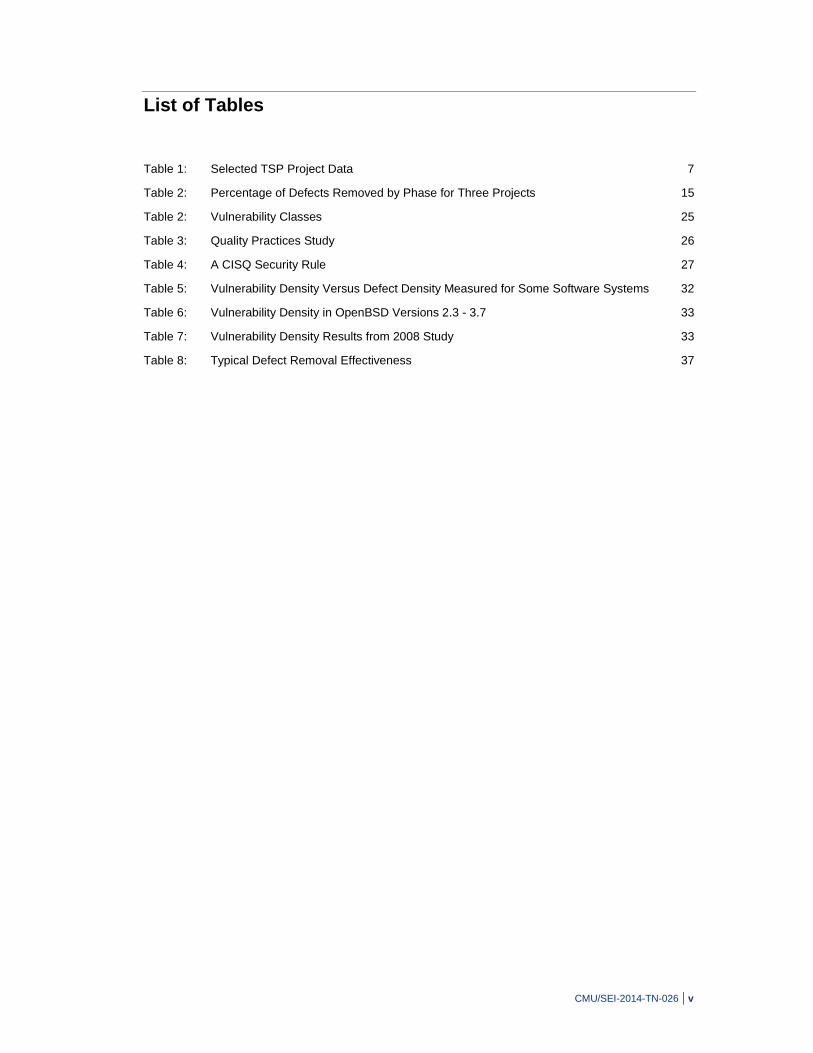
List of Tables
Table 1: Selected TSP Project Data 7
Table 2: Percentage of Defects Removed by Phase for Three Projects 15
Table 2: Vulnerability Classes 25
Table 3: Quality Practices Study 26
Table 4: A CISQ Security Rule 27
Table 5: Vulnerability Density Versus Defect Density Measured for Some Software Systems 32
Table 6: Vulnerability Density in OpenBSD Versions 2.3 - 3.7 33
Table 7: Vulnerability Density Results from 2008 Study 33
Table 8: Typical Defect Removal Effectiveness 37

CMU/SEI-2014-TN-026 | vi
CMU/SEI-2014-TN-026 | vii
Acknowledgments
We would like to thank Kevin Fall, chief technical officer of the Software Engineering Institute (SEI), for providing the initial research funding that allowed us to explore this topic area. We would particularly like to thank the organizations whose data we used for our analysis. Their input provided insights into the processes and measurement used to produce the desired results in secu-rity and safety that could not have been achieved by just studying the raw data. We would also like to thank the participants who attended our challenge problem workshop in August 2014. Their thoughtful feedback helped us improve our analysis and structure our material in a coherent and useful manner. Finally, we would like to thank Julia Allen and Robert Ferguson for reviewing this report and offering helpful suggestions for improvement.

CMU/SEI-2014-TN-026 | viii
CMU/SEI-2014-TN-026 | ix
Executive Overview
Processes used for improving the quality of a system emphasize reducing the number of possible defects, but quality measures and the techniques applied to improved quality can vary in effective-ness and importance depending on the consequences of a defect and whether the measures and techniques are applied to hardware or software. Considerable experience exists on measuring hardware quality. For example, the mean time between failures is often used to measure the qual-ity of a hardware component. Consistently long periods between failures is evidence of general hardware reliability.
For measuring safety, the mean time between failures is not sufficient. We need to identify and mitigate defects that could create hazardous conditions, which could affect human life. For secu-rity, the consideration of impact also applies. Voting machine quality includes accurate tallies, but also includes mitigating design defects that could enable tampering with the device.
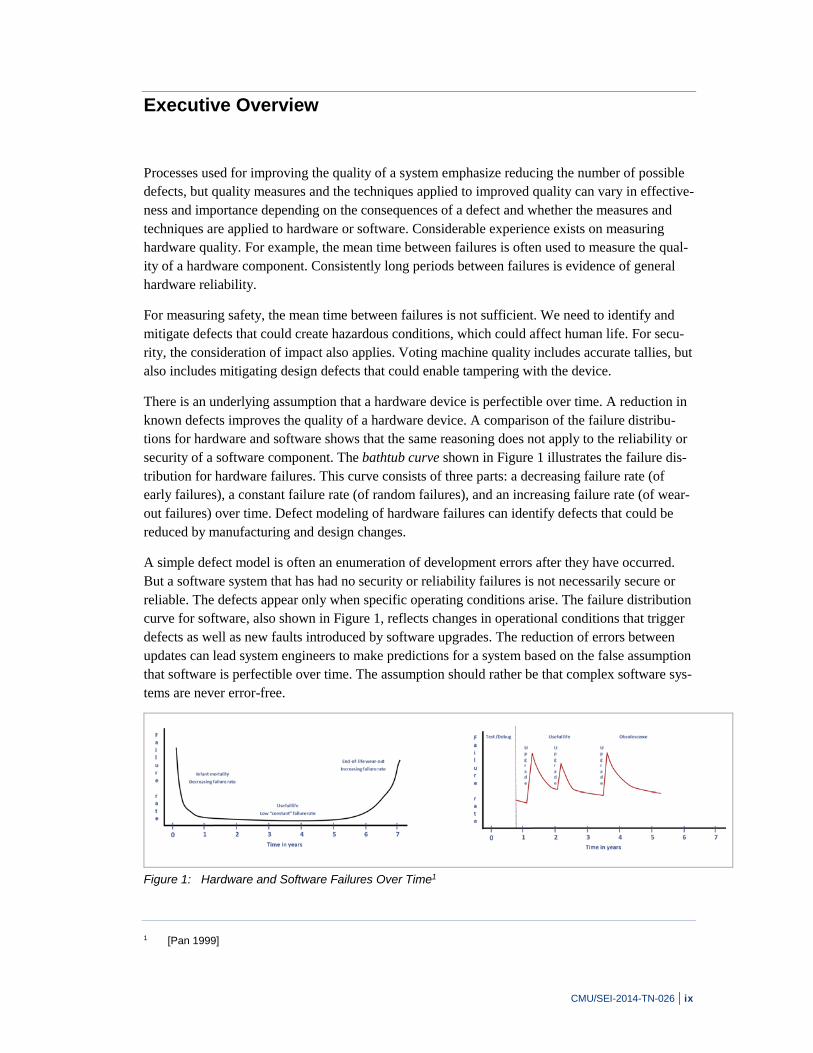
There is an underlying assumption that a hardware device is perfectible over time. A reduction in known defects improves the quality of a hardware device. A comparison of the failure distribu-tions for hardware and software shows that the same reasoning does not apply to the reliability or security of a software component. The bathtub curve shown in Figure 1 illustrates the failure dis-tribution for hardware failures. This curve consists of three parts: a decreasing failure rate (of early failures), a constant failure rate (of random failures), and an increasing failure rate (of wear-out failures) over time. Defect modeling of hardware failures can identify defects that could be reduced by manufacturing and design changes.
A simple defect model is often an enumeration of development errors after they have occurred. But a software system that has had no security or reliability failures is not necessarily secure or reliable. The defects appear only when specific operating conditions arise. The failure distribution curve for software, also shown in Figure 1, reflects changes in operational conditions that trigger defects as well as new faults introduced by software upgrades. The reduction of errors between updates can lead system engineers to make predictions for a system based on the false assumption that software is perfectible over time. The assumption should rather be that complex software sys-tems are never error-free.
Figure 1: Hardware and Software Failures Over Time1
1 [Pan 1999]
CMU/SEI-2014-TN-026 | x
The 2005 Department of Defense Guide for Achieving Reliability, Availability, and Maintainabil-ity (RAM) noted that known defects are not a good predictor of software reliability. Too little reli-ability engineering was given as a key reason for the reliability failures by the DoD RAM guide. This lack of reliability engineering was exhibited by
failure to design in reliability early in the development process
reliance on predictions (use of reliability defect models) instead of conducting engineering design analysis
Improved software reliability starts with understanding that the characteristics of software failures require analysis techniques distinct from those used for hardware reliability.
Software security shares many of the same challenges as software quality and reliability. Model-ing security defects for software systems does not provide a prediction capability. We need to as-sess how engineering choices proactively reduce the likelihood of security faults. Just removing defects does not ensure improved security, since defects are identified and prioritized based on specified requirements and effective security is dependent on operational execution.
The approach recommended for software reliability in the DoD RAM guide is applicable to secur-ing software systems. A quality measure for an engineering decision can be based on how that choice affects the injection or removal of defects. For example, a review of a hardware disk drive design would check the techniques used manage read errors or surface defects. A review of a soft-ware design might need to verify that the software engineering design choices sufficiently miti-gate a fault. Hardware reliability, such as for a disk drive, can draw on documented design rules based on actual use. Software reliability has not matured to the same state. A description of the specific engineering decisions and the justification of those choices must be provided for the re-view. An assurance technique called an assurance case provides a way to document the reasoning and evidence that led to engineering choices, making them transparent for further analysis and verification.
The SEI has detailed size, defect, and process data for over 100 software development projects. The projects include a wide range of application domains and project sizes. Five of these projects focus on specific security- and safety-critical outcomes. This report includes a discussion of how these five projects could provide potential benchmarks for ranges of quality performance metrics (e.g., defect injection rates, removal rates, and test yields) that establish a context for determining very high quality products and predicting safety and security outcomes.
Many of the Common Weakness Enumerations (CWEs),2 such as the improper use of program-ming language constructs, buffer overflows, and failures to validate input values, can be associ-ated with poor quality coding and development practices. Improving quality is a necessary condi-tion for addressing some software security issues.
Demonstrating that improving quality can improve security requires more careful analysis. Capers Jones has analyzed over 13,000 projects for the effects of general practices such as inspections, testing, and static analysis, have on improving software quality [Jones 2012]. His analysis shows
2 cwe.mitre.org
CMU/SEI-2014-TN-026 | xi
that a combination of techniques is best. Appendix B discusses why quality cannot be tested in. Static analysis has limitations that can be compounded by the lack of other quality practices such as inspections. This report includes a discussion of Heartbleed, a vulnerability in OpenSSL3 (an open source implementation of the secure socket layer protocol). Heartbleed is a good example of the limited effectiveness of current software assurance tools. Kupsch and Miller noted that, “Heartbleed created a significant challenge for current software assurance tools, and we are not aware of any such tools that were able to discover the Heartbleed vulnerability at the time of an-nouncement” [Kupsch 2014]. But Heartbleed, which was caused by a failure to validate input data, would be expected to be found by a good code inspection.
The underlying problem is that neither testing nor static analysis can be used to evaluate engineer-ing decisions. The Consortium for IT: Software Quality (CISQ) has developed specifications for automating the measurement of software reliability, security, performance efficiency, and main-tainability [CISQ 2012]. The CISQ assessment of the structural quality of software is based on ap-plying rules of good coding practices (Quality Rules). The CISQ approach, like static analysis, is based on the analysis of developed source code; but there is a significant difference between using the Quality Rules and applying static analysis. The Quality Rules incorporate software engineer-ing recommendations, such as the use of vetted libraries that prevent specific vulnerabilities, ra-ther than identifying defects after they have been injected.
Our research suggests that implementing systems with effective operational security requires in-corporating both quality and security considerations throughout the lifecycle. Predicting effective operational security requires quality and reliability evidence and security expert analysis in each step of the lifecycle. If defects are measured, 1-5% of defects should be considered to be security vulnerabilities. It is also feasible that when security vulnerabilities are measured, code quality can be estimated by considering security vulnerabilities to be 1-5% of the expected defects.
This report provides further analysis of the opportunities and issues involved in connecting qual-ity, reliability, and security. Because our sample set is small, further evaluation is needed to see if the patterns suggested by our analysis continue to hold.
3 CVD id CVE-2014-0160 (MITRE; “National Vulnerability Database”) http://web.nvd.nist.gov/view/vuln/detail?vul-
nId=CVE-2014-0160

CMU/SEI-2014-TN-026 | xii
CMU/SEI-2014-TN-026 | xiii
Abstract
Security vulnerabilities are defects that enable an external party to compromise a system. Our re-search indicates that improving software quality by reducing the number of errors also reduces the number of vulnerabilities and hence improves software security. Some portion of security vulner-abilities (maybe over half of them) are also quality defects. This report includes security analysis based on data the Software Engineering Institute (SEI) has collected over many years for 100 soft-ware development projects. Can quality defect models that predict quality results be applied to se-curity to predict security results? Simple defect models focus on an enumeration of development errors after they have occurred and do not relate directly to operational security vulnerabilities, except when the cause is quality related. This report discusses how a combination of software de-velopment and quality techniques can improve software security.

CMU/SEI-2014-TN-026 | xiv
CMU/SEI-2014-TN-026 | 1
1 Introduction
The Common Weakness Enumeration (CWE)4 is a list of over 900 software weaknesses that re-sulted in software vulnerabilities exploited by attackers. Many of them, such as the improper use of programming language constructs, buffer overflows, and failures to validate input values, can be associated with poor quality coding and development practices. Quality would seem to be a necessary condition for software security.
A reduction in known software defects is not necessarily a predictor for either improved security or reliability. For reliability, we can use statistical measures, such as the mean time between fail-ures (MTBF), for hardware reliability since hardware failures are often associated with wear and other errors that are often eliminated over time. But software weaknesses, such as those listed in the CWE, exist when a software system is deployed; they may not be known for some time be-cause the conditions, which may require external attacks and could cause a failure, have not yet occurred (in either testing or in operation). A system that has had no reliability or security failures is not necessarily reliable or secure when the threat or use environment changes.
Software security cannot be confirmed because there is no current means for establishing that all vulnerabilities have been removed. Confirmation of reliability faces a similar problem. The 2005 Department of Defense Guide for Achieving Reliability, Availability, and Maintainability (RAM) noted that known reliability defects are not a good predictor for software reliability. Too little reli-ability engineering was given as a key reason for the reliability failures by the DoD RAM guide. This lack of reliability engineering was exhibited by
failure to design-in reliability early in the development process
reliance on predictions (use of reliability defect models) instead of conducting engineering design analysis
Defect models that predict quality could be applied to predicting security if all security vulnerabil-ities were quality related. However, a simple defect model is often an enumeration of develop-ment errors after they have occurred. In practice, defect tracking is not consistently performed. Too few projects track defects prior to system and integration testing. Most Agile development projects do not consider anything to be a defect until the code is submitted for integration. Defect tracking in system testing and integration can be inconsistent and available data is often depend-ent on the development methodology in use (waterfall, Lean, SCRUM, etc.) and the level of data tracked as part of the development project. Removing defects could improve our confidence that the system has improved security, but we need to base that judgment on concrete evidence and not just on opinions of the developers or validators.
Software assurance, defined as the level of confidence we have that a system behaves as expected and the security risks associated with the business use of the software are acceptable, would be supported by effective quality and reliability predictions. Software assurance techniques can be
4 cwe.mitre.org
CMU/SEI-2014-TN-026 | 2
used to assemble evidence that should increase our confidence that a system’s behavior will be valid (including expected security). The strength of a software security assurance claim must de-pend, in part, on an assessment of the engineering decisions that support it (comparable to reliabil-ity) and, in part, by the evidence that defects have been removed (comparable to quality).
The use of existing standards that address software assurance should also support claims of qual-ity, reliability, and security. There are many recommendations, best practices, and standards, but, to date, limited research confirms the effectiveness of them with respect to software quality, relia-bility, or security. NIST 800-53 has hundreds of practices recommended for federal agencies and is seeking feedback on results. Microsoft’s Security Development Lifecycle5 emphasizes prevent-ing the creation of vulnerabilities and provides data from their experience to support use in prod-uct development and sustainment, but use by other organizations has not been validated. The Build Security In Maturity Model6 (BSIMM) contains information about security initiatives in 67 organizations, but this information is focused at an organizational level and has not been associ-ated with publicly available operational results.
This report includes an analysis of various aspects of quality and reliability in an effort to deter-mine their applicability to predicting operational security results. There are no clear answers, but several analysis threads provide strong indicators of potential value and warrant further considera-tion. This report is intended to inform executives, managers, and engineers involved in technology selection and implementation about the value of quality and reliability data in supporting security needs.
Section 2 describes the software assurance case and its value in assembling evidence from a range of sources to support a desired outcome (claim). In a sense, this report is the start of an assurance case for predicting security from quality and reliability data.
Section 3 describes five projects that delivered excellent security or safety-critical results while focusing on high-quality delivery. The way in which these results were obtained provides useful insights into relationships among quality, reliability, and security.
Section 4 describes two case studies of software failures in which quality and security results ap-pear to be related.
Section 5 describes other efforts underway to evaluate quality and security that are providing use-ful results.
Section 6 summarizes the current information we have that links quality and reliability to security and the feasibility of predicting security results. This section also proposes future research needs for others to consider.
5 https://www.microsoft.com/security/sdl/default.aspx?mstLoc
6 http://bsimm.com/
CMU/SEI-2014-TN-026 | 3
2 Assurance
There is always uncertainty about a software system’s behavior. At the start of development, we have a very general knowledge of the operational and security risks that might arise as well as the security behavior that is desired when the system is deployed. A quality measure of the design and implementation is the confidence we have that the delivered system will behave as specified. De-termining that level of confidence is an objective of software assurance, which is defined by the Committee on National Security Systems [CNSS 2009] as
Software Assurance: Implementing software with a level of confidence that the software functions as intended and is free of vulnerabilities, either intentionally or unintentionally de-signed or inserted as part of the software, throughout the lifecycle.
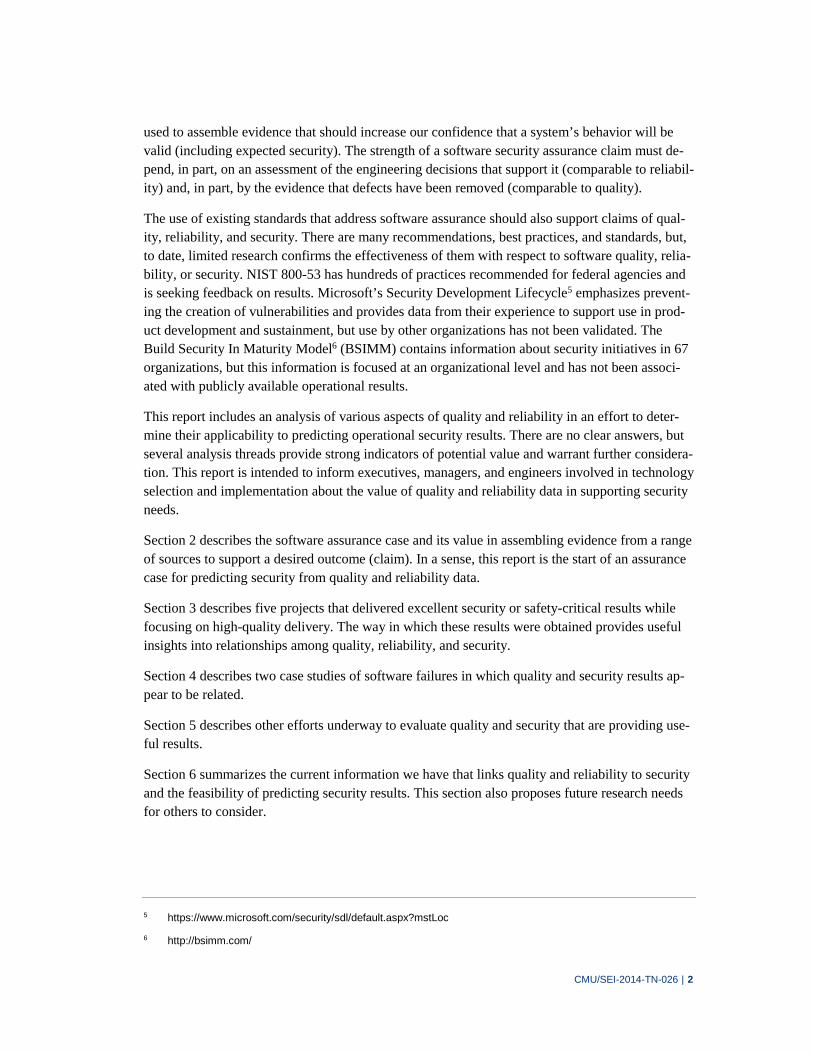
At the start of a development cycle, we have a limited basis for determining our confidence in the behavior of the delivered system; that is, we have a large gap between our initial level of confi-dence and the desired level of confidence. Over the development lifecycle, we need to reduce that confidence gap, as shown in Figure 2, to reach the desired level of confidence for the delivered system.
Figure 2: Confidence Gap
With existing software security practices, we could apply source-code static analysis and testing toward the end of the lifecycle. For the earlier lifecycle phases, we need to evaluate how the engi-neering decisions made during design affect the injection or removal of defects. Reliability de-pends on identifying and mitigating potential faults. Software security failure modes are exploita-ble conditions, such as unverified input data. A design review should confirm that the business risks linked to fault, vulnerability, and defect consequences have been identified and mitigated by specific design features. Software-intensive systems are complex; it should not be surprising that
CMU/SEI-2014-TN-026 | 4
the analysis done, even by an expert designer, could be incomplete, could overlook a risk, or could make simple but invalid development and operating assumptions.
Our confidence in the engineering of software should be based on more than opinion. If we claim the resulting system will be secure, our confidence in the claim will depend on the quality of evi-dence provided to support the claim, on confirmation that the structure of the argument about the evidence is appropriate to meet the claim, and that sufficient evidence is provided. If we claim that we have reduced vulnerabilities by verifying all inputs, then the results of extensive testing using invalid and valid data provides evidence to support the claim.
We refer to the combination of evidence and argument as an assurance case.7
Assurance case: a documented body of evidence that provides a convincing and valid argu-ment that a specified set of critical claims about a system’s properties are adequately justi-fied for a given application in a given environment.
An analysis of an assurance case does not evaluate the process by which an engineering decision was made. Rather it is a justification of a predicted result based on available information. An as-surance case does not imply any kind of guarantee or certification. It is simply a way to document the rationale behind system design decisions.
Doubts play a significant role in justifying claims. During a review, an assurance case developer is expected to justify through evidence that a set of claims have been met. A typical reviewer looks for reasons to doubt the claim. For example, a reviewer could
Doubt the claim. There is information that contradicts a claim.
Doubt the argument. For example, the static analysis that was done does not apply to a claim that a specific vulnerability has been eliminated or the analysis did not consider the case in which the internal network has been compromised.
Doubt the evidence. For example, the security testing or static analysis was done by inexpe-rienced staff or the testing plan did not give sufficient consideration to recovery following a compromise.
Quality and reliability can be considered potential evidence to be incorporated into an argument about predicted software security. The remainder of this section describes an example assurance case and the ways in which confidence is increased as evidence is assembled.
2.1 DoD Assurance Case Example
An assurance case can be developed for a system with software assurance as a segment of the ar-gument. Implicit assurance cases appear in all DoD system acquisitions. Key performance param-
7 Assurance cases were originally used to show that systems satisfied their safety-critical properties. For this use,
they were (and are) called safety cases. The notation and approach used in this report have been used for over a decade in Europe to document why a system is sufficiently safe [Kelly 1998, Kelly 2004]. The application of the concept to reliability was documented in an SAE Standard [SAE 2004]. In this report, we extend the concept to cover system security claims.
CMU/SEI-2014-TN-026 | 5
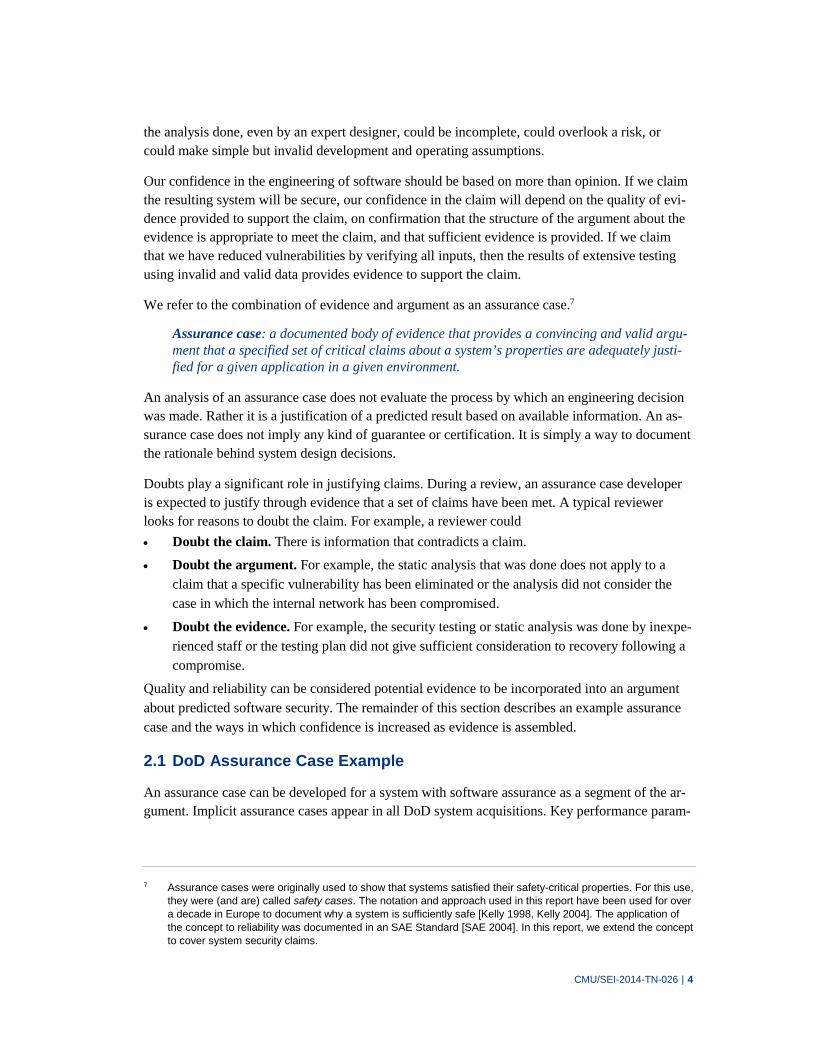
eters (KPPs) are the system characteristics essential for delivery of an effective military capabil-ity. All DoD projects have some number of KPPs to satisfy to be considered acceptable from an operational perspective. For example, any DoD system that must send or receive information ex-ternally is required to fulfill the Net-Ready KPP (NR-KPP), which requires that it continuously provide survivable, interoperable, secure, and operationally effective information exchanges, one of the security characteristics shown in Figure 3.
Figure 3: NR-KPP Claim
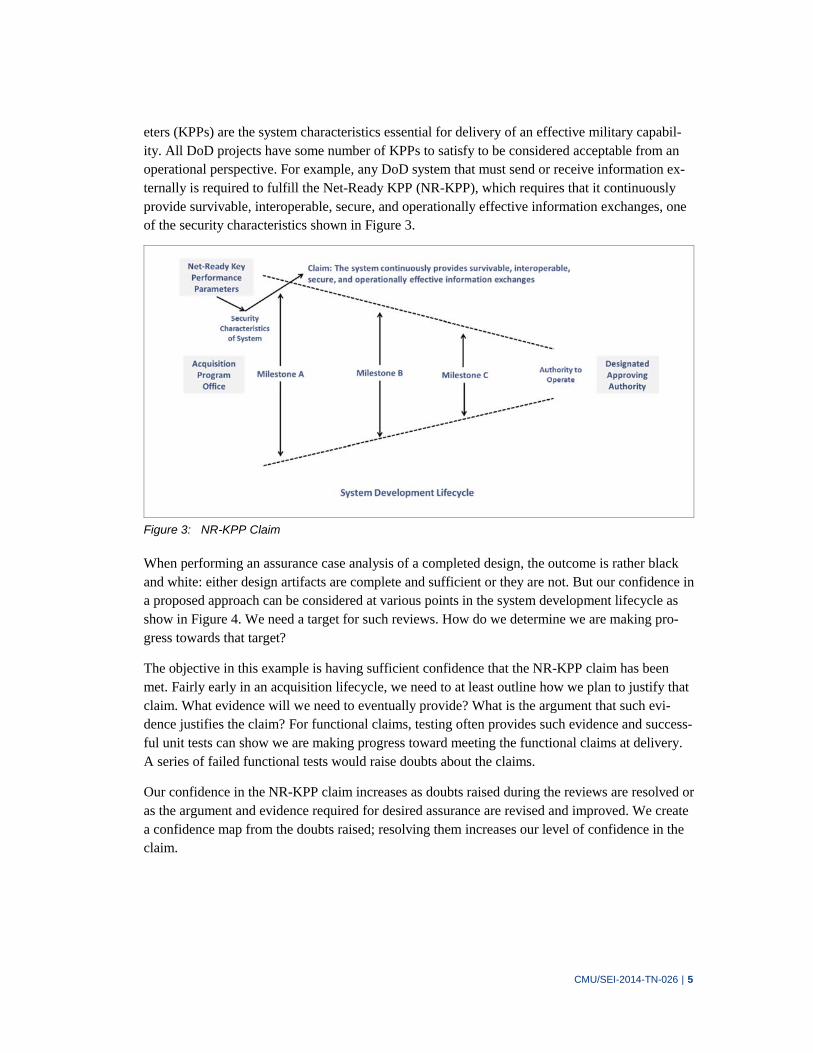
When performing an assurance case analysis of a completed design, the outcome is rather black and white: either design artifacts are complete and sufficient or they are not. But our confidence in a proposed approach can be considered at various points in the system development lifecycle as show in Figure 4. We need a target for such reviews. How do we determine we are making pro-gress towards that target?
The objective in this example is having sufficient confidence that the NR-KPP claim has been met. Fairly early in an acquisition lifecycle, we need to at least outline how we plan to justify that claim. What evidence will we need to eventually provide? What is the argument that such evi-dence justifies the claim? For functional claims, testing often provides such evidence and success-ful unit tests can show we are making progress toward meeting the functional claims at delivery. A series of failed functional tests would raise doubts about the claims.
Our confidence in the NR-KPP claim increases as doubts raised during the reviews are resolved or as the argument and evidence required for desired assurance are revised and improved. We create a confidence map from the doubts raised; resolving them increases our level of confidence in the claim.
CMU/SEI-2014-TN-026 | 6
Figure 4: Confidence Reviews
The next section describes ways in which quality and reliability evidence was assembled to evalu-ate how selected projects achieved good security and safety-critical results.

CMU/SEI-2014-TN-026 | 7
3 Analysis of Quality Cases
3.1 SEI Data8
The SEI has detailed size, defect, and process data for more than 100 software development pro-jects. This inventory is growing and may double in size in the near future. The projects include a wide range of application domains. This data supports potential benchmarks for ranges of quality performance metrics (e.g., defect injection rates, removal rates, and test yields) that establish a context for determining very high quality products. The following types of information are availa-ble for each project:
summary data that includes project duration, development team size, cost (effort) variance, and schedule variance
detailed data that includes the planned and actual for each product component: size (added and modified lines of code [LOC]), effort by development phase, defects injected and re-moved in each development phase, and date of lifecycle phase completion
A subset of this data is provided by high-quality projects reporting few or no defects found in pro-duction. Five of these projects were identified as successful safety-critical or security-critical im-plementations and have been selected for our analysis. These selected projects range in size from 30,000 to 3,000,000,000 LOC and include safety-critical medical devices, the Selective Service registration system, and a system subjected to a security audit. Quality for these selected projects was evaluated using software defect injection and removal data from quality modeling capabilities that implemented the SEI Team Software Process (TSP) [Davis 2003]. We analyzed this data to identify possible correlations between modeling quality and security, as well as unique character-istics used for these systems that led to a minimal number of defects discovered in the operational production environment.
Table 1: Selected TSP Project Data
Project Type Post Release Security or Safety Critical Defects
Defect Density [Defects/MLOC] Size [MLOC]
D1 Safety Critical 20 46.1 2.8
D2 Safety Critical 0 4.4 0.9
D3 Safety Critical 0 9.2 1.3
A1 Secure 0 91.7 0.6
T1 Secure 0 20 0.03
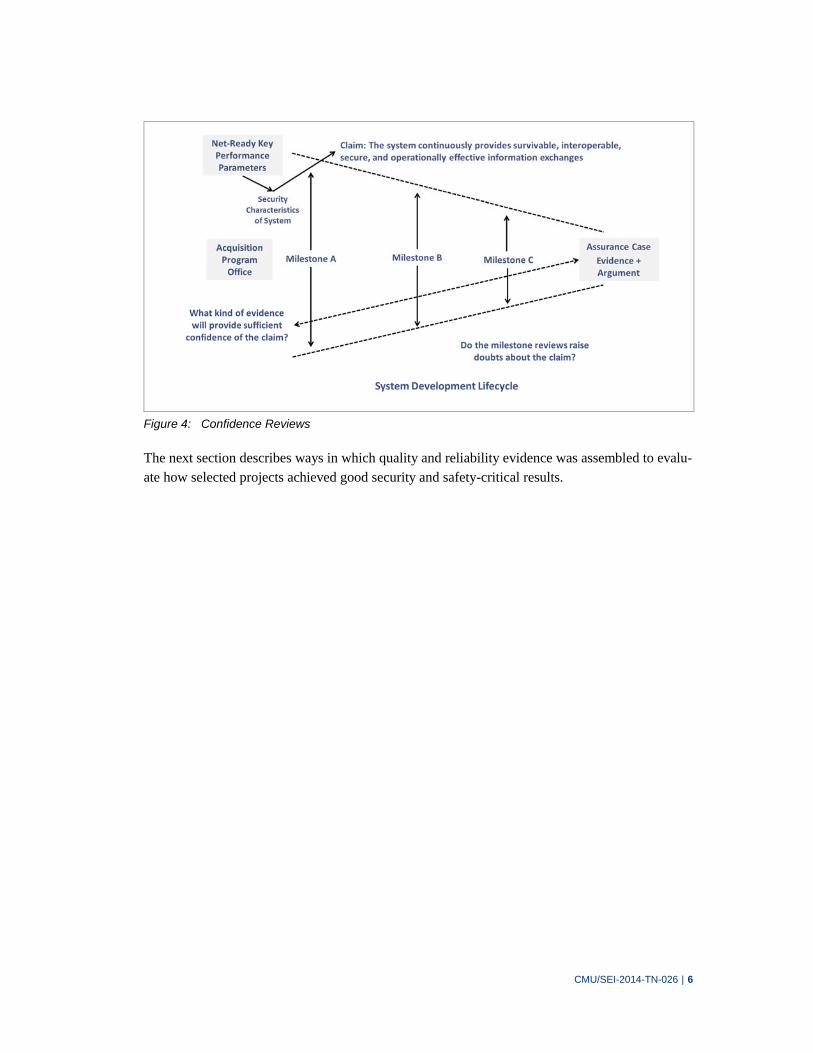
Four of these projects reported no post release safety-critical or security defects in the first year of operation. One had twenty reported defects in operation. Three projects were implemented with very high quality (20 or less defects per million lines of code [MLOC]). According to Capers
8 Data was drawn from the Team Software Process (TSP) work (http://www.sei.cmu.edu/tsp/index.cfm ).
CMU/SEI-2014-TN-026 | 8
Jones [Jones 2011], the average defect level in the U.S. is 0.75 defects per function point or 6000 per MLOC for a high-level language. Very good levels would be 600 to 1000 defects per MLOC and exceptional levels would be below 600 defects per MLOC.
Figure 5: Post Release Safety-Critical or Security Defects Compared to Total Defects
Tracking defects at the necessary level of detail requires that all steps in the development lifecycle are tooled to capture metrics. All participants in the lifecycle share a common understanding of what constitutes a defect and how it is to be handled. Participants in each step of the process are focused on identifying and addressing defects. To develop comparisons among projects and eval-uate quality and security results the following are needed:
a measure of defects identified and removed during each phase of the lifecycle
a measure of defect data after code completion (Specifically, defects are tracked and rec-orded accurately during development, internal or independent verification and validation [V&V], production use, and ideally during build and integration.)
a measure of operational program size (e.g., source LOC or function points) that can be used as a normalization factor for released systems so that a comparable level of quality across different software systems can be established
3.2 Defect Prediction Models
Defect prediction models should be developed from measures of defect discovery in prior pro-jects. That way, the number of defects can be estimated at the very beginning of the project and updated as defect discovery and removal information is found. Defect prediction models that are first applied in testing have wide error variations and are not useful in judging overall product quality.
CMU/SEI-2014-TN-026 | 9
Defect prediction models are typically informed by measures of the software product at a specific time, longitudinal measures of the product, or measures of the development process used to build the product. Metrics typically used to analyze quality problems can include
static software metrics, such as new and changed LOC, cyclomatic complexity,9 counts of attributes, parameters, methods and classes, and interactions among modules
defect counts, usually found during testing or in production, often normalized to size, effort, or time in operation
software change metrics, including frequency of changes, LOC changed, or longitudinal product change data, such as number of revisions, frequency of revisions, numbers of mod-ules changed, or counts of bug fixes over time
process data, such as activities performed or effort applied to activities or development phases
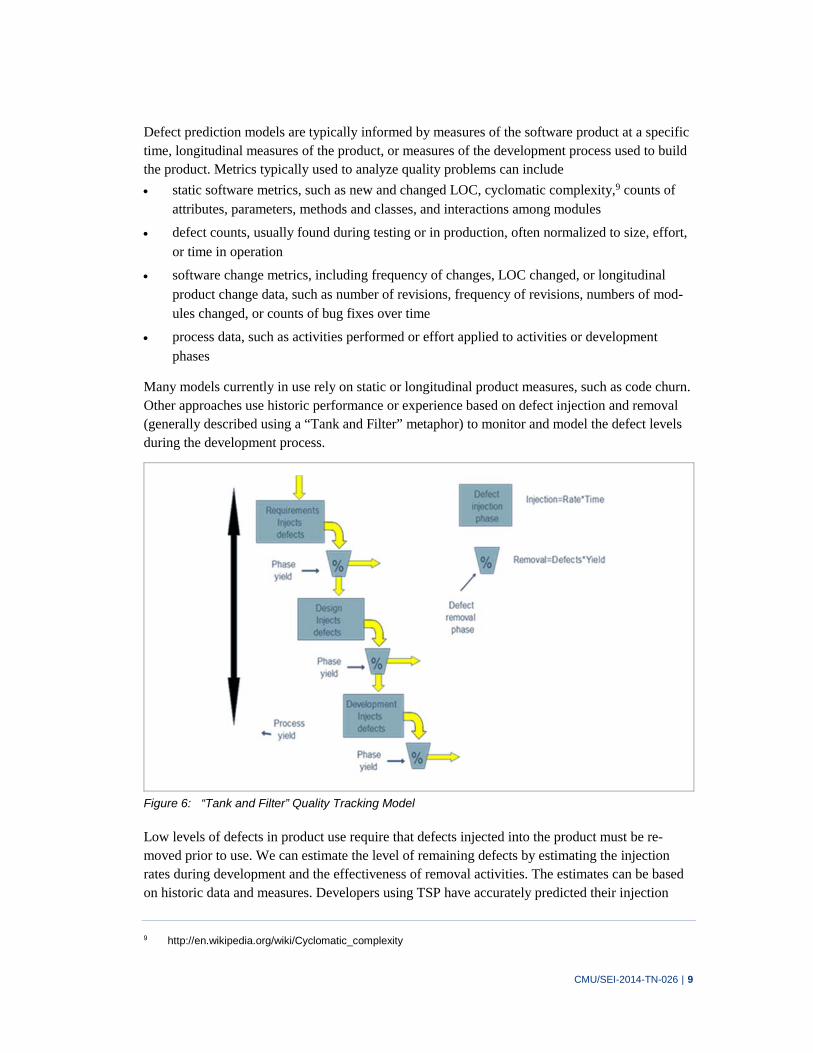
Many models currently in use rely on static or longitudinal product measures, such as code churn. Other approaches use historic performance or experience based on defect injection and removal (generally described using a “Tank and Filter” metaphor) to monitor and model the defect levels during the development process.
Figure 6: “Tank and Filter” Quality Tracking Model
Low levels of defects in product use require that defects injected into the product must be re-moved prior to use. We can estimate the level of remaining defects by estimating the injection rates during development and the effectiveness of removal activities. The estimates can be based on historic data and measures. Developers using TSP have accurately predicted their injection
9 http://en.wikipedia.org/wiki/Cyclomatic_complexity
CMU/SEI-2014-TN-026 | 10
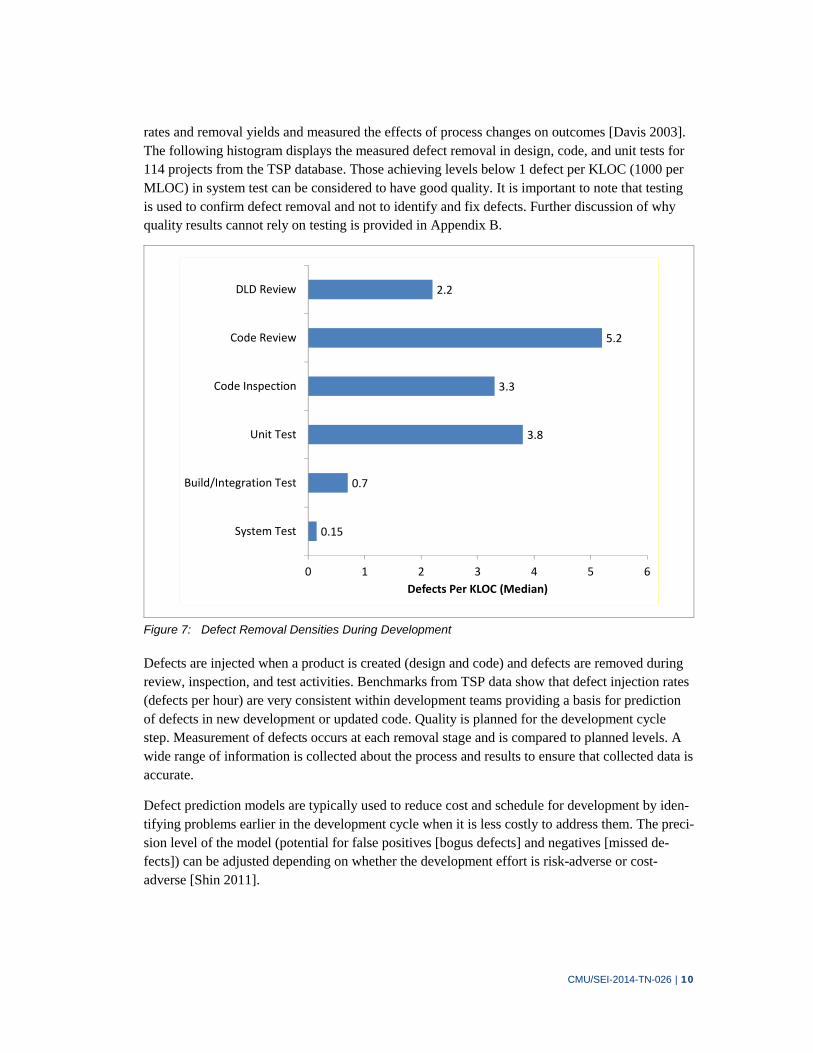
rates and removal yields and measured the effects of process changes on outcomes [Davis 2003]. The following histogram displays the measured defect removal in design, code, and unit tests for 114 projects from the TSP database. Those achieving levels below 1 defect per KLOC (1000 per MLOC) in system test can be considered to have good quality. It is important to note that testing is used to confirm defect removal and not to identify and fix defects. Further discussion of why quality results cannot rely on testing is provided in Appendix B.
Figure 7: Defect Removal Densities During Development
Defects are injected when a product is created (design and code) and defects are removed during review, inspection, and test activities. Benchmarks from TSP data show that defect injection rates (defects per hour) are very consistent within development teams providing a basis for prediction of defects in new development or updated code. Quality is planned for the development cycle step. Measurement of defects occurs at each removal stage and is compared to planned levels. A wide range of information is collected about the process and results to ensure that collected data is accurate.
Defect prediction models are typically used to reduce cost and schedule for development by iden-tifying problems earlier in the development cycle when it is less costly to address them. The preci-sion level of the model (potential for false positives [bogus defects] and negatives [missed de-fects]) can be adjusted depending on whether the development effort is risk-adverse or cost-adverse [Shin 2011].
0.15
0.7
3.8
3.3
5.2
2.2
0 1 2 3 4 5 6
System Test
Build/Integration Test
Unit Test
Code Inspection
Code Review
DLD Review
Defects Per KLOC (Median)
CMU/SEI-2014-TN-026 | 11
3.3 In-Depth Analysis: Security Focused Example (Project A1)
The objectives of this project were to update and modernize the Selective Service System and sat-isfy FISMA [NIST 2002] requirements. Based on the success of the implementation and a secu-rity review performed by senior information security experts, the contractor, Advanced Infor-mation Systems, received the Government Information Security Leadership Award (GISLA) [Romo 2013].
The project preparation included ISC2-Certified Secure Software Lifecycle Professional Training10 for the staff. The developers implemented the following techniques:
“[D]evelopers should be supported by being provided with the necessary knowledge about security vulnerabilities and how they can occur throughout the life cycle. This information should be institutionalized into the way that developers do their work, by being built into the types of quality checks [emphasis added] that get deployed as the software is developed, whether it be on checklists for inspections or other approaches.” [Shull 2013]
Staff members were trained to recognize common security issues in development and required to build this understanding into their development process. Metrics were collected using review and inspection checklists along with productivity data. These metrics allowed staff to accurately pre-dict the effort and quality required for future components using actual historical data.
3.3.1 Security Example Results
The implemented product contained a total of 570 defects (0.97 defects/KLOC), none of which resulted in operational system downtime [Ratnaraj 2012]. The system passed all security audits and had no reported vulnerabilities in production.
Leading indicators of software quality included 76% of components, which were defect free after unit test and had a process quality index (PQI) of >0.37 for database components, >37% for mid-dle tier components, and >0.25 for user interface components [Humphrey 2000]. With PQI values above about 0.4, program modules are generally defect free. The PQI is a derived measure that characterizes the quality of a software development process and is the product of five quality pro-file component values:
1. Design quality is expressed as the ratio of design time to coding time.
2. Design review quality is the ratio of design review time to design time.
3. Code review quality is the ratio of code review time to coding time.
4. Code quality is the ratio of compile defects to a size measure.
5. Program quality is the ratio of unit test defects to a size measure.
10 https://www.isc2.org/CSSLP/Default.aspx
CMU/SEI-2014-TN-026 | 12
3.3.2 Security Example Discussion
Among the five projects selected for analysis, this project was the outlier with a higher measured defect density. Although the production defect density of <0.1 defects/KLOC would normally be considered to be quite good [Binder 1997], the level for this system is more than twice that of oth-ers in the investigation set. The components are close to, but do not achieve the PQI level of merit, which is generally considered to be >0.4 [Humphrey 2000]. The question then becomes how this product achieves zero reported operational vulnerabilities. To answer that question, we needed to analyze the data further.
Given the product size of approximately 600 KLOC and 0.1 defects/KLOC in production, we in-fer approximately 60 defects were discovered in production. Using the higher end of the vulnera-bility/defect range reported from various sources [Alhazmi, Malaiya, and Ray 2007; Alhazmi and Malaiya 2008], 5% to 10%, or 3 to 6 vulnerabilities, should be expected. However, the lower end of the range, 1% or below as observed among systems known to use secure development prac-tices, would project <1 escaped vulnerability.
3.3.3 Security Example Summary
The data from this project indicates that the combination of measured defect density and size is most consistent with no further vulnerabilities identified if we use a vulnerability-to-defect ratio of approximately 1% or lower. The observation of zero vulnerabilities in this system tends to sup-port the conjecture that systems built with a deliberate focus on quality, training to recognize se-curity issues, and evidence of sufficient quality to verify the practice, can use the 1% ratio as a measured defect density to estimate vulnerabilities.
3.4 In-Depth Analysis: Safety-Focused Examples (Projects D1, D2, D3)
Three cases in our data set involve medical diagnostic devices. The devices are used for medical analysis in areas such as immunoassay and hematology. The sources for this project summary in-clude the data recorded by the teams during their time working on the project, their cycle post mortem (retrospective) reports, and a summary presented at the TSP Symposium 2012.11
Medical devices are regulated by the FDA, subject to FDA 21 CFR 820 Quality System Regula-tion,12 which is a basic regulatory requirement with which all manufacturers of medical devices distributed in the U.S. must comply. The regulation includes the Quality System Regulation (QSR) and Good Manufacturing Practices (GMP).
The QSR includes requirements related to the methods used in and the facilities and controls used for designing, purchasing, manufacturing, packaging, labeling, storing, installing, and servicing medical devices. Manufacturing facilities undergo FDA inspections to assure their compliance
11 Grojean, Carol & Robert Musson, RSM 2.5 Project Results (private report).
12 http://www.accessdata.fda.gov/scripts/cdrh/cfdocs/cfcfr/CFRSearch.cfm?CFRPart=820

CMU/SEI-2014-TN-026 | 13
with QSR requirements. REGULATION Subpart B—Quality System Requirements Sec. 820.22 Quality Audit includes the following requirement:
Each manufacturer shall establish procedures for quality audits and conduct such audits to assure that the quality system is in compliance with the established quality system require-ments and to determine the effectiveness of the quality system.
The QSR includes design controls that must be demonstrated during the design and development of the device. Additional guidance is provided by General Principles of Software Validation; Fi-nal Guidance for Industry and FDA Staff [FDA 2002].
The software projects in this study were of size 2.8 MLOC, 1.3 MLOC, and 0.9 MLOC. The larg-est of the three projects included a large body of legacy code that was in test for an extended time (>8 months) because defect detection rates were not decreasing.
3.4.1 Safety Examples Process Approach
Each of the projects included both new development and enhancements to existing code. Alt-hough the process steps were similar, the parameters for the overall development rate and defect injection rates differed among the projects. All projects included the use of static code analysis tools to establish defect levels, primarily for the analysis of legacy code. All projects included checklist-driven reviews of requirements, designs, code, and test cases. Peer inspection processes (design inspection and code inspection) included a safety specialist whose primary role was to evaluate defects for potential safety implications.
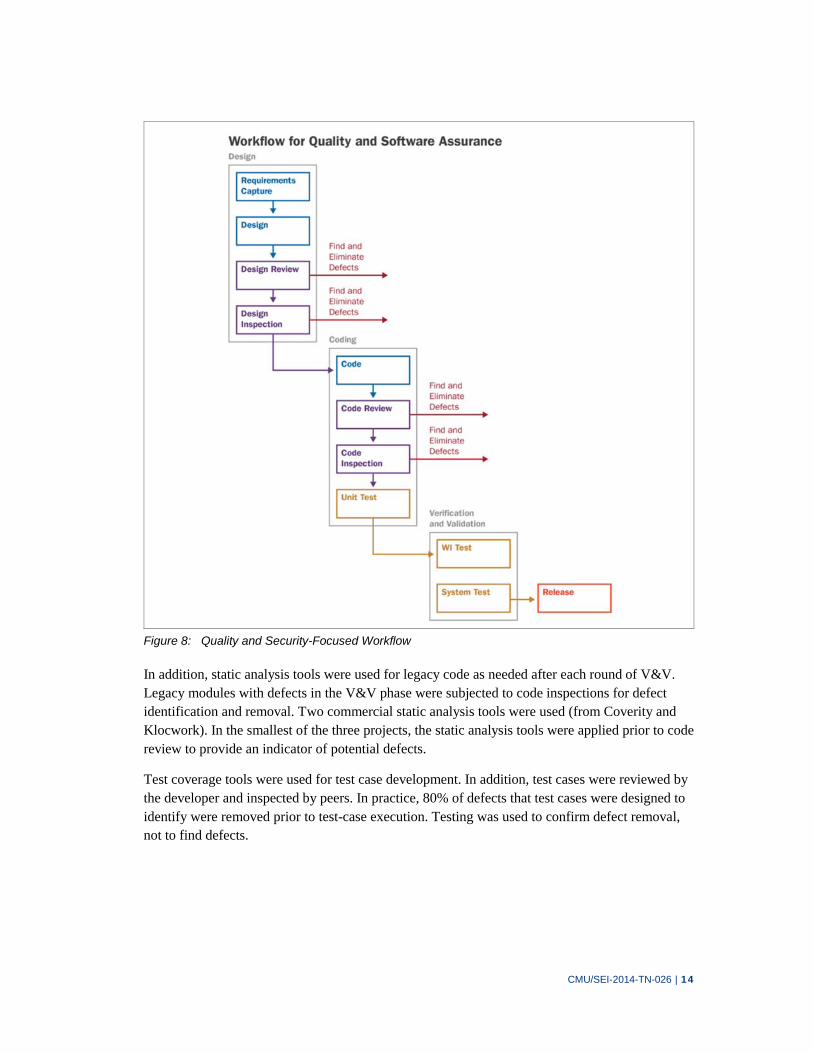
The general workflow for the projects was similar to that shown in Figure 8 for quality and secu-rity, where each process step includes peer reviews and expert inspection (safety or security).
CMU/SEI-2014-TN-026 | 14
Figure 8: Quality and Security-Focused Workflow
In addition, static analysis tools were used for legacy code as needed after each round of V&V. Legacy modules with defects in the V&V phase were subjected to code inspections for defect identification and removal. Two commercial static analysis tools were used (from Coverity and Klocwork). In the smallest of the three projects, the static analysis tools were applied prior to code review to provide an indicator of potential defects.
Test coverage tools were used for test case development. In addition, test cases were reviewed by the developer and inspected by peers. In practice, 80% of defects that test cases were designed to identify were removed prior to test-case execution. Testing was used to confirm defect removal, not to find defects.
CMU/SEI-2014-TN-026 | 15
The teams performed detailed planning for each upcoming code release cycle and confirmation planning for the overall schedule. For the project with the largest code base, a Monte Carlo simu-lation was used to identify a completion date within the 84th percentile (i.e., 84% of the project simulated finished earlier than this completion date) and included estimates for
incoming software change requests (SCRs) per week
triage rate of software change requests
percentage of SCRs closed
development work (SCR assigned) for a cycle
SCR per developer (SCR/Dev) per week
number of developers
time to develop of test protocols
software change requests per safety verifier & validator (SCR/SVV) per week
number of verification persons
The team then committed to complete the agreed work for the cycle, planned what work was be-ing deferred into future cycles, and projected that all remaining work would still fit the overall de-livery schedule. All defects were tracked throughout the projects in all phases (injection, discov-ery, and fix data). Developers used their actual data to plan subsequent work and reach agreement with management on the schedule, content, process used, and resources required so that the plan could proceed without compromising the delivery schedule.
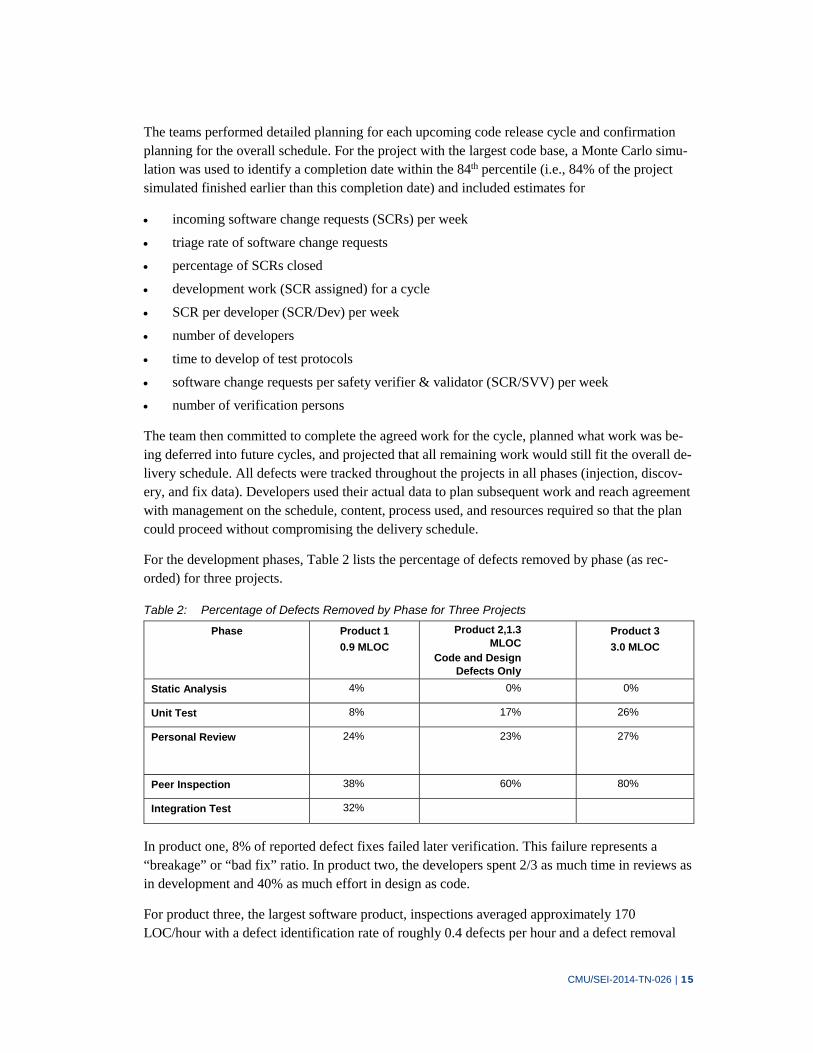
For the development phases, Table 2 lists the percentage of defects removed by phase (as rec-orded) for three projects.
Table 2: Percentage of Defects Removed by Phase for Three Projects
Phase Product 1
0.9 MLOC
Product 2,1.3 MLOC
Code and Design Defects Only
Product 3
3.0 MLOC
Static Analysis 4% 0% 0%
Unit Test 8% 17% 26%
Personal Review 24% 23%
27%
Peer Inspection 38% 60% 80%
Integration Test 32%
In product one, 8% of reported defect fixes failed later verification. This failure represents a “breakage” or “bad fix” ratio. In product two, the developers spent 2/3 as much time in reviews as in development and 40% as much effort in design as code.
For product three, the largest software product, inspections averaged approximately 170 LOC/hour with a defect identification rate of roughly 0.4 defects per hour and a defect removal
CMU/SEI-2014-TN-026 | 16
density of 4 defects/KLOC. The inspection percentage of total defects identified ranged from 40% to 80%. Typical component defect density was under 1 defect per KLOC entering the V&V phase. Few defects were recorded by the safety inspectors.
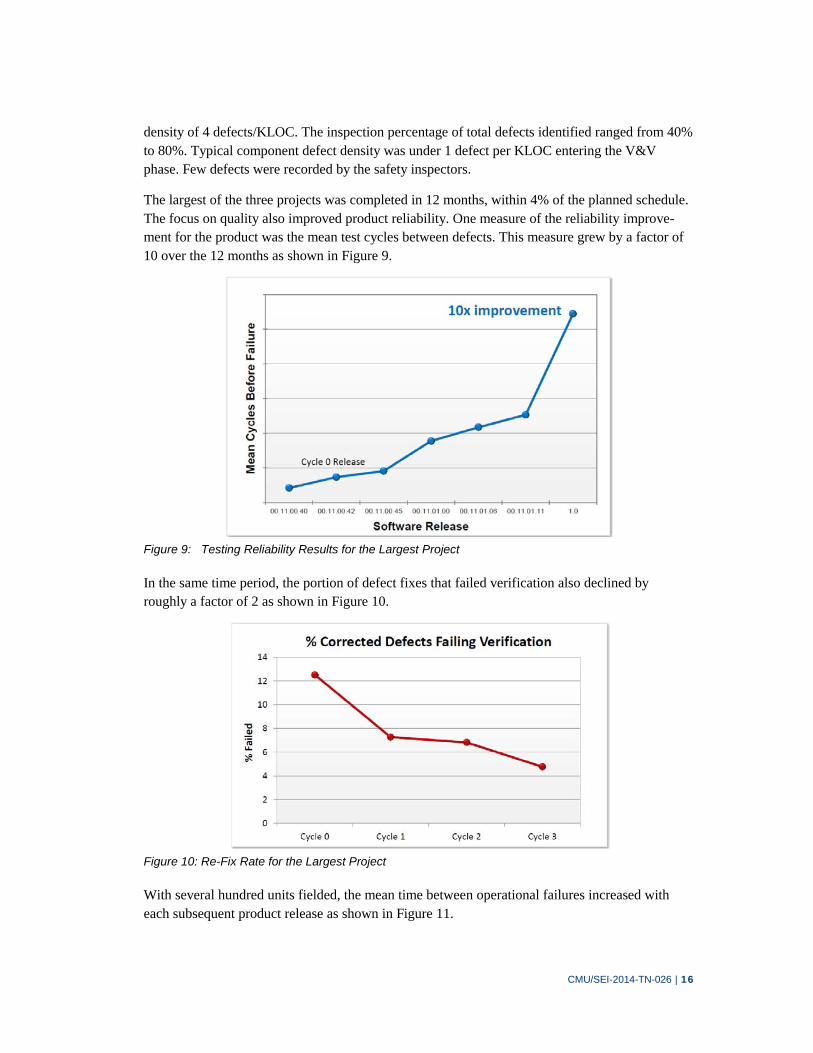
The largest of the three projects was completed in 12 months, within 4% of the planned schedule. The focus on quality also improved product reliability. One measure of the reliability improve-ment for the product was the mean test cycles between defects. This measure grew by a factor of 10 over the 12 months as shown in Figure 9.
Figure 9: Testing Reliability Results for the Largest Project
In the same time period, the portion of defect fixes that failed verification also declined by roughly a factor of 2 as shown in Figure 10.
Figure 10: Re-Fix Rate for the Largest Project
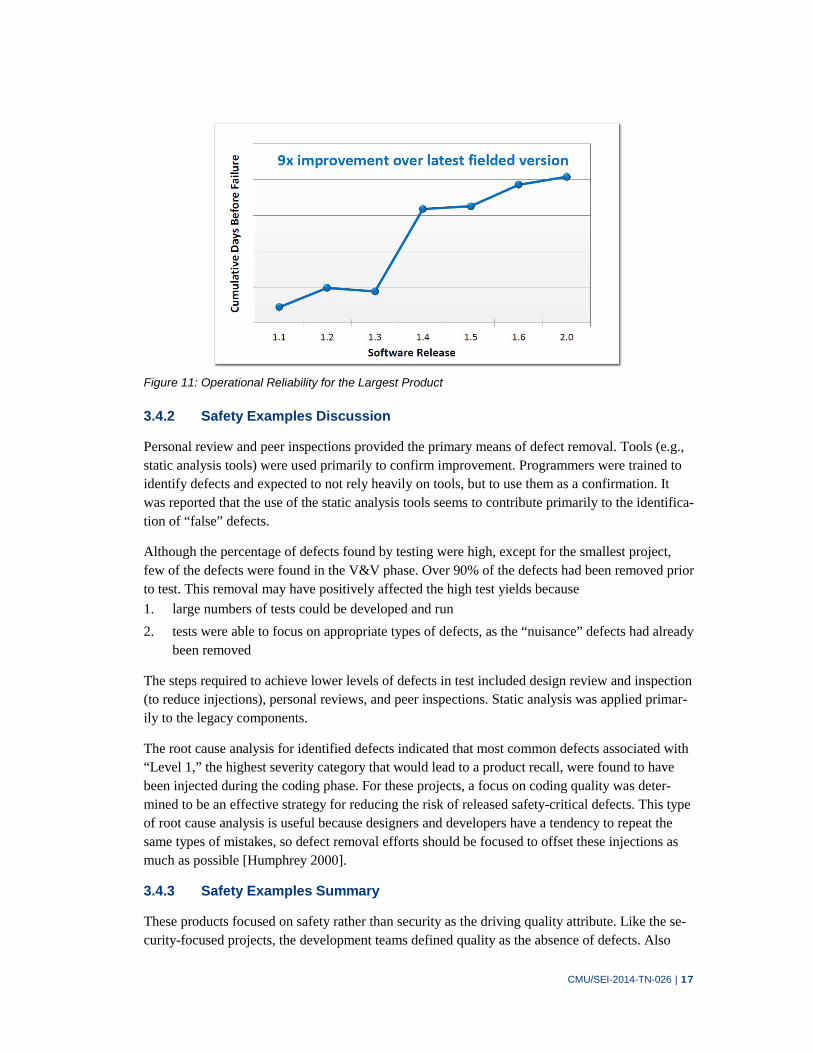
With several hundred units fielded, the mean time between operational failures increased with each subsequent product release as shown in Figure 11.
CMU/SEI-2014-TN-026 | 17
Figure 11: Operational Reliability for the Largest Product
3.4.2 Safety Examples Discussion
Personal review and peer inspections provided the primary means of defect removal. Tools (e.g., static analysis tools) were used primarily to confirm improvement. Programmers were trained to identify defects and expected to not rely heavily on tools, but to use them as a confirmation. It was reported that the use of the static analysis tools seems to contribute primarily to the identifica-tion of “false” defects.
Although the percentage of defects found by testing were high, except for the smallest project, few of the defects were found in the V&V phase. Over 90% of the defects had been removed prior to test. This removal may have positively affected the high test yields because
1. large numbers of tests could be developed and run
2. tests were able to focus on appropriate types of defects, as the “nuisance” defects had already been removed
The steps required to achieve lower levels of defects in test included design review and inspection (to reduce injections), personal reviews, and peer inspections. Static analysis was applied primar-ily to the legacy components.
The root cause analysis for identified defects indicated that most common defects associated with “Level 1,” the highest severity category that would lead to a product recall, were found to have been injected during the coding phase. For these projects, a focus on coding quality was deter-mined to be an effective strategy for reducing the risk of released safety-critical defects. This type of root cause analysis is useful because designers and developers have a tendency to repeat the same types of mistakes, so defect removal efforts should be focused to offset these injections as much as possible [Humphrey 2000].
3.4.3 Safety Examples Summary
These products focused on safety rather than security as the driving quality attribute. Like the se-curity-focused projects, the development teams defined quality as the absence of defects. Also

CMU/SEI-2014-TN-026 | 18
like the security projects, designs, review checklists, and the test process were tailored for the types of defects most important to the project.
The teams in this study developed and followed quality plans supported by explicit resource plans and schedules and demonstrated by metrics. The plans included personal reviews, peer inspec-tions, static analysis, and a rigorous test case development process, including code coverage anal-ysis and inspection of the test cases. The teams were able to execute their plan by allocating and agreeing to sufficient schedule time and effort, collecting measures throughout the process to monitor their work. The results suggest that products with very low levels of defects are associ-ated with a disciplined approach to planning quality activities, funding them properly, and faith-fully implementing the plan.
CMU/SEI-2014-TN-026 | 19
4 Assurance and Finding Defects
Assuring that a software component has few defects also depends on assuring our capability to find them. Positive results from security testing and static code analysis are often provided as evi-dence that security vulnerabilities have been reduced, but the vulnerabilities discussed in this sec-tion demonstrate that it is a mistake to rely on them as the primary means for identifying defects. The omission of quality practices, such as inspections, can lead to defects that can exceed the ca-pabilities of existing code analysis tools.
In the first example, an Apple coding vulnerability was likely the result of careless editing. The second example is the Heartbleed vulnerability in OpenSSL13 (an open source implementation of the secure socket layer protocol). Heartbleed is a good example of the limited effectiveness of cur-rent software assurance tools. Kupsch and Miller noted that, “Heartbleed created a significant challenge for current software assurance tools and we are not aware of any such tools that were able to discover the Heartbleed vulnerability at the time of announcement” [Kupsch 2014]. There are techniques that can be applied during development that would have prevented the injection of these vulnerabilities.
4.1 Case Study: Apple Coding Vulnerability
In 2014, Apple fixed a critical security vulnerability that was likely caused by the careless use of “cut and paste” during editing.14 The programmer embedded a duplicate line of code that caused the software to bypass a block of code that verifies the authenticity of access credentials. Re-searchers discovered this security flaw in iPhones and iPads; Apple confirmed that it also ap-peared in notebook and desktop machines using the Mac OS X operating system. The vulnerabil-ity is described in the National Vulnerability Database15 as follows:
Impact: An attacker with a privileged network position may capture or modify data in ses-sions protected by SSL/TLS
Description: Secure Transport failed to validate the authenticity of the connection. This is-sue was addressed by restoring missing validation steps.
This vulnerability would allow an attacker to use invalid credentials to gain access to any infor-mation on the targeted device, such as email, financial data, and access credentials to other ser-vices. A variety of standard quality techniques could have prevented or identified the defect. The defect could have been identified during a personal review by the developer or during a more for-mal and effective peer review.
13 CVD id CVE-2014-0160 (MITRE; National Vulnerability Database) http://web.nvd.nist.gov/view/vuln/detail?vul-
nId=CVE-2014-0160
14 http://web.nvd.nist.gov/view/vuln/detail?vulnId=CVE-2014-1266
15 http://nvd.nist.gov/
CMU/SEI-2014-TN-026 | 20
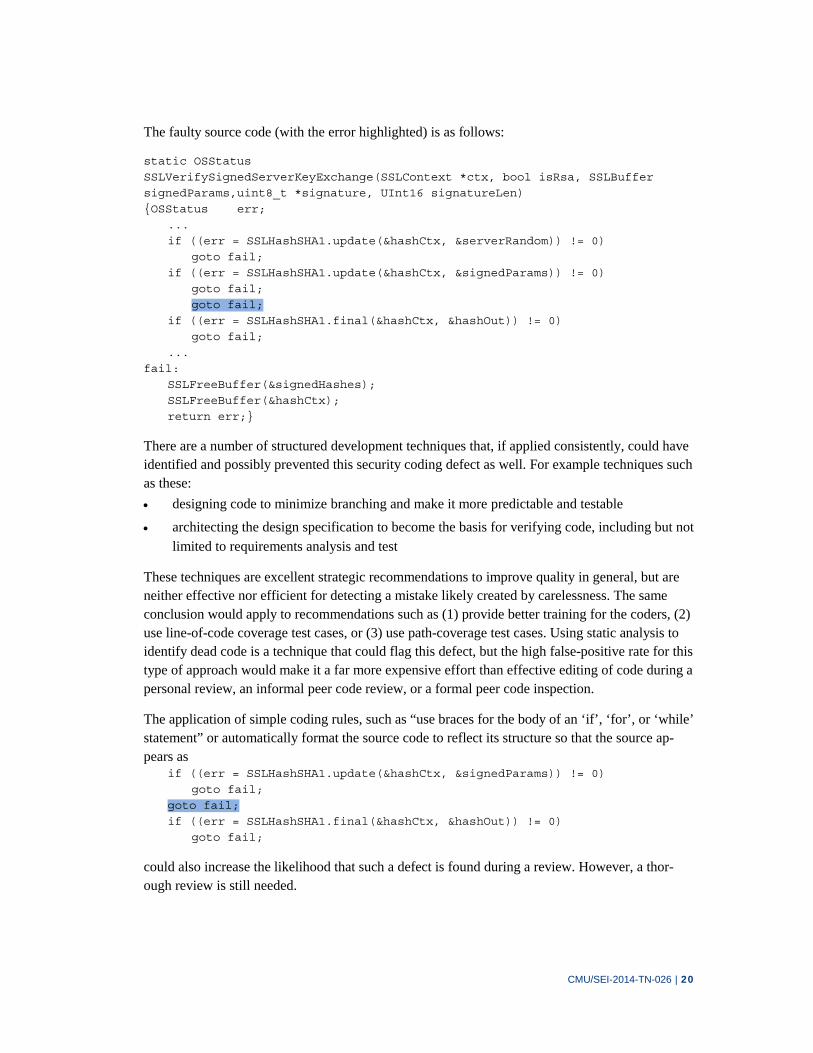
The faulty source code (with the error highlighted) is as follows:
static OSStatus
SSLVerifySignedServerKeyExchange(SSLContext *ctx, bool isRsa, SSLBuffer
signedParams,uint8_t *signature, UInt16 signatureLen)
{OSStatus err;
...
if ((err = SSLHashSHA1.update(&hashCtx, &serverRandom)) != 0)
goto fail;
if ((err = SSLHashSHA1.update(&hashCtx, &signedParams)) != 0)
goto fail;
goto fail;
if ((err = SSLHashSHA1.final(&hashCtx, &hashOut)) != 0)
goto fail;
...
fail:
SSLFreeBuffer(&signedHashes);
SSLFreeBuffer(&hashCtx);
return err;}
There are a number of structured development techniques that, if applied consistently, could have identified and possibly prevented this security coding defect as well. For example techniques such as these:
designing code to minimize branching and make it more predictable and testable
architecting the design specification to become the basis for verifying code, including but not limited to requirements analysis and test
These techniques are excellent strategic recommendations to improve quality in general, but are neither effective nor efficient for detecting a mistake likely created by carelessness. The same conclusion would apply to recommendations such as (1) provide better training for the coders, (2) use line-of-code coverage test cases, or (3) use path-coverage test cases. Using static analysis to identify dead code is a technique that could flag this defect, but the high false-positive rate for this type of approach would make it a far more expensive effort than effective editing of code during a personal review, an informal peer code review, or a formal peer code inspection.
The application of simple coding rules, such as “use braces for the body of an ‘if’, ‘for’, or ‘while’ statement” or automatically format the source code to reflect its structure so that the source ap-pears as if ((err = SSLHashSHA1.update(&hashCtx, &signedParams)) != 0)
goto fail;
goto fail;
if ((err = SSLHashSHA1.final(&hashCtx, &hashOut)) != 0)
goto fail;
could also increase the likelihood that such a defect is found during a review. However, a thor-ough review is still needed.

CMU/SEI-2014-TN-026 | 21
4.2 Case Study: Heartbleed Vulnerability
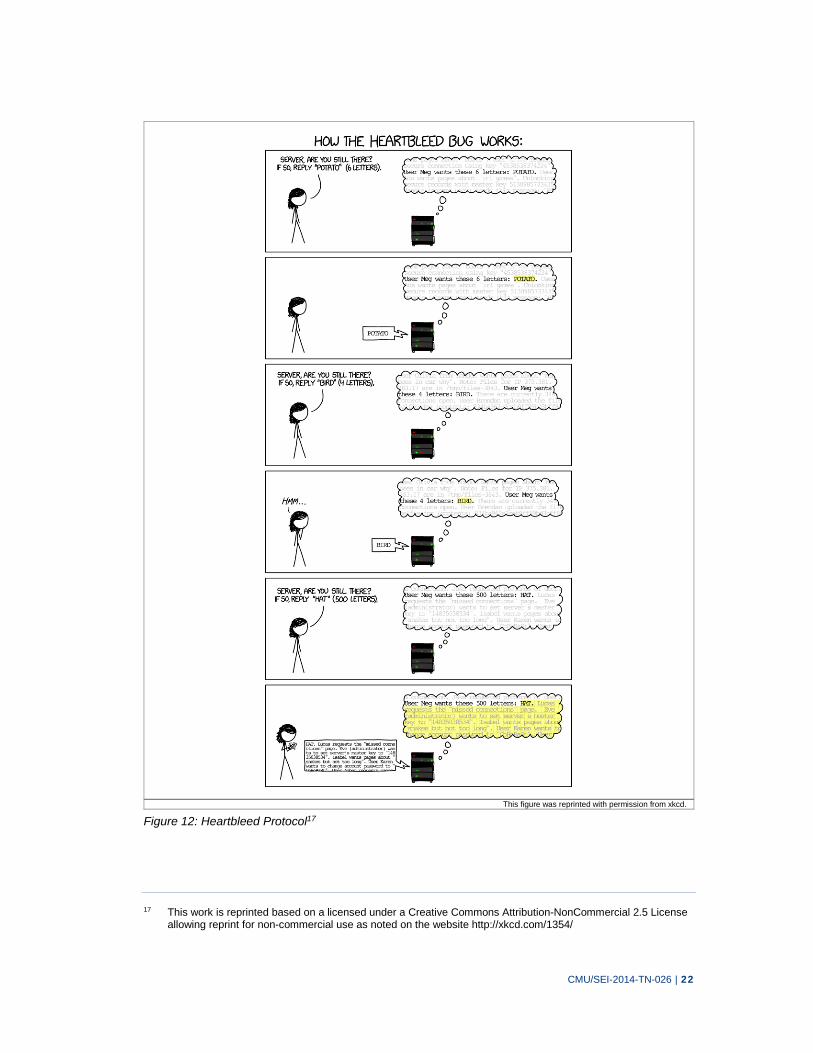
The vulnerability referred to as Heartbleed occurred in the OpenSSL “assert” function, which is the initiator of a heart-beat protocol to verify that the OpenSSL server is live. OpenSSL is an open-source implementation of the secure socket layer (SSL) and transport layer security (TLS) protocols used for securing web communications. Assert software sends a request with two pa-rameters, a content string (payload) and an integer value that represents the length of the payload it is sending. The expected response, if the OpenSSL connection is available, is a return of the content string for the length specified.
The protocol assumes that the requested length of the payload returned is less than 65535 and less than or equal to the payload length, but those assumptions are never verified by the responding function.
A consequence of a violation of either of these limitations is that the request can trigger a data leak. The XKCD16 comic shown in Figure 12 contains a simple explanation of what happens in the code. Rather than a buffer overflow, we have what is called an over-read. The security risk is that the additional data retrieved from the server’s memory could contain passwords, user identifi-cation information, and other confidential information.
16 http://xkcd.com/1354/
CMU/SEI-2014-TN-026 | 22
This figure was reprinted with permission from xkcd.
Figure 12: Heartbleed Protocol17
17 This work is reprinted based on a licensed under a Creative Commons Attribution-NonCommercial 2.5 License
allowing reprint for non-commercial use as noted on the website http://xkcd.com/1354/
CMU/SEI-2014-TN-026 | 23
The defect appears to have been accidentally introduced by a developer in December 2011. OpenSSL is widely used as a convenient (and free) tool. At its disclosure, some half a million of the Internet's secure web servers certified by trusted authorities were believed to have been vul-nerable to the attack.18 The new OpenSSL version repaired this vulnerability by including a bounds check to make sure the payload length you specified is no longer than the data you actu-ally sent.
The Security and Privacy article “Heartbleed 101” provides an excellent summary of why this vulnerability was not found sooner, even with the use of static analysis tools [Carvalho 2014]. The designer of each static analysis tool has to make trade-offs among the time required for the analy-sis, the expert help required to support the tool’s analysis, and the completeness of the analysis. Most static analysis tools use heuristics to identify likely vulnerabilities and to allow completion of their analysis within useful times. Static analysis tools can be an effective technique for finding some types of vulnerabilities, but the complexity of the OpenSSL code includes multiple levels of indirection and other issues that simply exceeded the capabilities of existing tools to find the vul-nerability [Carvalho 2014].
While the OpenSSL program is complex, the cause of the vulnerability is simple. The software never verified the design assumption that the length of the content to be returned to the caller was less than or equal to the length of the payload sent. Verifying that the input data meets its specifi-cation is a standard activity performed for quality, not just for security.
This example also exhibits the realistic trade-offs that must occur between the effort associated with applying a technique and the improved quality or security that is achieved (i.e., the efficiency and effectiveness of the techniques relative to the type of defect). As noted by McGraw, incorpo-rating automated code analysis into the development lifecycle encounters a number of issues of scale [McGraw 2014]. Resource requirements have increased as tools have matured to cover a broad range of vulnerabilities; it may not be feasible to run them on a desktop computer. Scans alone can take two to three hours, which must be followed by analysis of the output to identify and fix vulnerabilities. These resource requirements pose difficulty for some uses, such as Agile development.
One of the benefits touted of Open Source, besides being free, has been the assumption that “hav-ing many sets of eyes on the source code means security problems can be spotted quickly and an-yone can fix bugs; you're not reliant on a vendor” [Rubens 2014]. However, the reality is that without a disciplined and consistent focus on defect removal, security bugs and other bugs will be in the code. The resources supporting OpenSSL had limited funding and inconsistent results. “No one was ever truly in charge of OpenSSL; it just sort of became the default landfill for prototypes of cryptographic inventions, and since it had everything cryptographic under the sun, it also be-came the default source of cryptographic functionality.”19
18 http://en.wikipedia.org/wiki/OpenSSL
19 http://en.wikipedia.org/wiki/OpenSSL
CMU/SEI-2014-TN-026 | 24
The examples in this section show that quality practices, such as inspections and reviews of engi-neering decisions, are essential for security. The associated software weaknesses in these exam-ples should have been identified during development. Testing and code analyzers must be aug-mented by disciplined quality approaches. Appendix A provides a summary of the research available that connects vulnerabilities and defects. Though there is insufficient evidence to con-firm a mathematical relationship, for estimating purposes, 1-5% of defects should be considered to be possible vulnerabilities.

CMU/SEI-2014-TN-026 | 25
5 Other Data Sources: Security, Quality, and Reliability
A report by The National Supervisory Control and Data Acquisition (SCADA) Test Bed (NSTB) program on common industrial control systems (ICS) security weaknesses noted that secure de-sign and vulnerability remediation activities have been judged by many organizations as undoable due to time, cost, and backward compatibility issues.
That observation by the NSTB report is supported by research conducted by IOActive in 2013 that focused on analyzing and reverse engineering the freely and publicly available firmware up-dates for popular satellite communications (SATCOM) technologies manufactured and marketed by well-known commercial firms. The IOActive report identified a number of critical firmware vulnerabilities shown in Table 3.
Table 3: Vulnerability Classes
Backdoors Mechanisms used to access undocumented features or interfaces not in-tended for end users
Hardcoded Credentials Undocumented credentials that can be used to authenticate in docu-mented interfaces expected to be available for user interaction
Insecure Protocols Documented protocols that pose a security risk
Undocumented Protocols Undocumented protocols or protocols not intended for end users that pose a security risk
Weak Password Resets A mechanism that allows resetting others’ passwords
The last two items in this table could require some security expertise, but the first three items are well-known security vulnerabilities whose existence supports a claim that security received little attention during development. For example, hardcoded credentials, is 7th on the 2011 CWE/SANS Top 25 Most Dangerous Software Errors [Christey 2011]. Backdoors often appear when code in-serted for debugging is not removed before deployment or when code is added for remote system administration, but not properly secured.
5.1 Quality Practices
5.1.1 Design and Engineering Defects
Two safety examples show the importance of applying quality measures to engineering design de-cisions.
Studies of safety-critical systems, particularly DoD avionics software systems, show that while 70% of errors in embedded safety-critical software are introduced in the requirements and archi-tecture design phases [Feiler 2012], 80% of all errors are found only at system integration or later. In particular, these errors are not found in unit testing. The rework effort to correct requirement and design problems in later phases can be as high as 300 to 1,000 times the cost of in-phase cor-rection; undiscovered errors are likely to remain after that rework.
Similar problems appeared with patient-controlled analgesia infusion pumps that are used to in-fuse a pain killer at a prescribed basal flow rate. The U.S. Federal Drug Administration (FDA)
CMU/SEI-2014-TN-026 | 26
uses a premarket assessment to certify the safety and reliability of medical infusion pumps before they are sold to the public. In spite of the FDA’s assessment, too many approved pumps exhibited hardware and software defects in the field, leading to the death or injury of patients.20 From 2005 through 2009, 87 infusion pump recalls were conducted by firms to address identified safety prob-lems. These defects had not been found during development by testing and other methods. Based on an analysis of pump recalls and adverse events, the FDA concluded that many of the problems appeared to be related to deficiencies in device design and engineering. The FDA revised its re-market assessment to also consider defects in device design and engineering.
5.1.2 Capers Jones Software Quality Survey
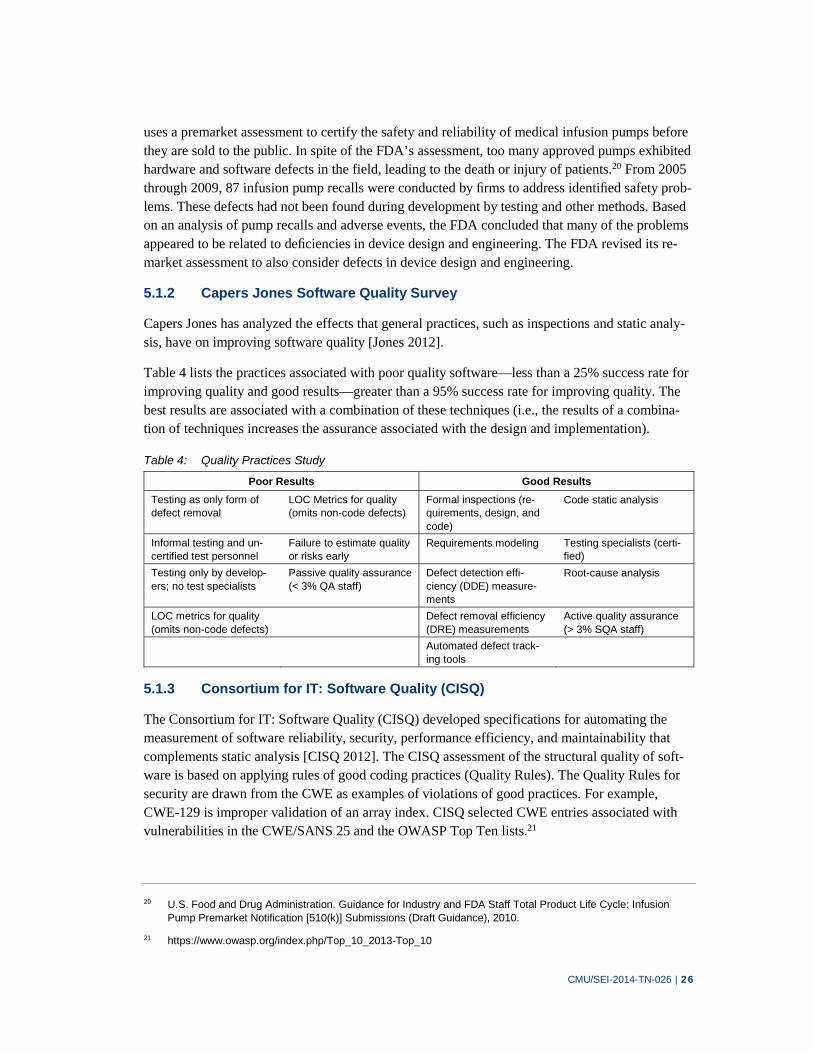
Capers Jones has analyzed the effects that general practices, such as inspections and static analy-sis, have on improving software quality [Jones 2012].
Table 4 lists the practices associated with poor quality software—less than a 25% success rate for improving quality and good results—greater than a 95% success rate for improving quality. The best results are associated with a combination of these techniques (i.e., the results of a combina-tion of techniques increases the assurance associated with the design and implementation).
Table 4: Quality Practices Study
Poor Results Good Results
Testing as only form of defect removal
LOC Metrics for quality (omits non-code defects)
Formal inspections (re-quirements, design, and code)
Code static analysis
Informal testing and un-certified test personnel
Failure to estimate quality or risks early
Requirements modeling Testing specialists (certi-fied)
Testing only by develop-ers; no test specialists
Passive quality assurance (< 3% QA staff)
Defect detection effi-ciency (DDE) measure-ments
Root-cause analysis
LOC metrics for quality (omits non-code defects)
Defect removal efficiency (DRE) measurements
Active quality assurance (> 3% SQA staff)
Automated defect track-ing tools
5.1.3 Consortium for IT: Software Quality (CISQ)
The Consortium for IT: Software Quality (CISQ) developed specifications for automating the measurement of software reliability, security, performance efficiency, and maintainability that complements static analysis [CISQ 2012]. The CISQ assessment of the structural quality of soft-ware is based on applying rules of good coding practices (Quality Rules). The Quality Rules for security are drawn from the CWE as examples of violations of good practices. For example, CWE-129 is improper validation of an array index. CISQ selected CWE entries associated with vulnerabilities in the CWE/SANS 25 and the OWASP Top Ten lists.21
20 U.S. Food and Drug Administration. Guidance for Industry and FDA Staff Total Product Life Cycle: Infusion
Pump Premarket Notification [510(k)] Submissions (Draft Guidance), 2010.
21 https://www.owasp.org/index.php/Top_10_2013-Top_10
CMU/SEI-2014-TN-026 | 27
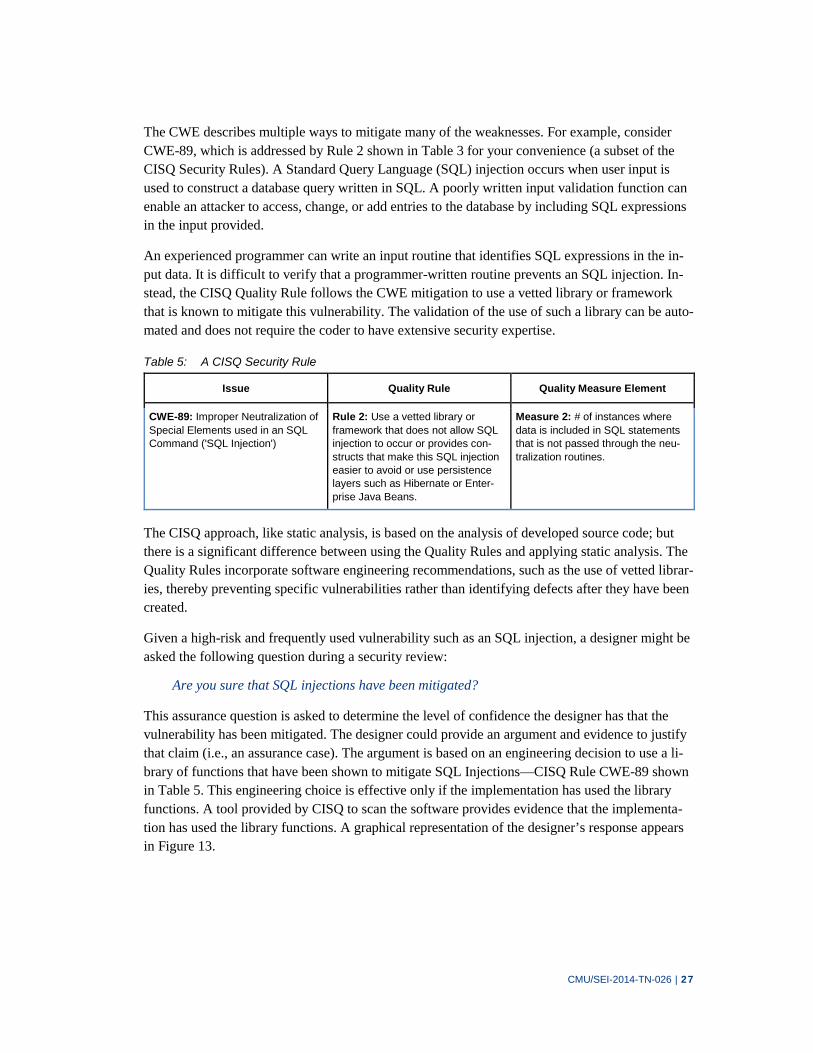
The CWE describes multiple ways to mitigate many of the weaknesses. For example, consider CWE-89, which is addressed by Rule 2 shown in Table 3 for your convenience (a subset of the CISQ Security Rules). A Standard Query Language (SQL) injection occurs when user input is used to construct a database query written in SQL. A poorly written input validation function can enable an attacker to access, change, or add entries to the database by including SQL expressions in the input provided.
An experienced programmer can write an input routine that identifies SQL expressions in the in-put data. It is difficult to verify that a programmer-written routine prevents an SQL injection. In-stead, the CISQ Quality Rule follows the CWE mitigation to use a vetted library or framework that is known to mitigate this vulnerability. The validation of the use of such a library can be auto-mated and does not require the coder to have extensive security expertise.
Table 5: A CISQ Security Rule
Issue Quality Rule Quality Measure Element
CWE-89: Improper Neutralization of Special Elements used in an SQL Command ('SQL Injection')
Rule 2: Use a vetted library or framework that does not allow SQL injection to occur or provides con-structs that make this SQL injection easier to avoid or use persistence layers such as Hibernate or Enter-prise Java Beans.
Measure 2: # of instances where data is included in SQL statements that is not passed through the neu-tralization routines.
The CISQ approach, like static analysis, is based on the analysis of developed source code; but there is a significant difference between using the Quality Rules and applying static analysis. The Quality Rules incorporate software engineering recommendations, such as the use of vetted librar-ies, thereby preventing specific vulnerabilities rather than identifying defects after they have been created.
Given a high-risk and frequently used vulnerability such as an SQL injection, a designer might be asked the following question during a security review:
Are you sure that SQL injections have been mitigated?
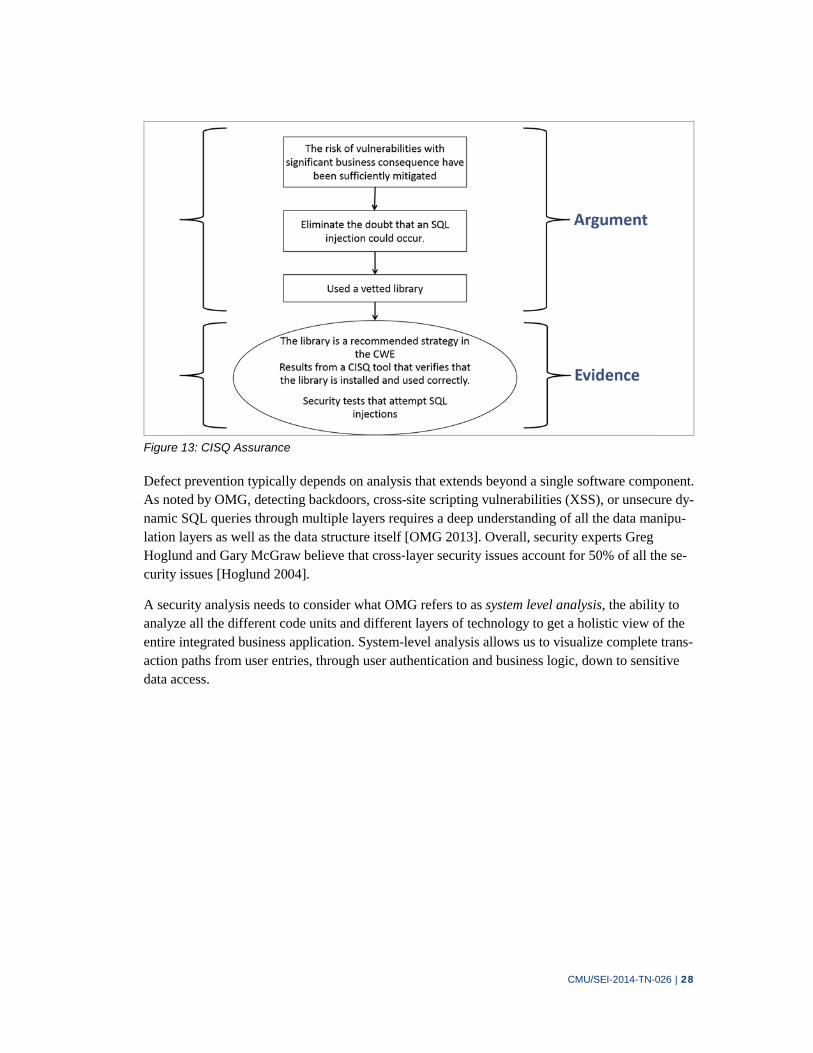
This assurance question is asked to determine the level of confidence the designer has that the vulnerability has been mitigated. The designer could provide an argument and evidence to justify that claim (i.e., an assurance case). The argument is based on an engineering decision to use a li-brary of functions that have been shown to mitigate SQL Injections—CISQ Rule CWE-89 shown in Table 5. This engineering choice is effective only if the implementation has used the library functions. A tool provided by CISQ to scan the software provides evidence that the implementa-tion has used the library functions. A graphical representation of the designer’s response appears in Figure 13.
CMU/SEI-2014-TN-026 | 28
Figure 13: CISQ Assurance
Defect prevention typically depends on analysis that extends beyond a single software component. As noted by OMG, detecting backdoors, cross-site scripting vulnerabilities (XSS), or unsecure dy-namic SQL queries through multiple layers requires a deep understanding of all the data manipu-lation layers as well as the data structure itself [OMG 2013]. Overall, security experts Greg Hoglund and Gary McGraw believe that cross‐layer security issues account for 50% of all the se-curity issues [Hoglund 2004].
A security analysis needs to consider what OMG refers to as system level analysis, the ability to analyze all the different code units and different layers of technology to get a holistic view of the entire integrated business application. System-level analysis allows us to visualize complete trans-action paths from user entries, through user authentication and business logic, down to sensitive data access.

CMU/SEI-2014-TN-026 | 29
6 Planning for Improved Security and Quality
The projects we analyzed pointed to a disciplined lifecycle approach with quality defect identifi-cation and removal practices combined with code analysis tooling to provide the strongest results for building security into software and systems. Examples, such as the recent Apple bug, support the need for strengthening code review. Heartbleed points to the need for validating that all re-quirements are complete and fully implemented in the code. The five projects selected from the SEI TSP database demonstrated that producing products with very few operational issues requires an integration of quality reviews for defect removal, including security or safety-critical reviews at every step of the lifecycle.
The effectiveness of quality practices, such as inspections, in finding defects depends on review-ers who are knowledgeable in what could go wrong. The CISQ Quality Rules show that effective security engineering decisions need to augment developer capabilities.
The SEI conducted a workshop in August 2014 with representatives from the organizations that delivered TSP quality results as well as industry and federal acquisition, engineering, and security experts interested in further analysis of these success stories. Their discussion, based on shared experiences that support the need for increased quality as one means for improved software secu-rity, led to the following insights:
If you have a quality problem, then you have a security problem.
Maybe up to 70% of CWEs are actually quality defects.
Maturity levels are based on statistical samples; quality requires continuous measurement of everything to catch problems early.
If something is important, then you have to figure out a way to measure it; quality has estab-lished an intensive metrics-collection process for all aspects of the lifecycle and security can leverage many of these same metrics, but doing so requires investment in extensively tooling the processes used to acquire, develop, validate, and implement systems.
Effective measurements require planning to understand what to measure and what the measures tell you; then you can track results and understand when your efforts are or are not achieving intended outcomes.
Quality and security use the same automated tools and testing approaches but the focus is different:
For quality, the level of defects is an indicator of code quality; testing is not for finding
bugs, but for confirming quality.
For security, the tools are used in testing to point to specific problems and many false
positives result in wasted time researching non-problems.
Quality approaches instill personal accountability at each stage of the lifecycle; the enter-prise must clearly define what “right” looks like and then measure and reward the right be-haviors, which are reinforced by training, tracking, and independent review.

CMU/SEI-2014-TN-026 | 30
Our research suggests that implementing systems with effective operational security requires in-corporating both quality and security considerations throughout the lifecycle. Predicting effective operational security requires quality and reliability evidence and security expert analysis at each step in the lifecycle. If defects are measured, from 1-5% of them should be considered to be secu-rity vulnerabilities. It is also feasible that when security vulnerabilities are measured, then code quality can be estimated by considering them to be 1-5% of the expected defects.
6.1 Next Steps
Further evaluation of systems is needed to see if the patterns suggested by our analysis continue to hold. We explored several options to expand our sample size, but found limited data about defects and vulnerabilities assembled in a form that could be readily analyzed. This analysis must be done for each unique version of a software product. At this point in time, evaluation of each software product requires careful review of each software change and reported vulnerability. The review not only matches up defects with source code versions, but also reviews each vulnerability re-ported against the product suite to identify defects specific to the selected product version by pars-ing available description information and identifying operational results for the same source code. Collection of data about each product in a form that supports automation of this analysis would greatly speed confirmation.

CMU/SEI-2014-TN-026 | 31
Appendix A: Relationship Between Vulnerabilities and Defects, a Brief Summary of the Literature
A number of publications, many peer reviewed, support, or are consistent with the thesis that a large portion of vulnerabilities result from common development errors, and therefore, vulnerabil-ities correlate with defects.
In 2004 Jon Heffley and Pascal Meunier, reported that 64% of vulnerabilities in the National Vul-nerability Database (NVD) resulted from programming errors; half of those errors were in the cat-egories of buffer overflow, cross-site scripting, and injection flaws [Heffley 2004].
In 2006, Li reported empirical findings on the sources of vulnerabilities and found that 9-17% of vulnerabilities were memory related; of those vulnerabilities, 72-84% were semantic rather than syntactic [Li 2006]. The median time between introduction and discovery of the vulnerability was between two and three years. The semantic vulnerabilities include cross-site scripting and injec-tion errors. In his paper, Li specifically recommended using tools to examine code prior to re-lease.
In 2014, Robert Martin summarized empirical findings from the CWE (MITRE) linking vulnera-bilities to common development issues. In his article, Martin includes a number of activities that are effective in finding and removing defects earlier in the process [Martin 2014].
In a 2011 empirical study of the Firefox browser, Shin and Williams reported that 21.1% of files contained faults and 13% of the faulty files (3.3% overall) were vulnerable. They further reported that 82% of the vulnerable files were also classified as faulty [Shin 2011]. They concluded that that “prediction models based upon traditional metrics can substitute for specialized vulnerability prediction models.” Despite the correlation and high recall, a large portion of false positives re-mained, indicating that further research is needed to identify vulnerabilities.
Figure 14: Distribution of Faulty and Vulnerable Files in Firefox 2.0

CMU/SEI-2014-TN-026 | 32
In 2007 and 2008, Omar Alhazmi and colleagues investigated the relationship directly, and re-ported measures of vulnerabilities and defects in versions of Windows and Linux operating sys-tems [Alhazmi 2007, 2008]. Table 6 illustrates their findings.
Table 6: Vulnerability Density Versus Defect Density Measured for Some Software Systems
Systems MSLOC Known Defects
Known Defect Density (per KSLOC)
Known Vulnerabilities
VKD (per KSLOC)
VKD/DKD Ratio (%)
Release Date
Windows 95 15 5000 0.3333 50 0.0033 1.00 Aug 1995
Windows 98 18 10000 0.5556 84 0.0047 0.84 Jun 1998
Windows XP 40 106500 2.6625 125 0.0031 0.12 Oct 2001
Windows NT 16 10000 0.625 180 0.0113 1.80 Jul 1996
Win 2000 35 63000 1.80 204 0.0058 0.32 Feb 2000
Table 7 depicts the results of a 2006 study by Andy Ozment and Stuart Schechter that reported an overall vulnerability density of 6.6 Vuls/MLOC (new and changed LOC) in OpenBSD versions 2.3 through 3.7 [Ozment 2006]. The vulnerability densities are comparable to the vulnerability densities reported by Omar Alhazmi and Yashwant Malaiya for Linux 6.2 [Alhazmi 2008]. Table 8 depicts the results of the 2008 study conducted by Alhazmi and Malaiya.
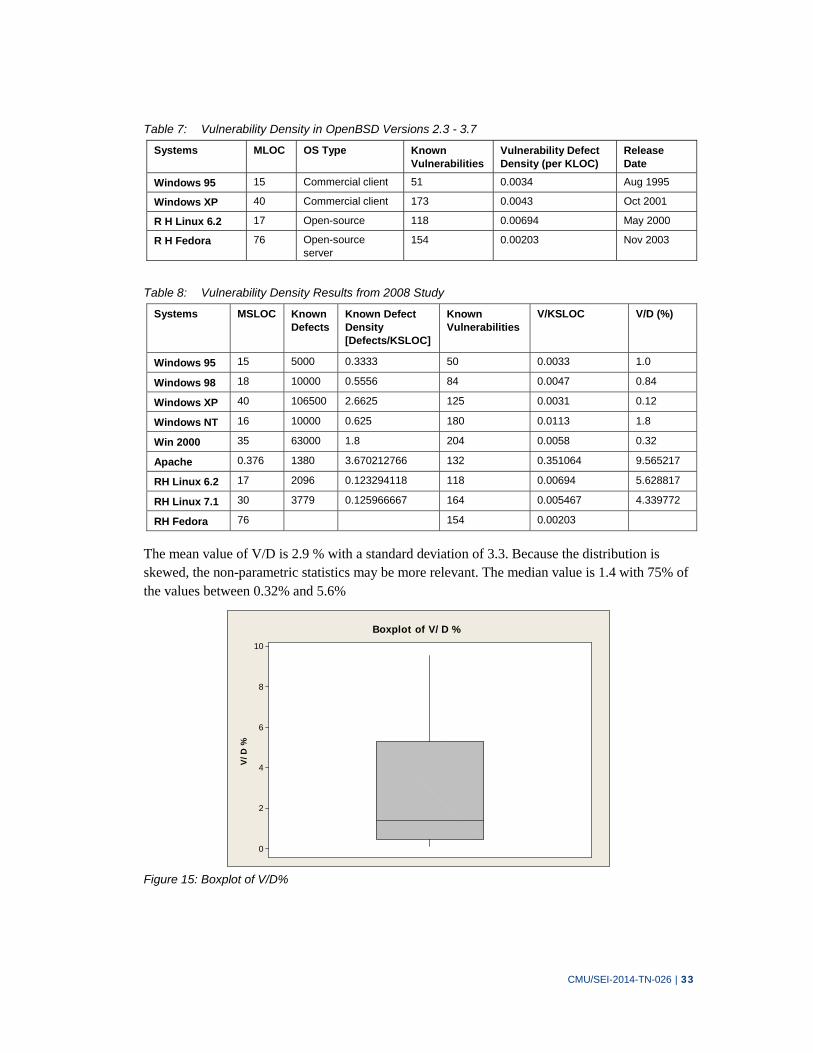
CMU/SEI-2014-TN-026 | 33
Table 7: Vulnerability Density in OpenBSD Versions 2.3 - 3.7
Systems MLOC OS Type Known Vulnerabilities
Vulnerability Defect Density (per KLOC)
Release Date
Windows 95 15 Commercial client 51 0.0034 Aug 1995
Windows XP 40 Commercial client 173 0.0043 Oct 2001
R H Linux 6.2 17 Open-source 118 0.00694 May 2000
R H Fedora 76 Open-source server
154 0.00203 Nov 2003
Table 8: Vulnerability Density Results from 2008 Study
Systems MSLOC Known Defects
Known Defect Density [Defects/KSLOC]
Known Vulnerabilities
V/KSLOC V/D (%)
Windows 95 15 5000 0.3333 50 0.0033 1.0
Windows 98 18 10000 0.5556 84 0.0047 0.84
Windows XP 40 106500 2.6625 125 0.0031 0.12
Windows NT 16 10000 0.625 180 0.0113 1.8
Win 2000 35 63000 1.8 204 0.0058 0.32
Apache 0.376 1380 3.670212766 132 0.351064 9.565217
RH Linux 6.2 17 2096 0.123294118 118 0.00694 5.628817
RH Linux 7.1 30 3779 0.125966667 164 0.005467 4.339772
RH Fedora 76 154 0.00203
The mean value of V/D is 2.9 % with a standard deviation of 3.3. Because the distribution is skewed, the non-parametric statistics may be more relevant. The median value is 1.4 with 75% of the values between 0.32% and 5.6%
10
8
6
4
2
0
V/D
%
Boxplot of V/D %
Figure 15: Boxplot of V/D%
CMU/SEI-2014-TN-026 | 34
Conclusions from the Literature
The NVD, CVE, and CWE are imperfect tools for research since the goal is for volunteers to rec-ord the known vulnerabilities rather than research. The data are often incomplete, redundant, or ambiguous and requires manual coding. Nonetheless, the data provide a useful starting point not only for practitioners, but researchers as well. Common vulnerabilities continue to be associated with coding and design defects of known types, and these vulnerabilities could be identified and removed earlier in the development process. Because these defects are rare—typically in the range of 0.002 to 0.006 per thousand lines of code—the counts may have high uncertainty. The uncer-tainty is compounded by the observation that vulnerability counts are only for those vulnerabili-ties so far discovered. This, in turn, is related to the use of the system and the motivation of users and hackers to discover the vulnerabilities. Moreover, lines of code to implement similar capabil-ity can vary substantially between systems depending on computing language and coding stand-ards.
Given the sources of uncertainty, and the wide ranges in defect and vulnerability density, the ratio of vulnerabilities to defects is expected. Nonetheless, the association is plausible and appears to exist in practice. The measured vulnerability densities are consistent with vulnerability defect ra-tios of between 0.3% and 10%. There are some hints that the lower end of this range represents systems that have made greater use of security specific removal tools and development practices.
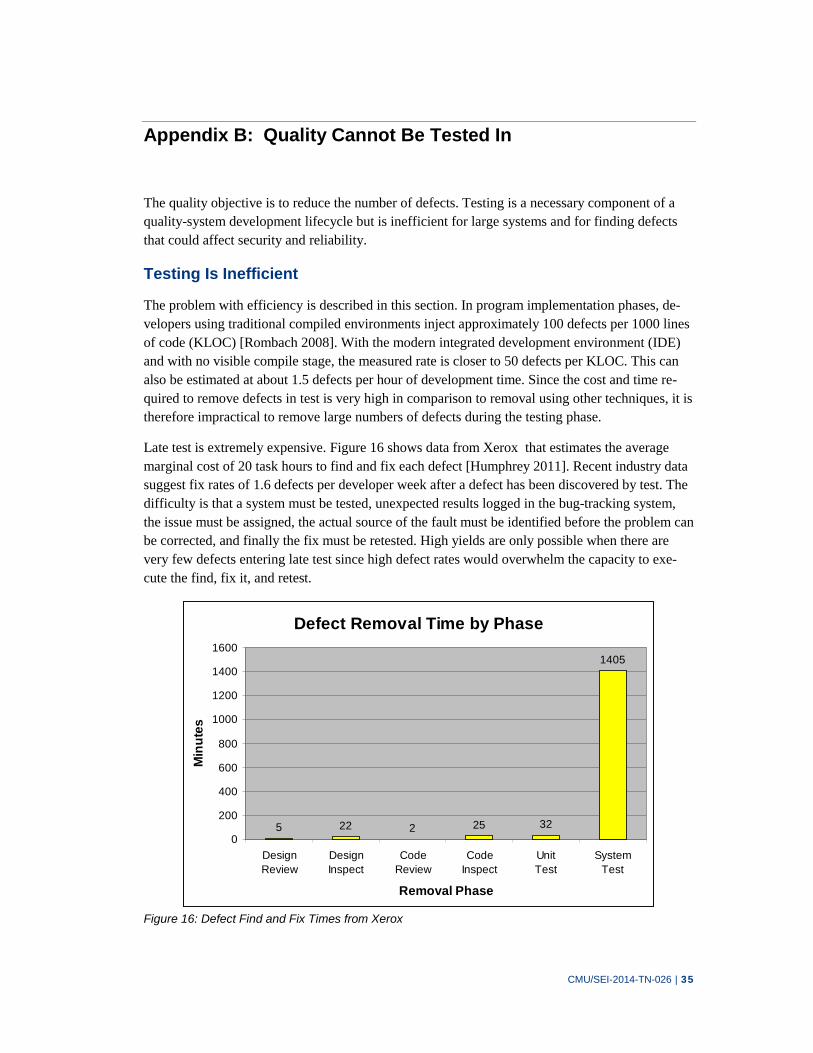
CMU/SEI-2014-TN-026 | 35
Appendix B: Quality Cannot Be Tested In
The quality objective is to reduce the number of defects. Testing is a necessary component of a quality-system development lifecycle but is inefficient for large systems and for finding defects that could affect security and reliability.
Testing Is Inefficient
The problem with efficiency is described in this section. In program implementation phases, de-velopers using traditional compiled environments inject approximately 100 defects per 1000 lines of code (KLOC) [Rombach 2008]. With the modern integrated development environment (IDE) and with no visible compile stage, the measured rate is closer to 50 defects per KLOC. This can also be estimated at about 1.5 defects per hour of development time. Since the cost and time re-quired to remove defects in test is very high in comparison to removal using other techniques, it is therefore impractical to remove large numbers of defects during the testing phase.
Late test is extremely expensive. Figure 16 shows data from Xerox that estimates the average marginal cost of 20 task hours to find and fix each defect [Humphrey 2011]. Recent industry data suggest fix rates of 1.6 defects per developer week after a defect has been discovered by test. The difficulty is that a system must be tested, unexpected results logged in the bug-tracking system, the issue must be assigned, the actual source of the fault must be identified before the problem can be corrected, and finally the fix must be retested. High yields are only possible when there are very few defects entering late test since high defect rates would overwhelm the capacity to exe-cute the find, fix it, and retest.
Figure 16: Defect Find and Fix Times from Xerox
Defect Removal Time by Phase
5 22 2 25 32
1405
0
200
400
600
800
1000
1200
1400
1600
DesignReview
DesignInspect
CodeReview
CodeInspect
UnitTest
SystemTest
Removal Phase
Min
ute
s

CMU/SEI-2014-TN-026 | 36
System test defect removal times are much greater because in this phase, the system—not a mod-ule—is being tested. Simply identifying the defect can be time consuming, ranging from a few minutes to weeks to determine the problem. After the problem is found, the defect must be fixed and the system tested. This process increases makes the average defect removal time in system test about two orders of magnitude more than the average defect removal times for phases before integration and system test.
TSP guidelines suggest entering unit test with less than 5 defects per KLOC. 100,000 LOC would have 2000 defects. To remove half of those defects would require approximately 20,000 task-hours or 20 developer years. This effort is comparable to the cost of initial development. Entering system test with twice that level of defects would require twice as long.
In a world with business constraints on both time and money, test will often end when time and money are exhausted, not when all defects have been found.
Testing Is Ineffective
All defect removal activities have limits, and test is more limited than others. A problem with test is that it has many dimensions. Code must be exercised (often for different input conditions), and different paths (including error handling) must be checked. Covering lines of code, paths, and conditions often explodes combinatorial. Exhaustive test cases are often impossible. Moreover, a variety of conditions that stress the system must be tested as well.
Medium- and large-scale systems typically contain many defects, and these defects do not always cause problems when the software systems are used precisely as tested. The tests, however, can-not be comprehensive because large systems contain many components that operate under many conditions. When systems are stressed in new ways, previously undiscovered defects are encoun-tered. Therefore, under stressful conditions, these systems are least likely to operate correctly or reliably. Figure 17 shows several of the conditions that can stress the program under operation. The circle represents possible ways in which the system can be tested. The axes suggest possible ways that the system can be stressed when testing functionality and performance. These include, but are not limited to, configurations, hardware faults, input error, data errors, and resource con-tentions. The tested region, presumably safe and secure, is depicted in green. The untested region is potentially unsafe or not secure and is depicted in gray. Even a small system might require an enormous number of tests to confirm correct operations under expected conditions. As systems grow, the total number of possible conditions may be infinite. For any non-trivial system, the tested area is small. Test, by necessity, focuses on the conditions most likely to be encountered and most likely to trigger a fault in the system. Test, therefore, can only find a fraction of the de-fects in the system. On the other hand, attackers may deliberately attempt to stress the system in unconventional ways.
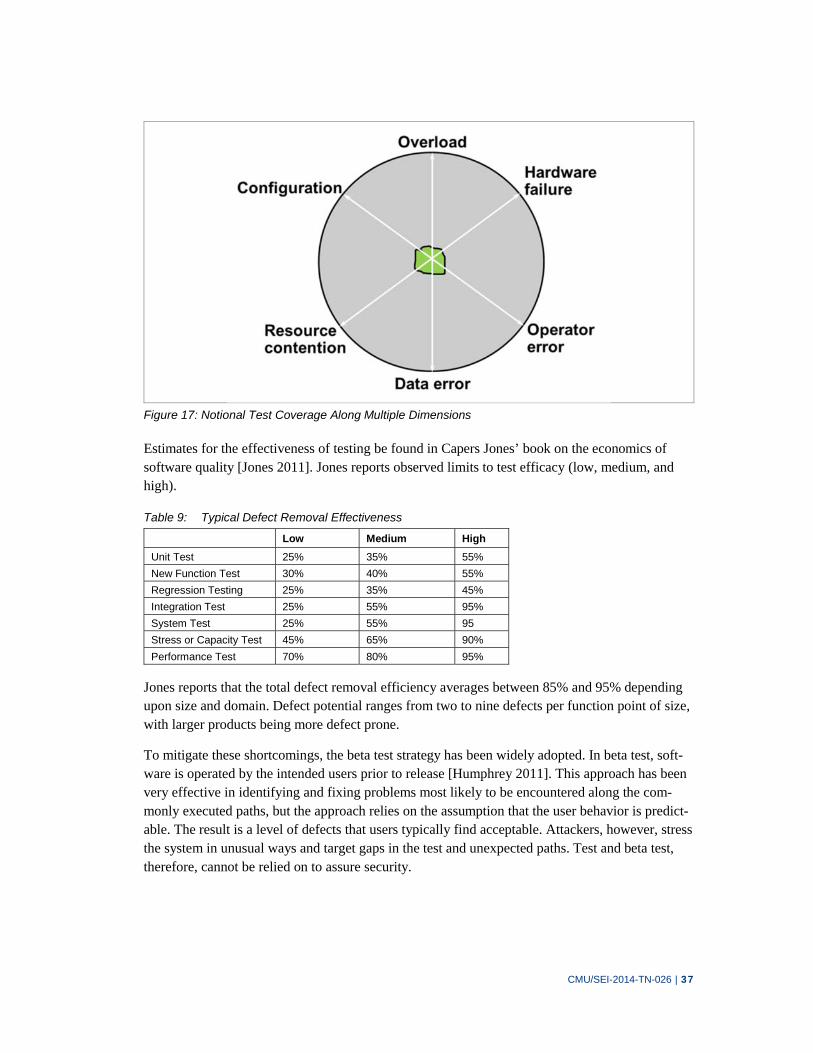
CMU/SEI-2014-TN-026 | 37
Figure 17: Notional Test Coverage Along Multiple Dimensions
Estimates for the effectiveness of testing be found in Capers Jones’ book on the economics of software quality [Jones 2011]. Jones reports observed limits to test efficacy (low, medium, and high).
Table 9: Typical Defect Removal Effectiveness
Low Medium High
Unit Test 25% 35% 55%
New Function Test 30% 40% 55%
Regression Testing 25% 35% 45%
Integration Test 25% 55% 95%
System Test 25% 55% 95
Stress or Capacity Test 45% 65% 90%
Performance Test 70% 80% 95%
Jones reports that the total defect removal efficiency averages between 85% and 95% depending upon size and domain. Defect potential ranges from two to nine defects per function point of size, with larger products being more defect prone.
To mitigate these shortcomings, the beta test strategy has been widely adopted. In beta test, soft-ware is operated by the intended users prior to release [Humphrey 2011]. This approach has been very effective in identifying and fixing problems most likely to be encountered along the com-monly executed paths, but the approach relies on the assumption that the user behavior is predict-able. The result is a level of defects that users typically find acceptable. Attackers, however, stress the system in unusual ways and target gaps in the test and unexpected paths. Test and beta test, therefore, cannot be relied on to assure security.
CMU/SEI-2014-TN-026 | 38
Bibliography
URLs are valid as of the publication date of this document.
[Alhazmi 2007] Alhazmi, Omar H.; Malaiya, Yashwant K.; & Ray, Indrajit. “Measuring, Analyzing and Predicting Security Vulnerabilities in Software Systems.” Computers & Security 26, 3 (May 2007): 219–228. doi:10.1016/j.cose.2006.10.002
[Alhazmi 2008] Alhazmi, Omar H. & Malaiya, Yashwant K. “Application of Vulnerability Discovery Models to Major Operating Systems.” IEEE Transactions on Reliability 57, 1 (March 2008): 14–22. http://ieeexplore.ieee.org/xpls/abs_all.jsp?arnumber=4454142
[Anderson 2001] Anderson, Ross. “Why Information Security Is Hard: An Economic Perspective,” 358-365. Pro-ceedings of the Seventeenth Computer Security Applications Conference. IEEE Computer Society Press, 2001. http://ieeexplore.ieee.org/stamp/stamp.jsp?tp=&arnumber=991552
[Anderson 2002] Anderson, Ross. “Security in Open versus Closed Systems—The Dance of Boltzmann, Coase and Moore,” 1–15. Proceedings of the Conference on Open Source Software: Economics, Law and Policy. Toulouse, France, June 2002.
[Blanchette 2009] Blanchette, S. Assurance Cases for Design Analysis of Complex System of Systems Software. American Institute for Aeronautics and Astronautics (AIAA) Infotech@Aerospace Conference. Seattle, Washington, April 2009. http://resources.sei.cmu.edu/library/asset-view.cfm?as-setid=29062
[Binder 1997] Binder, R. V. “Can a Manufacturing Quality Model Work for Software?” Software, IEEE (September/October 1997): 102–103. doi:10.1109/52.605937
[Boehm 1981] Boehm, B. W. Software Engineering Economics. Prentice-Hall, Inc., 1981.
[BSIMM 2013] BSIMM. Building Security In Maturity Model. http://bsimm.com
[Butler 1991] Butler, Ricky W. & Finelli, George B. “The Infeasibility of Experimental Quantification of Life-Critical Software Reliability,” 66-76. Proceedings of the ACM Symposium on Software for Criti-cal Systems, New Orleans, 1991. http://dl.acm.org/citation.cfm?id=123054

CMU/SEI-2014-TN-026 | 39
[Carvalho 2014] Carvalho, Marco; DeMott, Jared; Ford, Richard; & Wheeler, David A. “Heartbleed 101,” Security & Privacy, IEEE 12, 4 (July-August 2014): 63-67. doi: 10.1109/MSP.2014.66
[Christey 2011] Chistey, Steve. “2011 CWE/SANS Top 25 Most Dangerous Software Errors.” Common Weak-ness Enumeration (CWE). http://cwe.mitre.org/top25/
[CISQ 2012] Consortium for IT Software Quality. CISQ Specifications for Automated Quality Characteristic Measures (CISQ–TR–2012–01). Consortium for IT Software Quality, 2012. http://it-cisq.org/wp-content/uploads/2012/09/CISQ-Specification-for-Automated-Quality-Characteristic-Measures.pdf
[CNSS 2009] Committee on National Security Systems. “Instruction No. 4009,” National Information Assur-ance Glossary, June 2009.
[Davis 2003] Davis, Noopur & Mullaney, Julia. The Team Software Process (TSP) in Practice: A Summary of Recent Results (CMU/SEI-2003-TR-014). Software Engineering Institute, Carnegie Mellon Uni-versity, 2003. http://resources.sei.cmu.edu/library/asset-view.cfm?assetid=6675
[FDA 2011] U.S. Department of Health and Human Services, Food and Drug Administration Center for De-vices and Radiological Health Center for Biologics Evaluation and Research. General Principles of Software Validation; Final Guidance for Industry and FDA Staff http://www.fda.gov/downloads/MedicalDevices/.../ucm085371.pdf
[NIST 2002] National Institute of Standards and Technology. “Federal Information Security Management Act of 2002.” Vol. 48, 2002.
[Heffley 2004] Heffley, Jon & Meunier, Pascal. “Can Source Code Auditing Software Identify Common Vulnerabilities and Be Used to Evaluate Software Security?” Proceedings of the 37th Hawaii International Conference on System Sciences, January 2004. http://ieeexplore.ieee.org/xpl/mostRecentIssue.jsp?punumber=8934
[Hoglund 2004] Hoglund, Greg & McGraw, Gary. Exploiting Software: How to Break Code. Boston: Addison‐Wesley, 2004. http://www.informit.com/store/exploiting-software-how-to-break-code-9780201786958
CMU/SEI-2014-TN-026 | 40
[Humphrey 2000] Humphrey, Watts S. The Team Software Process (TSP) (CMU/SEI-2000-TR-023). Software Engineering Institute, Carnegie Mellon University, 2000. http://resources.sei.cmu.edu/library/asset-view.cfm?assetid=5287
[Humphrey 2011] Humphrey, Watts S. & Over, James W. Leadership, Teamwork, and Trust. Addison-Wesley Pro-fessional, 2011. http://resources.sei.cmu.edu/library/asset-view.cfm?assetid=30368
[Jones 2011] Jones, Capers & Oliver Bonsignour. The Economics of Software Quality. Addison-Wesley Profes-sional, 2011. http://www.informit.com/store/economics-of-software-quality-9780132582209
[Jones 2012] Jones, Capers. “Software Quality in 2012: A Survey of the State of the Art.” Nancook Analytics LLC (May 2012). http://sqgne.org/presentations/2012-13/Jones-Sep-2012.pdf
[Kelly 1998] Kelly, Tim P. “Arguing Safety.” PhD diss., University of York, 1998.
[Kelly 2004] Kelly, Tim & Weaver, Rob. “The Goal Structuring Notation: A Safety Argument Notation.” Pro-ceedings of International Workshop on Models and Processes for the Evaluation of COTS Compo-nents (MPEC 2004). Edinburgh, Scotland, May 2004. IEEE Computer Society, 2004.
[Kupsch2014] Kupsch, James A. & Miller, Barton P. Why Do Software Assurance Tools Have Problems Finding Bugs Like Heartbleed? (WP003). Software Assurance Marketplace, April 2014. https://continu-ousassurance.org/swamp/SWAMP-Heartbleed.pdf
[Li 2006] Li, Zhenmin; Tan, Lin; Wang, Xuanhui; Lu, Shan; Zhou, Yuanyuan; & Zhai, Chengxiang. “Have Things Changed Now? An Empirical Study of Bug Characteristics in Modern Open Source Software,” 25-33. Proceedings of ASID ’06, 1st Workshop on Architectural and System Support for Improving Software Dependability, New York, New York, 2006. doi:10.1145/1181309.1181314
[Martin 2014] Martin, Robert A. “Non-Malicious Taint Bad Hygiene Is as Dangerous to the Mission as Malicious Intent.” CrossTalk, 2 (March/April 2014): 4–9.
[McGraw 2014] McGraw, Gary. “Software [In]security and Scaling Automated Code Review,” TechTarget.com (January 2014). http://searchsecurity.techtarget.com/opinion/McGraw-Software-insecurity-and-scaling-auto-mated-code-review

CMU/SEI-2014-TN-026 | 41
[MITRE 2014] MITRE. “The Common Weakness Enumeration (CWE) Initiative” [accessed December 2014] https://cwe.mitre.org/
[Nichols 2012] Nichols, William R. “Plan for Success, Model the Cost of Quality.” Software Quality Professional 14, 2 (March 2012): 4-11.
[OMG 2013] Object Management Group. “How to Deliver Resilient, Secure, Efficient, and Easily Changed IT Systems in Line with CISQ Recommendations,” Object Management Group, 2013. http://www.omg.org/CISQ_compliant_IT_Systemsv.4-3.pdf
[Open Group 2014] Open Group. “Mitigating Maliciously Tainted and Counterfeit Products.” Open Trusted Technol-ogy Provider Standard (O-TTPS), Version 1.0. https://www2.opengroup.org/ogsys/catalog/C139
[Ozment 2006] Ozment, Andy & Schechter, Stuart E. “Milk or Wine: Does Software Security Improve with Age?” 93–104. Proceedings of the 15th Usenix Security Symposium, Vancouver, B.C., Canada, July-August 2006. https://www.usenix.org/legacy/events/sec06/index.html
[Pan 1999] Pan, Jiantao. Software Reliability. http://users.ece.cmu.edu/~koopman/des_s99/sw_reliability/
[Ratnaraj 2012] Ratnaraj, David Y. “Excellence - Methodology Assists, Discipline Delivers.” Proceedings of the 2012 TSP Symposium, St. Petersburg, Florida, September 2012. http://resources.sei.cmu.edu/library/asset-view.cfm?assetID=298076
[Rombach 2008] Rombach, Dieter; Münch, Jürgen; Ocampo, Alexis; Humphrey, Watts S.; & Burton, Dan. “Teach-ing Disciplined Software Development.” Journal of Systems and Software 81, 5 (May 2008): 747–763. doi:10.1016/j.jss.2007.06.004
[Romo 2013] Romo, Lawrence G. “Selective Service System.” Annual Report to the Congress of the United States, 2013.
[Rubens 2014] Rubens, Paul. “7 Reasons Not to Use Open Source Software,” CIO (February 2014). http://www.cio.com/article/2378859/open-source-tools/7-reasons-not-to-use-open-source-soft-ware.html
CMU/SEI-2014-TN-026 | 42
[Seshagiri 2012] Seshagiri, Girish. “High Maturity Pays Off: It Is Hard to Believe Unless You Do It” Crosstalk 25, 1 (January/February 2012): 9-14. http://www.crosstalkonline.org/storage/issue-ar-chives/2012/201201/201201-Seshagiri.pdf
[Shin 2011] Shin, Yonghee & Williams, Laurie. “Can Traditional Fault Prediction Models Be Used for Vul-nerability Prediction?” Empirical Software Engineering 18 (December 2013): 25–59. doi:10.1007/s10664-011-9190-8
[Shull 2013] Shull, Forrest. “A Lifetime Guarantee.” IEEE Software 30, 6 (November 2013): 4-8. doi:10.1109/MS.2013.119
[Younis 2012] Younis, Awad A. & Malaiya, Yashwant K. “Relationship Between Attack Surface and Vulnera-bility Density: A Case Study on Apache HTTP Server,” 197–203. Proceedings of the Interna-tional Conference on Internet Computing (ICOMP'12). Las Vegas, Nevada, July 2012. http://www.worldacademyofscience.org/worldcomp12/ws/conferences/icomp12

CMU/SEI-2014-TN-026 | 43
REPORT DOCUMENTATION PAGE Form Approved OMB No. 0704-0188
Public reporting burden for this collection of information is estimated to average 1 hour per response, including the time for reviewing instructions, search-ing existing data sources, gathering and maintaining the data needed, and completing and reviewing the collection of information. Send comments regard-ing this burden estimate or any other aspect of this collection of information, including suggestions for reducing this burden, to Washington Headquarters Services, Directorate for information Operations and Reports, 1215 Jefferson Davis Highway, Suite 1204, Arlington, VA 22202-4302, and to the Office of Management and Budget, Paperwork Reduction Project (0704-0188), Washington, DC 20503.
1. AGENCY USE ONLY
(Leave Blank)
2. REPORT DATE
December 2014
3. REPORT TYPE AND DATES COVERED
Final
4. TITLE AND SUBTITLE
Predicting Software Assurance Using Quality and Reliability Measures
5. FUNDING NUMBERS
FA8721-05-C-0003
6. AUTHOR(S)
Carol Woody, Robert Ellison, & William Nichols
7. PERFORMING ORGANIZATION NAME(S) AND ADDRESS(ES)
Software Engineering Institute Carnegie Mellon University Pittsburgh, PA 15213
8. PERFORMING ORGANIZATION REPORT NUMBER
CMU/SEI-2014-TN-026
9. SPONSORING/MONITORING AGENCY NAME(S) AND ADDRESS(ES)
AFLCMC/PZE/Hanscom Enterprise Acquisition Division 20 Schilling Circle Building 1305 Hanscom AFB, MA 01731-2116
10. SPONSORING/MONITORING AGENCY REPORT NUMBER
n/a
11. SUPPLEMENTARY NOTES
12A DISTRIBUTION/AVAILABILITY STATEMENT
Unclassified/Unlimited, DTIC, NTIS
12B DISTRIBUTION CODE
13. ABSTRACT (MAXIMUM 200 WORDS)
Security vulnerabilities are defects that enable an external party to compromise a system. Our research indicates that improving software quality by reducing the number of errors also reduces the number of vulnerabilities and hence improves software security. Some portion of security vulnerabilities (maybe over half of them) are also quality defects. This report includes security analysis based on data the Software Engineering Institute (SEI) has collected over many years for 100 software development projects. Can quality defect models that predict qual-ity results be applied to security to predict security results? Simple defect models focus on an enumeration of development errors after they have occurred and do not relate directly to operational security vulnerabilities, except when the cause is quality related. This report discusses how a combination of software development and quality techniques can improve software security.
14. SUBJECT TERMS
Measurement, security, quality, software, software assurance
15. NUMBER OF PAGES
59
16. PRICE CODE
17. SECURITY CLASSIFICATION OF REPORT
Unclassified
18. SECURITY CLASSIFICATION OF THIS PAGE
Unclassified
19. SECURITY CLASSIFICATION OF ABSTRACT
Unclassified
20. LIMITATION OF ABSTRACT
UL NSN 7540-01-280-5500 Standard Form 298 (Rev. 2-89) Prescribed by ANSI Std. Z39-18
298-102