predicting social media performance metrics and evaluation ... · predicting social media...
TRANSCRIPT
Journal of Business Research xxx (2016) xxx–xxx
JBR-08853; No of Pages 11
Contents lists available at ScienceDirect
Journal of Business Research
Predicting social media performance metrics and evaluation of the impact on brandbuilding: A data mining approach
Sérgio Moro a,b,⁎, Paulo Rita a, Bernardo Vala c,1
a Business Research Unit, ISCTE–University Institute of Lisbon, Portugalb ALGORITMI Research Centre, University of Minho, Portugalc ISCTE Business School, ISCTE–University Institute of Lisbon, Portugal
⁎ Corresponding author at: Business Research Unit, ISCTLisbon, Portugal. Tel.: +351 21 790 30 24, +351 25 351 0
E-mail address: [email protected] (S. Moro).1 Tel.: +351 21 790 30 24
http://dx.doi.org/10.1016/j.jbusres.2016.02.0100148-2963/© 2016 Elsevier Inc. All rights reserved.
Please cite this article as: Moro, S., et al., Premining approach, Journal of Business Researc
a b s t r a c t
a r t i c l e i n f oArticle history:Received 29 September 2015Received in revised form 11 February 2016Accepted 15 February 2016Available online xxxx
This study presents a research approach using data mining for predicting the performance metrics of posts pub-lished in brands' Facebook pages. Twelve posts' performance metrics extracted from a cosmetic company's pageincluding 790 publications were modeled, with the two best results achieving a mean absolute percentage errorof around 27%. One of them, the “Lifetime Post Consumers” model, was assessed using sensitivity analysis tounderstand how each of the seven input features influenced it (category, page total likes, type, month, hour,weekday, paid). The type of content was considered the most relevant feature for the model, with a relevanceof 36%. A status post captures around twice the attention of the remaining three types (link, photo, video). Wehave drawn a decision process flow from the “Lifetime Post Consumers” model, which by complementing thesensitivity analysis information may be used to support manager's decisions on whether to publish a post.
© 2016 Elsevier Inc. All rights reserved.
Keywords:Social networksSocial mediaData miningKnowledge extractionSensitivity analysisBrand building
1. Introduction
The worldwide dissemination of social media was triggered by theexponential growth of Internet users, leading to a completely new envi-ronment for customers to exchange ideas and feedback about productsand services (Kaplan and Haenlein, 2010). According to Statista Dossier(2014), the number of social network users will increase from 0.97billion to 2.44 billion users in 2018, predicting an increase around300% in 8 years. Considering its rapid development, social media maybecome the most important media channel for brands to reach theirclients in the near future (Mangold & Faulds, 2009; Korschun and Du,2013).
Companies soon realized the potential of using Internet-based socialnetworks to influence customers, incorporating social media marketingcommunication in their strategies for leveraging their businesses.Measuring the impact of advertisement is an important issue to beincluded in a global social media strategy (Lariscy et al., 2009). Severalstudies focused on finding the relationships between online publica-tions on social networks and the impact of such publications measuredby users' interactions (e.g., Cvijikj et al., 2011). However, fewer studiesdevoted attention to research for implementing predictive systems
E–University Institute of Lisbon,3 09.
dicting social media performh (2016), http://dx.doi.org/10
that can effectively be used to predict the evolution of a post prior toits publication. A system able to predict the impact of individual pub-lished posts can provide a valuable advantage when deciding tocommunicate through social media, tailoring the promotion of productsand services. Advertisingmanagers couldmake judged decisions on thereceptiveness of the posts published, thus aligning strategies towardoptimizing the impact of posts, benefiting from the predictions made.Also, it has been shown that socialmedia publications are highly relatedto brand building (Edosomwan et al., 2011). Therefore, the predictivetool outlined in this paper could leverage managerial decisions to im-prove brand recognition.
Data mining provides an interesting approach for extracting predic-tive knowledge from raw data (Turban et al., 2011). Its application tosocial media has been studied, especially for evaluating market trendsfrom users' inputs (e.g., Trainor et al., 2014). However, most of the stud-ies focused on a reactive evaluation ofwhat users are saying through thenetwork, with an emphasis on gathering information from differentnetwork groups or even personal posts (e.g., Bianchi and Andrews,2015). We focused on predicting the impact of publishing individualposts on a social media network company's page. The impact is mea-sured through several available metrics related to customer visualiza-tions and interactions. The predictive knowledge found enables tosupport manager's decisions on whether to publish each post.
For validating the taken procedure, we addressed a worldwide cos-metics companywith a renowned brand, including 790 posts publishedby this company in the year of 2014 in its Facebook social network
ance metrics and evaluation of the impact on brand building: A data.1016/j.jbusres.2016.02.010
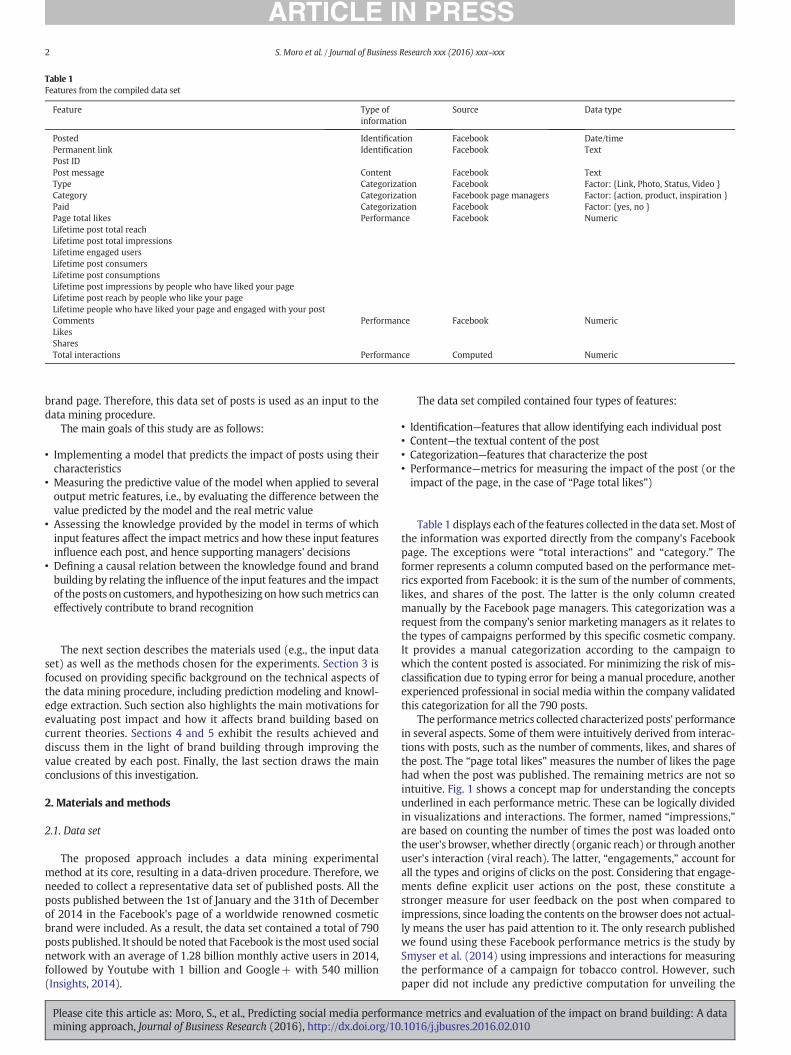
Table 1Features from the compiled data set
Feature Type ofinformation
Source Data type
Posted Identification Facebook Date/timePermanent link Identification Facebook TextPost IDPost message Content Facebook TextType Categorization Facebook Factor: {Link, Photo, Status, Video }Category Categorization Facebook page managers Factor: {action, product, inspiration }Paid Categorization Facebook Factor: {yes, no }Page total likes Performance Facebook NumericLifetime post total reachLifetime post total impressionsLifetime engaged usersLifetime post consumersLifetime post consumptionsLifetime post impressions by people who have liked your pageLifetime post reach by people who like your pageLifetime people who have liked your page and engaged with your postComments Performance Facebook NumericLikesSharesTotal interactions Performance Computed Numeric
2 S. Moro et al. / Journal of Business Research xxx (2016) xxx–xxx
brand page. Therefore, this data set of posts is used as an input to thedata mining procedure.
The main goals of this study are as follows:
• Implementing a model that predicts the impact of posts using theircharacteristics
• Measuring the predictive value of the model when applied to severaloutput metric features, i.e., by evaluating the difference between thevalue predicted by the model and the real metric value
• Assessing the knowledge provided by the model in terms of whichinput features affect the impact metrics and how these input featuresinfluence each post, and hence supporting managers' decisions
• Defining a causal relation between the knowledge found and brandbuilding by relating the influence of the input features and the impactof the posts on customers, and hypothesizing on how suchmetrics caneffectively contribute to brand recognition
The next section describes the materials used (e.g., the input dataset) as well as the methods chosen for the experiments. Section 3 isfocused on providing specific background on the technical aspects ofthe data mining procedure, including prediction modeling and knowl-edge extraction. Such section also highlights the main motivations forevaluating post impact and how it affects brand building based oncurrent theories. Sections 4 and 5 exhibit the results achieved anddiscuss them in the light of brand building through improving thevalue created by each post. Finally, the last section draws the mainconclusions of this investigation.
2. Materials and methods
2.1. Data set
The proposed approach includes a data mining experimentalmethod at its core, resulting in a data-driven procedure. Therefore, weneeded to collect a representative data set of published posts. All theposts published between the 1st of January and the 31th of Decemberof 2014 in the Facebook's page of a worldwide renowned cosmeticbrand were included. As a result, the data set contained a total of 790posts published. It should be noted that Facebook is themost used socialnetwork with an average of 1.28 billion monthly active users in 2014,followed by Youtube with 1 billion and Google+ with 540 million(Insights, 2014).
Please cite this article as: Moro, S., et al., Predicting social media performmining approach, Journal of Business Research (2016), http://dx.doi.org/10
The data set compiled contained four types of features:
• Identification—features that allow identifying each individual post• Content—the textual content of the post• Categorization—features that characterize the post• Performance—metrics for measuring the impact of the post (or theimpact of the page, in the case of “Page total likes”)
Table 1 displays each of the features collected in the data set. Most ofthe information was exported directly from the company's Facebookpage. The exceptions were “total interactions” and “category.” Theformer represents a column computed based on the performance met-rics exported from Facebook: it is the sum of the number of comments,likes, and shares of the post. The latter is the only column createdmanually by the Facebook page managers. This categorization was arequest from the company's senior marketing managers as it relates tothe types of campaigns performed by this specific cosmetic company.It provides a manual categorization according to the campaign towhich the content posted is associated. For minimizing the risk of mis-classification due to typing error for being a manual procedure, anotherexperienced professional in social media within the company validatedthis categorization for all the 790 posts.
The performancemetrics collected characterized posts' performancein several aspects. Some of them were intuitively derived from interac-tions with posts, such as the number of comments, likes, and shares ofthe post. The “page total likes” measures the number of likes the pagehad when the post was published. The remaining metrics are not sointuitive. Fig. 1 shows a concept map for understanding the conceptsunderlined in each performance metric. These can be logically dividedin visualizations and interactions. The former, named “impressions,”are based on counting the number of times the post was loaded ontothe user's browser, whether directly (organic reach) or through anotheruser's interaction (viral reach). The latter, “engagements,” account forall the types and origins of clicks on the post. Considering that engage-ments define explicit user actions on the post, these constitute astronger measure for user feedback on the post when compared toimpressions, since loading the contents on the browser does not actual-ly means the user has paid attention to it. The only research publishedwe found using these Facebook performance metrics is the study bySmyser et al. (2014) using impressions and interactions for measuringthe performance of a campaign for tobacco control. However, suchpaper did not include any predictive computation for unveiling the
ance metrics and evaluation of the impact on brand building: A data.1016/j.jbusres.2016.02.010
Posts loaded in
users’ browsers
Source
Clicks on posts
Type
Organic reach
Viral reach
Likes
Comments
Shares
Replies to other comments
Views of images or videos
Other interactions (e.g., likes on
comments, clicks on commenters’ names)
Impressions
Concept
Reaches
Engagements
Consumptions
Users
Consumers
Engaged users
Visualizations
Interactions
Fig. 1. Conceptual map on Facebook's performance metrics.More detailed information can be obtained from:
https://developers.facebook.com/docs/graph-api/reference/v2.5/insightshttp://www.agorapulse.com/blog/facebook-post-consumers-and-post-consumption
3S. Moro et al. / Journal of Business Research xxx (2016) xxx–xxx
performance of posts. While each concept accounts for every visualiza-tion or interaction, Facebook alsomakes available metrics on a per-userbasis, taking into account that each user may visualize or interact morethan once per post.
Table 2List of output features to be modeled
Feature Descriptiona
Lifetime post total reachThe number of people who saw a page post(unique users).
Lifetime post total impressions
Impressions are the number of times a postfrom a page is displayed, whether the post isclicked or not. People may see multipleimpressions of the same post. For example,someone might see a Page update in NewsFeed once, and then a second time if a friendshares it.
Lifetime engaged usersThe number of people who clicked anywherein a post (unique users).
Lifetime post consumersThe number of people who clicked anywherein a post.
Lifetime post consumptions The number of clicks anywhere in a post.Lifetime post impressions bypeople who have liked a page
Total number of impressions just from peoplewho have liked a page.
Lifetime post reach by peoplewho like a page
The number of people who saw a page postbecause they have liked that page (uniqueusers).
Lifetime people who have liked apage and engaged with a post
The number of people who have liked a Pageand clicked anywhere in a post (Uniqueusers).
Comments Number of comments on the publication.Likes Number of “Likes” on the publication.Shares Number of times the publication was shared.
Total interactionsThe sum of “likes,” “comments,” and “shares”of the post.
a Descriptions extracted from:
• http://www.agorapulse.com/blog/facebook-reach-metrics-ultimate-guide• https://www.facebook.com/help/274400362581037
2.2. Data mining
A data mining approach typically includes phases such as dataunderstanding, data preparation, modeling, and evaluation (Han et al.,2011). The data set described in Table 1 includes twelve features (elev-en exported from Facebook plus the computed total interactions) thatmay be used to measure posts' performance. Thus, any of the featurescan be used as an output to predict. It should be stressed that the“Page total likes” feature is not linked to any post, but instead to thepage's performance. Hence, by considering it may affect the impact ofpublishing each post, we included it as an input feature. Therefore, theprocedure included modeling each of those twelve features related topost's performance for assessing which ones could be better predicted.The meaning of each of those features is detailed in Table 2, based onthe concepts illustrated in Fig. 1.
The seven remaining features are known prior to the post publica-tion and can be used as an input. However, two of them are uniqueper post: the permanent link and the post ID. Thus, such features areof no value to modeling, considering that these do not represent anytype of relationship between posts. Also, the post message itself isunique per post. Nevertheless, it may potentially conceal valuableknowledge in the unstructured textual message. However, one wouldneed to include a text mining procedure in this approach for unveilingsuch knowledge, which was out-of-scope for the present study (it issuggested as future research in Section 5). One could also argue thatthe posted date is unique per post. Nevertheless, a few characteristicsmay be extracted from the date: the month, the weekday, and the
Please cite this article as: Moro, S., et al., Predicting social media performmining approach, Journal of Business Research (2016), http://dx.doi.org/10
hour. Adding these three computed features to the remaining four(excluding the posted date–time value since it is distinct for each post,the permanent link, the post ID, and the post message) provides a
ance metrics and evaluation of the impact on brand building: A data.1016/j.jbusres.2016.02.010

Table 4Studies on social media impact on branding
Reference Materials Problem addressed
Smyser et al. (2014) Facebook's metrics Tobacco control campaignJansen et al. (2009) Tweets (from
Twitter)Brand sentiment analysis on 5brands (Banana Republic,SMART For-Two, Wii Fit, Google,and Forever Stamp)
Shen and Bissell (2013) Facebook's likes andcomments
Branding on six cosmeticcompanies
Table 3List of input features used for modeling
Feature Description
CategoryManual content characterization: action (special offers andcontests), product (direct advertisement, explicit brand content),and inspiration (non-explicit brand related content).
Page total likes Number of people who have liked the company's page.Type Type of content (Link, Photo, Status, Video).
Post monthMonth the post was published (January, February, March, …,December).
Post hour Hour the post was published (0, 1, 2, 3, 4, …, 23).
Post weekdayWeekday the post was published (Sunday, Monday, …,Saturday).
Paid If the company paid to Facebook for advertising (yes, no).
4 S. Moro et al. / Journal of Business Research xxx (2016) xxx–xxx
data set with seven distinct input features for feeding the model(Table 3).
Fig. 2 exhibits the data mining procedure undertaken forimplementing the model, for validating the results, and for extractinguseful knowledge for leveraging post publications decisions. Suchprocedure was executed twelve times, for evaluating the predictiveperformance of every output feature available. First, the data mining al-gorithm chosen was fed with the seven input features from Table 3,resulting in a model. Such model was then tested to obtain the valuespredicted for the output performancemetric of the post. The differencesbetween the real performance metrics and the predicted values werecompared to assess model performance. The performance metric thatcould better be modeled, i.e., in which the model predictions showedless differences to the real values, was then assessed to understandhow input features influenced this performance metric. In Section 3.2,further details are provided on the specific data mining techniqueemployed.
3. Theory
3.1. Social media impact on brand building
Laroche et al. (2012) demonstrated the effects of brand communitiesestablished in social media platforms on the underlying elements andpractices in communities as well as on brand trust and brand loyalty.According to Deloitte Digital (2015), based on a survey of over 3000US consumers, digital interactions are expected to influence 64 centsof every dollar spent in retail stores by the end of 2015, up from 14cents in 2012, meaning that social media is increasing its direct impacton companies' revenues. The creation of virtual customer environmentsmay be triggered by social media networks such as Twitter andFacebook, providing an emergent interest around specific firms, brands,and products. Therefore, in order to create business value, organizations
Input features
Data Mining
Model
Knowledge extraction:- what are the input features that influence more the output?- how these input features affect the output?
Fig. 2. Data minin
Please cite this article as: Moro, S., et al., Predicting social media performmining approach, Journal of Business Research (2016), http://dx.doi.org/10
need to incorporate community building as part of the implementationof social media (Culnan et al., 2010). Brand communities established onsocial media enhance feelings of community amongmembers and con-tribute to creating value for both members and companies (Larocheet al., 2012).
Several empirical studies were published in the last few years forassessing the impact of social media on brand building. Hudson et al.(2015) conducted three surveys to explore the relationship betweensocial media usage and customer–brand relationships. Their resultsshowed that engaging customers via social media was associated withhigher consumer–brand relationships. The study by Hutter et al.(2013) was focused on the case of the MINI car brand through a surveypublished in MINI's Facebook page for assessing impact on brandawareness and purchase intentions. The conclusions supported previ-ous research insights in that social media content influences theeconomic outcome of brands. Another empirical paper evaluated theimpact of social media adoption on a small-scale UK-based company,concluding that social media advertising had a positive effect on brandimage (Griffiths and McLean, 2015). Generically, the literature seemsto support an existing influence of social media on brand building.Nevertheless, research in this domain is still scarce. Adding up to thenovelty and interest of social media, research is expected to flourish inthe next few years, hopefully unveiling novel studies for filling thisresearch gap (Okazaki and Taylor, 2013).
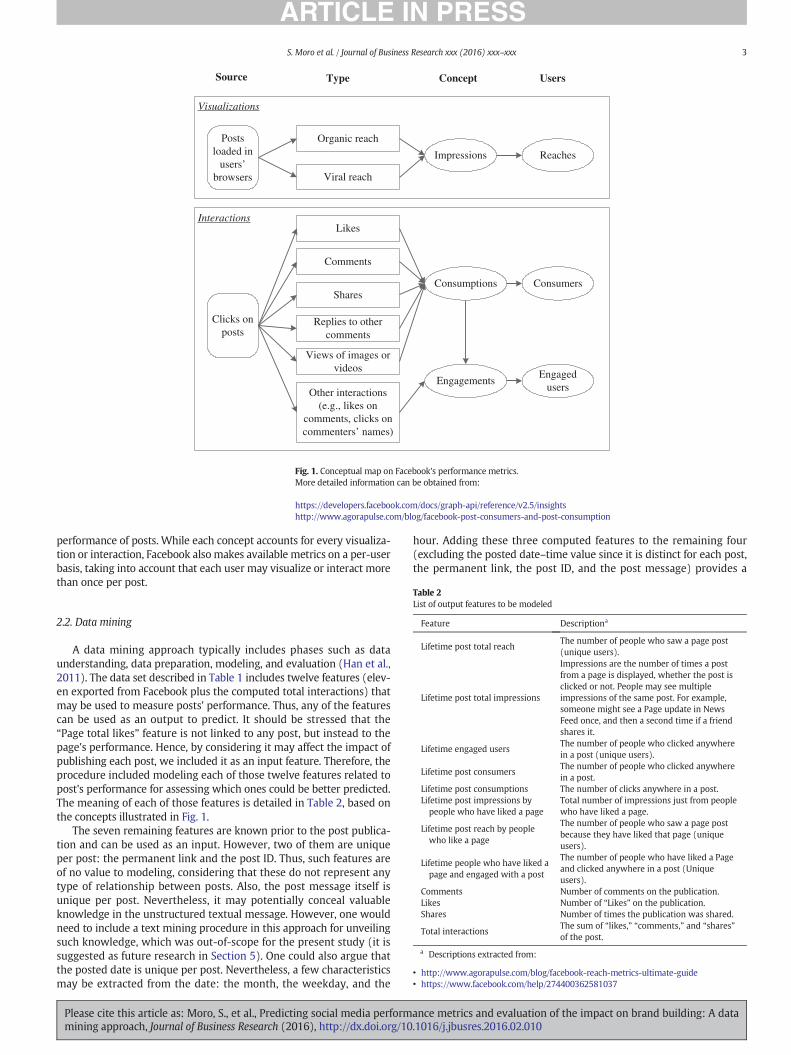
Most of the empirical research found in the literature and citedabove adopted survey studies. While survey studies are a valuablemethod for obtaining data, we were more interested in articles thatpassively collected relevant information from social media networksand used it for empirical research. Such method is better aligned withour focus on using performance metrics for assessing the impact onbrand building. We selected three distinctive studies using differentsocial media metrics (detailed in Table 4), including the only one wefound using Facebook's performance metrics, for drawing a model in astructure adapted from a concept map format (Kinchin et al., 2000)that summarizes the impact on brand building (Fig. 3). Such modelhas four layers: the source metrics' types, the data effectively used forthe experiments, the references, and the branding effect levels. For
Real values of the output
feature
Predictions of the output
feature
Differences
Measurement of the quality of the predictions
g procedure.
ance metrics and evaluation of the impact on brand building: A data.1016/j.jbusres.2016.02.010
Brand awareness
Visualizations Interactions
Brand popularity
Purchase intention
(Smyser et al., 2014)
(Jansen et al., 2009)
Engagement ratio = Users who interacted / Users
who viewed
BrandLoyalty
Tweets
BrandSatisfaction
BrandAttachment
(Shen & Bissell, 2013)
Likes & comments
Source metrics
Data used
References
Branding effect
Cognitive stage Affective stage Conative stage
Fig. 3. Social media impact on branding.
5S. Moro et al. / Journal of Business Research xxx (2016) xxx–xxx
defining the branding stages, we adapted themodel described by Smithet al. (2008). Visualizationmetrics appear to be closer related to the cog-nitive stage, influencing awareness, while interactions affect all brand-ing stages.
While engagement in social media has been shown to influenceevery stages of branding, other types of relationships should be alsoaccounted for. Habibi et al. (2014) defined amodel for brand communi-ties based on social media which included five relationships thataffected brand trust: customer–product, customer–brand, customer–company, customer–other customers, and brand community engage-ment. Their results supported that brand community engagementamplifies the impacts of customers' relationships with both the brandand the product. Therefore, while numerous aspects may influencebrand building, literature supports that engagement also plays asignificant role. Thus, a predictive system that anticipates posts' engage-ment in social media can provide a valuable tool to support managers'decisions on publishing posts.
Data mining has the potential for discovering valuable trends andinsights concealed in social networks (Gupta et al., 2014). The
Fig. 4. Support vector machines.
Please cite this article as: Moro, S., et al., Predicting social media performmining approach, Journal of Business Research (2016), http://dx.doi.org/10
interactions between customers about a brand in online social networksare powerful mindset enablers that can have a huge impact in brandbuilding (Gensler et al., 2015). By using the predictive potential ofdata mining to understand how each of the posts published about acertain brand acts as an enabler of brand building in its different stages(Fig. 3), socialmediamanagers couldmake solid-grounded decisions onwhether to publish a certain post. Such premise is themain driver of thecurrent research.
3.2. Data mining
Data mining enables to identify coherent patterns of informationfrom where to extract useful knowledge (Turban et al., 2011). Its rootsinclude both traditional statistical analysis and artificial intelligence/machine learning sciences, aiming to benefit from both. We adopteddata mining for modeling the twelve numeric metrics related to theperformance of posts published in a social network, enumerated inTable 1. Since the algorithm tries to fit the input data tomodel a numericvariable, it makes this a regression problem.
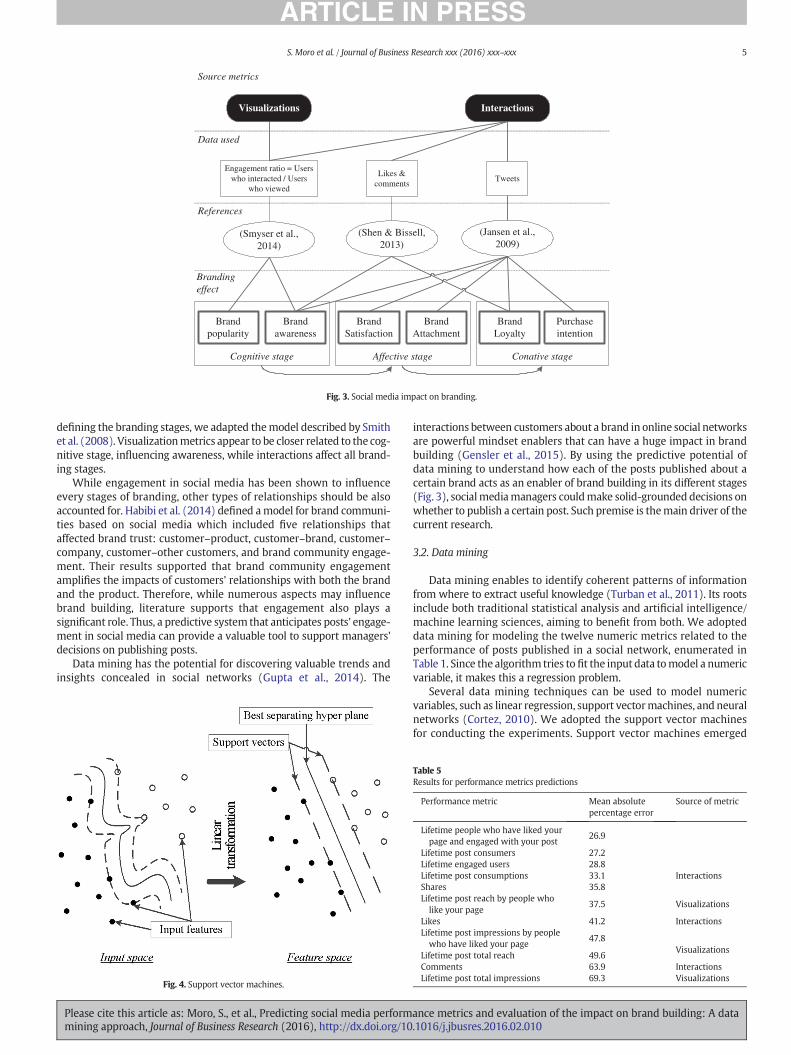
Several data mining techniques can be used to model numericvariables, such as linear regression, support vectormachines, and neuralnetworks (Cortez, 2010). We adopted the support vector machinesfor conducting the experiments. Support vector machines emerged
Table 5Results for performance metrics predictions
Performance metric Mean absolutepercentage error
Source of metric
Lifetime people who have liked yourpage and engaged with your post
26.9
Interactions
Lifetime post consumers 27.2Lifetime engaged users 28.8Lifetime post consumptions 33.1Shares 35.8Lifetime post reach by people wholike your page
37.5 Visualizations
Likes 41.2 InteractionsLifetime post impressions by peoplewho have liked your page
47.8Visualizations
Lifetime post total reach 49.6Comments 63.9 InteractionsLifetime post total impressions 69.3 Visualizations
ance metrics and evaluation of the impact on brand building: A data.1016/j.jbusres.2016.02.010

Manager
How will socialmediacommunicationaffect brandbuilding? Product
Brand
Company
Othercustomers
Customerrelationships
Baseline: no knowledge
Brand communityengagement
Predictive approachproposed: mean absolute
percentage error of27.2%
No insights onsocial mediaengagement
Perception of theengagement
contribution tobrand trust
Fig. 5. Application of the model for “Lifetime Post Consumers” (adapted from Habibi et al., 2014).
6 S. Moro et al. / Journal of Business Research xxx (2016) xxx–xxx
in the nineties to become one of the most widespread advancedmachine learning techniques. Support vector machine transforms theinput x ∈ ℜM space into a high m-dimensional feature space byusing a nonlinearmapping that depends on a kernel. Then the algorithmfinds the best linear separating hyper plane, related to a set of supportvector points, which define the support vectors in the feature space,as shown in Fig. 4 (Steinwart and Christmann, 2008). For theexperiments, the popular Gaussian kernel was chosen, which has theadvantage of having less parameters than other kernel functions(Hastie et al., 2005).
The support vector machine provides a high accuracy performancemodel, although it has the disadvantage of being difficult to understandby humans, in contrast to traditional methods such as linear regressionor decision trees, fromwhich the rules comprising these can be directlyread. A sensitivity analysis has proved to be an effective method forextracting useful knowledge from black boxmodels such as the supportvectormachines (Cortez and Embrechts, 2013). Suchmethod consists inassessing model sensitivity to changes in the inputs by evaluating howthe output predicted value changes when varying the input featuresthrough their range of values. Moreover, the data-based sensitivityanalysis was proposed by Cortez and Embrechts (2013) and selectsa sample from the input data used to train the model for assessingmodel sensitivity to several inputs' variations at the same time.This method has been extensively used in several distinct domains(e.g., Moro et al., 2015). All the experiments described in this articlewere conducted using the R statistical tool.
4. Experiments and results
4.1. Prediction
As stated in Section 2, we used the seven input features from Table 3to predict each of the twelve performance metric features described inTable 2. In order to prepare the 790 rows containing the informationabout the posts published on this cosmetics company's Facebook page,outliers were analyzed for each of the performance features. Weadopted the Shapiro–Wilk test to assess if each of the output columnsfor the features to be predicted followed a normal distribution (Razaliand Wah, 2011). Such a validation provided the ground needed todiscard the 5% posts fromwhich the performancemetric value deviatedthe most, leaving 751 of the posts for building the model.
Table 6Posts information and model evaluation for “Lifetime Post Consumers”
Category Page total likes Type Month Hour Week
Product 139,441 Photo Dec 3 ThuAction 136,642 Photo Oct 13 SatInspiration 135,617 Photo Sep 10 FriProduct 139,441 Status Dec 3 Sat
Please cite this article as: Moro, S., et al., Predicting social media performmining approach, Journal of Business Research (2016), http://dx.doi.org/10
After generating the model for each of the twelve performancemetrics, we evaluated the results by comparing the real value for thatmetric with the value predicted by the model. A good model impliesfitting all the input data in a way that the predicted values are as closeas possible to the real values. Hence, we first computed the absolute dif-ference between the predicted values and the real values for each post.We also computed the difference in percentage to assess the relativedeviation of the predictions. Finally, we calculated the mean absolutepercentage error for each model, which is a metric widely used to eval-uate regression model's performance based on the relative difference(Hyndman and Koehler, 2006). The results are shown in Table 5.
Table 5 indicates also which are the source types for the metrics,as described in Fig. 1: visualization metrics or interaction metrics(grayed rows). The results show that the models built for predictinginteraction-based metrics were more accurate than for visualizations.Nevertheless, the specific Facebook interactions, shares, likes, and com-ments, were predicted with a larger difference when compared to theFacebook report interaction metrics, which ranked in the top four bestpredicted metrics. However, comments were by far poorly predicted.Such result may be derived from the fact that comments may holdeither a positive or a negative connotation, which has been a subjectof several studies (e.g., Ballantine et al., 2015). Thus, for evaluating com-ments, one would need to consider the textual message contained ineach comment.
Visualization metrics were more difficult to model, according toTable 5. The visualization-based performance metric that achieved thebest result was the “Lifetime Post reach by people who like a Page”,with 37.5%, more than 10% of difference to the best interaction-basedmetrics. Nevertheless, it concealed an interaction with the page sinceit considered only users who liked the page. Likewise, the second bestpredicted visualization-based metric also considered only users wholiked the page. The two purely visualization-based metrics were poorlypredicted. Such result may be derived that visualizations are more sub-jected to randomness since any user may get the post contents loadedonto its browser for numerous reasons. It would be interesting in afuture study to consider feature enrichment strategies for improvingthe accuracy in predicting visualizations, as the viral reach is becomingmore relevant in brand awareness (Moro et al., 2016).
Both the models for the “Lifetime People who have liked a Pageand engaged with a post” and the “Lifetime Post Consumers” featuresachieved an average difference of around 27% to the real values (with26.9% for the former and 27.2% for the latter features). Such results
day Paid Real Predicted Absolutedifference
% difference
No 134 228 94 70%No 356 346 10 3%No 614 520 94 15%No 1407 1502 95 7%
ance metrics and evaluation of the impact on brand building: A data.1016/j.jbusres.2016.02.010

400
500
600
700
800
900
1000
80,000 100,000 120,000 140,000
Life
time
Post
Con
sum
ers
Page total likes
Fig. 8. Influence of “Page total likes” on “Lifetime Post Consumers.”
Category10%
Page total likes17%
Type36%
Month15%
Hour8%
Weekday7% Paid
7%
Relative relevance of features to model "Lifetime Post Consumers"(in percentage)
Fig. 6. Relevance of the input features for “Lifetime Post Consumers.”
7S. Moro et al. / Journal of Business Research xxx (2016) xxx–xxx
mean that one can know prior to post publication the results on thesetwo metrics with an error of around 27%. Hence, managers can decideto use both models for having a perception on the impact a given postmay have. Although the models still hold a difference of 27%, theseprovide a better judged decision than not having an educated guess atall. Considering the theoretical analysis on Section 3.1, these modelsmay be useful for assessing social media user engagement, which influ-ences brand trust (Habibi et al., 2014). Also, the conceptual modelshown in Fig. 3 references that interaction in social media affects allbranding stages.
For a deeper model analysis, there was a focus on the “Lifetime PostConsumers” performance metric. It achieved 27.2% of mean absolutepercentage error, slightly higher than “Lifetime People who liked aPage and engaged with a post” (26.9%). However, the latter perfor-mance metric is dependent on users liking the page. Therefore, theanalysis will focus on the “Lifetime Post Consumers.” Fig. 5 exemplifieshow the predictive approach proposed could help answeringmanager'squestion of obtaining insights about the impact that social mediacommunication will have on brand building prior to post publication.
Table 6 shows four randomly selected examples of the informationfor four of the posts used to feed the model at the seven left columns,while “Real” provides the “Lifetime Post Consumers” real value. Thethree last columns are used to validate the model: “Predicted” showsthe value predicted by the model, “Absolute difference” shows theabsolute difference to the real value while the last column shows thepercentage difference.
The examples provided in Table 6 for “Lifetime Post Consumers”illustrate how a manager can understand the impact of the posts: thetwo bottom rows even though showing a difference around a hundredin terms of absolute values can provide a glimpse of the order of magni-tude of the real values. Furthermore, it should be stressed that such re-sult is achieved by only using seven input features, with three of thembeing related to the date and time the post was published (“Month,”
518.14593.78
1299.76
776.22
0
200
400
600
800
1000
1200
1400
Link Photo Status Video
Lif
etim
e P
ost
Con
sum
ers
Fig. 7. Influence of “Type” on “Lifetime Post Consumers.”
Please cite this article as: Moro, S., et al., Predicting social media performmining approach, Journal of Business Research (2016), http://dx.doi.org/10
“Weekday,” and “Hour”), three directly obtained from Facebook(“Type,” “Page total likes,” and “Paid”) and only one fed by the page con-tent manager (“Category”). Usually, content managers have a richer setof features for characterizing each of the contents they are publishing(e.g., specificities about a product being advertised, if the product or ser-vice has any associated promotion). Enriching the data set with suchfeatures may result in an increase in model's accuracy (Moro et al.,2016).
4.2. Knowledge extraction
In Section 4.1, two models for two distinctive performance metricsachieved an average difference of around 27% to the real values, namely,the “Lifetime People who have liked a Page and engaged with a post”and the “Lifetime Post Consumers.” The “Lifetime Post Consumers”provided a more interesting metric for the decision of publishing thepost, as it focused solely on the impact of the post, while the “LifetimePeople who have liked a Page and engaged with a post” contained aninner relation to liking thepage besides interactingwith thepost. There-fore, the “Lifetime Post Consumers” was chosen for analysis.
For extracting knowledge from the “Lifetime Post Consumers”implemented model, a data-based sensitivity analysis was performedvia two complementary approaches: first, the model was assessed tounderstand which of the input features affected more the outcome ofthe studied metric; second, all input features from the most to theleast relevant for the model were assessed to discern how each ofthem influenced the outcome.
Fig. 6 shows the contribution of each input feature for the model of“Lifetime Post Consumers.” The relevance of the “Type” of contentpublished was remarkable since it accounted for 36% of relevance tothe model. This finding is aligned with the results reported by Cvijikjet al. (2011), which analyzed fourteen sponsored brand pages usingstatistical analysis for assessing the correlation between “Type” andthe number of likes and comments. First, building a predictive modelwith several features is more complex than just finding correlationbetween two variables since the machine learning technique needs to
728.18
884.30
459.10
624.59 646.11
915.67 882.42
684.04
788.84
703.40
620.19 630.67
0
100
200
300
400
500
600
700
800
900
1000
Jan Feb Mar Apr May Jun Jul Aug Sep Oct Nov Dec
Lif
etim
e P
ost
Con
sum
ers
Fig. 9. Influence of “Month” on “Lifetime Post Consumers.”
ance metrics and evaluation of the impact on brand building: A data.1016/j.jbusres.2016.02.010
652.11
752.82
600620640660680700720740760780
No Yes
Lif
etim
e P
ost
Con
sum
ers
Fig. 12. Influence of “Paid” on “Lifetime Post Consumers.”
674.
0870
9.07
691.
5267
2.77
646.
8878
2.22
663.
0168
7.47
611.
4063
6.14
748.
8561
9.96 71
9.47
697.
45 792.
9767
7.38
689.
0868
1.55
607.
6458
8.41
731.
3767
5.01
689.
0873
6.46
0
100
200
300
400
500
600
700
800
900
0 1 2 3 4 5 6 7 8 9 10 11 12 13 14 15 16 17 18 19 20 21 22 23
Lif
teti
me
Pos
t C
onsu
mer
s
Fig. 10. Influence of “Hour” on “Lifetime Post Consumers.”
8 S. Moro et al. / Journal of Business Research xxx (2016) xxx–xxx
find the best fit possible for all features. Also, the Pearson correlationsfound by Cvijikj et al. (2011) were weak (r = 0.11) to moderate (r =0.62); thus, no strong relationship was found for likes and comments(Rumsey, 2011). This weak to moderate correlation may be reflectedin the 36% relative relevance of type for the “Lifetime Post Consumers”model. Nevertheless, more studies on different data would be neededto confirm such hypothesis. The “Page total likes” and the “Month” thepost was published appear in the second and third positions with 17%and 15% of relevance, respectively. The fact that the “Month” has 15%of relevance suggests seasonality which could be associated with thetype of industry of this particular company. It should be stressed thatthe three most relevant features accounted for almost 70% of therelevance to the model. For comparison, we performed a similaranalysis (see Figs. 6 and 15 in the Appendix) to the model obtainedfor “Lifetime People who liked a Page and engaged with a post”. Whilethe order of the features for relevance does not change much, therelative relevance has some variations which are discussed on theAppendix.
The “Category” set by the Page manager had 10% of relevance. Thisresult showed a weak relative relevance, especially when compared tothe study of Cvijikj et al. (2011), in which a weak to moderate correla-tion was found between category and likes/comments. However, postcategorization is dependent on the company's strategy. Furthermore,such research used data from fourteen sponsored brand and consumergoods pages, with a specific categorization assigned manually (sevencategories: information, designed question, statements, advertisements,competitions, questionnaires, and announcements). Therefore, theresults cannot be directly compared. The “Hour” and the “Weekday”the post was published account for just 8% and 7% of relevance, respec-tively. Cvijikj et al. (2011) found no correlation between weekday andlikes/comments in their study. This is a subject that should demand
737.58
631.02619.89
560
580
600
620
640
660
680
700
720
740
760
Action Inspiration Product
Life
time
Post
Con
sum
ers
Fig. 11. Influence of “Category” on “Lifetime Post Consumers.”
Please cite this article as: Moro, S., et al., Predicting social media performmining approach, Journal of Business Research (2016), http://dx.doi.org/10
more research, considering that people aremore available in weekends,thus intuitively one would expect to see more engagement on thesedays. Finally, the feature that indicates the company paid for the pageto be specifically advertised appears with just 7% of relevance, thesame of weekdays. This is an interesting result and suggests that payingfor the specific post to boost the reachability does not compensate asmany as focusing on publishing on the right month, for example.
After understanding the importance of the content “Type” to theimpact of the post as translated by “Lifetime Post Consumers”measuredfrom the model, it was intended to observe how each of the possibletypes influenced this output metric. Fig. 7 illustrates this influence andshows that “Status” posts have clearly the largest impact on the perfor-mance of the post, more than twice the values for “Photo” and “Link,”and 60% more than “Video.” This result is aligned with the findings ofCvijikj et al. (2011), which found that “Status” posts caused the greatestnumber of comments, “Videos” caused the most likes, while “Photos”and “Links” had the least number of interactions. Moreover, the studypublished by Kwok and Yu (2013), while achieving a similar conclusionfor “Status” posts, came to a different conclusion for “Photos,” statingthat these receivedmore likes and comments than “Links” and “Videos.”However, while Cvijikj et al. (2011) analyzed fourteen sponsored brandpages selected from Fan Page web page, which ranks the Facebookpages, Kwok and Yu (2013) focused specifically on restaurant pages,making their case more specific than the former cited study.
The second most relevant features, “Page total likes,” is by far lessrelevant than “Type,” although still showing an influence of 17%. Thisinput feature relates to the likes the company's page where the post isbeing published had at the moment of publishing the post. Fig. 8
672.47
706.45
676.71664.40
651.89
746.96
647.20
580
600
620
640
660
680
700
720
740
760
Sun Mon Tue Wed Thu Fri Sat
Life
time
Post
Con
sum
ers
Fig. 13. Influence of “Weekday” on “Lifetime Post Consumers.”
ance metrics and evaluation of the impact on brand building: A data.1016/j.jbusres.2016.02.010
Managerpublishes
a post
Type?
Month?Status
1,768Feb, Apr, Jun, Jul, Sep, Oct
1,280Jan, Mar, May, Aug, Nov, Dec
Month?
Link,Photo,Video
Month?
Page totallikes?
Jan, Feb, Apr,Jun, Jul
Mar, May,Aug, Sep, Oct,
Nov, Dec
Category?Feb
Type?
Jan, Apr,Jun, Jul
1,324
1,000
Action
Product,Inspiration
[693, 1,031]
437
Photo, Video
Link
519
341
< 135,700
≥ 135,700
Fig. 14. Rules extracted from the support vector machine model.
9S. Moro et al. / Journal of Business Research xxx (2016) xxx–xxx
shows that “Lifetime Post Consumers” decreased after reaching a peakof around 95,000 page likes. Page likes usually increase overtime asbrand satisfaction is translated into social media interaction with thecompany's page. However, unsatisfied users may explicitly press thedislike button, removing the like previously counted. Such actionsdirectly affect page total likes. As page total likes increases overtime,more users are receiving feedback on the posts published in the pagethey previously liked. However, an observation of Fig. 8 reveals that,while page likes increased, post consumers were expected to decrease,i.e., users are not so keen to engage with posts being published. Suchissue may disclose some erosion of the company's Facebook page,since users are seeing the contents published, but are not interactingwith it.
The “Month” is the third most relevant feature, with 15% of influ-ence. Fig. 9 displays some seasonality, with a large increase starting inApril and reaching a peak in June of almost twice the value of April.From November to February there is also a steady although not so
Category8%
Page total likes20%
Type40%
Month12%
Hour8%
Weekday7% Paid
5% Relative relevance of features to model "Lifetime People whohave liked a Page and engaged with a post"(in percentage)
Fig. 15. Relevance of input features to themodel of “Lifetime People whohave liked a Pageand engaged with a post”.
Please cite this article as: Moro, S., et al., Predicting social media performmining approach, Journal of Business Research (2016), http://dx.doi.org/10
steep increase. Golder et al. (2007) analyzed a data set of messagessent through Facebook between February 2004 and March 2006, aperiod of 26 months, also identifying a large increase betweenMarch and June, while another increase appears between Septemberand January, in a time frame displaced by one/two months in relationto the November–February increase observed in Fig. 9. The resultsare not directly comparable due to different contexts, namely, thementioned study used private messages, it focused on an academiccommunity, and it considered the period when Facebook was in its in-fancy. Nevertheless, Golder et al. (2007) also found a seasonality effectin an early stage of Facebook, aligned with current findings in a moremature stage of the same social network.
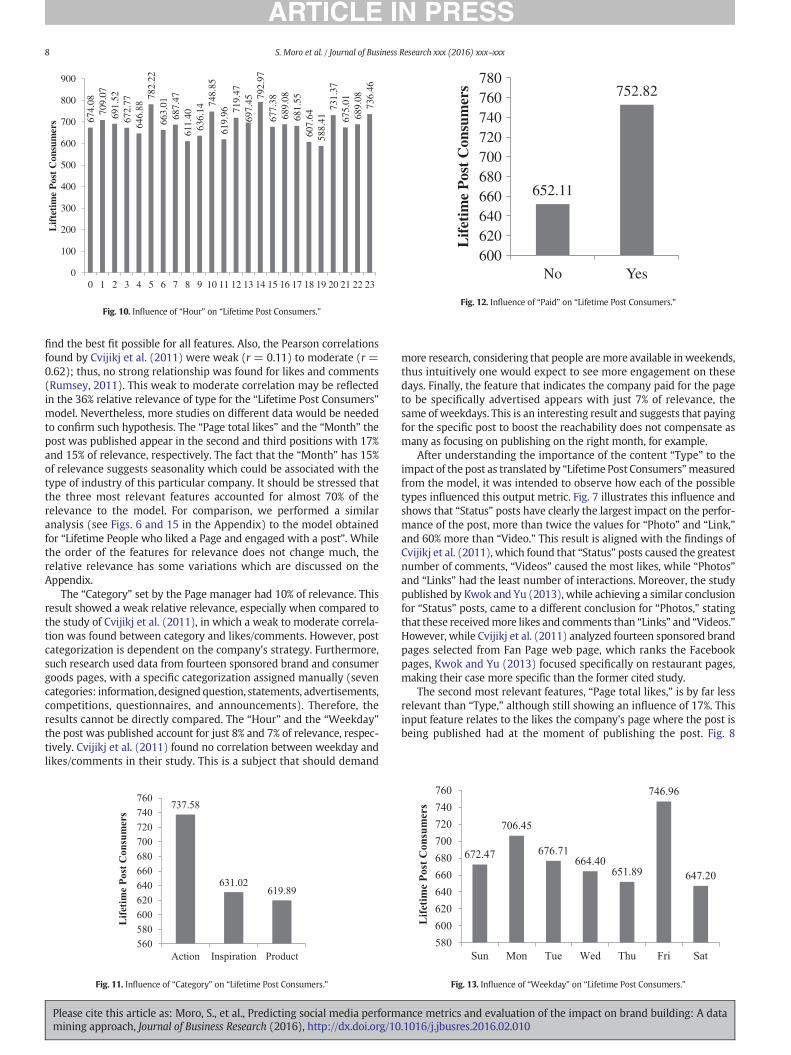
The influence of the remaining four least relevant features whichconceal 32% of the model's knowledge is displayed in Fig. 10 for“Hour,” Fig. 11 for the “Category,” Fig. 12 for “Paid,” and finally Fig. 13for “Weekday.” Regarding “Category,” it is remarkable the influencethat “Action” had when compared to the remaining two features. This“Actions” category stands for special offers and contests, clearly gather-ing more attention than “Products” and non-explicit brand relatedcontents (“Inspiration”). Campaigns have proven to be a valuableasset for brand awareness (Hanna et al., 2011). The company's Facebookpage managers may use this type of “Actions” for increasing socialmedia engagement, thus contributing to an increase in brand building.The “Hour” influence graphic appears to show that no trends associatedwith the hour of publication exists, although some peaks can beobserved. The “Weekday” shows that “Monday” has a local maximumof impact, decreasing along the week until “Friday,” when the globalmaximum of impact occurs. The study of Cvijikj et al. (2011) also result-ed in a global maximum on “Friday,” although they did not report atrend for the “Monday” local maximum and then decrease observed inFig. 13. It was expected more impact on weekend days, consideringusers tend to be more available in this period. This is an interestingresult to explore in future studies with additional data from whenusers interact with posts (e.g., by analyzing the hours in each day ofthe week in which the users engage the most). The result shown for“Paid” is expected: a post for which the company paid for advertisinghas a larger impact than a post not paid. Nevertheless, this is one of
ance metrics and evaluation of the impact on brand building: A data.1016/j.jbusres.2016.02.010

10 S. Moro et al. / Journal of Business Research xxx (2016) xxx–xxx
the least relevant input features for the defined model, with just 7% ofrelevance.
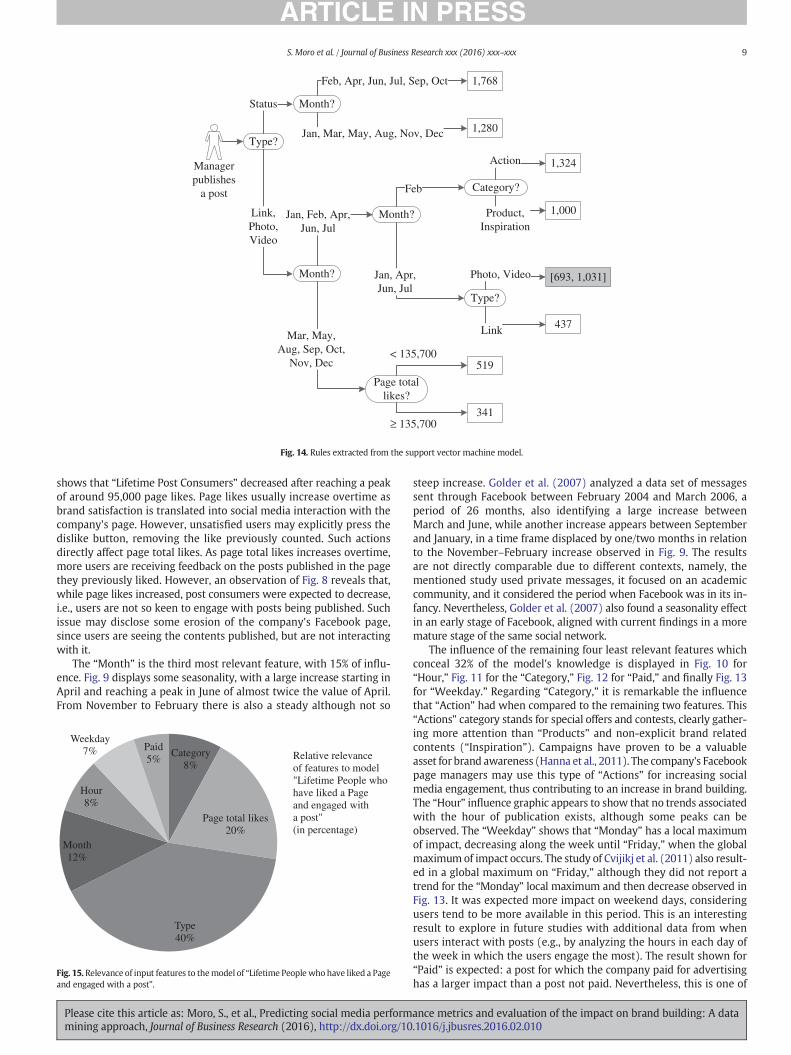
For providing the “big picture” of the decision process flow definedby the “Lifetime Post Consumers” model, we performed a rule extrac-tion procedure over the model, by applying a decision tree modelingover the predicted values of the support vector machine built (Fig.14). This technique has been shown to be valuable in providing areadable image of a black box model such as support vector machines,complementing the sensitivity analysis conducted from Figs. 6 to 13(Moro et al., 2014).
The concise results shown in Fig. 14 provide a decision process pathuntil a leaf node is reached (in squares), where the predicted “LifetimePost Consumers” value lies. The leaf in gray represents a subset of thedecision process path ranging from 693 to 1,031 of “Lifetime PostConsumers,” which was omitted due to page space constraints.Nevertheless, the more a decision node is to the left, the more relevantthat feature is. In fact, the “Type” of post appears as the first decisionnode, aligned with the results of Fig. 6 (“Type” was the top rankedfeature in terms of relevance). However, the “Month” comes next interms of relevance, while “Page total likes” is third, on the contrary ofFig. 6 (“Month” got a relevance of 15% while “Page total likes” achieved17%). Such result may be due to the fact that decision tree's modelingdoes not apprehend the complex nonlinear mappings such as moreadvanced black box techniques (e.g., neural networks or support vectormachines).
The results and analyses presented in this paper are based on theexperiments of a specific case of posts published by a cosmeticcompany's Facebook page during the year of 2014. Models built usingdata mining are purely data driven; thus, these rely on the patterns ofknowledge hidden in data (Turban et al., 2011). If data sources change,models need to beupdated,whichmayhappen not only if one considersanother case study, but also during the natural evolution of the contextsurrounding the company and the users. Also, unexpected events mayhave a huge impact on the predicting capabilities of models. Hence,data mining models need constant updating to incorporate thesechanges. Therefore, the results presented cannot be generalized.However, the experimental approach conducted can be applied toanother company and period, unveiling potential useful knowledge.
5. Conclusions
This research focused in modeling performance metrics extractedfrom posts published in a company's Facebook page through the usageof data mining. Moreover, the support vector machine technique wasemployed by feeding it with seven input features, all provided byFacebook's page, except a content specific categorization provided bythe page's manager. Twelve performance metrics were modeled withthese input features, from which the two models achieving the bestperformance modeled the “Lifetime Post Consumers” and the “LifetimePeople who have liked a Page and engaged with a post” outputfeatures, with a mean absolute percentage error of 27.2% and of 26.9%,respectively.
Based on the “Lifetime Post Consumers” model, this study showedhow it could benefit through its predictions brand building by providinginsights on social media engagement. The advantages of using themodelwere also linked to all the stages of branding (cognitive, affective,and cognative stages). A data-based sensitivity analysis was thenapplied for extracting valuable knowledge from the model of “LifetimePost Consumers.” The “Type” of the content published was consideredby far the most relevant input feature for the model. Posts from the“Status type” are likely to result in twice the impact of the remaining“Types.” Also, seasonality was found regarding the “Month” the postwas published. Publications related to special offers and contests arelikely to produce posts with greater impact than “Product” and othernon-explicit brand related contents. We also produced a decision flowprocess based on rules extraction from the model. Facebook page
Please cite this article as: Moro, S., et al., Predicting social media performmining approach, Journal of Business Research (2016), http://dx.doi.org/10
managers can use this knowledge to make informed decisions on theposts they publish, enhancing their impact, thus contributing forbrand building.
Several ideas arise from this study for future research. First, themodel may be enriched with other context features (e.g., if the productis being advertised elsewhere) for tuning its performance. Also, textmining methods could be employed to the content for extractingadditional knowledge. Finally, text mining the comments of each postfor user sentiment analysis could reveal the feelings each post isgenerating.
Acknowledgments
We would like to thank the two anonymous reviewers for theirvaluable recommendations, which highly enhanced the value of thefinal manuscript.
Appendix
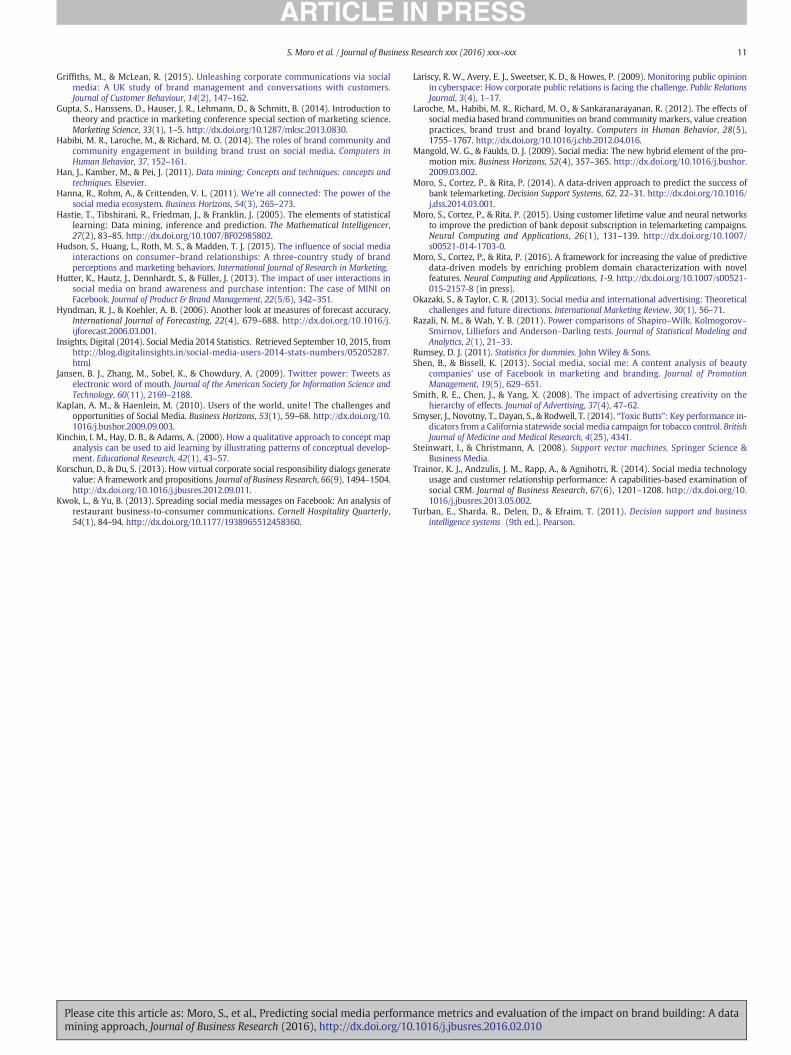
Considering the novelty of the proposed approach, the knowledgehidden in the “Lifetime People who have liked a Page and engagedwith a post” was also evaluated, which achieved a mean absolutepercentage error of 26.9%. Nevertheless, such performance metric wasinfluenced by considering only userswhohave liked the page, as arguedin Section 4.1. Therefore, this Appendix shows in Fig. 15 the relativerelevance of each input feature to the model (similar to the exercisedisplayed in Fig. 6).
The results are aligned with those for the model of “Lifetime PostConsumers,” even though the “Type” is now more relevant (40%) thanfor the latter model (36%). Also, “Page total likes” are more relevant,while “Month” is less. Further studies would be required for a deeperanalysis of the differences. Moreover, these studies would requireadditional data for differentiating the engagements of users who haveliked from those that didn't but also engaged.
References
Ballantine, P.W., Lin, Y., & Veer, E. (2015). The influence of user comments on perceptionsof Facebook relationship status updates. Computers in Human Behavior, 49, 50–55.
Bianchi, C., & Andrews, L. (2015). Investigating marketing managers' perspectives onsocial media in Chile. Journal of Business Research (Available online 20 June 2015, inpress).
Cortez, P. (2010). Data mining with neural networks and support vector machines usingthe R/rminer tool. Advances in data mining. Applications and theoretical aspects(pp. 572–583). Berlin Heidelberg: Springer.
Cortez, P., & Embrechts, M. J. (2013). Using sensitivity analysis and visualizationtechniques to open black box data mining models. Information Sciences, 225, 1–17.http://dx.doi.org/10.1016/j.ins.2012.10.039.
Culnan, M. J., McHugh, P. J., & Zubillaga, J. I. (2010). How large US companies can use Twit-ter and other social media to gain business value. MIS Quarterly Executive, 9(4),243–259.
Cvijikj, I. P., Spiegler, E. D., & Michahelles, F. (2011). The effect of post type, category andposting day on user interaction level on Facebook. In Privacy, Security, Risk and Trust(PASSAT) and 2011 IEEE Third Inernational Conference on Social Computing(SocialCom), 2011 IEEE Third International Conference on (pp. 810–813). IEEE. http://dx.doi.org/10.1109/PASSAT/SocialCom.2011.21.
Digital, Deloitte (2015). Navigating the new digital divide—capitalizing on digitalinfluence in retail. Retrieved September 12, 2015, from http://www2.deloitte.com/content/dam/Deloitte/us/Documents/consumer-business/us-cb-navigating-the-new-digital-divide-v2-051315.pdf
Dossier, Statista (2014). Social media & user-generated content—Number of global socialnetwork users 2010–2018—Statista Dossier 2014. Retrieved September 10, 2015,from http://www.statista.com/statistics/278414/number-of-worldwide-social-network-users/
Edosomwan, S., Prakasan, S. K., Kouame, D., Watson, J., & Seymour, T. (2011). The historyof social media and its impact on business. Journal of Applied Management andEntrepreneurship, 16(3), 79–91.
Gensler, S., Völckner, F., Egger, M., Fischbach, K., & Schoder, D. (2015). Listen to yourcustomers: Insights into brand image using online consumer-generated product re-views. International Journal of Electronic Commerce, 20(1), 112–141. http://dx.doi.org/10.1080/10864415.2016.1061792.
Golder, S. A., Wilkinson, D. M., & Huberman, B. A. (2007). Rhythms of social interaction:Messaging within a massive online network. Communities and technologies 2007(pp. 41–66). London: Springer. http://dx.doi.org/10.1007/978–1-84628-905-7_3.
ance metrics and evaluation of the impact on brand building: A data.1016/j.jbusres.2016.02.010
11S. Moro et al. / Journal of Business Research xxx (2016) xxx–xxx
Griffiths, M., & McLean, R. (2015). Unleashing corporate communications via socialmedia: A UK study of brand management and conversations with customers.Journal of Customer Behaviour, 14(2), 147–162.
Gupta, S., Hanssens, D., Hauser, J. R., Lehmann, D., & Schmitt, B. (2014). Introduction totheory and practice in marketing conference special section of marketing science.Marketing Science, 33(1), 1–5. http://dx.doi.org/10.1287/mksc.2013.0830.
Habibi, M. R., Laroche, M., & Richard, M. O. (2014). The roles of brand community andcommunity engagement in building brand trust on social media. Computers inHuman Behavior, 37, 152–161.
Han, J., Kamber, M., & Pei, J. (2011). Data mining: Concepts and techniques: concepts andtechniques. Elsevier.
Hanna, R., Rohm, A., & Crittenden, V. L. (2011). We're all connected: The power of thesocial media ecosystem. Business Horizons, 54(3), 265–273.
Hastie, T., Tibshirani, R., Friedman, J., & Franklin, J. (2005). The elements of statisticallearning: Data mining, inference and prediction. The Mathematical Intelligencer,27(2), 83–85. http://dx.doi.org/10.1007/BF02985802.
Hudson, S., Huang, L., Roth, M. S., & Madden, T. J. (2015). The influence of social mediainteractions on consumer–brand relationships: A three-country study of brandperceptions and marketing behaviors. International Journal of Research in Marketing.
Hutter, K., Hautz, J., Dennhardt, S., & Füller, J. (2013). The impact of user interactions insocial media on brand awareness and purchase intention: The case of MINI onFacebook. Journal of Product & Brand Management, 22(5/6), 342–351.
Hyndman, R. J., & Koehler, A. B. (2006). Another look at measures of forecast accuracy.International Journal of Forecasting, 22(4), 679–688. http://dx.doi.org/10.1016/j.ijforecast.2006.03.001.
Insights, Digital (2014). Social Media 2014 Statistics. Retrieved September 10, 2015, fromhttp://blog.digitalinsights.in/social-media-users-2014-stats-numbers/05205287.html
Jansen, B. J., Zhang, M., Sobel, K., & Chowdury, A. (2009). Twitter power: Tweets aselectronic word of mouth. Journal of the American Society for Information Science andTechnology, 60(11), 2169–2188.
Kaplan, A. M., & Haenlein, M. (2010). Users of the world, unite! The challenges andopportunities of Social Media. Business Horizons, 53(1), 59–68. http://dx.doi.org/10.1016/j.bushor.2009.09.003.
Kinchin, I. M., Hay, D. B., & Adams, A. (2000). How a qualitative approach to concept mapanalysis can be used to aid learning by illustrating patterns of conceptual develop-ment. Educational Research, 42(1), 43–57.
Korschun, D., & Du, S. (2013). How virtual corporate social responsibility dialogs generatevalue: A framework and propositions. Journal of Business Research, 66(9), 1494–1504.http://dx.doi.org/10.1016/j.jbusres.2012.09.011.
Kwok, L., & Yu, B. (2013). Spreading social media messages on Facebook: An analysis ofrestaurant business-to-consumer communications. Cornell Hospitality Quarterly,54(1), 84–94. http://dx.doi.org/10.1177/1938965512458360.
Please cite this article as: Moro, S., et al., Predicting social media performmining approach, Journal of Business Research (2016), http://dx.doi.org/10
Lariscy, R. W., Avery, E. J., Sweetser, K. D., & Howes, P. (2009). Monitoring public opinionin cyberspace: How corporate public relations is facing the challenge. Public RelationsJournal, 3(4), 1–17.
Laroche, M., Habibi, M. R., Richard, M. O., & Sankaranarayanan, R. (2012). The effects ofsocial media based brand communities on brand community markers, value creationpractices, brand trust and brand loyalty. Computers in Human Behavior, 28(5),1755–1767. http://dx.doi.org/10.1016/j.chb.2012.04.016.
Mangold, W. G., & Faulds, D. J. (2009). Social media: The new hybrid element of the pro-motion mix. Business Horizons, 52(4), 357–365. http://dx.doi.org/10.1016/j.bushor.2009.03.002.
Moro, S., Cortez, P., & Rita, P. (2014). A data-driven approach to predict the success ofbank telemarketing. Decision Support Systems, 62, 22–31. http://dx.doi.org/10.1016/j.dss.2014.03.001.
Moro, S., Cortez, P., & Rita, P. (2015). Using customer lifetime value and neural networksto improve the prediction of bank deposit subscription in telemarketing campaigns.Neural Computing and Applications, 26(1), 131–139. http://dx.doi.org/10.1007/s00521-014-1703-0.
Moro, S., Cortez, P., & Rita, P. (2016). A framework for increasing the value of predictivedata-driven models by enriching problem domain characterization with novelfeatures. Neural Computing and Applications, 1-9. http://dx.doi.org/10.1007/s00521-015-2157-8 (in press).
Okazaki, S., & Taylor, C. R. (2013). Social media and international advertising: Theoreticalchallenges and future directions. International Marketing Review, 30(1), 56–71.
Razali, N. M., & Wah, Y. B. (2011). Power comparisons of Shapiro–Wilk, Kolmogorov–Smirnov, Lilliefors and Anderson–Darling tests. Journal of Statistical Modeling andAnalytics, 2(1), 21–33.
Rumsey, D. J. (2011). Statistics for dummies. John Wiley & Sons.Shen, B., & Bissell, K. (2013). Social media, social me: A content analysis of beauty
companies' use of Facebook in marketing and branding. Journal of PromotionManagement, 19(5), 629–651.
Smith, R. E., Chen, J., & Yang, X. (2008). The impact of advertising creativity on thehierarchy of effects. Journal of Advertising, 37(4), 47–62.
Smyser, J., Novotny, T., Dayan, S., & Rodwell, T. (2014). “Toxic Butts”: Key performance in-dicators from a California statewide social media campaign for tobacco control. BritishJournal of Medicine and Medical Research, 4(25), 4341.
Steinwart, I., & Christmann, A. (2008). Support vector machines. Springer Science &Business Media.
Trainor, K. J., Andzulis, J. M., Rapp, A., & Agnihotri, R. (2014). Social media technologyusage and customer relationship performance: A capabilities-based examination ofsocial CRM. Journal of Business Research, 67(6), 1201–1208. http://dx.doi.org/10.1016/j.jbusres.2013.05.002.
Turban, E., Sharda, R., Delen, D., & Efraim, T. (2011). Decision support and businessintelligence systems (9th ed.). Pearson.
ance metrics and evaluation of the impact on brand building: A data.1016/j.jbusres.2016.02.010