predicting proficiency without direct assessment: can speaking
TRANSCRIPT

ILR Testing Committee March 2013 1
Sponsored by: SOFLO, USSOCOM
© SWA Consulting Inc., 2013
Predicting Proficiency without Direct Assessment: Can Speaking Ratings be Inferred from Non-participatory Listening and Reading Ratings?
April 4, 2012
Dr. Eric A. Surface SWA Consulting Inc.

ILR Testing Committee March 2013 2
Sponsored by: SOFLO, USSOCOM
© SWA Consulting Inc., 2013
Research Focus
• Language proficiency testing can be costly
• Can language proficiency test scores from one modality be used to predict test scores in another? – Specifically, can non-participatory listening and
reading scores be used to infer speaking scores?
• We used an evidence-based approach to explore the interchangeability of scores from two language proficiency tests: – Defense Language Proficiency Test (DLPT) – Oral Proficiency Interview (OPI)
• Four studies providing evidence on the potential interchangeability of DLPT and OPI scores

ILR Testing Committee March 2013 3
Sponsored by: SOFLO, USSOCOM
© SWA Consulting Inc., 2013
Evidence-based Decision-Making
Practitioner expertise and judgment
Systematic review of the best available research
Evidence from the local context
Perspectives of those who are affected
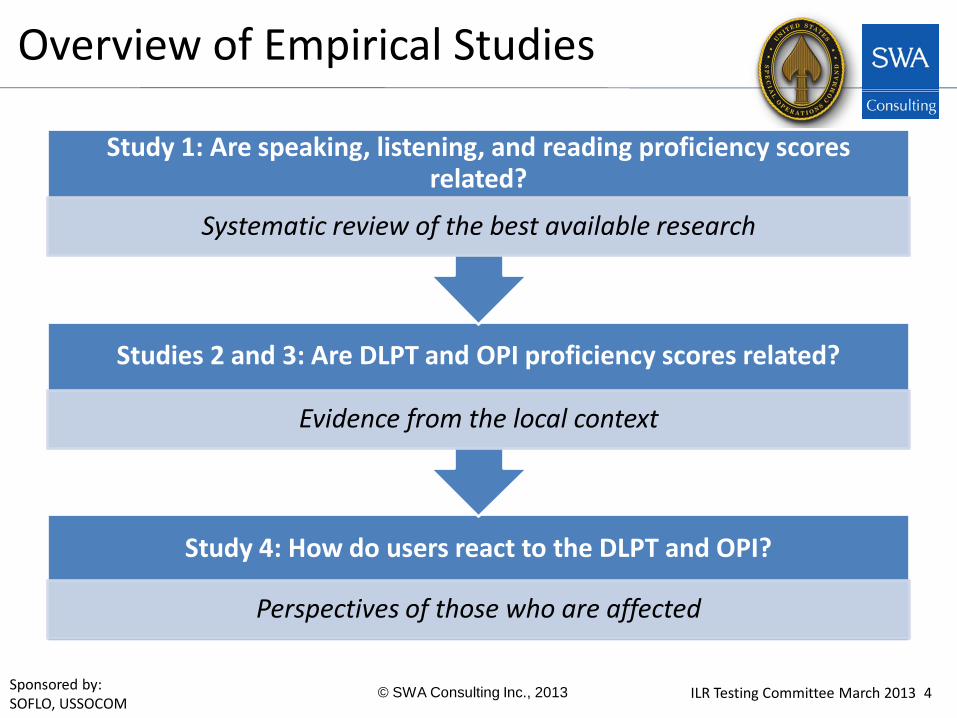
The evidence-based approach to organizational decision-making includes four types of evidence (Briner & Rousseau, 2011):
ILR Testing Committee March 2013 4
Sponsored by: SOFLO, USSOCOM
© SWA Consulting Inc., 2013
Overview of Empirical Studies
Study 4: How do users react to the DLPT and OPI?
Perspectives of those who are affected
Studies 2 and 3: Are DLPT and OPI proficiency scores related?
Evidence from the local context
Study 1: Are speaking, listening, and reading proficiency scores related?
Systematic review of the best available research

ILR Testing Committee March 2013 5
Sponsored by: SOFLO, USSOCOM
© SWA Consulting Inc., 2013
Overview of DLPT and OPI
• DLPT – Tests non-participatory listening and reading
proficiencies
• OPI – Tests speaking proficiency – “Two-skill” version also assesses participatory
listening proficiency – Preferred means of testing SOF language capability for
speaking skills (USSOCOM M 350-8, 2009)

ILR Testing Committee March 2013 6
Sponsored by: SOFLO, USSOCOM
© SWA Consulting Inc., 2013
Study 1: Meta-Analytic Review
• Based on the available empirical studies, what are the relationships among speaking, listening and reading proficiency scores?
• Meta-analysis Methodology (Hunter & Schmidt, 2004) – Reviewed 8,343 studies and 86 met our inclusion criteria
• Military population • Adult expatriate population
– Used Hunter and Schmidt’s (2004) Random Effects Model • Potential moderators:
– Training characteristics • Setting, study purpose, language difficulty
– Student characteristics • Age

ILR Testing Committee March 2013 7
Sponsored by: SOFLO, USSOCOM
© SWA Consulting Inc., 2013
Study 1 Results
Relationship
Speaking
k rcor
Non-participatory Listening 191 .67**
Reading 184 .58**
Relationships between Speaking Proficiency and Non-participatory Listening/Reading Proficiency
Note. ** = significant beyond .01. k = number of correlations included in the analysis. rcor = corrected correlations.

ILR Testing Committee March 2013 8
Sponsored by: SOFLO, USSOCOM
© SWA Consulting Inc., 2013
Study 1 Results (cont.)
OPI-Speaking
Relationship k rcor
DLPT-Listening 35 .59**
DLPT-Reading 38 .59**
Relationships between OPI and DLPT Assessment Results
Note. ** = significant beyond .01. k = number of correlations included in the analysis. rcor = corrected correlations.

ILR Testing Committee March 2013 9
Sponsored by: SOFLO, USSOCOM
© SWA Consulting Inc., 2013
Study 2: AFSOC Study
• Can the DLPT listening and reading proficiency scores be used as a proxy for determining OPI speaking proficiency ratings? – Are the scores related? – Is there absolute agreement between the ratings?
• Sample
– 58 language trainees from Air Force Special Operations Forces (AFSOF) who participated in:
• Initial Acquisition Training (n = 56) • Sustainment Enhancement Training (n = 2)
– Nine different languages represented

ILR Testing Committee March 2013 10
Sponsored by: SOFLO, USSOCOM
© SWA Consulting Inc., 2013
Study 2 Results
DLPT-Listening DLPT-Reading OPI-Speaking
DLPT-Listening -- 31% 28%
DLPT-Reading .76* -- 12%
OPI-Speaking .66* .49* --
Correlations among DLPT (All Versions) and OPI Assessment Results
Note. n = 58. Lower diagonal presents zero-order correlations. Upper diagonal presents absolute agreement rates of ILR level (i.e., equal ratings across target assessments). * = p < .01.

ILR Testing Committee March 2013 11
Sponsored by: SOFLO, USSOCOM
© SWA Consulting Inc., 2013
Study 2 Results (cont.)
Absolute Agreement with OPI-S Ratings
All DLPT Versions No. of instances Agreement rate DLPT-Listening 16 (of 58) 28% DLPT-Reading 7 (of 58) 12%
DLPT Version 5 Only DLPT-Listening 12 (of 40) 30% DLPT-Reading 5 (of 40) 13%
Absolute Agreement between DLPT and OPI Assessment ILR Level Results

ILR Testing Committee March 2013 12
Sponsored by: SOFLO, USSOCOM
© SWA Consulting Inc., 2013
Study 3: Army SOF
• Can the DLPT listening and reading proficiency results be used as a proxy for determining OPI speaking proficiency? – Are the scores related? – Is there absolute agreement between the ratings? – Can DLPT ratings be used to predict OPI ratings?
• Two Samples (50+ languages)
– Sample 1: 3,040 United States Army (SOF and other MOS assigned to SOF)
– Sample 2: 265 language Army SOF trainees

ILR Testing Committee March 2013 13
Sponsored by: SOFLO, USSOCOM
© SWA Consulting Inc., 2013
Study 3 Results
Correlations and Absolute Agreement between DLPT (All Versions)-Listening and Reading and OPI-Speaking
Note. Sample 1 n = 3040; Sample 2 n = 265. Lower diagonal for each sample presents zero-order correlations. Upper diagonal for each sample presents absolute agreement rates (i.e., equal ratings across target assessments). * = p < .001.
Sample 1 DLPT-Listening DLPT-Reading OPI DLPT-Listening -- 34% 34% DLPT-Reading 0.80* -- 24% OPI 0.79* 0.77* --
Sample 2 DLPT-Listening -- 37% 32% DLPT-Reading 0.80* -- 25% OPI 0.67* 0.59* --

ILR Testing Committee March 2013 14
Sponsored by: SOFLO, USSOCOM
© SWA Consulting Inc., 2013
Study 3 Results (cont.)
Predicted OPI Rating (Weighted DLPT-L/R Composite)
Actual OPI rating 0+ 1 1+ 2 2+ Total
0+ # 29 20 49 % for row 59.2% 40.8% --
1 # 42 32 11 6 91 % for row 46.2% 35.2% 12.1% 6.6% --
1+ # 9 28 17 12 66 % for row 13.6% 42.4% 25.8% 18.2% --
2 # 5 13 30 48 % for row 10.4% 27.1% 62.5% --
2+ # 3 2 6 0 11 % for row 27.3% 18.2% 54.5% 0% --
Total # 80 88 43 54 0 265 % for row 30.2% 33.2% 16.2% 20.4% 0.0% --
Sample 2 – Comparison of Predicted to Actual OPI Ratings
Note. Overall correct classification percentage is 41%.
ILR Testing Committee March 2013 15
Sponsored by: SOFLO, USSOCOM
© SWA Consulting Inc., 2013
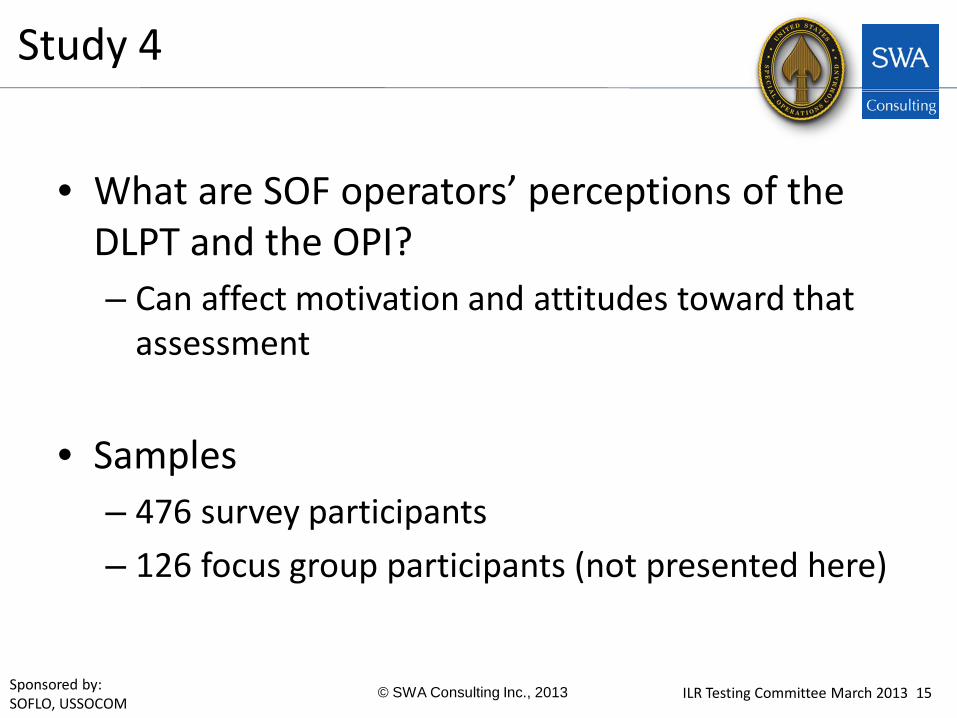
Study 4
• What are SOF operators’ perceptions of the DLPT and the OPI? – Can affect motivation and attitudes toward that
assessment
• Samples – 476 survey participants – 126 focus group participants (not presented here)

ILR Testing Committee March 2013 16
Sponsored by: SOFLO, USSOCOM
© SWA Consulting Inc., 2013
Study 4 Results
Item DLPT OPI
“Test is related to…” % Agree % Disagree % Agree % Disagree
Deployment tasks1 13% 53% 32% 25%
Ability to use language on job2
20% 48% 41% 20%
Language use in field1
35% 30% 49% 14%
Job/mission performance1
20% 45% 35% 22%
Survey Response Percentages
Note. 1n = 460. 2n = 461. % Agree = percentage of participants who Strongly Agree or Agree combined. % Disagree = percentage of participants who Strongly Disagree or Disagree combined.

ILR Testing Committee March 2013 17
Sponsored by: SOFLO, USSOCOM
© SWA Consulting Inc., 2013
Study 4 Results (cont.)
Survey Comments about Test Content
Comments about content relevance to job/mission Survey DLPT1
DLPT content is unrelated to mission/job/military 59 Needs to include a speaking component 30
OPI2 Should cover military related topics or be related to the mission
12
OPI was not relevant (wrong modality, etc) 4 Cannot use dialect 2
Note. Counts are from survey comments. 1n = 282 total survey comments. 2n = 95 total survey comments.

ILR Testing Committee March 2013 18
Sponsored by: SOFLO, USSOCOM
© SWA Consulting Inc., 2013
Study 4 Results (cont.)
Survey Comments about Test Fairness
Note. Counts are from survey comments. 1n = 282 total survey comments. 2n = 95 total survey comments.
Test Fairness Survey Comments Survey DLPT1
DLPT is not an accurate/valid assessment (i.e., does not measure language proficiency)
28
DLPT is too difficult 12 Training does not match what is tested on the DLPT 11 DLPT is an accurate/valid assessment (i.e., measures language proficiency)
9
Not able to prepare for the test 3 Training matches what is tested on the DLPT 2
OPI2
Good gauge of language proficiency/ability to communicate 22 Not effective for reading needs or not good replacement for DLPT 3

ILR Testing Committee March 2013 19
Sponsored by: SOFLO, USSOCOM
© SWA Consulting Inc., 2013
Overall Implications
• Preponderance of empirical and psychometric evidence suggests: – Ratings for different language modalities should
NOT be used interchangeably
– Ratings from one language modality should NOT be used to predict scores in other modalities for high stakes decisions

ILR Testing Committee March 2013 20
Sponsored by: SOFLO, USSOCOM
© SWA Consulting Inc., 2013
Overall Implications (cont.)
• DLPT-Listening and Reading results should NOT be used as proxies for OPI-Speaking ratings
– There are only moderate relationships between
speaking and non-participatory listening and speaking and reading test scores
– The absolute agreement between ratings was poor
– A weighted composite of DLPT ratings resulted in only a partially accurate prediction of OPI ratings

ILR Testing Committee March 2013 21
Sponsored by: SOFLO, USSOCOM
© SWA Consulting Inc., 2013
Overall Implications (cont.)
• Stakeholders perceived the OPI to be more related to job performance than the DLPT
– SOF work analysis studies (not reported here) support that speaking and participatory listening are the most frequently used language skill modalities
• Policy, resources, training, testing and compensation must be aligned to produce the capability needed for success performance on missions and, therefore, mission success
• Given the current evidence, the OPI should be maintained as the test of record for SOF to ensure testing is aligned with capability requirements

ILR Testing Committee March 2013 22
Sponsored by: SOFLO, USSOCOM
© SWA Consulting Inc., 2013
Future Directions
• Identify solutions to lower costs of assessment without sacrificing reliability/validity, e.g.: – Technology-mediated assessment, such as ACTFL ILR OPIc®
• OPI was only perceived as marginally better than the DLPT by Operators and Leader—investigate other testing constructs such as performance- or capability-based assessments
• Be proponents of evidence-based decision-making
pertaining to: – Foreign language testing policy (e.g., certification, skill-based
pay, etc.)

ILR Testing Committee March 2013 23
Sponsored by: SOFLO, USSOCOM
© SWA Consulting Inc., 2013
Related Technical Report: SWA Consulting Inc. (November, 2010). Using the DLPT as a proxy for the OPI: Are
reading and non-participatory listening scores a substitute for direct assessment of speaking proficiency? (Technical Report #2010010624). Raleigh, NC: Author.
Conference Paper: Watson, A. M., Harman, R. P., Surface, E. A., & McGinnis, J. L. (2012, April). Predicting
proficiency without direct assessment: Can speaking ratings be inferred from listening and reading ratings? Paper presented at the 34th Language Testing Research Colloquium, Princeton, NJ.
Thank you. Questions?

ILR Testing Committee March 2013 24
Sponsored by: SOFLO, USSOCOM
© SWA Consulting Inc., 2013
RESERVE SLIDES

ILR Testing Committee March 2013 25
Sponsored by: SOFLO, USSOCOM
© SWA Consulting Inc., 2013
Study 1 Results (cont.)
Moderators of Relationships between Speaking Proficiency and Non-participatory Listening/Reading Proficiency
Note. ** = significant beyond .01. Purpose and Setting variables were statistically significant but not practically significant. rcor = corrected correlation. Abs Diff = absolute difference between moderator relationships and overall relationship. k = number of correlations included in the analysis. β = Beta weight.
Relationship
Purpose Setting Age Language Difficulty
rcor Abs Diff rcor Abs Diff k β k β
Speaking – Non-part. Listening
.63 .04 .59 .08 41 .99** 91 -.51**
Speaking – Reading .57 .01 .59 .01 49 .99** 80 -.91**

ILR Testing Committee March 2013 26
Sponsored by: SOFLO, USSOCOM
© SWA Consulting Inc., 2013
Study 1 Results (cont.)
Relationship
Purpose Setting Age Language Difficulty
rcor Abs Diff rcor Abs Diff k β k β
OPI-Speaking – DLPT-Listening - - - - 4 .20 27 .96*
OPI-Speaking – DLPT-Reading - - - - 4 .32 27 .99*
Moderators of Relationships between OPI and DLPT Assessment Results
Note. * = significant beyond .05. Moderator analyses for purpose and setting were not conducted because all studies included were evaluation and military studies. k = number of correlations included in the analysis. β = Beta weight.

ILR Testing Committee March 2013 27
Sponsored by: SOFLO, USSOCOM
© SWA Consulting Inc., 2013
Study 2 Sample
Enrollment Frequencies by Language (n = 58)

ILR Testing Committee March 2013 28
Sponsored by: SOFLO, USSOCOM
© SWA Consulting Inc., 2013
Study 2 Results
DLPT-L Rating
OPI-S Rating
Total
0 0+ 1 1+ 2 2+ 3 0 Count 0 1 4
OPI > DLPT-L 5
% within 0% 20.0% 80.0%
44.8% 100.0% 0+ Count
1 15 3
19
% within
5.3% 78.9% 15.8%
100.0% 1 Count
1 10 3
14
% within
7.1% 71.4% 21.4%
100.0% 1+ Count
4 3
7
% within
57.1% 42.9%
100.0% 2 Count
2 1 2
5
% within
40.0% 20.0% 40.0%
100.0% 2+ Count
1 2 4 0
7
% within
14.3% 28.6% 57.1% 0%
100.0% 3 Count DLPT-L > OPI
1
0 1
% within 27.6%
100.0%
0% 100.0% Total
Count 0 3 36 12 7 0 0 58
% within . 5.2% 62.1% 12.0% 7.0% . . 100.0%
Cross Tabulation of DLPT (2, 4, & 5) Listening and OPI-S Proficiency Ratings

ILR Testing Committee March 2013 29
Sponsored by: SOFLO, USSOCOM
© SWA Consulting Inc., 2013
Study 2 Results (cont.) Cross Tabulation of DLPT (2, 4, & 5) Reading and OPI-S Proficiency Ratings
DLPT-R Ratings
OPI-S Rating
Total
0 0+ 1 1+ 2 2+ 3 0 Count 0 1 10 1
OPI > DLPT-R 12
% within 0% 8.3% 83.3% 8.3
43.1% 100.0% 0+ Count
1 7 3
11
% within
9.1% 63.6% 27.3%
100.0% 1 Count
1 4 1
6
% within
16.7% 66.7% 16.7%
100.0% 1+ Count
9 1 2
12
% within
75.0% 8.3% 16.7
100.0% 2 Count
2 4 1
7
% within
28.6% 57.1% 14.3%
100.0% 2+ Count
3 2 1 0
6
% within
50.0% 33.3% 16.7% 0%
100.0% 3 Count DLPT-R > OPI 1
3
0 4
% within 44.8%
25.0%
75.0%
0% 100.0% Total
Count 0 3 36 12 7 0 0 58
% within . 5.2% 62.1% 20.7% 12.1% . . 100.0%

ILR Testing Committee March 2013 30
Sponsored by: SOFLO, USSOCOM
© SWA Consulting Inc., 2013
Study 3 Results
OPI Ratings and DLPT-L Ratings for Sample 1
One-skill OPI Rating Total DLPT-L Rating 0 0+ 1 1+ 2 2+ 3 3+ 0 Count 15 163 62 OPI > DLPT-L 0 % within row 6.3% 67.9% 25.8% 22% 100.0%
0+ Count 14 226 268 23 3 534 % within row 2.6% 42.3% 50.2% 4.3% .6% 100.0%
1 Count 206 391 64 22 683 % within row 30.2% 57.2% 9.4% 3.2% 100.0%
1+ Count 40 160 123 55 3 381 % within row 10.5% 42.0% 32.3% 14.4% .8% 100.0%
2 Count 4 78 252 226 6 2 568 % within row .7% 13.7% 44.4% 39.8% 1.1% .4% 100.0%
2+ Count 17 97 263 30 4 411 % within row 4.1% 23.6% 64.0% 7.3% 1.0% 100.0%
3 Count 2 30 116 41 31 3 223 % within row .9% 13.5% 52.0% 18.4% 13.9% 1.3% 100.0%
3+ Count DLPT-L > OPI 0 0 % within row 44% 0% 100.0% Total Count 29 639 978 589 685 80 37 3 3040 % within row 1.0% 21.0% 32.2% 19.4% 22.5% 2.6% 1.2% .1% 100.0%

ILR Testing Committee March 2013 31
Sponsored by: SOFLO, USSOCOM
© SWA Consulting Inc., 2013
Study 3 Results (cont.)
OPI Ratings and DLPT-L Ratings for Sample 2
Two-skill OPI Rating Total DLPT-L Rating 0 0+ 1 1+ 2 2+ 3 0 Count 0 9 14 2 OPI > DLPT-L 25 % within row 0% 36.0% 56.0% 8.0% 39% 100.0% 0+ Count 26 38 12 1 77 % within row 33.8% 49.4% 15.6% 1.3% 100.0% 1 Count 9 15 12 2 38 % within row 23.7% 39.5% 31.6% 5.3% 100.0% 1+ Count 5 10 18 8 3 44 % within row 11.4% 22.7% 40.9% 18.2% 6.8% 100.0% 2 Count 13 19 28 7 67 % within row 19.4% 28.4% 41.8% 10.4% 100.0% 2+ Count 1 6 14 3 24 % within row 4.2% 25.0% 58.3% 12.5% 100.0% 3 Count DLPT-L > OPI 3 1 0 4 % within row 29% 75% 25% 0% 100.0% Total Count 0 49 91 69 56 14 0 279 % within row 0% 17.6% 32.6% 24.7% 20.1% 5.0% 0% 100.0%

ILR Testing Committee March 2013 32
Sponsored by: SOFLO, USSOCOM
© SWA Consulting Inc., 2013
Study 3 Results (cont.)
OPI Ratings and DLPT-R Ratings for Sample 1
One-skill OPI Rating Total DLPT-R Rating 0 0+ 1 1+ 2 2+ 3 3+ 0 Count 8 58 13 OPI > DLPT-R 0 % within row 10.1% 73.4% 16.5% 7% 100.0% 0+ Count 9 143 86 2 240 % within row 3.8% 59.6% 35.8% .8% 100.0% 1 Count 11 322 338 14 8 693 % within row 1.6% 46.5% 48.8% 2.0% 1.2% 100.0% 1+ Count 92 233 71 20 1 417 % within row 22.1% 55.9% 17.0% 4.8% .2% 100.0% 2 Count 20 185 204 104 5 518 % within row 3.9% 35.7% 39.4% 20.1% 1.0% 100.0% 2+ Count 1 3 102 201 257 17 5 586 % within row .2% .5% 17.4% 34.3% 43.9% 2.9% .9% 100.0% 3 Count 1 21 97 296 57 32 3 507 % within row .2% 4.1% 19.1% 58.4% 11.2% 6.3% .6% 100.0% 3+ Count DLPT-R > OPI 0 0 % within row 69% 0% 100.0% Total Count 29 639 978 589 685 80 37 3 3040 % within row 1.0% 21.0% 32.2% 19.4% 22.5% 2.6% 1.2% .1% 100.0%

ILR Testing Committee March 2013 33
Sponsored by: SOFLO, USSOCOM
© SWA Consulting Inc., 2013
Study 3 Results (cont.)
OPI Ratings and DLPT-R Ratings for Sample 2
Two-skill OPI Rating Total DLPT-R Rating 0 0+ 1 1+ 2 2+ 3 0 Count 0 8 6 1 OPI > DLPT-R 15 % within row 0% 53.3% 40.0% 6.7% 23% 100.0% 0+ Count 13 22 4 39 % within row 33.3% 56.4% 10.3% 100.0% 1 Count 13 18 7 3 2 43 % within row 30.2% 41.9% 16.3% 7.0% 4.7% 100.0% 1+ Count 14 21 18 4 57 % within row 24.6% 36.8% 31.6% 7.0% 100.0% 2 Count 1 17 22 13 4 57 % within row 1.8% 29.8% 38.6% 22.8% 7.0% 100.0% 2+ Count 5 11 21 3 40 % within row 12.5% 27.5% 52.5% 7.5% 100.0% 3 Count DLPT-R > OPI 2 3 7 2 0 14 % within row 52% 14.3% 21.4% 50.0% 14.3% 0% 100.0% Total Count 0 49 91 66 48 11 0 265 % within row 0% 18.5% 34.3% 24.9% 18.1% 4.2% 0% 100.0%

ILR Testing Committee March 2013 34
Sponsored by: SOFLO, USSOCOM
© SWA Consulting Inc., 2013
Study 4 Results
Survey Responses
Note. DLPT: n = 471, M = 2.28; OPI: n = 471, M = 3.00. Responses are on a 5-point scale. 1= Not related, 2= Slightly related, 3= Moderately related, 4= Related, 5= Very related. Statistically significant difference, t(470) = -11.16, p < .01.

ILR Testing Committee March 2013 35
Sponsored by: SOFLO, USSOCOM
© SWA Consulting Inc., 2013
Study 4 Results (cont.)
Survey Responses
Note. DLPT: n = 460, M = 2.39; OPI: n = 460, M = 3.00. Responses are on a 5-point scale. 1= Strongly disagree, 2= Disagree, 3= Neither agree nor disagree, 4= Agree, 5= Strongly Agree. Statistically significant difference, t(459) = -11.28, p < .01.

ILR Testing Committee March 2013 36
Sponsored by: SOFLO, USSOCOM
© SWA Consulting Inc., 2013
Study 4 Results (cont.)
Survey Responses
Note. DLPT: n = 461, M = 2.55; OPI: n = 461, M = 3.19. Responses are on a 5-point scale. 1= Strongly disagree, 2= Disagree, 3= Neither agree nor disagree, 4= Agree, 5= Strongly Agree. Statistically significant difference, t(460) = -10.69, p < .01.