predicting online video engagement using clickstreamssnagrech/papers/clickstreamdsaa2015.pdf ·...
TRANSCRIPT
Predicting Online Video Engagement UsingClickstreams
Everaldo Aguiar∗, Saurabh Nagrecha†, and Nitesh V. Chawla‡Dept. of Computer Science and Engineering,
University of Notre Dame. Notre Dame, IN 46556, USAEmail: ∗[email protected], †[email protected], ‡[email protected]
Abstract—As access to broadband continues to grow alongwith the now almost ubiquitous availability of mobile phones,the landscape of the e-content delivery space has never been sodynamic. To establish their position in the market, businesses arebeginning to realize that understanding each of their customers’likes and dislikes is perhaps as important as the offered contentitself. Further, a number of companies are also delivering content,product previews, advertisements, etc. via video on their sites.The question remains – how effective are video engagementchannels on sites? Can that user engagement be quantified?Clickstream data can furnish important insight into those ques-tions using videos as a communication or messaging medium.To that end, focusing on a large set of web portals owned andmanaged by a private media company, we propose methods usingthese sites’ clickstream data that can be used to provide a deeperunderstanding of their visitors, as well as their interests andpreferences. We further expand the use of this data to show thatit can be effectively used to predict user engagement to videostreams, quantifying that metric by means of a survival analysisassessment.
I. INTRODUCTION
The constant growth in volume, speed, availability, andfunctionality of the Web brings with it not only a varietyof challenges and risks, but also a number of opportunities.While there have been a series of major advances in the fieldover time, one that has been given a considerable amount ofattention in more recent years is that of personalization.
Data about users’ online activity is continuously capturedand analyzed. Advanced recommendation systems are nowable to tell us what products we might be interested in buying[1], the books we will enjoy reading [2], what movies weshould watch next [3], and even which diseases we are at riskof contracting [4]. From a business perspective, the benefitsof being able to understand customers in this level of detailare unquestionable.
Methods for capturing user data on the Web are also becom-ing increasingly efficient. As described in [5], the browsingbehavior of individual users can be recorded at the granularityof mouse clicks with little to no work needed to be done.A number of services, both free and proprietary, offer usertracking solutions that can be implemented and deployedwithin minutes. However, the feedback that one usually getsfrom these tools is often in the form of simplistic aggregate
Copyright Notice: 978-1-4673-8273-1/15/$31.00 2015 IEEE
statistics that do not offer a deeper understanding of userbehavior.
With the above in mind, we set to analyze the applicationof some of these ideas to a specific context, while havingas our major goal the understanding of each user as anindividual unit. For this study, we analyzed a large datasetthat describes user clicks generated within a two-month spanand across a number of websites managed by a large mediacommunications company.
We describe the process of analyzing and drawing infer-ences from the user-generated clickstream data. The objectivehere is to quantify user engagement in viewing video contentand the development of a model to predict early exits in view-ership. We begin by showing, from a more general perspective,how this type of data can be used to identify particularlyinteresting trends in user interest, and to further illustrate theusefulness of this information, we describe how we appliedmethods to predict user engagement to video streams anddiscuss their effectiveness.
0.8
1.0
0.6
0.4
0.2
0.025% Complete
50% Complete
75% Complete
Complete
Video Start
Progress into video
View
er re
tent
ion
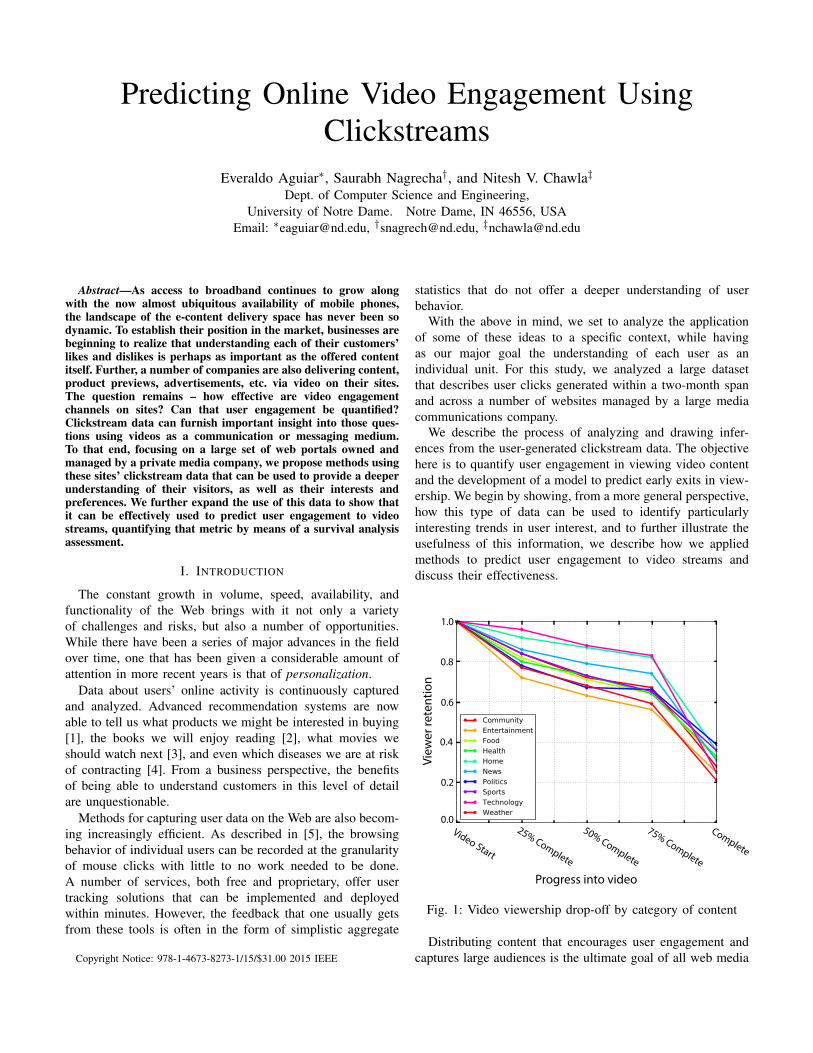
Fig. 1: Video viewership drop-off by category of content
Distributing content that encourages user engagement andcaptures large audiences is the ultimate goal of all web media

providers. Measuring and forecasting these variables, however,is not an easy task. As Figure 1 depicts, as time goes by,the amount of users that remain tuned to video streams, asillustrated by our dataset, dramatically decreases. For certaincategories, the percentage of users that actually watch videosto completion can be as low as 20%.
To address this adverse outcome, we propose the develop-ment of clickstream-based models that can learn the individualpreferences and characteristics of each user, and utilize thisinformation to predict how engaged they will be to a particularvideo stream. Content providers can estimate the expectedengagement of a particular video based on how past videoshave fared with a given demographic. This helps them evaluatecontent production, while identifying particularly engagedaudiences. Being able to know, in advance, if a user islikely to exit a video prematurely allows them some leewayto implement personalized intervention strategies aimed atmaximizing viewership retention.
The remainder of the paper is organized as follows: The nextsection gives an overview of the most recent related literature.That is followed by a detailed coverage of our clickstream datarepresentation and a description of our particular dataset. Wethen elaborate on the methods applied in this study, the resultsobtained and their importance in the subsequent sections.Finally, the last section draws conclusions about this exerciseand argues for the latent potential that resides in user-generatedclickstream data.
II. RELATED WORK
Interest in analyzing the online activities of users is asold as providing consumer content itself. This problem haspiqued the interest of multiple fields: marketing, psychologyand computer science to name a few.
Mulvenna and Buchner et al. explored the need for datadriven marketing intelligence in e-commerce [6], [7], [8]. Theirwork motivated how data could be leveraged to attract, retain,prevent the departure of customers, and promote cross sales.One of the earliest popular works in the area [9] primarilydelineates the process of harvesting data at various levels,through a process of feature extraction from unstructuredweb data for pattern recognition, which is then used tocreate business intelligence. It also acknowledges the desireto incorporate privacy into such an analysis.
Since user activity provides an immense amount of measur-able secondary data, various models to predict multiple aspectsof their behavior have been proposed. User interaction hasbeen studied at various levels — from gaze tracking [10] tobroader patterns of path traversal within a website [11], [12].Simple duration and dwell-time [13] can be used to predictwhen a user exits the site. User classification [14] can beused to identify what the user is specifically looking for andeven morph the website [15] according to the custom tastesof that particular user profile. Personalized content based onclick history has been implemented and widely adopted bycommercial content providers [16], [17].
With the distribution of online video content becomingmainstream, the way we study user engagement has beengreatly enriched. Studies like [18] have measured the roleof video content quality in influencing user engagement, butdid not utilize clickstreams to contextualize the video views.Online video engagement for Massive Open Online Courses(MOOCs) [19] has shown that the lessons learned fromanalyzing video views can be used to improve video authoring,editing, and interface design. It also emphasizes the value ofvideo dropout as a metric for engagement. Though the MOOCwork lacks the contextual history of the users, in this paperwe leverage that and many other clickstream aspects to predictvideo engagement.
III. CLICKSTREAM DATA REPRESENTATION
Clickstream data consists of a “virtual trail” that usersleave behind as they interact with a given system, websiteor application. More specifically, data that describes the stateof a user’s current session is recorded each time a click isperformed, and the aggregation of that produces a clickstream,which can be used to reconstruct all actions taken by the userwhile he or she utilized that product.
While applicable to a variety of scenarios, the collection andanalysis of clickstreams has become most notably popular inthe context of Web-based tools and websites. As highlightedby Srivastava et. al. [9], the analysis of such information haspotential applications in a number of areas such as website per-sonalization and modification, system improvement, businessintelligence, and usage characterization. Our contribution aimsto cater to all of these facets of web based content delivery.
A. Data
The data we utilized for this study originated from a largeU.S.-based media communications company that operates inthe radio, TV, newspaper and online media domains. Thiscompany also manages a few dozen media websites, all ofwhich are equipped to capture clickstreams of their visitors.
As part of the data collection process, user activity iscontinuously captured by numerous servers across the country,and is then concatenated at the end of the day in the formof daily “dumps”. We utilized 59 of these files that coveredthe period ranging from December 4, 2012 to January 31,2013. Altogether, they contain an upwards of 65 million clickinstances.
Each click instance recorded is characterized by a largenumber of features (161 in this case). Table I lists a smallsubset of the most relevant features, and a brief description ofeach. With that information we are able to determine (1) howusers reached the website, (2) what attracted them there, (3)what actions they performed while on the site, and (4) howthey eventually exited.
Note that while there is no feature that captures the event ofa user leaving the website, we followed the industry standardand assumed that when users are inactive for a period longerthan 30 minutes (i.e., no click events originate from themduring that time), they have likely exited the site [20].

Feature Type Feature Name DescriptionNominal
Browser The browser that was usedChannel The site that the page view belongs toCity The city the user accessed the page fromCookies Whether the user had cookies turned on or notCountry The country the user accessed the page fromDomain Domain of the user’s ISPExclude hit Identifies web crawlersFirst hit page URL the user first landed on the websiteFrequency of visits Denotes hourly, daily, weekly, monthly or yearly visitIP Refers to the IP address of the userNew visit Determines whether the user is new to the site, based on cookiesReferrer Lists the URL of the website that referred this userRegion Refers to the state or region the user was inSearch Keywords The search string which led to the particular pageSection The section of the website where the click took placeSubsection Subsection of the website where the click took place
NumericFirst hit time Timestamp of when the user first landed on the websiteLast click Time stamp of when the last click was made by the userLast visit Refers to when the user visited the site lastTime & Date Timestamp of when the click instance happenedVisit number Refers to the number of times the user has visited the site
TABLE I: Dataset features described. The above table is a description of the most important subset of features in the data.
This assumption allows us to group these click events fromthe original data into user sessions, which illustrate the patha user takes while browsing the website, and can be usedto identify areas that attract more (or less) traffic. Figure 2illustrates one individual session chosen at random from ourdata. We can see that the user in this case was referred to thedomain through a link that they found on a social networkwebsite, and that their visit consisted of several hops, most ofwhich happened in the news section.
Aggregating these sessions allows us to visualize whichareas of the website are more popular, as well as which linksconnecting different sections are traversed the most. Take forinstance the example illustrated in Figure 3. To generate thisparticular figure, we isolated the sessions corresponding toa certain newspaper’s website, its 12 most popular sections,and the traffic between them. Among other observations, wenoticed that the readers of this particular newspaper websitewere often prone to navigating to the sports section andreading multiple articles there.
Lastly, we note that based on information retrieved fromspecific features of our data, it is also possible to determine ifa user is simply browsing text-based articles, viewing imagegalleries, or streaming online video. In the following sections,this property of our dataset is used to aid in the developmentof predictive models for video viewership engagement.
IV. METHODS
In the context of the clickstream data representation asper Section III, we revisit the problem statement in termsof identification of class boundaries (video exit points), dataparameters, and eliminate redundant/non-important features.We provide the relevant details in the following subsections.We then quantify user engagement using survival analysisand create a predictive framework to answer the question ofwhen a given user is likely to exit given video content and
whether they would exit early. Since the models must resultin actionable insights and be explanatory, we also used simplemodels such as Naive Bayes and Decision Tables, in additionto decision trees and ensemble methods.
A. Identification of Video Exit Instances
When a user clicks a link that redirects them to a video,a flag is activated and from then on, while the user remainsconnected to that video, a separate log entry is made every timehe or she finishes watching a certain percentage of that stream.Further, to ensure that this streaming activity can be uniquelyidentified, a player ID value remains constant. Concretely, thismakes the corresponding clickstream log reflect a cumulativehistory of the viewer’s progress within that video, with newentries being added to it at the 25, 50, 75 and 100% videocompletion marks.
Table II illustrates how video streaming events are recordedas part of the overall user clickstream. In that example, a useridentified by his IP address arrives to a video after clicking ona link to it likely found in a news article. The user exited thatvideo before reaching the 50% mark and immediately beganstreaming a different video, which was eventually watched tocompletion.
IP Address Media Type Player ID Percentage Complete
123.1.2.0 news article - -123.1.2.0 video 100 0123.1.2.0 video 100 25123.1.2.0 video 101 0123.1.2.0 video 101 25123.1.2.0 video 101 50123.1.2.0 video 101 75123.1.2.0 video 101 100
TABLE II: Simplified clickstream representation of a videostreaming event.

Fig. 2: A simple illustration of the clickstream of a typicaluser
The above narrative can be obtained at scale for the entiredataset’s video viewers as follows. We obtain an individualuser’s browsing history on the monitored websites using theirunique visitor ID provided by the data collection tool. Theunique visitor ID is a persistent cookie which takes intoaccount factors like IP address and user agent. Their videoviewing history is marked by the corresponding entry in“media type”. Individual video player instances for a givenuser’s browsing session are assigned a player ID, which canbe used to distinguish between multiple videos being playedin the same session. The last entry in each video view for auser is considered to be their exit point for that video.
Due to nature of data collection of clickstreams in thisdataset, we get a coarse-grained estimate of when the userreached a certain percent of the video. Entries are made inthe clickstream upon starting the video, reaching 25%, 50%,75% and watching the video to completion. If the last entryshows that the user reached the 50% marker, it can be inferredthat the user exited at any point between 50% and 74% of thevideo.
Since one of our goals is to identify users who are likelyto exit a video stream early, we assume that users who exitthe video at the beginning, or having only reached the 25%
marker, to have exited “early”. As described above, this wouldcorrespond to users who have viewed 0 to 49% of the video(since the next marker only starts counting from 50% onward).
It should be noted that we can leverage two types of uniqueIDs towards different objectives— the unique visitor ID can beused in order to index users for segmentation and engagementstatistics for better personalization, whereas the video ID canbe used in order to index video content for feedback on howthat particular content was received. Thus, our frameworkoffers a pivotable user-centric and content-centric approach.
Fig. 3: Clickstream network for a news-media website. Thevarious nodes displayed here represent different sections. Thedirection of the arrows illustrates user traffic flowing betweenthese sections and the thickness is indicative of the volume ofsaid traffic.
B. Feature Selection
Using various feature selection methods, we reduced thesize of our dataset from the original 161 features to the 12overall best descriptors. Among these were features like IP,location, content annotations, and referrer information. Out ofthe 161 features in a typical video exit instance, we also foundthat 40 were mutually redundant, and 32 were constant invalue. This motivated the need to find a self-contained set offeatures that best described the target outcome variable (in thiscase, the percent of video the user watches before exiting).
Each of the applied methods aim to remove redundantor irrelevant features using different statistical means, all ofwhich having distinct strengths. Though a popular choice inmachine learning, correlation based feature selection (CFS)

was not considered due to the sparse nature of the data [21].For a more detailed coverage of specific feature selectionapproaches, we refer the reader to [22], [23].
Below we give a brief description of each method utilizedin this study:
1) Chi Squared: The chi squared (χ2) method measureshow much deviation is seen in the observed data whencompared to the case where the class and feature values areindependent of each other. It evaluates whether the feature andclass co-occurrences are statistically significantly related.
2) Information Gain: Information gain [24] measures theamount of information about the class being predicted, whenonly a single feature and the corresponding class distributionare available. More specifically, it quantifies the expectedreduction in entropy (uncertainty associated with a randomfeature).
3) Gain Ratio: A known drawback of information gain isthat it favors features that are take a large number of valuesin the data. To address that issue, gain ratio [25] performsa similar measurement while attempting to reduce that biasby taking into account the number and size of the subsetsthat would be created when using each feature to partition thedataset.
4) One R: One R formulates a set of simple relationshipsbetween each of the available features and the correspondingclasses. It then ranks these features based on the error rateproduced by their associated rules.
5) Symmetric Uncertainty: Similar to gain ratio, symmetricuncertainty [26], [27] aims to compensate for the inherentbias associated with information gain measurements. In thisspecific case, that is achieved by dividing the information gainvalue by the sum of the feature and class individual entropies.
A summary of our feature selection exercise is presented inTable III. The features in the table are the ones which appearin the top 10% most frequently. These features can be said tomost consistently indicate the likelihood that a user will exita video at a given point.
The time of viewing influences at what point people areprone to exit the video. IP address, in conjunction withlocation, and ISP indicate who is watching the video and thusoffer a personalized facet to the prediction. The data collectiontool we used also provides its own cookie-based unique visitorID. The number of pages viewed by a person and frequency ofvisits can be perceived to be reflective of the person’s interestin the site. The referrer which brought the viewer to the sitecan influence the viewer’s engagement; a viewer coming froma social network link interacts differently than one who hadthe site bookmarked on their browser. The entry point is thefirst page the viewer saw in their current viewing session;this determines their interest in consuming further content.The actual title of the story includes the section which thevideo is under. As we had observed in Figure 1, users viewing“Weather” related videos were empirically less likely to exitthan those viewing “News” related videos.
Features Chi IG GR oneR SymmTime 1 1 7 - 2IP 2 2 9 - 3First hit referrer 3 3 5 2 5First hit page 4 5 10 - 7Story title 5 4 2 1 1Search engine 6 7 3 3 8City 7 6 - - 9ISP 8 8 - - 10Referrer type 9 10 1 - 4# Pages viewed 10 9 8 - 6Search page num - - 4 4 -Frequency of visits - - 6 5 -
TABLE III: Feature Selection Rankings.
C. Survival Analysis
In order to statistically quantify what type of content isthe most engaging for users, and what type of users respondpositively to such content, we use a survival analysis model.This serves the dual purpose of segmenting content in termsof viability, as well as users in terms of engagement. Underthe assumption that a user has been inactive for more than 30minutes, we have an uncensored list of video exit events.
We isolate each video exit event and create a list of such“last known” video view clickstream logs. We would like toinvestigate the role of session duration on early exit behaviorin users; so, we use it to measure when the user stops watchingthe video. A “birth” event would be registered when a userviewing video content makes their first click in the session. Itis to be noted that this may or may not be a click pertainingto video content. A “death” event corresponds to an early exit,as defined in Subsection IV-A above.
Each of these events is characterized using the feature-set obtained in Subsection IV-B. This provides customizedgroupings according to each feature value in the data. Sincewe are observing the full extent of the user’s interaction withthe site’s content from individual “birth” to “death” events,there is no left or right censoring at play.
We fit a Kaplan Meier model [28] to estimate the survivalfunction for each of these events in the data. The survivalfunction is a probabilistic estimate of whether the user willstop watching the video prematurely. The survival functionestimate used in this paper is as per [29].
S(t) =∏ti<t
ni − dini
Here, di is the number of death events at time t and ni isthe number of subjects at risk of death just prior to time t.From this survival function, we get a global estimate, as well asfeature-wise groupings of segments of users and correspondingcontent. This approach is implemented in the Python package“lifelines” [30], which was used in this paper.
The survival curve, as shown in Figure 4, is a graphicalrepresentation of the probabilistic model learned from the data.The “timeline” represents the session length (in seconds) upto the point of viewing the video. The Y-axis represents theprobability of a user’s “survival”, which, in this case is the

event where they continue to watch more than 50% of thevideo content. Since the survival function is based on the ideathat the number of “deaths” is a non-decreasing function, thesurvival curve itself is a non-increasing function of time.
0 5000 10000 15000 20000 25000 30000 35000 40000
timeline
0.0
0.2
0.4
0.6
0.8
1.0
KM_estimate
Fig. 4: The overall survival curve for video viewership in theclickstream data. The vertical axis represents probability ofthe user watching at least half of the video content.
D. Classification
Our aim in this specific scenario is to predict how muchof the video a user will likely watch before exiting. Inour dataset, we find that this is represented by 5 distinctmarkers (as previously mentioned and illustrated in table II),which correspond to the percentage of the video the userwatched before exiting. Using these markers as our classes, weformulate two classification tasks – to predict what percentageof the video is watched, and whether the user exits the video“early” (before reaching the 50% mark).
The latter can essentially be seen as the binary prediction ofthese “early exits”. The classes would then be a merger of thepreviously mentioned 5 classes, with the first two combinedto form that of “early exits”, and the latter 3 being thosewho did not exit early. This simplification is depicted in therepresentative expected confusion matrices for both of theclassification tasks in Figure 5.
To generate predictions for each of these scenarios, weutilized a variety of classification methods. When selectingthese classifiers, we took several factors into consideration,keeping in mind that while the ultimate goals was to producepredictions that are highly accurate in nature, we also had toensure that a good degree of interpretability existed so as toallow businesses to quickly derive actionable insights from themodels, as well as explain them. For that reason, the range ofmethods we evaluated covered models from simplistic to morecomplex. We present the results yielded by five of these, anda brief description of each follows.
1) Naive Bayes: Among the simplest and most primitiveclassification algorithms, this probabilistic method is based onthe Bayes Theorem [31] and strong underlying independence
Fig. 5: Converting the Percentages Classification to Early ExitClassification: The 5 class problem (top) is reduced to a binaryclassification problem by merging classes (bottom).
assumptions. That is, each feature is assumed to contributeindependently to the class outcome.
2) C4.5 Decision trees: C4.5 Decision Trees [25] work bybuilding a tree structure where split operations are performedon each node based on information gain values for each featureof the dataset and the respective class. At each level, theattribute with highest information gain is chosen as the basisfor the split criterion.
3) Repeated Incremental Pruning to Produce Error Reduc-tion: RIPPER [32] is a rule based classification tree learner.It is algorithmically faster than C4.5, having a complexity ofO(n(log(n))2) as opposed to C4.5’s complexity of the orderO(n3). RIPPER constructs an initial set of rules and theniteratively optimizes it according to a tunable parameter.
4) Decision Tables: Decision Table classifiers [33] are builtby concatenating a series of rules derived from the featureset to corresponding class outcomes. This method has as itsmajor advantage the fact that it is easy to interpret and notably

Dataset Classifier Acc AUROC
NB 0.416 0.718
C4.5 0.547 0.699
Multiclass RIP 0.547 0.629
DT 0.543 0.717
ST 0.569 0.652
NB 0.772 0.753
C4.5 0.809 0.794
Binary RIP 0.826 0.697
DT 0.806 0.805
ST 0.846 0.739
TABLE IV: Summary of results obtained for each classifierand dataset. The classifiers used are NB: Naive Bayes, C4.5:C4.5 decision tree, RIPPER: Repeated Incremental Pruning toProduce Error Reduction, DT: Decision Table, ST: Stackingusing random subspaces of decision trees
efficient.5) Stacking: Stacking [34] is a meta-classification scheme
which employs an ensemble of classifiers and performs thelearning task on two levels. First, the classifiers in the ensem-ble are trained on the data, then the meta-classifier learns fromtheir predictions and the training labels of the data.
E. Key Performance Metrics Utilized
Our key performance indices are the accuracy of predictionof when the user will drop-off in the video, and the area underthe ROC curve for the classifier. To generate our predictions,we perform 10-fold cross-validation on the available data usingvarious classification methods. In 10-fold cross validation, thedata is randomly partitioned into 10 equal-sized subsets, 9 ofwhich are used for training, with the remaining portion servingas the test set. The process is repeated multiple times untilall 10 subsets have been used for testing. These predictionsare then aggregated to provide the overall performance of theclassifier.
The baseline for the performance metrics corresponds to aperfectly random predictor. For a binary classification prob-lem, this would be 50% accuracy and 0.5 area under the ROCcurve. For a 5 class problem, the baseline accuracy would be20% and the baseline area under ROC curve can be calculatedas per [35]. Any classifier which delivers statistically greateraccuracy than these respective baselines, is considered to bebetter than a random predictor.
A system tuned to increase accuracy does not necessarilymake it a good predictor. Relying on accuracy alone does notprovide insights into the nature of misclassified instances, andcan be deceiving when the provided class is imbalanced. ROCcurves are a way to quickly compare multiple classifiers.
V. EXPERIMENTAL RESULTS
The methods described in Section IV aim to quantifyengagement and create predictive models for the clickstream
data. In this section, we present and discuss the results ofeach of these overarching tasks first by elaborating on theoutcomes observed from our survival analysis, followed byour classification task results.
A. Survival Analysis
Though the Kaplan Meier survival function as per Figure 4gives us a global estimate of engagement in terms of sessiontime, the true strength of this analysis lies in segmenting theseaggregate statistics into actionable feature-wise insights. Wesegment users based on their feature values, and highlighttrends and usable insights from their survival curves. Ingeneral, between two survival curves, the more “engaged” oneis the curve which is significantly higher than the other interms of survival function value. Each of the results displayedalso contains the global estimate labeled KM estimate. Wedisplay some of the salient results from the survival analysisbelow:
1) Website:Since the media communications company in our datamanages multiple websites, it becomes an interestingstudy to compare engagement across them. We can usethe survival analysis results as a metric to compareand rank websites delivering similar video content interms of viewer engagement. In Figure 6, we can seethat Website #1 is clearly more engaging than the rest,whereas Website #4 is less engaging than the averagefor all users.
2) Content Type:Viewer acceptance of contents of various types servesas valuable feedback to content providers, as well ascontent production. In our data, each video instancehas been tagged with a singular content category bythe content provider. As per Figure 7, we can see thatusers differ in their amount of engagement when itcomes to type of video content. One can see that livecontent starts off as being significantly more engagingthan any other content type, and progressively becomesless engaging as time elapses. News content is the leastengaging throughout user sessions. Not only does thisanalysis help evaluate content production, but it alsohelps segment out the user-base in its taste.
3) Referrer Type:Whether a user was directed to the content via somereferrer or directly searched for such content influencestheir level of engagement at the very outset. Figure 8clearly shows that users who arrive at a video vialinks from the same site tend to stay significantly moreengaged than average. On the other hand, users wholand on content using bookmarked links tend to exitmuch earlier than average. This could be due the thembeing prone to more targeted sessions. Search enginereferrals can be used as a metric of how accessible thenews site’s results are for a given search engine. Socialnetwork referrals can reflect on the marketing efficiencyof certain news items.

0 5000 10000 15000 20000 25000 30000 35000 40000
timeline
0.0
0.2
0.4
0.6
0.8
1.0
KM_estimate
Website #1
Website #2
Website #3
Website #4
Fig. 6: Survival Curves for various websites. These offer avisual comparison of website engagement. Website #1 is moreengaging than the rest of the websites depicted here.
4) Time of Last Visit:One would expect that the time of the user’s last visitwould be indicative of their future level of engagement,but as the data suggests in Figure 9, the survival curvesare significantly similar. Someone who hasn’t visitedthe site in more than 30 days has the same level ofengagement as someone who visited recently within thepast 24 hours. This can also be attributed to the fact thatthis feature is dependent on cookie data, which upondeletion by user, resets the “last-visited” date to NULL.Since it is prone to a lot of user-intervention and noise,it proves to be a bad indicator of engagement. Non-obvious insights like this make the use of data-driventools invaluable. One would thus expect the importanceof this feature to be very low as per the discussion inSubsection IV-B and Table III.
B. Classification
We evaluated the performance of each of the classifiersused, with 10-fold cross validation for both the multiclass andthe binary classification predictions. Table IV summarizes theresults of all experiments.
Both tasks have slightly different objectives– the multiclassproblem aims to find out when the user is likely to stopviewing the video, whereas the binary format attempts topredict whether the user will stop viewing the video at an earlystage or not. We use multiclass prediction in this data sincethe objective class (% of video content viewed) is recordedas a discretized ordinal variable. In the event where one has acontinuous numeric value for percentage video viewed, it canbe discretized and treated as a multiclass problem.
1) Multiclass Prediction: We see that in terms of overallaccuracy, the stacked classifiers performed slightly better thanthe other methods, achieving an accuracy of 56.9%. Withregards to AUROC, however, it is seen that Naive Bayes
0 5000 10000 15000 20000 25000 30000 35000 40000
timeline
0.0
0.2
0.4
0.6
0.8
1.0
KM_estimate
business
cont
ent
live_video
news
politics
tech
wthr
Fig. 7: Survival Curves segmented by content type. This servesas feedback for content providers, as well as to segment theuser-base.
0 5000 10000 15000 20000 25000 30000 35000 40000
timeline
0.0
0.2
0.4
0.6
0.8
1.0
KM_estimate
social network
internal
external
search engine
bookmarked
no JS
social network
Fig. 8: Survival Curves for various referrer types. Users whoarrive using bookmarks tend to have more targeted browsingsessions.
performs much better, closely followed by Decision Tables.These simple classifiers might not have the best accuracy, butthey outperform the others based on more informative metrics.Further, because of their simplicity and efficiency, such modelsare, in fact, better suited for deployment in a real productionscenario.
2) Binary Class Prediction: In this second scenario, weassociate a semantic meaning to the drop-off percentage pointand predict if the user will exit early or not. This refinementof the problem statement gives us a much better performanceacross the board. The stacked classifiers, for instance, achievea remarkable accuracy of 84.6% when predicting which usersexited their video streams prematurely. As it was the case withthe multiclass problem, we again saw that Decision Tables

0 5000 10000 15000 20000 25000 30000 35000 40000
timeline
0.0
0.2
0.4
0.6
0.8
1.0KM_estimate
Missing Data
Less than 1 day
Less than 7 days
More than 7 days
First Visit
More than 30 days
Cookies Not Supported
Fig. 9: Survival Curves for various user visit frequencies. Userswho have markedly different visiting patterns show similarsurvival curves.
and Naive Bayes surpassed the other classifiers in terms ofAUROC values.
Though stacked classifiers give greater accuracy, they arenot as good as Decision Tables or Naive Bayes in predictingearly drop-off. This is still reflective of the general trendsobserved in the multiclass problem as though we have merelymerged classes, the underlying data remains the same.
In both, the multiclass and binary class prediction, it isobserved that simpler rule based learners outperform compli-cated meta-classifiers. This is documented in [36], showingthat stacking does not always outperform the best classifier.
0
0.2
0.4
0.6
0.8
1
0 0.1 0.2 0.3 0.4 0.5 0.6 0.7 0.8 0.9 1
True
pos
itive
rate
False positive rate
naive bayesc4.5
ripperdecision table
stacking
Fig. 10: ROC curves for the binary class problem. A compar-ison of various classifiers to predict early exit behavior.
We see that simple classification algorithms can be used toachieve comparable, or even better performance than the morecomplex classifiers, including ensemble methods. Besides theperformance superiority, it might be more desirable to usesimpler classifiers on grounds of computational complexity aswell as comprehensibility.
VI. CONCLUSIONS
We demonstrated how clickstream data can be utilized toquantify and predict user engagement to online videos. Forthat task, we explored a large number of features and identifieda subset of 12 that were deemed most important by a numberof different feature selection algorithms. We used survivalanalysis to quantify the “engagement level” of content withthe user. Finally, we used classification algorithms to predictwhat might be the exit point of a user in a video stream.Our work provides a foundation to understand and quantifyvideo engagement using click-stream level behavioral data,which can then be used by media companies to not onlyproactively personalize video distribution, but also to aid invideo advertisement placement, and on deciding the optimalvideo length for any given content category.
The scope of engagement can be expanded beyond the realmof video content, making it a viable solution for any web-based content delivery solution. With the capacity to modelthis particular behavior, media companies can take a proactiveand personalized approach to how they produce and delivernew content, precisely adapting that strategy so as to optimizeviewership retention. Businesses can make use of this paper asa prescriptive blueprint for engagement analysis of their onlinecontent. This is facilitated by all of the methods being off-the-shelf techniques. Our analysis suggests that non-obviousfeatures such as time of the day and referrer type, can be strongpredictors of whether or not a given user will watch a video toits completion. This solution serves the dual purpose of usersegmentation and the provision of key performance indices toquantify content and news channel effectiveness.
REFERENCES
[1] J. B. Schafer, J. Konstan, and J. Riedl, “Recommender systems in e-commerce,” in Proceedings of the 1st ACM conference on Electroniccommerce. ACM, 1999, pp. 158–166.
[2] Z. Huang, W. Chung, T.-H. Ong, and H. Chen, “A graph-based recom-mender system for digital library,” in Proceedings of the 2nd ACM/IEEE-CS joint conference on Digital libraries. ACM, 2002, pp. 65–73.
[3] J. Bennett and S. Lanning, “The netflix prize,” in Proceedings of KDDcup and workshop, vol. 2007, 2007, p. 35.
[4] D. A. Davis, N. V. Chawla, N. A. Christakis, and A.-L. Barabasi, “Timeto CARE: a collaborative engine for practical disease prediction,” DataMining and Knowledge Discovery, vol. 20, no. 3, pp. 388–415, 2010.
[5] B. Clifton, Advanced web metrics with Google Analytics. John Wiley& Sons, 2012.
[6] M. Mulvenna, A. Buchner, M. Norwood, and C. Grant, “The soft-push:mining internet data for marketing intelligence,” in Working Conference:Electronic Commerce in the Framework of Mediterranean CountriesDevelopment, Ioannina, Greece, 1997, pp. 333–349.
[7] M. Mulvenna, M. Norwood, and A. Buchner, “Data-driven marketing,”Electronic Markets, vol. 8, no. 3, pp. 32–35, 1998.
[8] A. G. Buchner and M. D. Mulvenna, “Discovering internet marketingintelligence through online analytical web usage mining,” ACM SigmodRecord, vol. 27, no. 4, pp. 54–61, 1998.

[9] J. Srivastava, R. Cooley, M. Deshpande, and P.-N. Tan, “Web usagemining: Discovery and applications of usage patterns from web data,”ACM SIGKDD Explorations Newsletter, vol. 1, no. 2, pp. 12–23, 2000.
[10] X. Dreze and F.-X. Hussherr, “Internet advertising: Is anybody watch-ing?” Journal of interactive marketing, vol. 17, no. 4, pp. 8–23, 2003.
[11] A. Banerjee and J. Ghosh, “Clickstream clustering using weightedlongest common subsequences,” in Proceedings of the web miningworkshop at the 1st SIAM conference on data mining, vol. 143. Citeseer,2001, p. 144.
[12] A. L. Montgomery, S. Li, K. Srinivasan, and J. C. Liechty, “Modelingonline browsing and path analysis using clickstream data,” MarketingScience, vol. 23, no. 4, pp. 579–595, 2004.
[13] R. E. Bucklin and C. Sismeiro, “A model of web site browsing behaviorestimated on clickstream data,” Journal of Marketing Research, pp. 249–267, 2003.
[14] W. W. Moe, “Buying, searching, or browsing: Differentiating betweenonline shoppers using in-store navigational clickstream,” Journal ofConsumer Psychology, vol. 13, no. 1, pp. 29–39, 2003.
[15] J. R. Hauser, G. L. Urban, G. Liberali, and M. Braun, “Websitemorphing,” Marketing Science, vol. 28, no. 2, pp. 202–223, 2009.
[16] A. S. Das, M. Datar, A. Garg, and S. Rajaram, “Google news person-alization: scalable online collaborative filtering,” in Proceedings of the16th international conference on World Wide Web. ACM, 2007, pp.271–280.
[17] J. Liu, P. Dolan, and E. R. Pedersen, “Personalized news recommenda-tion based on click behavior,” in Proceedings of the 15th internationalconference on Intelligent user interfaces. ACM, 2010, pp. 31–40.
[18] F. Dobrian, V. Sekar, A. Awan, I. Stoica, D. A. Joseph, A. Ganjam,J. Zhan, and H. Zhang, “Understanding the impact of video qualityon user engagement,” SIGCOMM-Computer Communication Review,vol. 41, no. 4, p. 362, 2011.
[19] J. Kim, P. J. Guo, D. T. Seaton, P. Mitros, K. Z. Gajos, and R. C. Miller,“Understanding in-video dropouts and interaction peaks in online lecturevideos,” in Proceedings of the first ACM conference on Learning scaleconference. ACM, 2014, pp. 31–40.
[20] Omniture, “White paper: SiteCatalyst Metrics- Visits and UniqueVisitors,” 550 East Timpanogos Circle, Orem, Utah 84097,April 2008. [Online]. Available: http://www.webmetric.org/whitepaper/Unique Visitors.pdf
[21] M. A. Hall, “Correlation-based feature selection for machine learning,”Ph.D. dissertation, The University of Waikato, 1999.
[22] Y. Yang and J. O. Pedersen, “A comparative study on feature selectionin text categorization,” in ICML, vol. 97, 1997, pp. 412–420.
[23] G. Forman, “An Extensive Empirical Study of Feature Selection Metricsfor Text Classification,” The Journal of Machine Learning Research,vol. 3, pp. 1289–1305, 2003.
[24] J. R. Quinlan, “Induction of decision trees,” Machine Learning, vol. 1,no. 1, pp. 81–106, 1986.
[25] Quinlan, John Ross, C4.5: Programs for Machine Learning. MorganKaufmann, 1993, vol. 1.
[26] Witten, Ian H and Frank, Eibe, Data Mining: Practical MachineLearning Tools and Techniques. Morgan Kaufmann, 2005.
[27] J.-H. Eom and B.-T. Zhang, “Machine learning-based text mining forbiomedical information analysis,” Genomics & Informatics, vol. 2, no. 2,pp. 99–106, 2004.
[28] E. L. Kaplan and P. Meier, “Nonparametric Estimation from IncompleteObservations,” Journal of the American statistical association, vol. 53,no. 282, pp. 457–481, 1958.
[29] J. P. Costella, “A simple alternative to kaplan-meier for survival curves,”Peter MacCallum Cancer Centre Working Paper (No, 2010.
[30] C., Davidson-Pilon, “Lifelines,” https://github.com/camdavidsonpilon/lifelines,commit = 63fc4f0ada0c61248957a478f3544efb4eeb2ccf, 2015.
[31] M. Bayes and M. Price, “An essay towards solving a problem in thedoctrine of chances. By the late Rev. Mr. Bayes, communicated byMr. Price, in a letter to John Canton, M.A. and F.R.S.” PhilosophicalTransactions (1683-1775), pp. 370–418, 1763.
[32] W. W. Cohen, “Fast effective rule induction,” in ICML, vol. 95, 1995,pp. 115–123.
[33] R. Kohavi, “The power of decision tables,” in Machine Learning:ECML-95. Springer, 1995, pp. 174–189.
[34] D. H. Wolpert, “Stacked generalization,” Neural networks, vol. 5, no. 2,pp. 241–259, 1992.
[35] T. Fawcett, “An introduction to ROC analysis,” Pattern recognitionletters, vol. 27, no. 8, pp. 861–874, 2006.
[36] S. Dzeroski and B. Zenko, “Is combining classifiers with stacking betterthan selecting the best one?” Machine learning, vol. 54, no. 3, pp. 255–273, 2004.