predicting nonelective hospitalization:
TRANSCRIPT

Predicting Nonelective Hospitalization: A Model Based on Risk Factors Associated with Diabetes Mellitus
DAVID M. SMITH MD, MORRIS WEINBERGER, PhD, BARRY P. KATZ, PhD
Nonelective hospitalizations for urgent or emergent reasons are frequent events for pat ients with diabetes mellitus, and their occurrence is difficult to predict. A model for pred/ct- ing nonelective hospi tal iz~ions is described. It is l ~ s e d on risk factors: prior visits to the emergency room, hFpoa/bu- minemla, cardiomegaly, anemia, systolic hFpotension, and hyperglycemia. To test the model, the authors conducted a prospect ive cohort s tudy in which 429 ambu/atory patients with diabetes mellitus were stratified into three risk levels for hospitalization and followed for two Fears. Patients in higher risk groups were more l ikely to be hospitalized (high risk, 58.1%; medium risk, 40.2%; low risk, 26.6%, p<O.OJ) and had more hospitalizations per patient (1.47 vs. 0.80 vs. 0.46, p < 0.01) and more hospital days per txrtient (14.6 vs. 8.6 vs. 5.3, p<O.Ol) . When the two-year study period was divided into four s/x-month intervals, there w a s no signifi- cant diHerence across the four periods. 7"bb study demon- strates the validi ty of the model for predicting nonelective hospitalizations of patients with diabetes mellitus over time. Key words: diabetes mellitus: patient admissions; ambula- tory care; hospitalization; appointments and schedules. J GEN INTERN MED 1987;2:168- 173.
NONELECTIVE HOSPITALIZATIONS, those for urgent or emergen t reasons, a re adve r se outcomes for ambu- latory patients. For patients with d iabetes mellitus, who m a y a v e r a g e 5,000 hospital days per 1,000 pa- tients per year , ]" 2 and who a re likely to be hospital- ized for complications of their disease, nonelect ive hospitalizations a re frequent occurrences. 3
Although the f requency of hospital days indi- cates a major heal th ca re problem, there is very little addit ional epidemiologic information avai lable in the literature. For example, we lack information about methods to identify high-risk patients and the risk factors re la ted to hospitalization. Such informa- tion is important b e c a u s e grea te r precision of pre- diction would facilitate sample size estimates for clinical trials, would provide ideas for interventions to be tested, and might l ead to better prospective paymen t schemes.
This center has repor ted a model for predicting nonelect ive hospitalizations among ambula tory pa-
Received from the Regenstrief Institute for Health Care, the Divi- sions of General Medicine and Biostatistics of the Department of Medicine, Indiana University School of Medicine. and the Veterans Administration Medical Center, Indianapolis, Indiana.
Presented at the American Federation for Clinical Research meet- ings, Washington, D.C., May 1986.
Supported in part by Public Health Services Research Grant P60 20542 from the National Institutes of Health.
Address correspondence and reprint requests to Dr. Smith: The Regenstrief Institute for Health Care, 1 O01 W. Tenth Street, Indianapolis, IN 46202.
tients with d iabetes meUitus. 3 The model was the re- sult of a retrospective, case-control study and was b a s e d on the characterist ics of patients on the last office visit prior to hospitalization in 1977-78. The outcome var iable was the occurrence or nonoccur- rence of a single nonelect ive hospitalization per pa- tient. The objectives of the present investigation were: 1) to test the model in a prospect ive cohort study; and 2) to determine whether predictions of one or more nonelect ive hospitalizations were con-
sistent over time.
M E T H O D S
Study Sample
Patients who had diabetes mellitus were se- lected from patients a t tending the Gene ra l Medicine Clinic at the Regenstrief Health Center, the outpa- tient facility for Wishard Memorial Hospital. The hos- pital and clinic a re central ly located in metropoli tan Indianapolis, Indiana, a n d accep t all patients re- gardless of their financial status. The Gene ra l Medi- cine Clinic, the medicine wards, and the emergency room of Wishard Memorial Hospital a re a t t ended by housestaff and full-time faculty members of the In- d i ana University School of Medicine's Depar tment of Internal Medicine. Continuity of ca re is provided in the clinic by these physicians, e ach of whom sees a relatively constant pane l of patients. A total of 11,341 patients a t t ended the Gene ra l Medicine Clinic during the y e a r of enrollment. Of these, 1,877 were being t rea ted with antidiabetic agents, a prev- a l ence of 16.6%.
Selection Criteria
A patient was en te red into the study within a week following his or her visit if the patient: 1) h a d h a d insulin or oral hypoglycemic agents prescr ibed or continued on that visit; 2) s tated that he or she rece ived all medical ca re at this center; 3) was not a resident of a nurs!ng home or other institution; 4) was 15 yea r s of a g e or older; 5) had visited the clinic in the preceding year ; and 6) h a d a scheduled return appointment to the Gene ra l Medicine Clinic. Of the 1,877 patients being t rea ted with antidiabetic agents, 79% fulfilled the remaining criteria. Consec- utive patients (n = 429) meet ing the criteria were enrolled as they a t t ended the clinic over a seven- month enrollment period, May - November 1983. By
168
JOURNAL OF GENERAL INTERNAL MEDICINE, Volume 2 (May/Jun), 1987 169
these criteria, patients who did not h a v e a scheduled appointment or did not show up for a scheduled ap- pointment during the enrollment period were not enrolled.
Previous studies at this center identified cha rac - teristics assoc ia ted with hospitalization of ambu- latory patients being t rea ted with antidiabetic agents. 3 The l inear discriminant analys is model for predicting hospitalization used the following formula: Discriminant s c o r e = 0 . 7 5 8 (number of e m e r g e n c y room visits in preceding six months) + 1.851 (presence of serum albumin -<3.7 g /d l = 1, a b s e n c e = 0) 4 0.989 (presence of ca rd iomega ly on chest x-ray = 1, a b s e n c e = 0) + 0.856 (presence of anemia , females < 12 g /d l hemoglobin, males <14 g /d l hemoglobin = 1, ab sence = 0) + 1.067 (presence of most recent systolic blood pressure -< 115 mm Hg = 1, a b s e n c e = 0) + 0.564 (presence of most recent blood glucose)> 280 m g / d l = 1, a b s e n c e = 0) - 1.017.
A f requency distribution of discriminant scores from the previous study s showed that about a third of the sample had no risk factors (i.e., a score of --1.017). Because of this clustering of scores at one point identifying a homogeneous low-risk group, an- other point (approximating 66th percentile) in the f requency distribution was chosen to s epa ra t e me- dium- from high-risk patients. This point, 0.300, was also the point of equal misclassification error (mid- point be tween centroids) from our previous study. 3 Thus, b a s e d on discriminant scores patients were stratified into three levels: high-risk (~0.300), me- dium-risk (<0.300 but ~- -1 .017) , and low-risk (--1.017, the minimum score).
Follow-up
The patients cont inued their usual ca re a n d were followed for approximate ly two yea r s without addit ional intervention, with the following excep- tion. To minimize losses to follow-up, patients were reminded by mail to reschedule if there had been no contact with the institution for four months after a failed visit. If there was no response after two weeks, two phone calls were m a d e at different times during the day, and then evening and weekend calls were at tempted; for patients without phones, a second let- ter was sent. Four teen patients were lost to follow-up over the two years .
Ascertainment of Response Variables
Elective admissions were defined as those for non-urgent ly scheduled procedures . The most fre- quent of these were for ca ta rac t surgery, elective cholecystectomies, bronchoscopies, colonscopic ex- aminations, liver biopsies, and hernia repairs. All other admissions we re classified as nonelective. The
determinat ion of elective versus nonelect ive was done by two persons blinded to risk level, with con- cur rence grea te r than 90%. Disagreements were submitted to a third reviewer. The specific pa r ame- ters examined for nonelect ive hospitalizations were: the proportion of patients admitted; the m e a n num- ber of hospitalizations per patient; and the m e a n number of hospitalization days per patient. For e ach parameter , differences across risk levels were ex- amined for the entire two-year period and also for four successive six-month intervals. Data on hospi- talizations were obta ined from the Regenstrief Auto- ma ted Medical Records System (RAMRS), 4 the data- process ing tapes of Wishard Memorial Hospital, manua l medical record review, and interviews at closeout.
S e c o n d a r y response var iables included visit pat terns to the G e n e r a l Medicine Clinic, reasons for hospitalization, mortality, and nursing home place- ment. Data concerning appoin tmen t no-shows, kept scheduled appointments, walk-in visits, a n d pre- scription refills (not requiring provider contact) were obta ined from the RAMRS. Walk-in visits were de- fined as any visit not scheduled 48 hours before the time of arrival. Information about emergency room visits, results of labora tory ' tests, and deaths was also obta ined from the RAMRS. The pr imary diag- noses for admissions were obta ined by chart review by reviewers bl inded to risk level and coded accord- ing to ICD-9-CM. s Additional da t a on patients ' changing heal th c a r e systems, hospitalizations, and dea ths were obta ined from responses to marled ap- pointment reminders or phone calls. Data concern- ing deaths of patients lost to follow-up were also obta ined from the county heal th department .
CIoseout
The da te for closeout of e a c h patient was deter- mined by persons blinded to risk level using estab- lished rules. Examples of these rules are: 1) if the patient dies, moves outside the area , switches pri- ma ry ca re systems, or is institutionalized for longer than seven days, then the closeout da te is the da te this event occurred; 2) if a patient is emergent ly hos- pitalized e l sewhere and switches pr imary ca re sources after discharge, then the closeout da te is the da te of d ischarge from the other hospital; 3) if the patient is lost to follow-up (cannot be contac ted by phone or letter), then the closeout da te is the date of the last failed visit or last contact with our system, whichever is more recent. The purpose of these were to keep all patients in the study as long as it ap- p e a r e d r easonab ly certain that they were still under our care. For those patients who continued under our ca re there were addit ional rules. Examples of these rules are: 4) when follow-up time equals 700 days,

170 Smith eta/., PREDICTING NONELECTIVE HOSPITALIZATION
TABLE I
Baseline Risk Factors and Other Characteristics of Subjects among Three Risk-level Groups
Low Medium High Risk Risk Risk
(n = 116) (n = 140) (n = 173)
Risk factor Emergency room visits/6 months 0 (mean) 0.36 (mean) 0.99 (mean) Albumin <3.7 g/dt 0% 0% 29% Cardiomegaly 0% 28% 47% Hemoglobin, F < 12 g/dl; M < 14 g/dl 0% 19% 39% Systolic blood pressure <115 mm Hg 0% 9% 27% Glucose > 280 mg/dl 0% 30% 36%
DISCRIMINANT SCORE --'1.017 _+ 0 --0. t 89 +_ O. 193 1.609 + 1.140
Other characteristics Age Race, black Gender, female Taking insulin Taking oral agent Time in study
59.8 years (mean) 59.9 years (mean) 58.2 years (mean) 55.2% 67. t % 59.5% 64.7% 65.0% 65.3% 64% 72% 78%* 36% 28% 22%*
724.2 days (mean) 718.6 days (mean) 691.8 days (mean)
*Significantly different, p <0.01.
the patient is eligible for closeout as he (she) returns to clinic or ward; 5) when follow-up time is 730 days and the patient has no return appointment, an at- tempt is m a d e to close out by phone, or by letter ff no phone is avai lable . At closeout, patients were inter- v iewed as to heal th ca re obta ined at other sites. If the interview revea led a hospitalization elsewhere, da t a were obta ined from that hospital.
S t a t i s t i c a l Ana lyses
Outcome var iables such as hospitalizations a n d office visits were weighted by time in the study. In
this manner , da t a from patients who were followed for the entire study would be weighted more heavi ly than da ta from those followed for shor te r intervals. All subjects enrolled in the study were included in the ana lyses until their closeout dates. To examine the statistical significance of differences in base l ine characterist ics a n d outcome var iables across the three risk levels, chi-square tests for categorical da t a and analysis of va r i ance for continuous da ta were used. For the latter, Tukey's S tandard ized Range Test e was used to identify where differences a m o n g groups were present. In addition, a test for a l inear t rend in a proportion 7 was used to determine
TABLE 2
Nonelective Hospitalizations among Risk Levels
Low Medium High Overall Risk Risk Risk Risk
Nonelective hospitalizations (% patients admitted) 0 - 6 months in studyt 7 - 12 months in studyt
13 - 18 months in studyt 19- 24 months in studyt
O-24 months in studyt
Nonelective hospitalizations per patient (mean) 0 - 6 months in studyt 7 - 12 months in study*
13- 18 months in studyt 19- 24 months in studyt
0 - 24 months in studyt
Nonelective hospitalization days per patient (mean) 0 - 6 months in study* 7 - 12 months in study*
13- 18 months in studyt 19-24 months in study
0 - 24 months in studyt
9.7 11.1 25.1 16.4 8.4 15.5 23.8 16.8 8.9 15.2 24.0 16,9 8.8 14.5 25.7 17.2
26.6 40.2 58.1 43.5
0.11 0.15 0.35 0.22 O. 11 0.24 0.32 0.23 O. 10 0.23 0.40 0.26 0.13 0.18 0.41 0.26
0.46 030 1.47 0.97
1.3 1.7 3.4 2.29 1.3 2.5 3.6 2.63 1.0 2.2 4.1 2,59 1.7 2.2 3.6 2~61
5.3 8.6 14,6 10.09
* Significantly different, p < 0.05. tSignificantly different, p<O.01.

JOURNAL OF GENERAL [NTERNAL MEDICINE, Volume 2 (May/Jun), 1987 171
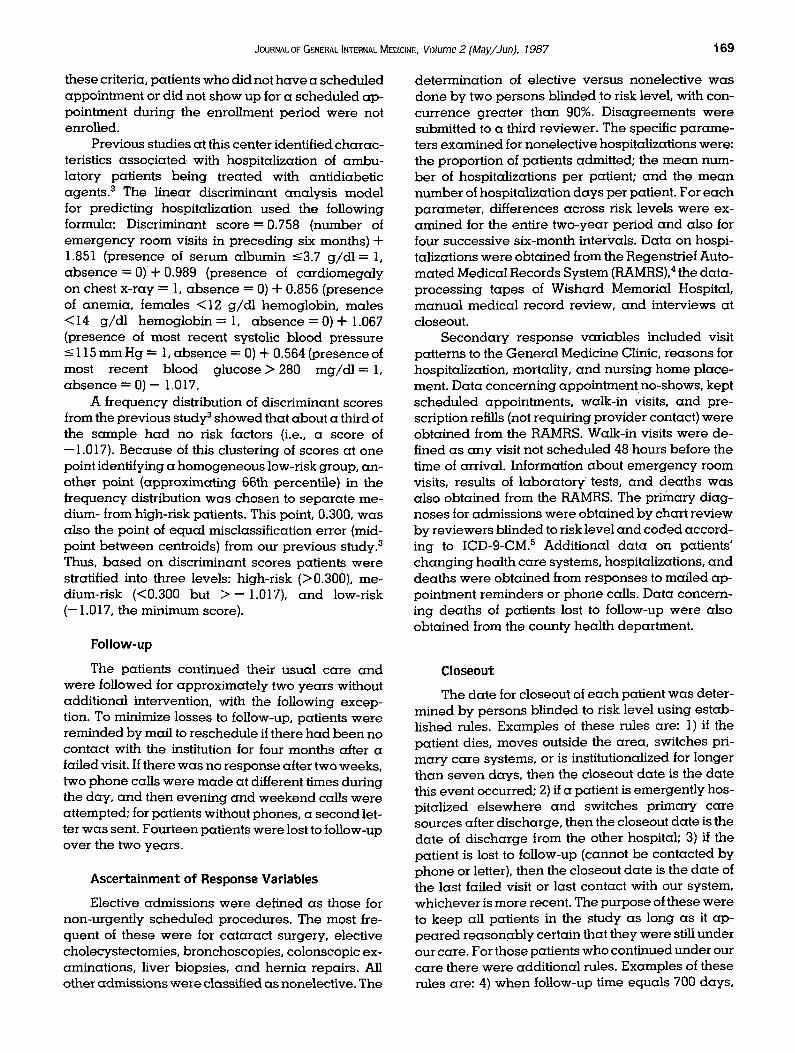
FIGURE 1. Incidences of admissions for specific diagnoses by risk groups. Crosshatched bars indicate the high-risk group; solid bars, the medium-risk group; interrupted cross-hatched bars, the low-risk group. The abbreviations for specific diagnoses are: DM = diabetes mellitus without mention of complications; CHF = con- gestive heart failure; F ulcer = foot ulcer or ulcer of lower limbs, except decubitus; CVA = cerebral thrombosis; Acid = diabetes with ketocidosis; angina = angina pectoris; MI = acute myocardial infarc- tion; C pain --- chest pain un- specified; pyelo = acute py- elonephritis; pneum = pneumonia; hypo = hypoglycemia.
P ¢2
0
¢0
n
¢D 0 C
t - O
E
.20 '
. 18 '
. 18 '
.14.'
. 12 '
. 1 0 '
. 0 8 '
. 0 6 '
.04"
. 0 2 '
O"
D . M .
CHF
F . u l c e r A c i d . M.h
CVA A n g i n a C . p a i n
Specific Diagnoses
P y e l o . H y p o .
P n e u m .
whether a trend existed across groups for baseline insulin use. To test whether the prediction was stable across times, a multivariate repea ted-measures analysis 8 across the four six-month periods was used for continuous variables. For categorical data, a l inear model was used. 9
RESULTS
Baseline Variables
Based upon their discriminant scores calculated at enrollment, patients were stratified into low- (n -- 116), medium- ( n = 140), and high-risk ( n = 173) groups for nonelective hospitalizations (Table 1). By definition, there were major differences across risk levels for each variable used to calculate the dis- criminant score. However, patients did not differ in age, race, gender, or length of time they were in the study. The higher-risk groups were more likely to be receiving insulin than to be taking oral hypoglyce- mic agents.
Primary Outcome Variable: Nonelective Hospitalizations
Nonelective hospital admissions predominated over elective admissions and accounted for 82% of all admissions and 86% of all hospital days . To ex- amine the consistency of the predictions, the two- yea r study was divided into 180-day intervals (ap- proximately six months). For the percentage of patients admitted and incidence of nonelective hos- pitalizations per patient, there were statistically sig- nificant differences across risk levels, but there was
no significant difference across time periods (Table 2). The relative risk for nonelective hospitalization (high-risk compared with low-risk groups) for the en- tire two-year period was 1.47/0.46, or 3.2. For non- elective hospital days, there was also no significant difference be tween time periods, and there were statistically significant differences across risk levels for all time periods except 19- 24 months.
The incidence of admissions per patient for the two-year study period for each risk level of each primary diagnosis with ten or more admissions is shown in Figure 1. These diagnoses are in order of frequency and r anged from 48 admissions for dia- betes meUitus (out of control) to ten admissions for hypoglycemic reactions. There were 112 different diagnoses, a n d the 11 shown accounted for 57.6% of the admissions. Figure 1 illustrates that certain rea- sons for hospitalization, such as diabetes mellitus, congestive hear t failure, foot ulcer, a n d diabetic ketoacidosis, were predicted well with relative risks > 3.2 when comparing with high- vs. low-risk groups. Other reasons for admission such as cerebral vascu- lar thrombosis (CVA) were not at all predicted. The remainder fell be tween these extremes. The inci- dences of hospitalizations for all other specific diag- noses grouped together (not shown) was 0.55, 0.36, and 0.23 for the high-, medium-, and low-risk groups, respectively.
Secondary Outcome Variables
Although the model identified groups at differ- ing risks for nonelective hospitalization, it was pos- tulated that these groups might also differ in some

17~, Smith et al., PREDICTING NONELECTIVE HOSPITALIZATION
TABLE 3 Secondary Outcome Variables over Two Years by Risk Level
Low Medium High Risk Risk Risk
(n = 116) (n = 140) (n = 173)
Elective admissions 18.1% 11.4% 16.2% Death* 3.4% 4.3% 10.4% Nursing home placement 5.2% 2.1% 5.8%
*Significantly different, p <0.05.
other outcome var iables (Table 3). There were sig- nificant differences across risk levels for death, indi- cating a statistical relationship to the risk factors. The overall mortality ra te was 6.5% per year . There were no significant differences across risk levels for elective admissions or nursing home replacements .
Relat ionship o f Risk Levels to A m b u l a t o r y Care Contacts
Since these groups differed in risks for nonelec- tive hospitalization, it was ant ic ipated that the inten- sity of ambula tory ca re provided (as measu red by office contacts) might also show significant differ- ences. Significantly higher ra tes were found in high- risk groups for kept scheduled visits, walk-in visits, total contacts, number of visits Scheduled, number of no-shows for scheduled visits, and no-show rate (Table 4). Thus, the hypothesis that high-risk pa- tients, c o m p a r e d with low-risk patients, would h a v e significanty more frequent ambula tory ca re con- tacts was confirmed, but the 220% increase in non- e lec t ive hospitalizations (from 1.47 compared with 0.46) was markedly grea te r than the 30% increase in total ambula tory ca re contacts (12.65 compared with 9.73).
D I S C U S S I O N
The results of this study demonst ra te that non- elective hospitalizations a re to some extent predict- ab le and consistent over time. Other predictive models have shown relationships be tween single characteristics, e.g., level of glycemic control a n d deve lopment of diverse morbidity, such as vascular complications, neuropathy, and ret inopathy. ~°, n In addition, various characterist ics of patients with d iabetes mellitus h a v e been used as indices for pre- dicting mortality from various causes. ~ Thus there is addit ional support for the concept that m a n y char- acteristics of diabetic patients would be related to the outcomes of nonelect ive hospitalizations for di- verse conditions.
It should not be surprising to physicians that pa- tients with more abnormal clinical characterist ics a re at higher risk for morbidity that necessi tates hos-
pitalization. Physicians carefully consider the prog- nostic mean ing of abnormali t ies in making decisions about clinical managemen t . They select a n d weigh risk factors b a s e d upon their knowledge and experi- ence. Thus the predictive model reflects a process common in ambula tory care .
The patients in this study do not a p p e a r to repre- sent a unique population. The incidence of 2.29 to 2.63 nonelect ive hospital days per patient per six months (Table 2) is comparab le to the 5.0 total hospi- tal days per patient per y e a r repor ted by others, z" 2 In addition, the overall mortality rate for all patients was 6.5% (an a v e r a g e of 3.25% per year) . This is similar to a mortality ra te of 3.5% per y e a r 2 and a reduction in survival of 13 - 15% over five yea r s ~s ob- se rved in other populations of ambula tory patients with d iabetes mellitus. Thus, these da t a would sup- port the generalizabil i ty of the model to other settings.
The predictive model (linear discriminant func- tion) was initially der ived to distinguish those dia- betic patients who were nonelect ively hospitalized (as a single event) from those who were not. s The utility of that function is limited. For that r eason we chose, in this study, to test per formance of that pre- dictive model on a prospect ive cohort over time. The results demons t ra te that the model does predict nonelect ive hospitalizations over time. The history of how this model was der ived suggests that other models may be der ived that would make prediction more precise, through the choice of other clinical var iables a n d / o r the use of regression analyses .
The model is a l inear discriminant function, which means that the higher the discriminant score, the grea ter the risk. Thus a plot of the m e a n scores of e a c h group agains t the hospitalization var iable could provide an est imate of predicted hospital re- source utilization from a patient 's discriminant score. This calculation is cumbersome and m a y h a v e utility only in clinical trials. An al ternat ive would be to ac- knowledge that the three levels of risk m a y h a v e
TABLE 4 Mean Ambulatory Care Contacts per Patient per Two Years by Risk Level
Low Medium High Risk Risk Risk
(n=116) (n=140) (n=173)
Kept scheduled appointment* 7.12 8.25 8.53 Walk-int 0.93 1.21 1.73 Rx refill 1.67 1.90 2.38 Total contacts (kept + walk-in + 9.73 11.35 12.65
Rx refill)* Visits scheduled (kept + failed)t 8.79 10.15 11.50 No-show for scheduled visitst 1.66 1.90 2.97 No show rater 22.6% 22.6% 30.8%
* Significantly different, p <0.05. tSignificantly different, p<O.01.

JOURNAL OF GENERAL INTERNAL MEDICINE, Volume 2 (MaV/Jun), 1987 173
some utility for clinical decision making. Then a few simple rules would allow the physician to determine in which risk group the patient belongs: 1) patients with no risk factors would comprise the low-risk group; 2) the presence of only one of a n y risk factor except low serum albumin would m e a n a risk score equivalent to the medium-risk group; and 3) low serum albumin alone, or the presence of a n y two different risk factors, or two emergency room visits in the preceding six months, means the patient would be in the high-risk group.
The selection of clinical characteristics for use in a prognostic study is complex and m a y be contro- versial. Those used in this study (Table 1) were se- lected from 19 variables by linear discriminant func- tion analysis, a Obviously, 19 is small in comparison with an innumerable list of potential risk factors. Some of the considerations involved in narrowing this selection were: the availability of the da ta for most patients (both for the study and for transference to other settings), the likelihood of having prognostic influence, the ability of the variable to be objectively assessed, and the clinical re levance of the variable to the outcome. The clinical re levance of the risk factors in this study to reasons for nonelective hospi- talizations has been reported previously. 3 The com- plexity of these considerations is not to discourage refinements in the predictive model of this study but rather to emphasize that each of these considera- tions is important for the utility of the final risk function.
It can only be speculated that reduction of risk factors would actually reduce nonelective hospital- izations. However, two interventions that increased intensity of and improved access to ambulatory care for patients with diabetes mellitus were associated with both fewer emergency room visits (one of the risk factors) and fewer hospitalizations. L 2 Although there is reason to postulate that the other risk factors m a y be either reversible or reduced in incidence, further research is needed to test this hypothesis and to see whether removal of these risk factors reduces nonelective hospitalizations.
High-risk patients had 30% more contacts with the clinic than did low-risk patients (Table 4). How- ever, the 30% increase is markedly lower than the 220% increase in nonelective hospitalizations (Table 2) and supports the need for further studies of in- creasing the intensity of ambulatory care. That is, interventions that increase the frequency of visits of high-risk patients might be a means of reducing the incidence of nonelective hospitalizations.
Increasing the intensity of care in the outpatient setting would increase ambulatory care costs. This is of particular concern as heal th c a r e resources a re limited and there is nat ional emphasis on cost con- tainment. However, increased expenditures in am-
bulatory care have potential for an effective cost containment strategy for total health care costs. A report from this center has est imated that if preven- tive interventions for genera l medicine patients in- c reased outpatient costs by 5%, but resulted in a 7.5% decrease in hospitalizations, total health care costs would still decrease by 5%.14 The obvious a d v a n t a g e of this cost containment s t rategy would be that both costs and morbidity would decrease.
[n summary, the demonstrat ion that a model using clinical variables predicts morbidity necessi- tating hospitalization o v e r time has several potential utilities. First, the risk factors provide some clues for interventions to be tested by clinical trials a n d / o r a checklist for clinical practice. Second, such a model m a y be useful in monitoring quality of care; for ex- ample, it could be used to monitor the intensity of ambulatory care for high-risk patients. A final utility of this type of model would be to predict resource utilization for prospective payment systems. The ad- van tages here are that the model is patient-specific and not dependent upon subjective determinates of p e r c e i v e d health status or disability.
The authors appreciate the clerical assistance of Sharon Hopwood in the preparation of this manuscript, the technical assistance of Patricia Moore and Mona Hamby. and the use of facilities provided by the Indiana University Computing Network.
REFERENCES
1. Miller LV, Goldstein J. More efficient care of diabetic patients in a county hospital setting. N Engl J Med 1972;286:1388-91
2. Runyan JW. VanderZwaag R. Joyner B. Miller ST. The Memphis diabetes continuing care program. Diabetes Care 1980;3:382-6
3. Smith DM, Norton JA, Roberts SD, Maxey WA, McDonald CJ. Unex- pected hospital admissions among patients with diabetes mellitus. Arch Intern Meal 1983; 143:41-7
4. McDonald C J, Hui SL, Smith DM, et al. Reminders to physicians from an introspective computer medical record. A two-year randomized trial. Ann Intern Med 1984; 100:130-8
5. Commission of Professional and Hospital Activities. The international classification of diseases, 9th revision. Clinical modification. Ann Arbor: Edwards Brothers, 1978
6. Miller RG. Simultaneous statistical inference. New York: Springer- Verlag, 1981
7. Snedecor GW, Cochran WG. Statistical methods. Ames, Iowa: The Iowa State University Press, 1967
8. Cole IWL, Grizzle JE. Application of multivariate analysis of variance to repeated measures experiment. Biometrics 1966;22:812-28
9. Grizzle JE, Starmer CF, Koch GG. Analysis of categorical data by linear models. Biometrics 1969;25:489-504
10. Rifkin H, Why control diabetes? Meal Clin North Am 1978;62:747-52
11. Skyler JS. Complications of diabetes mellitus: relationship to meta- bolic dysfunction. Diabetes Care 1979;2:499-509
12. KaplanMH, FeinsteinAR. Theimportanceofclassifyinginitialcomor- bidity in evaluating the outcome of diabetes metlitus. J Chronic Dis 1974;27:387-404
13. HiroIate T, MacMahon B. Rost HF. The natural history of diabetes. ;. MortaIity. Diabetes t 967; 16:875-8
14. Smith DM. Roberts SD. Gross TL. Health care costs of medical pa- tients at an urban center. J Comm Health 1981 ;7:21-32