predicting hatchability of layer breeders and identifying
TRANSCRIPT

Predicting hatchability of layer breeders and identifying effects of animal relatedand environmental factors
I. Bouba,*,y,1 B. Visser ,* B. Kemp,z T. B. Rodenburg ,y,z and H. van den Brandz
*Hendrix Genetics, Boxmeer, 5831 CK, Netherlands; yAnimals in Science and Society, Faculty of VeterinaryMedicine, Utrecht University, Utrecht, Netherlands; and zAdaptation Physiology Group, Wageningen University &
Research, Wageningen, Netherlands
ABSTRACT In this study, a data driven approachwas used by applying linear regression and machinelearning methods to understand animal related andenvironmental factors affecting hatchability. Data wasobtained from a parent stock and grand-parent stockhatchery, including 1,737 batches of eggs incubated inthe years 2010−2018. Animal related factors taken intoconsideration were strain (white vs. brown strain),breeder age, and egg weight uniformity at the start ofincubation, whereas environmental factors consideredwere length of egg storage before incubation, egg weightloss during incubation and season. Effects of these fac-tors on hatchability were analyzed with 3 different mod-els: a linear regression (LR) model, a random forest(RF) model and a gradient boosting machine (GBM)model. In part one of the study, hatchability was pre-dicted and the performance of the models in terms ofcoefficient of determination (R2) and root mean squareerror (RMSE) was compared. The ensemble machinelearning models (RF: R2 = 0.35, RMSE = 8.41; GBM:R2 = 0.31, RMSE = 8.67) appeared to be superior than
� 2021 Published by Elsevier Inc. on behalf of Poultry Science Asso-ciation Inc. This is an open access article under the CC BY-NC-NDlicense (http://creativecommons.org/licenses/by-nc-nd/4.0/).
Received April 28, 2021.Accepted July 20, 2021.1Corresponding author: [email protected]
1
the LR model (R2 = 0.27, RMSE = 8.92) as indicated bythe higher R2 and lower RMSE. In part 2 of the study,effects of these factors on hatchability were investigatedmore into detail. Hatchability was affected by strain,breeder age, egg weight uniformity, length of egg storageand season, but egg weight loss didn’t have a significanteffect on hatchability. Additionally, four 2-way interac-tions (breeder age £ egg weight uniformity, breederage £ length of egg storage, breeder age £ strain,season £ strain) were significant on hatchability. It canbe concluded that hatchability of parent stock andgrand-parent stock layer breeders is affected by severalanimal related and environmental factors, but the size ofthe predicted effects varies between the methods used.In this study, 3 models were used to predict hatchabilityand to analyze effects of animal related and environmen-tal factors on hatchability. This opens new horizons forfuture studies on hatchery data by taking the advantageof applying machine learning methods, that can fit com-plex datasets better than LR and applying statisticalanalysis.
Key words: incubation, hatchability, machine learning, genetic, environment
2021 Poultry Science 100:101394https://doi.org/10.1016/j.psj.2021.101394
INTRODUCTION
Effects of animal related and environmental factors onhatchability in layer breeder eggs are considerably lessinvestigated than broiler breeder eggs. Precise predictionof hatchability may help the industry in proper predic-tion of hatchability of batches of eggs from the incubator(important for logistics) and possibilities to adjust incu-bation conditions to get more favorable outcomes. Newtechnologies in the hatchery generate data aboutbreeders, eggs, incubators, and other potentially
important factors, that can be used for predicting perfor-mance of the hatchery (Klein et al., 2020). This abun-dance of data, produced in hatcheries, may require newmodeling techniques (Ren et al., 2020). Machine learn-ing techniques might be good alternatives to the classicaltechniques, such as linear regression, because they arebased on pattern recognition (Coronel-Reyes et al.,2018). Hatchability depends on numerous animal relatedand environmental factors (King’ori, 2011). Some ani-mal related factors, like breeder age and egg weight uni-formity, and environmental factors, like egg storageduration, season, and egg weight loss during incubationhave been shown to have an effect on hatchability, par-ticularly in broiler breeders (Grochowska et al., 2019).Effects of these factors in layer breeders, including theeffect of strain (brown vs. white) have hardly been inves-tigated (Machado et al., 2020). In general, brown genetic

2 BOUBA ET AL.
strain showed a higher hatchability than white geneticstrain (Tona et al., 2010), which might be related to dif-ferences in egg characteristics (Narushin et al., 2016).Breeder age has been shown to affect hatchability inboth broiler and layer breeders (Nasri et al., 2020a). Ingeneral, prime breeder flocks (31−42 wk of age) showedthe highest hatchability, whereas younger (25−30 wk ofage) and older breeder flocks (>42 wk of age) showedlower hatchability (Damaziak et al., 2021). Anotheraspect that is hardly investigated in layer and broilerbreeders is the effect of egg weight uniformity on hatch-ability. Previous studies have focused mostly on bodyweight uniformity (Abbas et al., 2010) of the broilerbreeder flock with little focus on egg weight uniformity.Furthermore, effect of egg storage duration on hatch-ability was significant. Short egg storage duration (<7d) seems to increase hatchability of eggs from youngbreeders, probably because of albumen liquefaction withconsequently better oxygen availability for the embryo.Prolonged (>7 d) storage reduced hatchability of eggsfrom 92 to 71% (Dymond et al., 2013), especially in eggsfrom older breeders. This might be related to modifica-tions in the blastoderm or in the albumen during stor-age, which subsequently had an effect on hatchabilitynegatively (Pokhrel et al., 2018; Nasri et al., 2020b).Egg weight loss is another important factor that couldindirectly affect hatchability (Duman andSekero�glu, 2017). Season of incubation is another factorthat has been suggested to affect hatchability; hatch-ability was higher during late summer than duringspring and eggs from older breeders (61−65 wk of age)were more sensitive to season than eggs of younger (25−30 wk of age) breeders (Yassin et al., 2008). The aim ofthis study is 2-fold. The first aim is to analyze and pre-dict hatchability of layer breeders, using 3 different mod-els including, random forest (RF), gradient boostingmachine (GBM) and linear regression (LR). The sec-ond aim is to investigate more specific effects of animalrelated (strain, breeder age, egg weight uniformity atthe start of incubation) and environmental (length ofegg storage before incubation, egg weight loss duringincubation, seasons) factors on hatchability of layerbreeders. These effects are studied in experimental set-ups not including all potential influencing factors. Theapproach has been described in material and methods.
MATERIALS AND METHODS
Dataset
A dataset (Hendrix Genetics, Boxmeer, the Nether-lands) obtained from a parent (PS) and grand-parentstock (GPS) of the layer hatchery, including 1,737batches of 100 to 166 number of eggs incubated during2010 to 2018, was used. The dataset consisted of 3groups of factors: animal related factors (parent stock orGPS generation, genetic strain, breeder farm, breederage, egg weight, and egg weight uniformity at set), envi-ronmental factors (length of egg storage before incuba-tion, set month (season), egg weight loss during
incubation, day of incubation at transfer from setters tohatchers), and hatchery factors (setter number andhatcher number in which the eggs were incubated). Dur-ing incubation, the temperature, CO2, relative humidity,and airflow for the setters were set to 99°F, 0.4%, 66%,and 36 ft3, respectively, while those of the hatchers wereset to 98°F, 0.3%,50 %, 55 ft3, respectively. Hatchabilitywas calculated per batch of eggs as hatch of fertile eggs(HOF) as shown in Equation (1).
HOF ¼ CP þ NCSE � IE
� �� 100; ð1Þ
Where CP = Number of chicks pulled, NC = Numberof chicks culled, SE = Number of set eggs andIE = Number of infertile eggs.In the first part of this study, which aimed to predict
hatchability, all factors in all 3 groups were used. In thesecond part of this study, some animal related and envi-ronmental factors were investigated more into depth ontheir effects on hatchability.
Overview of Methods
The overall flowchart of the used methods in bothparts of this study is shown in Figure 1. For each part,the dataset, feature engineering process, dimensionalityreduction techniques, methods used, and postprocessingstrategies have been shown. The first part deals withpredicting hatchability by using RF, GBM, and LRmodels. The second part deals with investigating effectsof animal related and environmental factors on hatch-ability by applying an ordinary least square (OLS) lin-ear model for statistical significance of these mainfactors and their 2-way interactions.
Part I: Predicting Hatchability
Feature Engineering Factors in the dataset poten-tially affecting hatchability were singled out and prepro-cessed. Month was a cyclical feature, from 1 to 12,meaning that the difference between the successive val-ues is 1. However, there is always a jump from 12 to 1 tocomplete the cycle. By converting the months to theircorresponding cosine and sine values, different coordi-nates were assigned for every moment between 1 and 12,making them unique. Furthermore, on the categoricalfactors (setters, hatchers, breeder farms, generation[grant-parent or parent stock], genetic strain) one-hot-encoding was applied to transform them into numericvalues (0s and 1s). This process converted factors intoforms that could be provided to machine learning (ML)algorithms for analysis. One-hot-encoding leads to anincreased number of features, especially if there aremany categories and this can make algorithms not toperform better. To solve this problem, dimensionalityreduction was applied.Dimensionality Reduction Dimensionality reductionwas done by extracting new features from the originalfeatures, a process referred to as feature extraction

Figure 1. Flow chart, showing the methods used to predict hatchability (part I) and to investigate effects of animal related and environmentalfactors on hatchability (part II). Random forest (RF), gradient boosting machine (GBM) and linear regression (LR) methods were used to predicthatchability. Random forest - Recursive feature elimination (RF-RFE) was applied to reduce the dimensionality of the processed data to increaseaccuracy in predicting hatchability. The OLS (ordinary least square) was used to analyze animal related and environmental effects on hatchability.
FACTORS AFFECTING HATCHABILITY OF LAYER BREEDERS 3
(Osman et al., 2018). To perform feature extraction, aRecursive Feature Elimination with Cross Validation(RFECV) algorithm was applied on a Random ForestClassifier with a StratifiedKFold, K = 10 (Chen et al.,2018). The RFECV technique is recursive in the sensethat for each feature, it calculates its importance scorerelative to the other features with hatchability as depen-dent variable. The algorithm helps to detect interactionsbetween different features and classify them, but highlycorrelated features could mask these interactions. Thus,before fitting the model, Pearson’s correlations (r) werecalculated to eliminate highly correlated features with r>0.8. Consequently, only one feature from the genera-tion (the PS) was eliminated, but the GPS remained.Methods and Performance Evaluation To predicthatchability, the LR method and 2 independent ensem-ble ML methods, RF and GBM, were used. Analyseswere performed in Python version 3.7.4 and the modelswere trained in the sklearn machine learning library.The methods were trained by splitting the dataset, using60% as training set and 40% as test set to predict hatch-ability (Liu and Cocea, 2017).
For the 2 ensemble ML methods, RF and GBM, priorto training, hyperparameter optimization with K-Foldcross validation (CV) was performed, using a Grid-SearchCV algorithm. Hyperparameter optimization ortuning is a technique that is used to choose a set of opti-mal hyperparameters for a learning algorithm (Hea-ton, 2017). A hyperparameter is a parameter whosevalue is used to control the learning process of a MLalgorithm (Ghawi and Pfeffer, 2019). Three options ofhyperparameter values for the learning rate (0.001, 0.01,1), number of estimators (500, 1,000, 10,000), just toname a few, were passed to the algorithms. This allowedeach of the machine learning methods to autonomouslychoose from each option, which values were best to opti-mize predictive performance. Furthermore, to validatethe stability of these models, K-Fold CV (K = 10) wasapplied to ensure the models got most of the patterns in
the dataset (generalize). This automatically divided thedataset into 10 subsets, the hold out method wasrepeated 10-times such that 1 of the 10 subsets was usedas the test/validation set and the other 9 (K-1) subsetswere put together to form the training set. The errorestimation was averaged over all 10 trials to get theoverall effectiveness of the models. For the LR method,direct training was done without prior hyperparameteroptimization, because LR does not support hyperpara-meter optimization. Finally, the predictive performanceof the RF, GBM, and LR models were evaluated basedon two standard performance metrices R2 and RMSE.
Part II: Effects of Genetics andEnvironmental Factors on Hatchability
Effects of animal related (breeder strain, breeder age,egg weight uniformity) and environmental (egg storageduration, egg weight loss, season) factors on actualhatchability were evaluated. Breeder age was the age ofthe flocks in weeks and was categorized into 4 classesbefore analyses: <30 wk, 30 to 45 wk, 45 to 60 wk and>60 wk. Egg weight uniformity referred to homogeneityin egg weight at set within a batch (based on 150 eggsper batch) and was categorized into 3 classes: <85.0,85.0 to 90.0% and >90.0%. These categories expressthe percentage of eggs within the average egg weight ofthe batch § 10%. Egg storage duration was the numberof days the eggs were stored at the breeder farm plusthe hatchery prior to placement in the setters(Grochowska et al., 2019) and was categorized into 5classes: 0 to 4 d, 5 to 7 d, 8 to 10 d, 11 to 14 d and 15to 18 d. A storage temperature of 16 to 18°C was setwhen the eggs were stored for less than 7 d and whenthe storage period was longer, a temperature of 10 to12°C was employed. Season was the period the eggswere set and was categorized into 4 classes (December,January, February = Winter; March, April,

4 BOUBA ET AL.
May = Spring; June, July, August = Summer; Septem-ber, October, November = Autumn). Egg weight lossduring incubation (from setting to transfer to thehatcher baskets) was categorized into 3 classes:<10.0%, 10.0 to 11.9% and ≥12.0%. Egg weight losswas calculated as the percentage of egg weight at trans-fer (from setter to hatcher on either day 17, 18, or 19 ofincubation) relative to the egg weight prior to settingthe eggs in the setter at the start of incubation. Breederstrain was categorized into brown and white, whereboth the brown and white strain included 11 geneticstrains each. Data was analyzed, using a general linearmodel (Equation 2):
y ¼ mþ BAþ EWU þ ESDþ seasonþ EWL
þ Strainþ interactionsþ e; ð2Þ
where y = Hatchability, m = overall mean,BA = breeder age class (four levels), EWU = eggweight uniformity class (3 levels), ESD = egg storageduration class (five levels), season = season (spring,summer, autumn, winter), EWL = egg weight loss class(3 levels), strain = strain (white vs. brown), interac-tions = 2-way interactions between all these factors ande = residual error. Firstly, Pearson’s correlationsbetween these factors were calculated to ensure thatthey were not highly correlated. Preliminary analysesindicated that the strongest correlation between thesefeatures was r = 0.14 and none of them were significant.Consequently, these factors and their 2-way interactionswere all included in the model. Thereafter, the modelwas reduced by stepwise deleting of the 2-way interac-tions. Main effects all remained in the model. A P-valueof ≤ 0.05 was used as a threshold for significant maineffects and interactions. Results are expressed as pre-dicted means with SEM, and P-values obtained from theOLS statistical model. Bonferroni correction was usedfor multiple comparisons. All statistical analysis wasperformed in python version 3.7.4 using statsmodels,scipy, and scikit_posthocs libraries.
RESULTS AND DISCUSSION
Part I: Predicted Hatchability
Prior to predicting hatchability, dimensionalityreduction was performed (Terko et al., 2019). Figure 2Ashows that, out of the 125 features that were introducedto the algorithm, 103 were extracted as optimal featuresand were used to analyze hatchability. Figure 2B showsthe top 8 features out of the 103 optimal features. Here,egg weight loss was the most important feature in pre-dicting hatchability, meaning egg weight loss contrib-uted the most in improving the performance (predictiveaccuracy) of the machine learning models.
Figure 3 shows a scatter plot of predicted hatchabilityvs. the actual hatchability for RF, GBM, and LR mod-els. The predictive performance based on RMSE for theRF, GBM and LR were 8.41, 8.67 and 8.92, respectively,
whereas the predictive performance based on R2 of themodels were 0.35, 0.31, and 0.27, respectively. It appearsthat both ML (RF and GBM) models could fit the datain a similar and had a higher predictive accuracy thanthe LR model as indicated by the higher R2 and lowerRMSE, which is in agreement with studies on other bio-logical processes (Wekesa et al., 2020). To further evalu-ate, again RF and GBM models showed consistentlylower SEM than the LR model (see next section). Thesuccess of RF and GBM may be due to their ability tolearn hidden interactions of features. The regression fitsin Figure 3 showed deviation from the 45o angle for all 3used models. This appears to be particularly related tothe low values of actual hatchability, where higher val-ues were predicted. This might be due to the relativelylow number of observations in the dataset below hatch-ability of 60%. Increasing the number of observationswould probably be the best solution to improve the per-formance of the models. The highest performance interms of R2 was recorded by the RF (0.35), which is stilllow to rely on. However, it also shows that ML modelsmight perform better to predict biological processes witha lot of variation compared to LR models.
Part II: Genetic and Environmental Effects onHatchability
Five main effects and four 2-way interactions showedsignificant effects on actual hatchability. First animalrelated factors (strain, breeder age, egg weight unifor-mity) will be discussed, followed by environmental fac-tors (egg storage duration, season). In this section, thefigures express the actual hatchability, while the tablesexpress the predicted hatchability by each model (LR,RF, GBM) and their overall P-values and SEM.Effect of Strain on Hatchability Genetic strain had ahighly significant effect on hatchability (P < 0.001).Strain also showed a significant 2-way interaction withbreeder age and with season. Overall, the predictedhatchability of the brown genetic strain was higher thanthat of the white genetic strain (on average over the 3models D = 2.02%; Table 1), which was similar with to(Narushin et al., 2016; Iqbal et al., 2016). This might bedue to the differences in embryo physiology of the brownand white strains and higher egg weight in brown strains(Tona et al., 2010). Another reason for the differences inhatchability between the brown and white genetic strainmight be due to the initial egg composition especiallythe distribution of yolk and albumen, which is deter-mined by strain besides breeder age and egg weight(Van Der Wagt et al., 2020). Whether or not this differ-ence in hatchability between strains is related to specificgenes or single nucleotide polymorphism (SNP’s) needsto be investigated further (Samiullah et al., 2015).Effect of Breeder Age on Hatchability Breeder ageand its interaction with strain had a highly significanteffect on hatchability (P < 0.001). Figure 4 shows therelationship between breeder age and actual hatchabil-ity for white and brown strains. On average, white and

Figure 2. (A) Relationship between the number of features selected and the cumulative feature importance score, (B) top 8 of 103 selected fea-tures related to hatchability.
FACTORS AFFECTING HATCHABILITY OF LAYER BREEDERS 5
brown strains showed the highest hatchability at abreeder age between 30 and 45 wk of age. However, inthe brown strain, hatchability remained rather constantand just declined after particularly 60 wk of age, whereasin the white strain the decline in the hatchability wasmore linear across the whole range of breeder ages. Thismight be related to differences in eggshell conductancebetween the 2 strains. It can be speculated that in olderwhite leghorns the eggshell quality is decreasing fasterthan in brown strains. Consequently, more hair cracksor higher egg weight loss during incubation can occur,which might have a negative effect on hatchability.Thus, in white strains the hatchability will decrease,whereas this will less frequently occur in brown strainswith a better eggshell quality. Table 2 shows the averagehatchability per breeder age class for the 3 differentmodels. The breeder age class of <30 wk of age had toolimited observations to calculate predicted hatchabilitytrustfully and consequently, this breeder age class wasnot taken into account. All 3 models showed the sametrend, with the lowest hatchability after 60 wk of age.
Eggs laid by old breeders often presented higher infertil-ity and total embryo mortality, resulting in lower hatch-ing percentage (Almeida et al., 2008). However, thedifference in hatchability between a breeder age of 30 to45 wk (highest hatchability) and above 60 wk (lowesthatchability) was considerably different between the 3models (D = 5.54, 2.93 and 3.68% for LR, RF, andGBM, respectively). Comparing the variation betweenthe highest and the lowest hatchability for the 3 models,the LR model showed the highest variation. This mightbe because the LR predicted hatchability values, whichdeviated more from the actual hatchability due to itsinability to support parameter tuning prior to training,unlike the RF and GBMmodels.Effect of Egg Weight Uniformity on Hatchability Tag-
gedPEgg weight uniformity and its interaction with breederage (P < 0.001 and P = 0.04, respectively) showed a sig-nificant effect on hatchability. Figure 5 shows the rela-tionship between egg weight uniformity and actualhatchability for 3 breeder age classes. The breeder ageclass <30 wk did not have enough observations in the

Figure 3. Regression plot of actual vs predicted hatchability of layer breeders for three models.
Table 1. Predicted hatchability for different levels of strain(grandparent and parent) by 3 models.
Predicted hatchability (%)
Strain N* Linear regression Random forestGradient
boosting machine
Brown 905 82.10a 82.29a 82.10a
White 789 79.86b 80.39b 80.15b
SEM 1.97 2.06 1.48P-value <0.001 <0.001 <0.001
*Number of batches.a,bPredicted means within a column lacking a common superscript dif-
fer significantly (P < 0.05).
6 BOUBA ET AL.
dataset to estimate a good relationship between eggweight uniformity and hatchability, thus it was not con-sidered in the analyses. For breeders older than 45 wk,hardly any effect of egg weight uniformity on hatchabil-ity was found, but for breeders between 30 and 45 wk ofage, higher egg uniformity resulted in a higher hatchabil-ity. In literature, more focus is given to broiler breedersand their body weight uniformity (Abbas et al., 2010) inrelationship to hatchability. However, hardly any rela-tionships between egg weight uniformity or the interac-tion between egg weight uniformity and breeder age onhatchability have been shown. It can be speculated thatin younger breeders, variation in egg weight within abatch of eggs varies more than in older breeders, whichconsequently might have effect on heat transfer within
an incubator. For example, Elibol and Brake (2008)demonstrated that eggshell temperature of large broilerbreeder eggs during incubation was more affected by theplace in the incubator (near the fan or far away from thefan) than that of smaller eggs. Consequently, it can bespeculated that a batch of eggs with more variation inegg weight experience more variation in eggshell weight,affecting hatchability. Additionally, younger broilerbreeders produce smaller eggs and it has been shownthat hatchability of smaller eggs is lower compared tothat of medium and large eggs (Iqbal et al., 2016).Table 3 shows the average hatchability per egg weightuniformity class for the 3 different models. All 3 modelsshowed a similar trend, with the lower hatchabilityrecorded for egg weight uniformity <85% compared tothe other egg weight uniformity classes. The differencein hatchability between an egg weight uniformity >90%(highest hatchability) and <85% (lowest hatchability)was not considerably different between the 2 ML models(RF and GBM), but differed between the ML modelsand the LR model (D = 3.54, 2.32 and 2.85% for LR,RF, and GBM, respectively). This might be because RFand GBM are both ensemble (use a combination of treealgorithms) methods to do prediction unlike the LRmethod.Effect of Egg Storage Duration on Hatchability Eggstorage duration and its interaction with breeder ageshowed a highly significant effect on hatchability (P <0.001). Figure 6 shows the relationship between egg
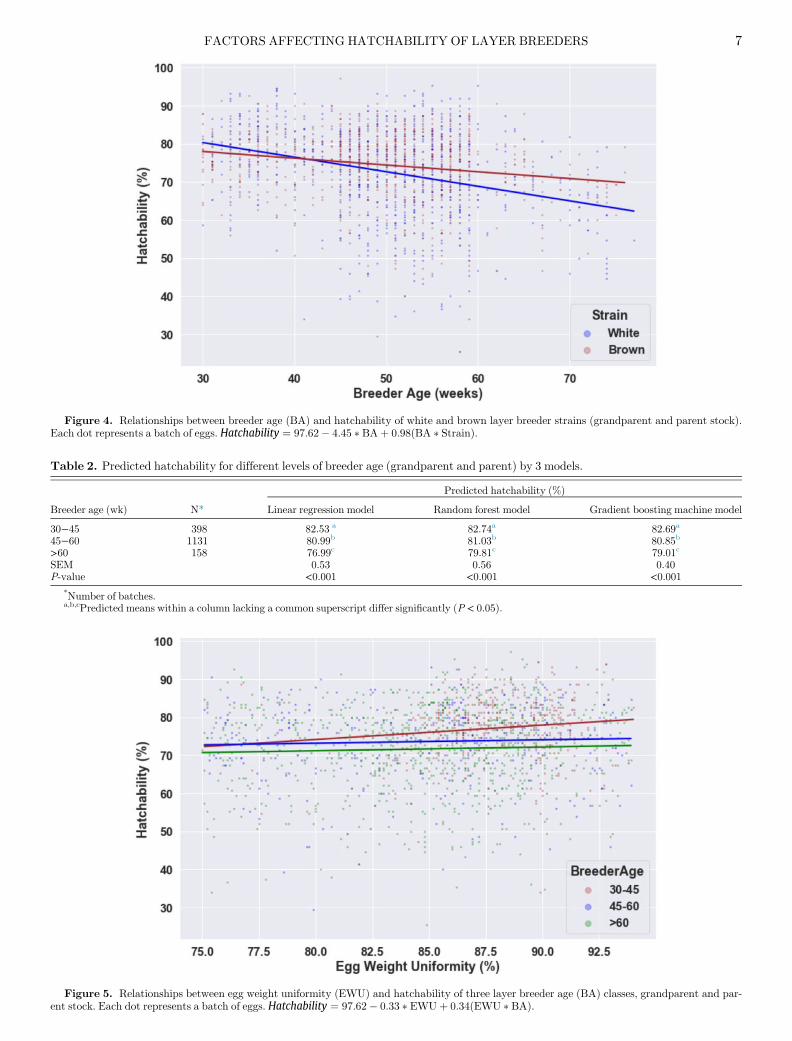
Figure 4. Relationships between breeder age (BA) and hatchability of white and brown layer breeder strains (grandparent and parent stock).Each dot represents a batch of eggs. Hatchability ¼ 97:62� 4:45 � BAþ 0:98ðBA � StrainÞ.
Table 2. Predicted hatchability for different levels of breeder age (grandparent and parent) by 3 models.
Predicted hatchability (%)
Breeder age (wk) N* Linear regression model Random forest model Gradient boosting machine model
30−45 398 82.53 a 82.74a 82.69a
45−60 1131 80.99b 81.03b 80.85b
>60 158 76.99c 79.81c 79.01c
SEM 0.53 0.56 0.40P-value <0.001 <0.001 <0.001
*Number of batches.a,b,cPredicted means within a column lacking a common superscript differ significantly (P < 0.05).
Figure 5. Relationships between egg weight uniformity (EWU) and hatchability of three layer breeder age (BA) classes, grandparent and par-ent stock. Each dot represents a batch of eggs. Hatchability ¼ 97:62� 0:33 � EWUþ 0:34ðEWU � BAÞ.
FACTORS AFFECTING HATCHABILITY OF LAYER BREEDERS 7

Table 3. Predicted hatchability for different levels of egg weight uniformity (grandparent and parent) by 3 models.
Predicted hatchability (%)
Egg weight uniformity(%) N* Linear regression model Random forest model Gradient boosting machine model
<85 584 79.45c 79.63b 79.43b
85−90 824 81.26b 82.27a 81.84a
>90 286 82.98a 81.95a 82.28a
SEM 0.31 0.33 0.24P-value <0.001 <0.001 <0.001
*Number of batches.a,b,cPredicted means within a column lacking a common superscript differ significantly (P < 0.05).
Figure 6. Relationships between egg storage duration (ESD) and hatchability of 3-layer breeder age (BA) classes: 30−45, 45−60, and >60 wk ofage (grandparent, and parent stock). Each dot represents a batch of eggs. Hatchability ¼ 97:62� 2:45 � ESDþ 0:34ðESD � BAÞ.
Table 4. Predicted hatchability for different levels of egg storage duration (grandparent and parent) by 3 models.
Predicted hatchability (%)
Egg storage duration (d) N* Linear regression model Random forest model Gradient boosting machine model
0−4 185 83.24a 82.06a 82.02ab
5−7 474 82.12a 82.15a 82.18a
8−10 532 80.61b 81.64a 81.42b
11−14 446 79.45c 80.13b 79.61c
15−18 57 78.07c 76.88c 76.30d
SEM 0.23 0.24 0.17P-value <0.001 <0.001 <0.001
*Number of batches.a,b,c,dPredicted means within a column lacking a common superscript differ significantly (P < 0.05).
8 BOUBA ET AL.
storage duration and actual hatchability for the breederage classes (30−45, 45−60 and >60 wk). All 3 breederage classes showed the highest hatchability at storageduration of approximately 5 to 7 d (Silva et al., 2008).With prolonged storage duration, the hatchabilitydeclined for all breeder age classes, but this decline wasmore severe in the breeders > 45 wk than in the primeflock (30−45 wk) breeders. This also confirms what isshown in broiler literature: egg storage duration longerthan 7 d, especially from older breeders, results in modi-fications to the blastoderm, which has a negative effect
on hatchability (Damaziak et al., 2021). Adapted stor-age conditions related to the age of breeders might be anoption to reduce negative effects of prolonged storage onhatching egg quality (Nasri et al., 2020c). Table 4 showsthe average hatchability per egg storage duration classfor the 3 different models. In general, all 3 modelsshowed the same trend, with the highest hatchability foregg storage lower than 7 d. In particular the 2 ML mod-els (RF and GBM) could specifically predict the highesthatchability at egg storage of 5 to 7 d due to their highability to quickly learn a pattern in the dataset. The
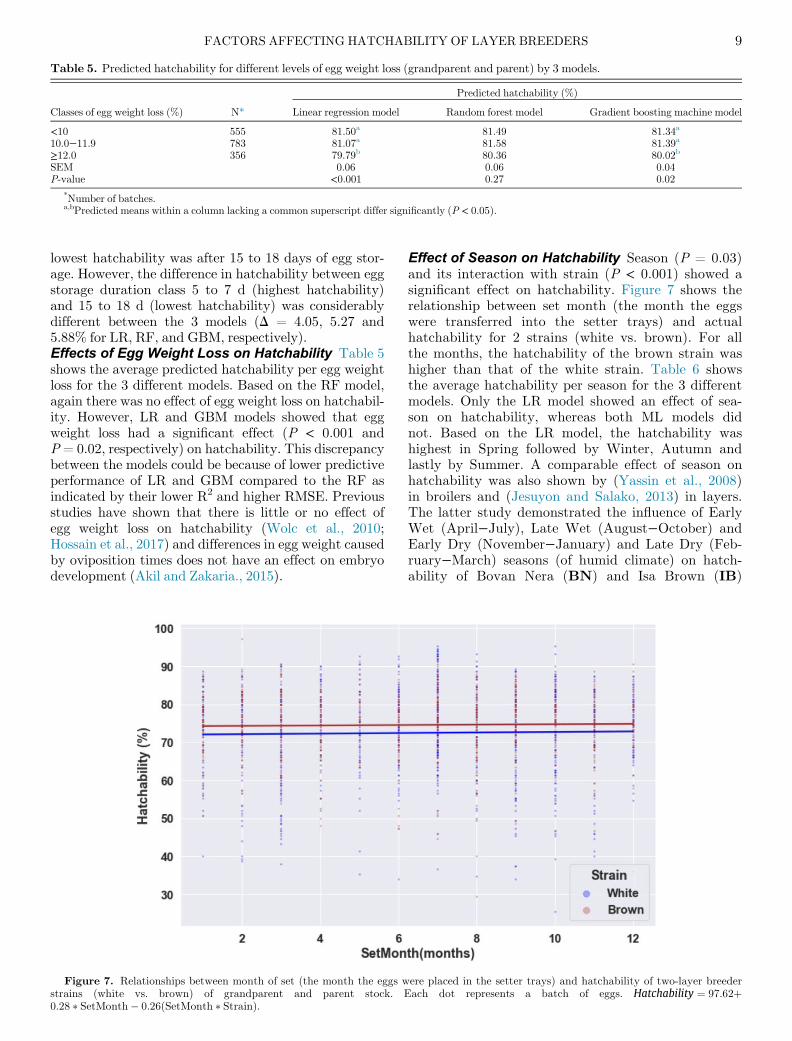
Table 5. Predicted hatchability for different levels of egg weight loss (grandparent and parent) by 3 models.
Predicted hatchability (%)
Classes of egg weight loss (%) N* Linear regression model Random forest model Gradient boosting machine model
<10 555 81.50a 81.49 81.34a
10.0−11.9 783 81.07a 81.58 81.39a
≥12.0 356 79.79b 80.36 80.02b
SEM 0.06 0.06 0.04P-value <0.001 0.27 0.02
*Number of batches.a,bPredicted means within a column lacking a common superscript differ significantly (P < 0.05).
FACTORS AFFECTING HATCHABILITY OF LAYER BREEDERS 9
lowest hatchability was after 15 to 18 days of egg stor-age. However, the difference in hatchability between eggstorage duration class 5 to 7 d (highest hatchability)and 15 to 18 d (lowest hatchability) was considerablydifferent between the 3 models (D = 4.05, 5.27 and5.88% for LR, RF, and GBM, respectively).Effects of Egg Weight Loss on Hatchability Table 5shows the average predicted hatchability per egg weightloss for the 3 different models. Based on the RF model,again there was no effect of egg weight loss on hatchabil-ity. However, LR and GBM models showed that eggweight loss had a significant effect (P < 0.001 andP= 0.02, respectively) on hatchability. This discrepancybetween the models could be because of lower predictiveperformance of LR and GBM compared to the RF asindicated by their lower R2 and higher RMSE. Previousstudies have shown that there is little or no effect ofegg weight loss on hatchability (Wolc et al., 2010;Hossain et al., 2017) and differences in egg weight causedby oviposition times does not have an effect on embryodevelopment (Akil and Zakaria., 2015).
Figure 7. Relationships between month of set (the month the eggs wstrains (white vs. brown) of grandparent and parent stock. E0:28 � SetMonth� 0:26ðSetMonth � StrainÞ.
Effect of Season on Hatchability Season (P = 0.03)and its interaction with strain (P < 0.001) showed asignificant effect on hatchability. Figure 7 shows therelationship between set month (the month the eggswere transferred into the setter trays) and actualhatchability for 2 strains (white vs. brown). For allthe months, the hatchability of the brown strain washigher than that of the white strain. Table 6 showsthe average hatchability per season for the 3 differentmodels. Only the LR model showed an effect of sea-son on hatchability, whereas both ML models didnot. Based on the LR model, the hatchability washighest in Spring followed by Winter, Autumn andlastly by Summer. A comparable effect of season onhatchability was also shown by (Yassin et al., 2008)in broilers and (Jesuyon and Salako, 2013) in layers.The latter study demonstrated the influence of EarlyWet (April−July), Late Wet (August−October) andEarly Dry (November−January) and Late Dry (Feb-ruary−March) seasons (of humid climate) on hatch-ability of Bovan Nera (BN) and Isa Brown (IB)
ere placed in the setter trays) and hatchability of two-layer breederach dot represents a batch of eggs. Hatchability ¼ 97:62þ

Table 6. Predicted hatchability for different levels of seasons (grandparent and parent) by 3 models.
Predicted hatchability (%)
Seasons N* Linear regression model Random forest model Gradient boosting machine model
Spring 360 81.70a 81.64 81.36Summer 526 80.26b 81.38 81.05Autumn 455 80.98ab 81.28 81.00Winter 353 81.18ab 80.92 81.02SEM 0.16 0.17 0.12P-value 0.03 0.84 0.63
*Number of batches.a,bPredicted means within a column lacking a common superscript differ significantly (P < 0.05).
10 BOUBA ET AL.
parent-stock eggs. In Bovan Nera and Isa Brown, sea-son had significant influence on egg fertility and egghatchability, respectively (Jesuyon et Salako., 2013).
In can be concluded that, animal related and environ-mental factors are important factors in predicting hatch-ability of layer breeder eggs. It has been shown thatmachine learning models (RF, GBM) could predict hatch-ability more accurately than the LR model. All the 3 mod-els showed consistency with each other in predicting andanalyzing hatchability but predicted means may differbetween the 3 models. Breeder age, egg storage duration,strain and egg weight uniformity had the strongest effectson hatchability, whereas season and egg weight loss onlyshowed minor or no effects. Using large numbers fielddata, factor analyses more or less confirms what experi-mental data already found and the advantage of ML isthat all factors are used in the models. This also allowedcomparison of the best explaining factors for Hatchability.
ACKNOWLEDGMENTS
This study as part of the “Chicken Stress EuropeanTraining Network” project financed by MarieSk»odowska-Curie is gratefully acknowledged. Theauthors would like to thank Hendrix Genetics for provid-ing the data, especially the hatchery manager BertPeters.
This project has received funding from the EuropeanUnion’s Horizon 2020 research and innovation pro-gramme under the Marie Sk»odowska-Curie [grant num-ber 812777].
Disclaimer: This work reflects only the author's viewand that the Agency European Union’s Horizon 2020research and innovation program is not responsible forany use that may be made of the information it contains.
DISCLOSURES
All authors declare that they have no conflict ofinterest.
SUPPLEMENTARY MATERIALS
Supplementary material associated with this articlecan be found in the online version at doi:10.1016/j.psj.2021.101394.
REFERENCES
Abbas, S. A., A. A. Gasm Elsei, and M.-K. A. Ahmed. 2010. Effect ofbody weight uniformity on the productivity of broiler breederhens. Int. J. Poult. Sci. 9:225–230.
Almeida, J. G., S. L. Vieira, R. N. Reis, J. Berres, R. Barros,A. K. Ferreira, and F. V. F. Furtado. 2008. Hatching distributionand embryo mortality of eggs laid by broiler breeders of differentages. Braz. J. Poult. Sci. 10:89–96.
Akil, R., and A. H. Zakaria. 2015. Egg laying characteristics, eggweight, embryo development, hatching weight and post-hatchgrowth in relation to oviposition time of broiler breeders. Anim.Reprod. Sci. 156:103–110.
Chen, Q., Z. Meng, X. Liu, Q. Jin, and R. Su. 2018. Decision variantsfor the automatic determination of optimal feature subset in RF-RFE. Genes 9:309.
Coronel-Reyes, J., I. Ramirez-Morales, E. Fernandez-Blanco,D. Rivero, and A. Pazos. 2018. Determination of egg storage timeat room temperature using a low-cost NIR spectrometer andmachine learning techniques. Comput. Electron. Agric. 145:1–10.
Damaziak, K., M. Koznaka-Lipka, D. Gozdowski, A. Go»ebiowska,and E. Kedziorek. 2021. Effects of broiler breeder strain, age, andeggs preheating profile in single-stage systems on the hatchabilityof eggs and quality of chicks. Animal 15:100057.
Duman, M., and A. Sekero�glu. 2017. Effect of egg weights on hatchingresults, broiler performance and some stress parameters. Braz. J.Poult. Sci. 19:255–262.
Dymond, J., B. Vinyard, A. D. Nicholson, N. A. French, andM. R. Bakst. 2013. Short periods of incubation during egg storageincrease hatchability and chick quality in long-stored broiler eggs.Poult. Sci. 92:2977–2987.
Elibol, O., and J. Brake. 2008. Effect of egg weight and position rela-tive to incubator fan on broiler hatchability and chick quality.Poult. Sci. 87:1913–1918.
Ghawi, R., and J. Pfeffer. 2019. Efficient hyperparameter tuning withgrid search for text categorization using kNN approach with BM25similarity. Open Comput. Sci. 9:160–180.
Grochowska, E., A. Kinal, Z. Sobek, I. Siatkowski, andM. Bednarczyk. 2019. Field study on the factors affecting eggweight loss, early embryonic mortality, hatchability, and chickmortality with the use of classification tree technique. Poult. Sci.98:3626–3636.
Heaton, J. 2017. An empirical analysis of feature engineering for pre-dictive modeling. arXiv 2:1701.
Hossain, T., A. Hossain, A. Roy, M. Azad, and M. Hawlider. 2017.Effect of moisture loss on the hatchability of chicken, duck andquail eggs. J. Environ. Sci. Nat. Resour. 9:105–108.
Iqbal, J., S. H. Khan, N. Mukhtar, T. Ahmed, and R. A. Pasha. 2016.Effects of egg size (weight) and age on hatching performance andchick quality of broiler breeder. J. Appl. Anim. Res. 44:54–64.
Jesuyon, O. M. A., and A. E. Salako. 2013. Effect of seasons on thereproductive performance of Bovan Nera and Isa brown parent-stock chickens in a hot humid environment. Int. J. Anim. Vet.Adv. 5:212–215.
King`ori, A. M. 2011. Review of the factors that influence egg fertilityand hatchability in poultry. Int. J. Poult. Sci. 10:483–492.
Klein, D. R., M. M. do Vale, M. F. R. da Silva, M. F. Kuhn,T. Branco, and M. P. dos Santos. 2020. Data mining as a hatcheryprocess evaluation tool. Sci. Agric. 77:4.

FACTORS AFFECTING HATCHABILITY OF LAYER BREEDERS 11
Liu, H., and M. Cocea. 2017. Semi-random partitioning of data intotraining and test sets in granular computing context. GranularComput. 2:357–386.
Machado, J. P., M. A. Mesquita, M. B. Caf�e, S. D. Assis, S. Veríssimo,R. R. Santos, N. S. M. Leandro, and I. C. S. Ara�ujo. 2020. Effectsof breeder age on embryonic development, hatching results, chickquality, and growing performance of the slow-growing genotype.Poult. Sci. 99:6697–6704.
Narushin, V. G., V. P. Bogatyr, and M. N. Romanov. 2016. Relation-ship between hatchability and non-destructive physical measure-ments of chicken eggs. J. Agric. Sci. 154:359–365.
Nasri, H., H. van den Brand, T. Najar, and M. Bouzouaia. 2020a.Interactions between egg storage duration and breeder age onselected egg quality, hatching results, and chicken quality. Ani-mals 10:1719.
Nasri, H., H. van den Brand, T. Najjar, and M. Bouzouaia. 2020b.Egg storage and breeder age impact on egg quality and embryodevelopment. J. Anim. Physiol. Anim. Nutr. 104:257–268.
Nasri, H., H. van den Brand, T. Najjar, and M. Bouzouaia. 2020c.Interactions between egg storage duration and broiler breeder ageon egg fat content, chicken organ weights, and growth perfor-mance. Poult. Sci. 99:4607–4615.
Osman, H., M. Ghafari, and O. Nierstrasz. 2018. The impact offeature selection on predicting the number of bugs. arXiv1:1807.
Pokhrel, N., E. Ben-Tal Cohen, O. Genin, M. Ruzal,D. Sela-Donenfeld, and Y. Cinnamon. 2018. Effects of storage con-ditions on hatchability, embryonic survival and cytoarchitectural
properties in broiler from young and old flocks. Poult. Sci.97:1426–1440.
Ren, G., T. Lin, Y. Ying, G. Chowdhary, and K. C. Ting. 2020. Agri-cultural robotics research applicable to poultry production. Areview. Comput. Electron. Agric. 169:105216.
Samiullah, S., J. R. Roberts, and K. Chousalkar. 2015. Eggshell colorin brown-egg laying hens- a review. Poult. Sci. 94:2566–2575.
Silva, F., D. Faria, K. Torres, D. F. Filho, A. Coelho, andV. Savino. 2008. Influence of egg pre-storage heating period andstorage length on incubation results. Braz. J. Poult. Sci. 10:17–22.
Tona, K., K. Agbo, B. Kamers, N. Everaert, H. Willemsen,E. Decuypere, and M. Gbeassor. 2010. Comparison of Lohmannwhite and Lohmann brown strains in embryo physiology. Int. J.Poult. Sci. 9:907–910.
Terko, A., E. �Zuni�c, D. Đonko, and A. D�zelihod�zi�c. 2019. Credit scor-ing model implementation in a microfinance context. ICAT 27:1–6.
Van Der Wagt, I., I. C. De Jong, M. A. Mitchell, R. Molenaar, andH. Van Den Brand. 2020. A review on yolk sac utilization in poul-try. Poult. Sci. 99:2162–2175.
Wekesa, J. S., J. Meng, and Y. Luan. 2020. A deep learning model forplant lncRNA-protein interaction prediction with graph attention.Mol. Genet. Genom. 295:1091–1102.
Wolc, A., I. M. S. White, W. G. Hill, and V. E. Olori. 2010. Inheri-tance of hatchability in broiler chickens and its relationship to eggquality traits. Poult. Sci. 89:2334–2340.
Yassin, H., A. G. J. Velthuis, M. Boerjan, J. van Riel, andR. B. M. Huirne. 2008. Field study on broiler eggs hatchability.Poult. Sci. 87:2408–2417.