predicted versus observed peak oxygen consumption after major pulmonary resection
TRANSCRIPT

GEN
ERA
LT
HO
RA
CIC
Predicted Versus Observed Peak OxygenConsumption After Major Pulmonary ResectionAlessandro Brunelli, MD, Cecilia Pompili, MD, Majed Refai, MD, Francesco Xiumè, MD,Michele Salati, MD, and Armando Sabbatini, MD
Division of Thoracic Surgery, Ospedali Riuniti, Ancona, ItalyBackground. The aim of this study was to verify theaccuracy of predicted postoperative peak V̇O2 in predict-ing the actual peak V̇O2 after major pulmonary resection.
Methods. This was a prospective longitudinal series of110 consecutive patients who underwent lobectomy (101patients) or pneumonectomy (9 patients), with completepreoperative and postoperative (3 months) cardiopulmo-nary exercise testing (CPET). Predicted postoperativepeak V̇O2 was calculated by subtracting from the preop-erative peak V̇O2 the contribution of unobstructed pul-monary segments removed during operation. Predictedpostoperative peak V̇O2 and actual postoperative peakV̇O2 were compared by the paired sign test.
Results. The average value of preoperative peak V̇O2
was 16.8 mL/kg/min or 64.1% of predicted. The actualvalue of postoperative peak V̇O was 15.9 mL/kg/min or
264.4% of predicted. The actual postoperative peak V̇O2
Address correspondence to Dr Brunelli, Via S. Margherita 23, Ancona60129, Italy; e-mail: [email protected].
© 2012 by The Society of Thoracic SurgeonsPublished by Elsevier Inc
was higher than the predicted postoperative peak V̇O2
(15.9 versus 13.1 mL/kg/min; p < 0.0001; 64.4% versus50.1%; p < 0.0001). Of the 23 patients with a predictedpostoperative peak V̇O2 less than 10 mL/kg/min, 19 hadan actual postoperative peak V̇O2 greater than 10 mL/kg/min (average value 13.3 mL/kg/min). All 11 patients witha predicted postoperative peak V̇O2 less than 35% ofpredicted had an actual postoperative peak V̇O2 greaterthan 35% of predicted (average value, 55.8%).
Conclusions. The prediction of postoperative peak V̇O2
using the segmental technique was inaccurate. The use ofpredicted postoperative peak V̇O2 for patient selectionmust be cautioned against; future studies are warrantedto refine its estimation.
(Ann Thorac Surg 2012;94:222–5)
© 2012 by The Society of Thoracic SurgeonsPerformance at cardiopulmonary exercise testing(CPET) is regarded as 1 of the most reliable mea-
surements for assessing functional operability beforelung resection. Recent international guidelines have in-dicated that predicted postoperative peak oxygen con-sumption (predicted postoperative peak V̇O2) lower than10 mL/kg/min or 35% of predicted contraindicates majoranatomic pulmonary resection [1].
However, unlike more commonly studied measure-ments such as predicted postoperative forced expiratoryvolume in 1 second (FEV1) or predicted postoperativediffusing capacity of lung for carbon monoxide (DLCO),scant information exists in the literature regarding thecorrelation between postoperative peak V̇O2 and ac-tual postoperative peak V̇O2 [2] to substantiate thisrecommendation.
The aim of this study was to verify the accuracy ofpredicted postoperative peak V̇O2 in predicting the ac-tual peak V̇O2 in a prospective series of patients aftermajor pulmonary resection.
Accepted for publication March 19, 2012.
Presented at the Poster Session of the Forty-eighth Annual Meeting ofThe Society of Thoracic Surgeons, Fort Lauderdale, FL, Jan 28–Feb 1, 2012.
Patients and Methods
This was a prospective longitudinal series of 110 consec-utive patients who underwent lobectomy (101 patients)or pneumonectomy (9 patients) in a single center andwho had complete preoperative (within 2 weeks of oper-ation) and postoperative (3 months after operation) CPET(2010–2011). This study was approved by the local insti-tutional review board, and all patients gave their in-formed consent to participate in the study.
Criteria for inoperability were predicted postoperativeFEV1 less than 30% � predicted postoperative DLCO lessthan 30% � peak V̇O2 less than 10 mL/kg/min [3].
During the same period, an additional 15 patientsunderwent major anatomic lung resections but wereexcluded from the study for several reasons (5 extendedresections including chest wall, 3 postoperative mortali-ties, and 7 patients unable to take the repeated test forcancer recurrence, concomitant chemotherapy, orrefusal).
Patients were operated on by board-certified thoracicsurgeons through a muscle-sparing, nerve-sparing [4]lateral thoracotomy, after which they were extubated inthe operating room and managed in a dedicated thoracicsurgery unit. Admission to the intensive care unit wasoccasionally planned for patients with compromised pre-operative function (ie, peak V̇O2 � 12 mL/kg/min) and
was otherwise reserved for patients in whom severe0003-4975/$36.00http://dx.doi.org/10.1016/j.athoracsur.2012.03.034
223Ann Thorac Surg BRUNELLI ET AL2012;94:222–5 PREDICTED VS OBSERVED POSTOPERATIVE PEAK V̇O2
GEN
ERA
LT
HO
RA
CIC
postoperative complications developed and they neededactive life support after treatment [5].
Postoperative management was standardized and in-cluded chest physiotherapy, early mobilization, physicalrehabilitation, and adequate paravertebral or systemicanalgesic therapy (which was titrated to keep the painvisual analog score less than 4 [on a scale ranging from0–10] during the first 48–72 hours).
For the purpose of this investigation, symptom-limitedCPET was systematically performed in all patients on anelectronically braked cycle ergometer using a ramp-pattern increase in work rate to reach an exercise testduration between 8 and 12 minutes. The exercise test wasstopped when 1 or more of the following criteria werepresent: fatigue, dyspnea, excessive systemic blood pres-sure increase (ie, � 230/130 mm Hg), a greater than 2-mmST depression in at least 2 adjacent leads, or angina). Thepeak V̇O2 was the average V̇O2 during the last 15 secondsof exercise.
Predicted postoperative peak V̇O2 was calculated bysubtracting from the preoperative peak V̇O2 the contri-bution of functioning/unobstructed pulmonary segmentsto be removed during operation (estimated by computedtomography, bronchoscopy, and lung perfusion scan) [1].
Predicted postoperative peak V̇O2 equation: [preoper-ative peak V̇O2/(number of ventilating segments beforethe operation)] � number of ventilating segments afterthe operation.
For instance, in a patient with a preoperative peak V̇O2
of 20 mL/kg/min who is undergoing a right upper lobec-tomy with an obstructed nonventilating posterior seg-ment, the equation would be: [20/(18)] � 16 � 17.8mL/kg/min.
The values of predicted postoperative peak V̇O2 andactual postoperative peak V̇O2 were compared by thepaired sign test.
The precision of the predicted postoperative peak V̇O2
at 3 months was evaluated by plotting the cumulativepredicted postoperative values against the observed val-
Table 1. Characteristics of Patients Enrolled in Study
Variable No.
Age (y) 65.3 (10.0)Male sex (n,%) 88 (80%)BMI (kg/m2) 26.3 (3.9)FEV1% 85.7 (17.6)DLCO% 82.9 (20.1)FEV1-FVC ratio 0.7 (0.1)CAD (n,%) 12 (11%)Induction chemotherapy (n,%) 16 (15%)Predicted postoperative FEV1% 66.7 (14.5)Predicted postoperative DLCO% 64.6 (16.8)
Results are expressed as means (standard deviations) unless otherwisespecified.
BMI � body mass index; CAD � coronary artery disease; DLCO �
diffusing capacity of lung for carbon monoxide; FEV1 � forced expi-ratory volume in 1 second; FVC � forced vital capacity.ues of peak V̇O2, with the patients ordered by groups ofincreasing predicted postoperative peak V̇O2.
Statistical analysis was performed using Stata 10 sta-tistical software (StataCorp LP, State College, PA). Alltests were 2-tailed with a significance level of 0.05.
Results
The characteristics of the patients included in this studyare shown in Table 1.
The average value of preoperative peak V̇O2 was 16.8mL/kg/min or 64.1% of predicted. The actual value ofpostoperative peak V̇O2 was 15.9 mL/kg/min or 64.4% ofpredicted. The actual postoperative peak V̇O2 was higherthan predicted postoperative peak V̇O2 (15.9 versus 13.1mL/kg/min; p � 0.0001; 64.4% versus 50.1%; p � 0.0001).This occurred both after lobectomy (16 versus 13.5 mL/kg/min or 65.2% versus 51.5%, p � 0.0001) and pneumo-nectomy (15.5 versus 9.5 mL/kg/min or 59.7% versus36.9%; p � 0.004). Of the 23 patients with a predictedpostoperative peak V̇O2 less than 10 mL/kg/min, 19 (83%)had an actual postoperative peak V̇O2 greater than 10mL/kg/min (average value 13.3 mL/kg/min). All 11 pa-tients with a predicted postoperative peak V̇O2 less than35% of predicted had an actual postoperative peak V̇O2
greater than 35% of predicted (average value 55.8%).The correlation coefficient between predicted postop-
erative peak V̇O2 and actual postoperative peak V̇O2 was0.61 (0.65 for lobectomy and 0.1 for pneumonectomy).
In patients who underwent lobectomy, the correlationbetween predicted postoperative peak V̇O2 and actualpeak V̇O2 was 0.67 in elderly patients, 0.62 in patientswith FEV1 less than 80%, and 0.58 in those with DLCOless than 80%.
In this series the correlation coefficient between pre-dicted postoperative FEV1 and actual postoperative FEV1
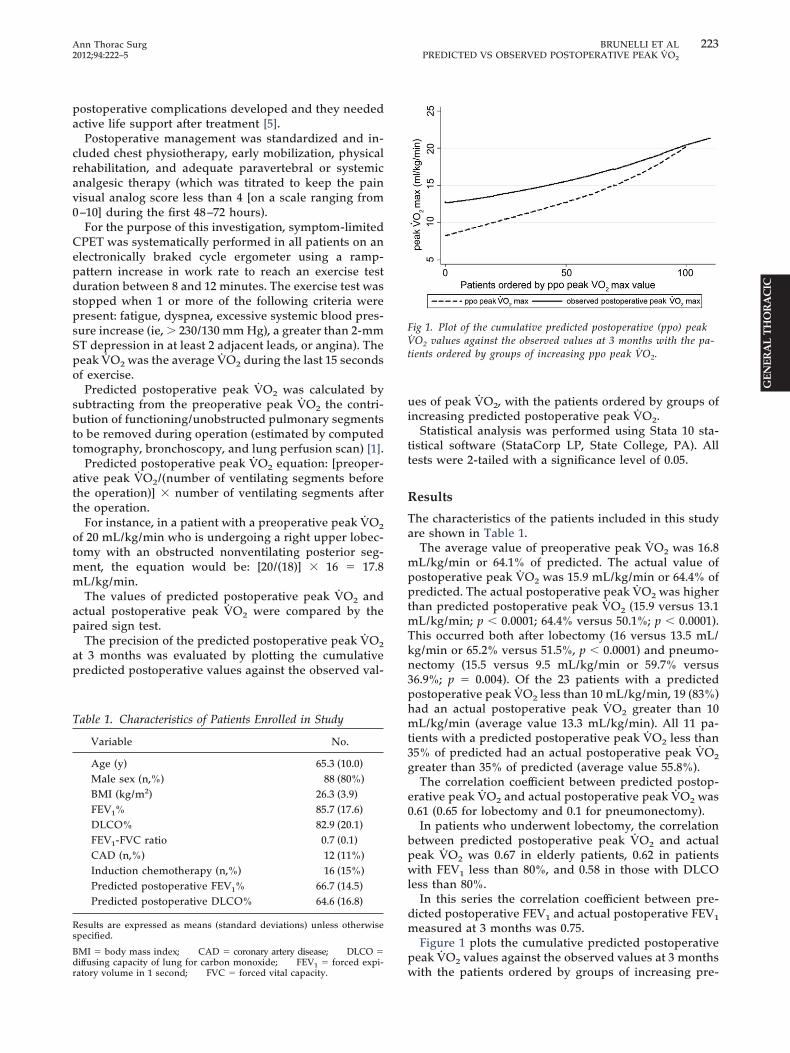
measured at 3 months was 0.75.Figure 1 plots the cumulative predicted postoperative
peak V̇O2 values against the observed values at 3 months
Fig 1. Plot of the cumulative predicted postoperative (ppo) peakV̇O2 values against the observed values at 3 months with the pa-tients ordered by groups of increasing ppo peak V̇O2.
with the patients ordered by groups of increasing pre-

224 BRUNELLI ET AL Ann Thorac SurgPREDICTED VS OBSERVED POSTOPERATIVE PEAK V̇O2 2012;94:222–5
GEN
ERA
LT
HO
RA
CIC
dicted postoperative peak V̇O2. The precision of pre-dicted postoperative peak V̇O2 was lower at lower valuesof predicted postoperative peak V̇O2 (observed valueshigher than predicted), whereas the observed peak V̇O2
was constantly above predicted for every level of pre-dicted postoperative peak V̇O2.
Of the 23 patients with predicted postoperative peakV̇O2 less than 10mL/kg/min, 17 had an uneventful post-operative course and 6 (26%) had cardiopulmonary com-plications (only 1 of these patients had an actual postop-erative peak V̇O2 � 10 mL/kg/min). Of the 3 patients whodied postoperatively, 2 had a predicted postoperativepeak V̇O2 less than 10 mL/kg/min.
Comment
The use of predicted postoperative peak V̇O2 has beenpreviously recommended for stratifying surgical risk. Avalue less than 10 mL/kg/min or 35% of predicted hasbeen associated with high mortality rates [2]. Recentfunctional guidelines have included this measurement intheir algorithm [1].
Predicted postoperative peak V̇O2 is calculated usingthe same method most commonly used for estimatingpredicted postoperative FEV1 or predicted postoperativeDLCO [1]. However there is scant information about theaccuracy of this calculation.
Indeed peak V̇O2 reflects not only the pulmonaryfunction but also the status of other systems (eg, cardio-vascular, neuromuscular). Therefore it appears some-what simplistic to calculate the predicted postoperativepeak V̇O2 by subtracting the number of pulmonarysegments removed during operation (similar to what isdone with pulmonary measurements).
In fact, previous investigations have shown that ergo-metric measurements (in particular peak V̇O2) display amore complete recovery after operation compared withFEV1 [6], indicating that a multisystem compensatorymechanism may play a role in the postoperative phase.
The objective of this study was to assess the agreementbetween postoperative peak V̇O2 measured 3 monthsafter operation and predicted peak V̇O2 calculated ac-cording to the segmental technique.
We found that the average loss in aerobic capacity 3months after operation was 5%. These data are somewhatlower than those previously reported [2]. Differences inthe case mix may explain this discrepancy. Most impor-tantly, in the current study the postoperative actual peakV̇O2 was 21% higher than the predicted one (19% higherafter lobectomy and 63% higher after pneumonectomy).
Of the 23 patients with a predicted postoperative peakV̇O2 less than 10 mL/kg/min (a cutoff regarded as pro-hibitive by recent functional guidelines), 83% had anactual postoperative peak V̇O2 greater than this level,and 74% of them had an uneventful postoperative course.Figure 1 shows that the imprecision of predicted postop-erative peak V̇O2 was particularly evident at its lowervalues, rendering this index less accurate in those pa-tients in whom it would be most needed. We now use
this plot in our clinical practice to correct the estima-tion of postoperative peak V̇O2. For instance, a patientwith a predicted postoperative peak V̇O2 of 10 mL/kg/min would likely have an observed peak V̇O2 of about14 mL/kg/min, whereas a patient with a predictedpostoperative peak V̇O2 of 15 mL/kg/min would likelyhave an observed postoperative peak V̇O2 of about 16mL/kg/min.
From the data of this series it appears that the segmen-tal technique recommended for calculating predictedpostoperative peak V̇O2 is not sufficiently reliable to beused for risk stratification and patient selection.
This study may have potential limitations. The calcu-lation of postoperative peak V̇O2 was performed usingthe segmental technique (for lobectomy) and perfusionscan (for pneumonectomy) as recommended by recentguidelines [1]. This is the method we routinely use in ourclinical practice to estimate split lung function for riskstratification. Other methods may be more accurate toestimate the amount of functional lung parenchymaremoved during operation (ie, quantitative computedtomography, magnetic resonance imaging, or single-photon emission computed tomography). However itseems unlikely that these methods would overcome theconceptual limitation of estimating a multisystem param-eter (peak V̇O2) by taking into account only 1 of themultiple factors contributing to its value.
We chose to reevaluate patients 3 months afteroperation with the purpose of minimizing patientdropout. Indeed, concern about the dropout rate hasbeen reported for longer functional follow-up times[7]. However generalization of our results for differenttimes of assessment is not warranted and needs inde-pendent confirmation.
Although the prediction of postoperative peak V̇O2
appeared imprecise, the cutoff value of 10 mL/kg/minstill represents a high-risk threshold. The mortality ratein this group of patients was in fact 8.7%.
In conclusion, we found that the prediction of postop-erative peak V̇O2 using the segmental technique waslargely inaccurate. Peak V̇O2 depends on multiple factors(eg, respiratory, cardiovascular, musculoskeletal, neuro-logic) and as a consequence, changes that result afterpulmonary resection cannot be estimated by the simplesubtraction of the relative contribution of the functioningpulmonary segments. The use of predicted postoperativepeak V̇O2 for patient selection must therefore be cau-tioned against; future studies are warranted to refine itsestimation.
References
1. Brunelli A, Charloux A, Bolliger CT, et al; European Respira-tory Society and European Society of Thoracic Surgeons jointtask force on fitness for radical therapy. ERS/ESTS clinicalguidelines on fitness for radical therapy in lung cancerpatients (surgery and chemo-radiotherapy). Eur Respir J2009;34:17–41.
2. Bolliger CT, Wyser C, Roser H, Soler M, Perruchoud AP.Lung scanning and exercise testing for the prediction ofpostoperative performance in lung resection candidates at
increased risk for complications. Chest 1995:108:341–8.
225Ann Thorac Surg BRUNELLI ET AL2012;94:222–5 PREDICTED VS OBSERVED POSTOPERATIVE PEAK V̇O2
3. Brunelli A, Salati M. Preoperative evaluation of lung cancer:predicting the impact of surgery on physiology and quality oflife. Curr Opin Pulm Med 2008;14:275–-81.
4. Cerfolio RJ, Bryant AS, Maniscalco LM. A nondivided inter-costal muscle flap further reduces pain of thoracotomy: aprospective randomized trial. Ann Thorac Surg 2008;85:1901–6.
5. Zimmerman JE, Wagner DP, Knaus WA, Williams JF, Kola-kowski D, Draper EA. The use of risk predictions to identify
should be used with caution; moreover, that if kit is
© 2012 by The Society of Thoracic SurgeonsPublished by Elsevier Inc
candidates for intermediate care units. Implications forintensive care utilization and cost. Chest 1995;108:490–9.
6. Brunelli A, Xiumé F, Refai M, et al. Evaluation of expiratoryvolume, diffusion capacity, and exercise tolerance followingmajor lung resection: a prospective follow-up analysis. Chest2007;131:141–7.
7. Bolliger CT, Jordan P, Solèr M, et al. Pulmonary function and
exercise capacity after lung resection. Eur Respir J 1996;9:415–21.INVITED COMMENTARY
GEN
ERA
LT
HO
RA
CIC
The article by Brunelli and colleagues [1] is an excellentexample of how a committed investigator can organizeand complete a prospective clinical trial to address acommon clinical problem. The use of preoperative peakoxygen consumption (VO2 max) has been used as a sur-rogate to determine operability for patients undergoingpulmonary resection. In this study the authors examinedthe accuracy of a predicted postoperative VO2max on theactual peak VO2max after pulmonary resection. Histori-cally, a preoperative peak VO2 max below 10mL/kg/minhas been thought to be a good indicator of increased riskof morbidity and mortality after a pulmonary resection.Assessment of operability for pulmonary resection ismost commonly performed by the use of predicted post-operative values for forced expiratory volume in 1 second(FEV1) and diffusing capacity of the lungs for carbonmonoxide (DLCO). Routine use of cardiopulmonary test-ing for patients being considered for pulmonary resec-tion is not uniformly performed and is often reserved forpatients who have a lower than predicted postoperativeFEV1 or DLCO but who clinically appear “better” thantheir pulmonary function studies suggest.
The results of this study suggest that the prediction ofpostoperative peak VO2 max using the segmental tech-nique for planned pulmonary resection is largely inaccu-rate. Accordingly, the authors suggest that ppoPeakVO2 max for patient selection for pulmonary resection
used in isolation it may actually prevent patients fromundergoing resection. Although the majority of thepatients in this study underwent pulmonary lobec-tomy, there were 9 patients who underwent a plannedpneumonectomy. In this specific group of patients, theaccuracy of ppoPeak VO2 max was extraordinarily poor.It is unclear whether the authors’ results regarding theinaccuracies of ppoPeak VO2 max would remain ifthe pneumonectomy patients were excluded from theanalysis. Notwithstanding this point, the authors are tobe congratulated for a study that highlights the imper-fect nature of assessing preoperative risk, particularlyas it relates to the predictive value of preoperativecardiopulmonary physiologic measurements.
David R. Jones, MD
Division of Thoracic and Cardiovascular SurgeryUniversity of VirginiaPO Box 800679Charlottesville, VA 22908-0679e-mail: [email protected]
Reference
1. Brunelli A, Pompili C, Refai M, Xiumè F, Salati M, SabbatiniA. Predicted versus observed peak oxygen consumption after
major pulmonary resection. Ann Thorac Surg 2012;94:222–5.0003-4975/$36.00http://dx.doi.org/10.1016/j.athoracsur.2012.04.032